Detection and Monitoring of Tunneling-Induced Riverbed Deformation Using GPS and BeiDou: A Case Study


Abstract
1. Introduction
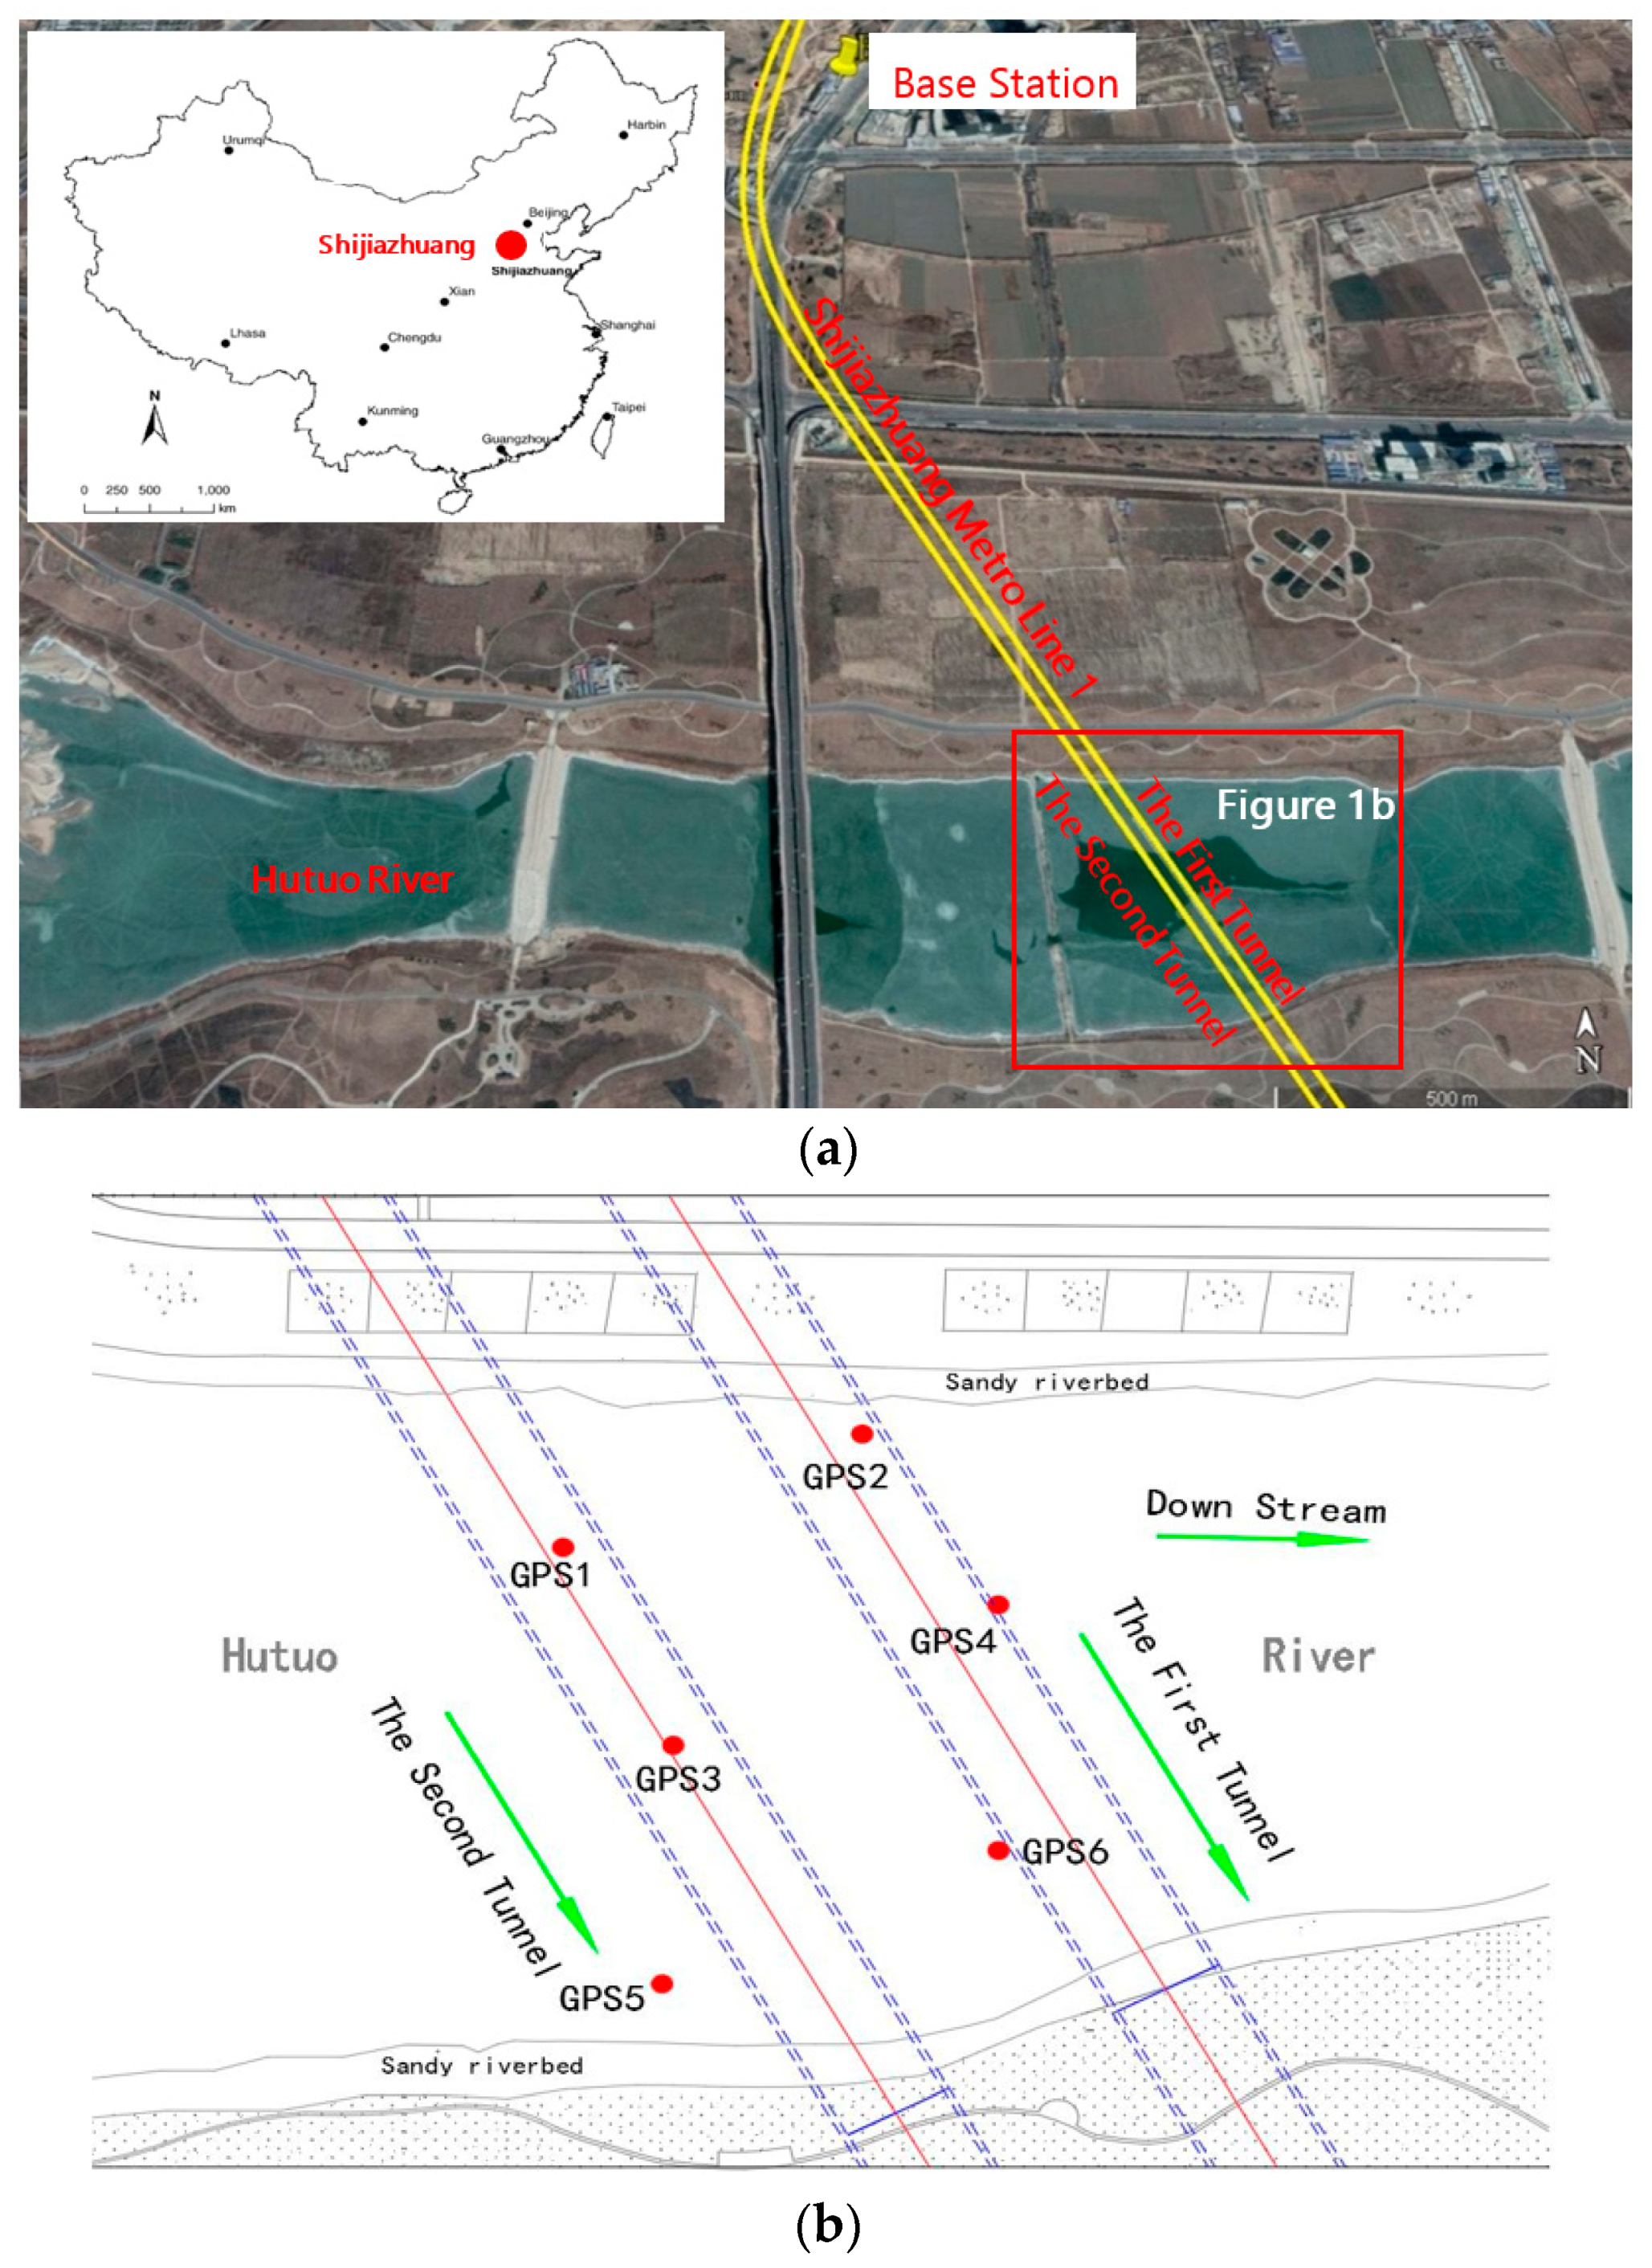
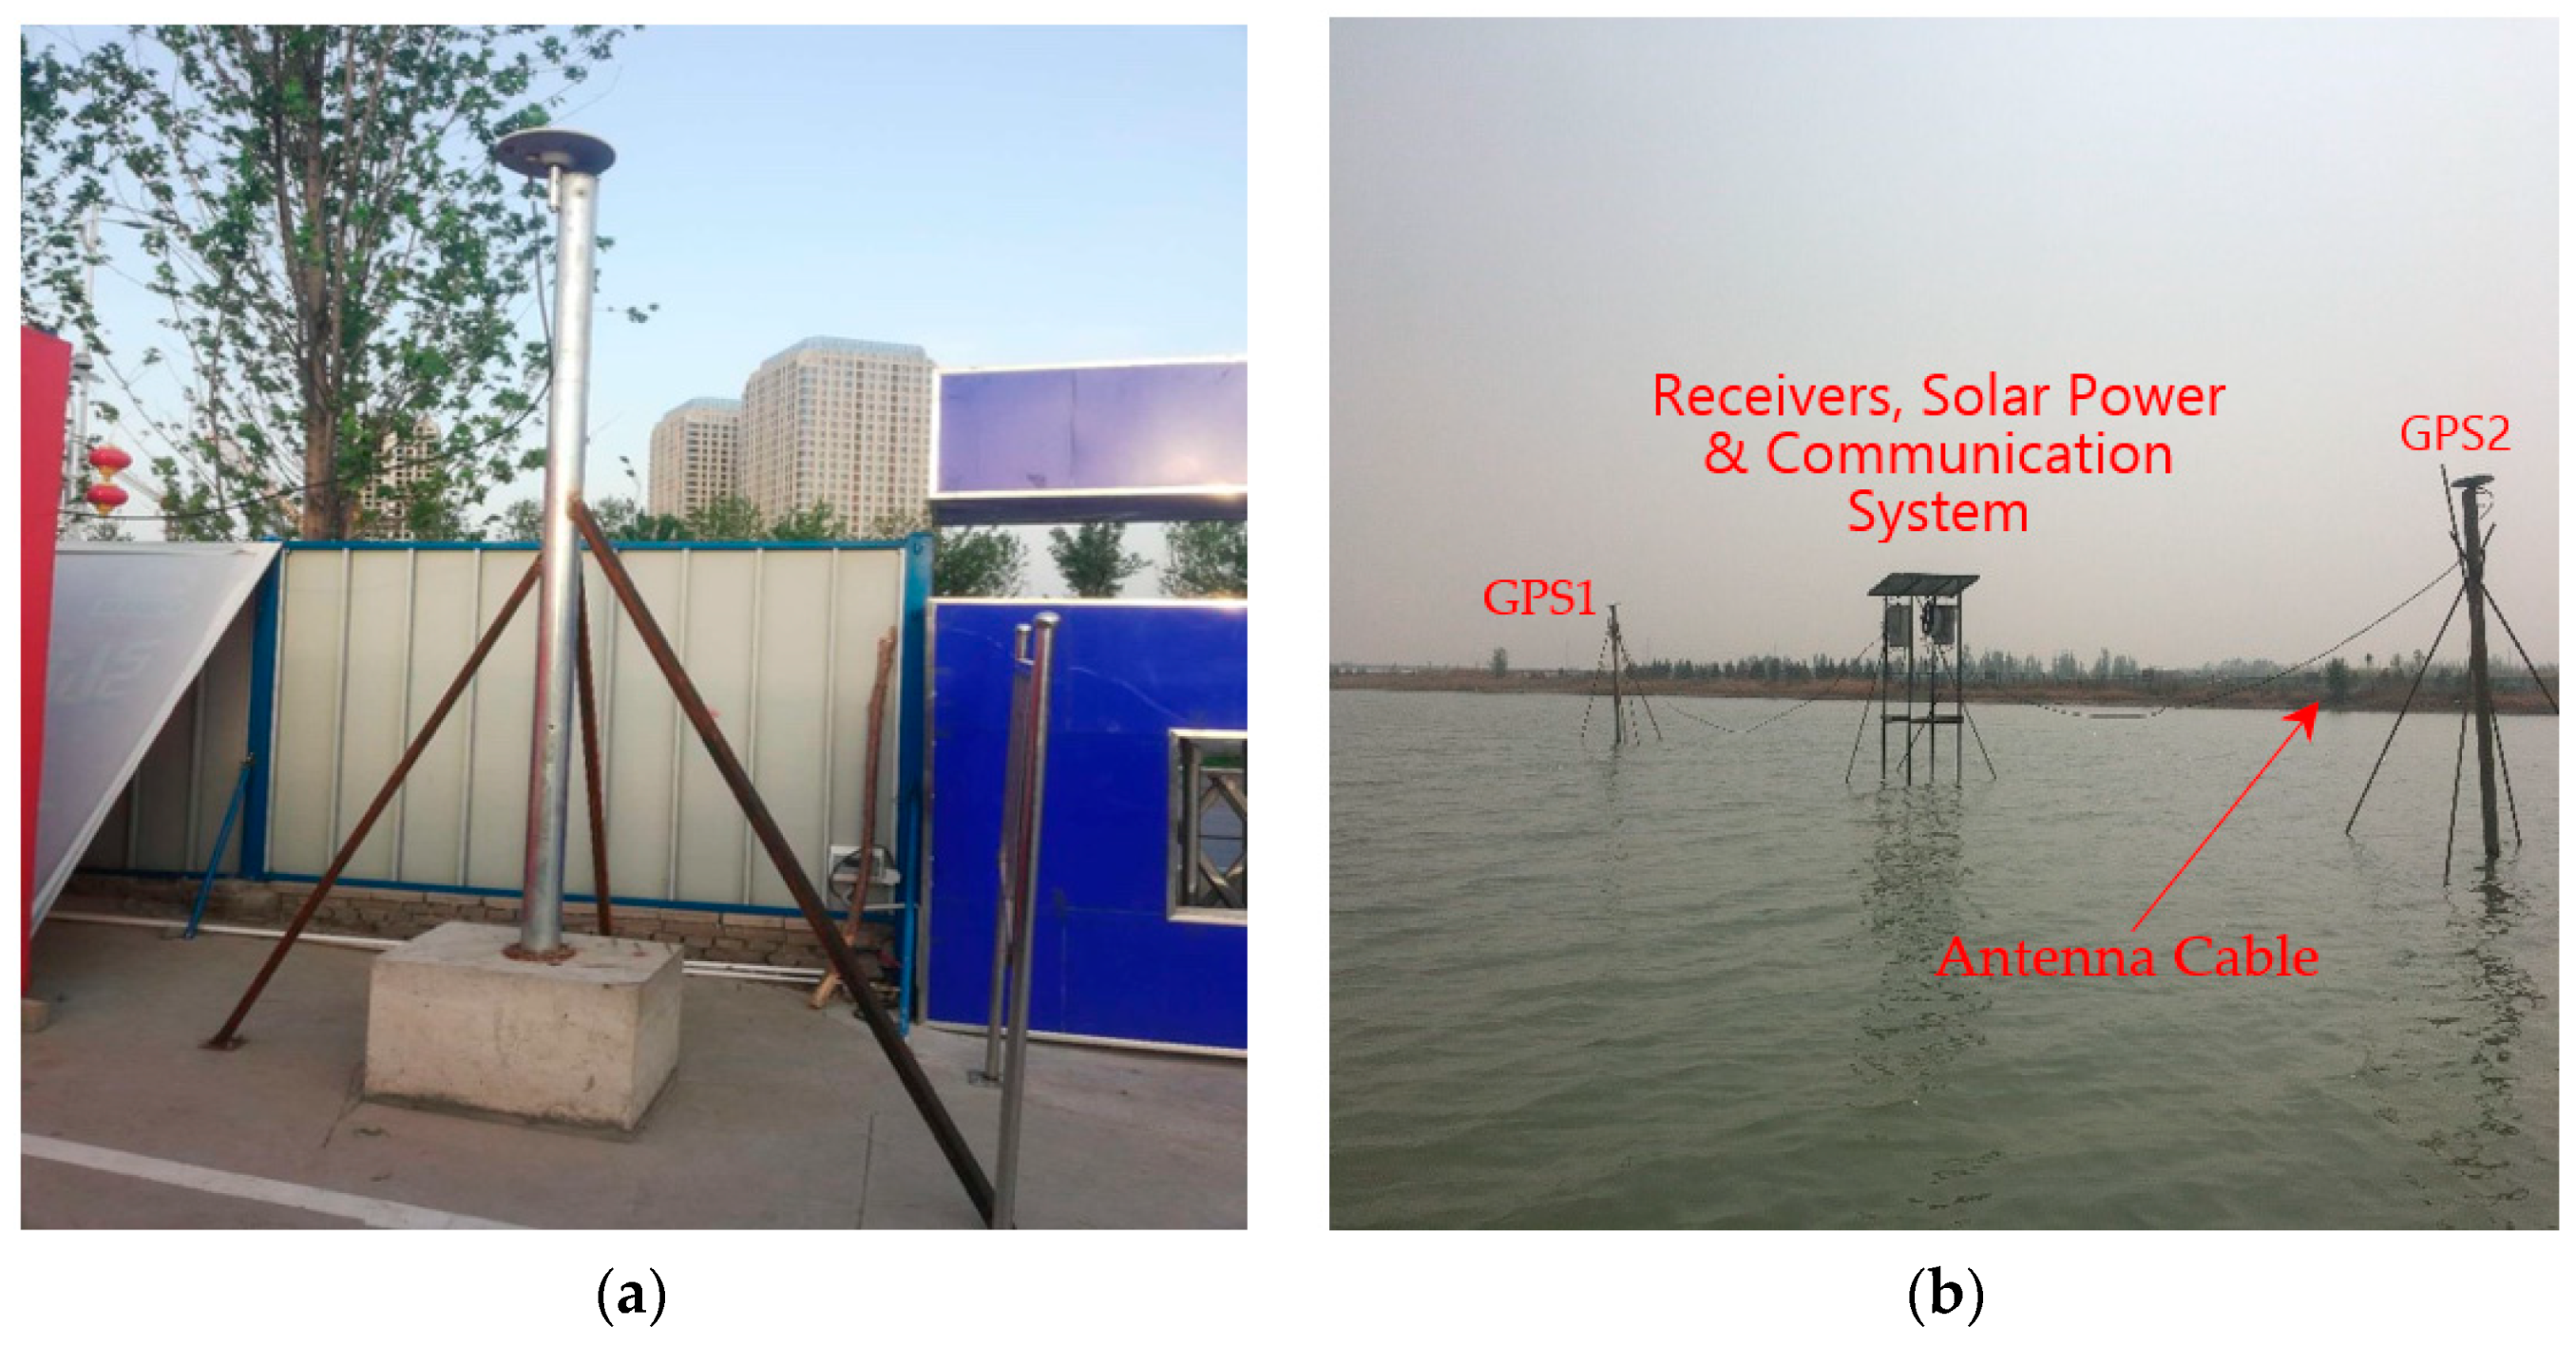
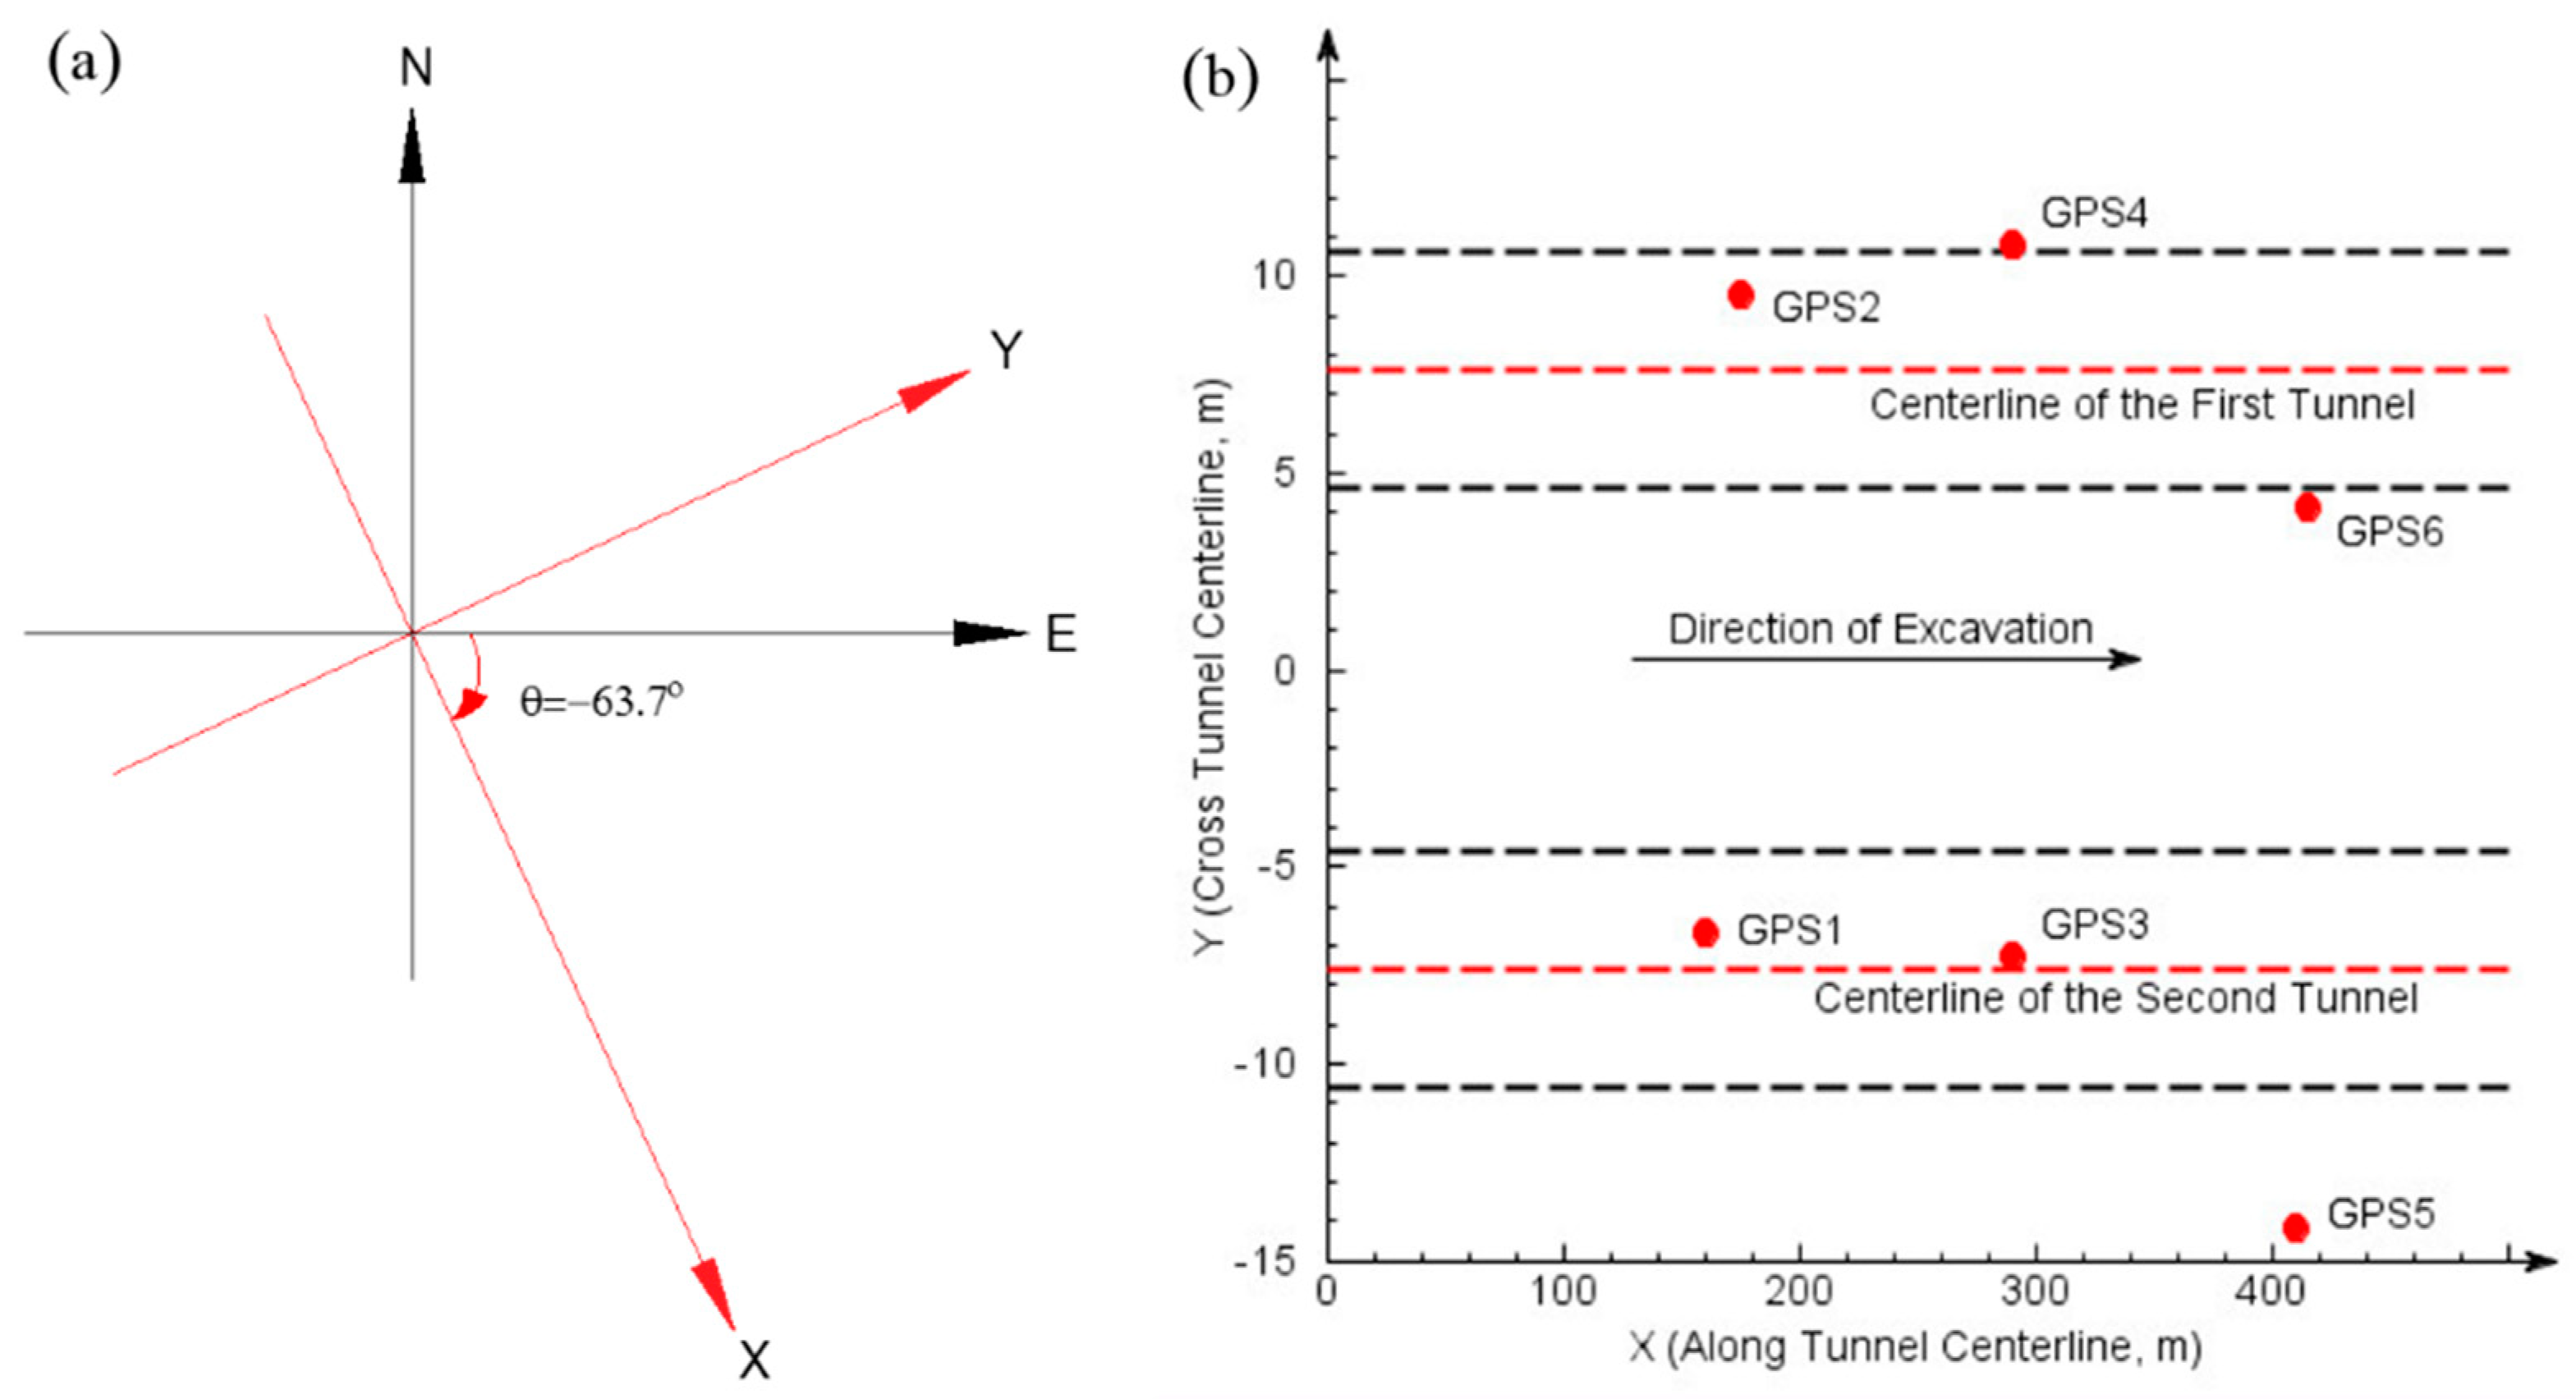
2. Project Overview
3. Methods
3.1. GPS Data Processing
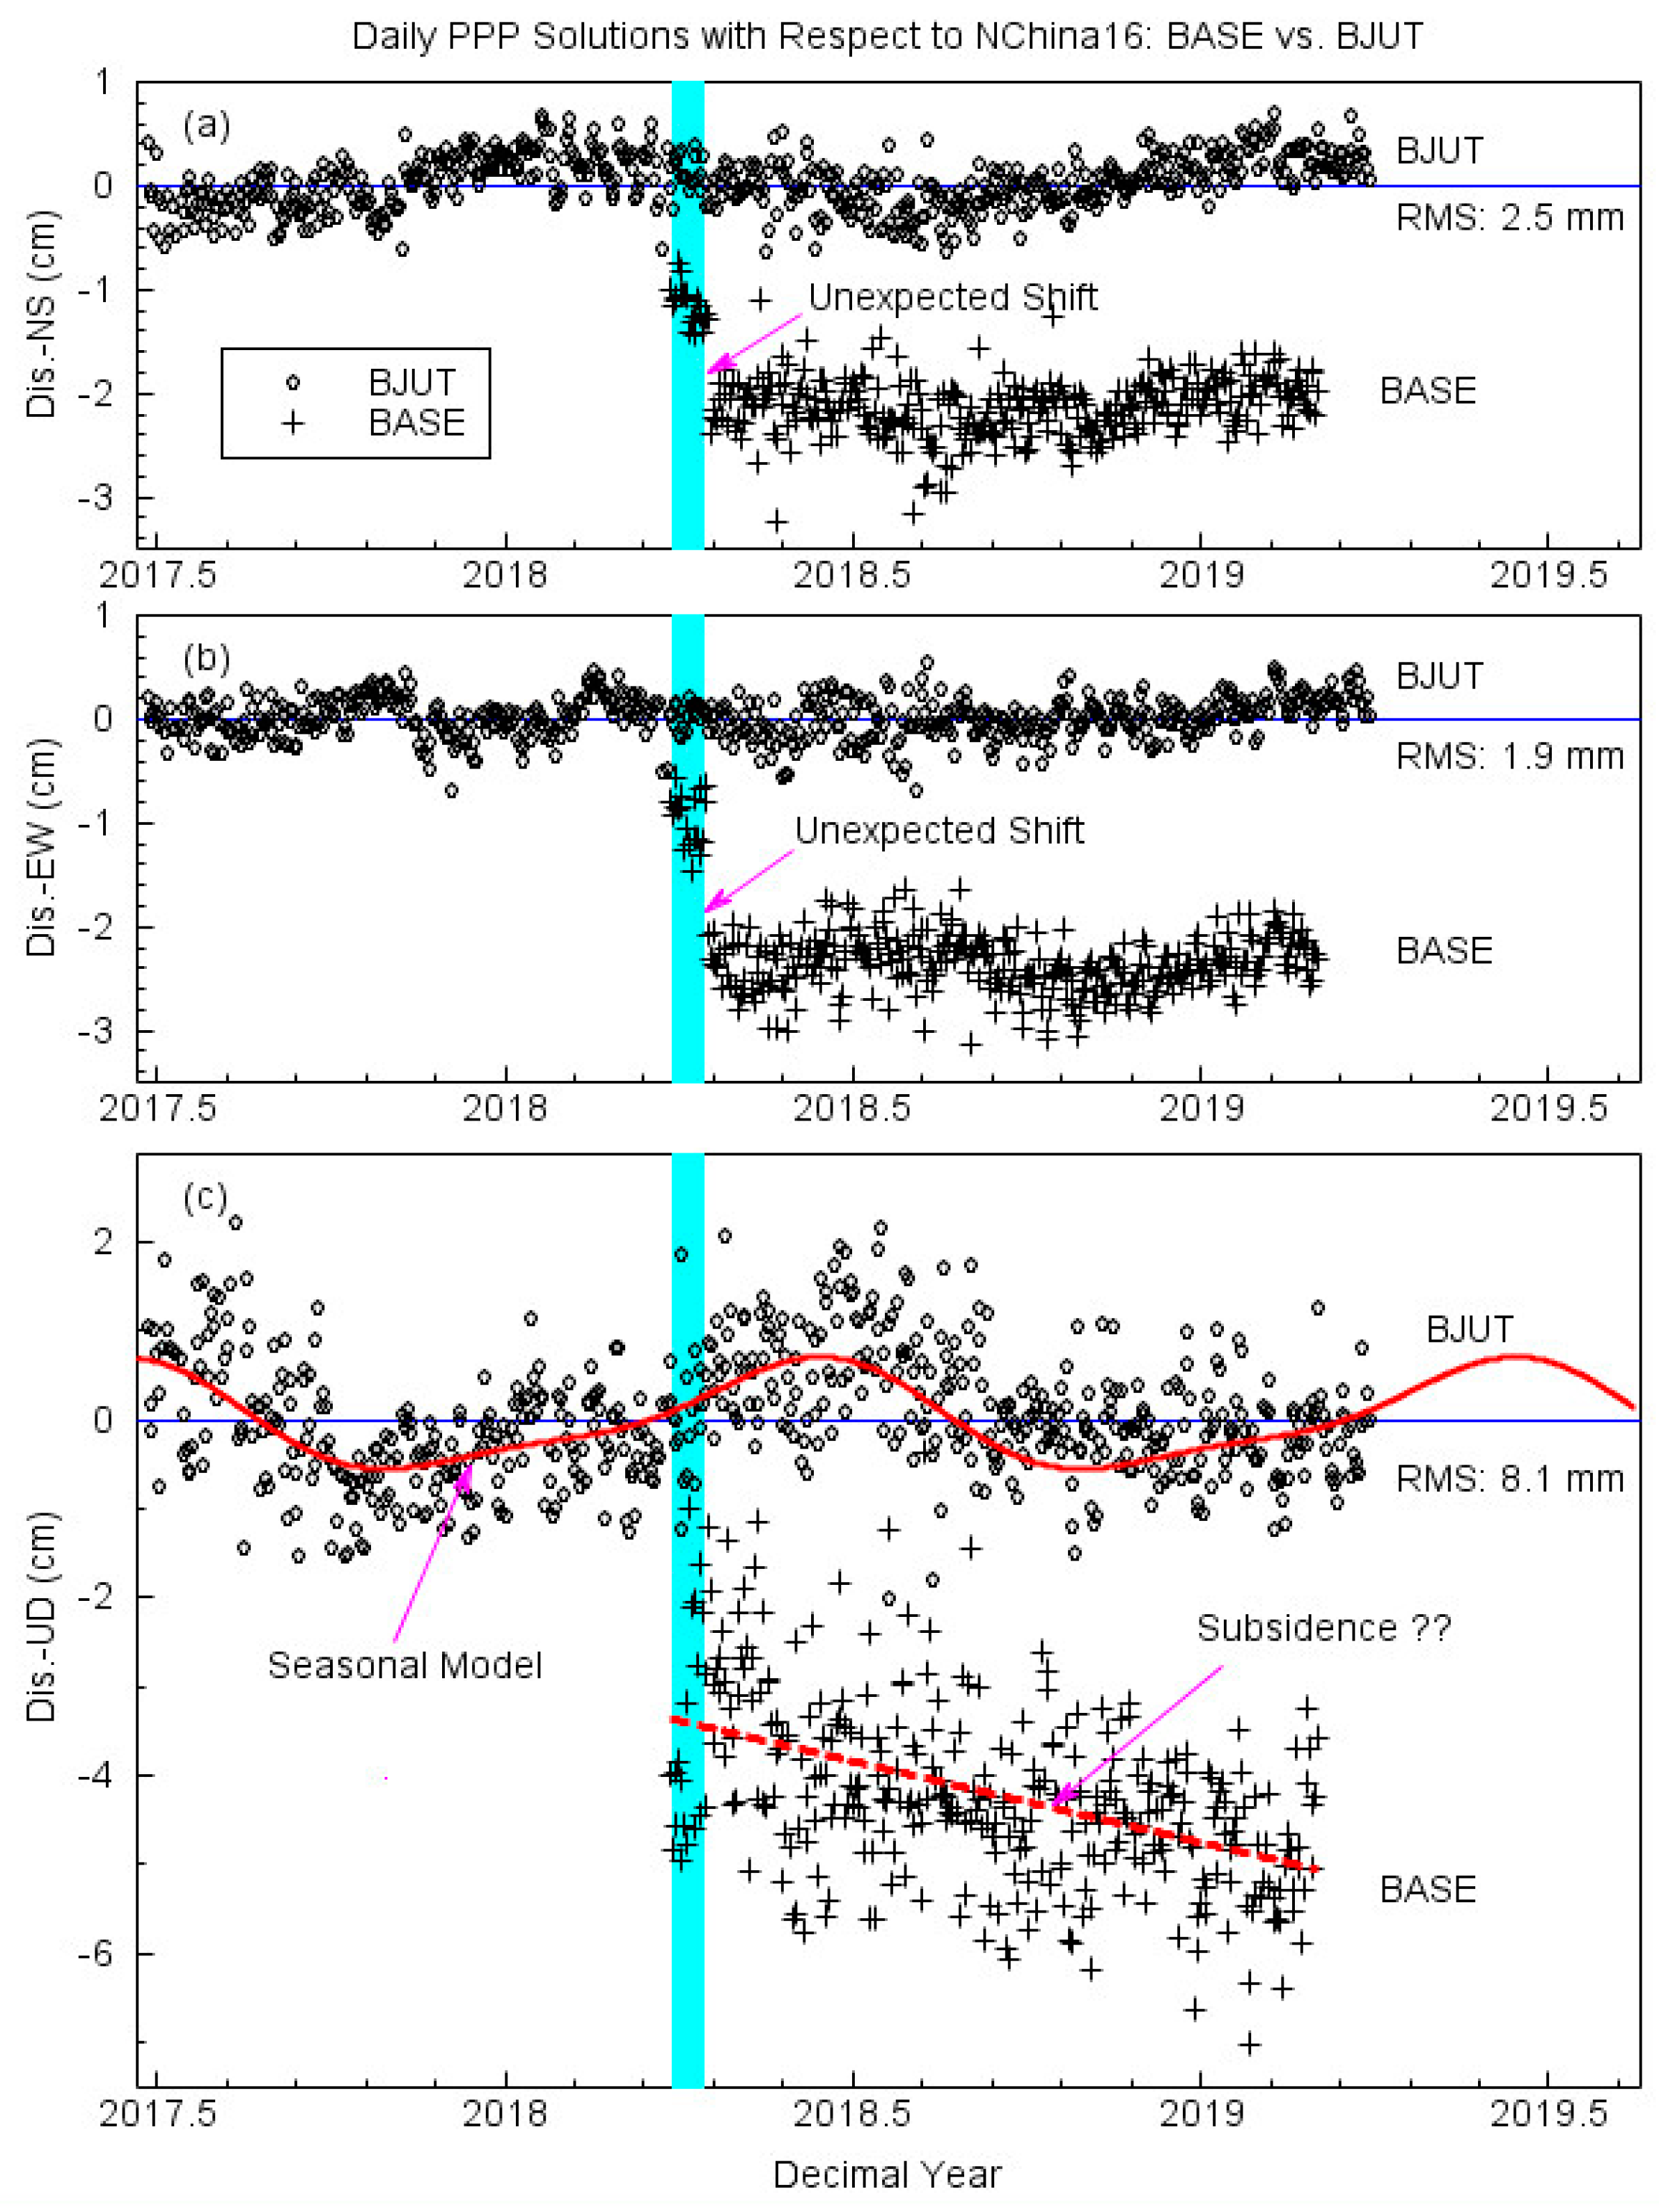
3.2. Monitoring the Stability of the Base Station
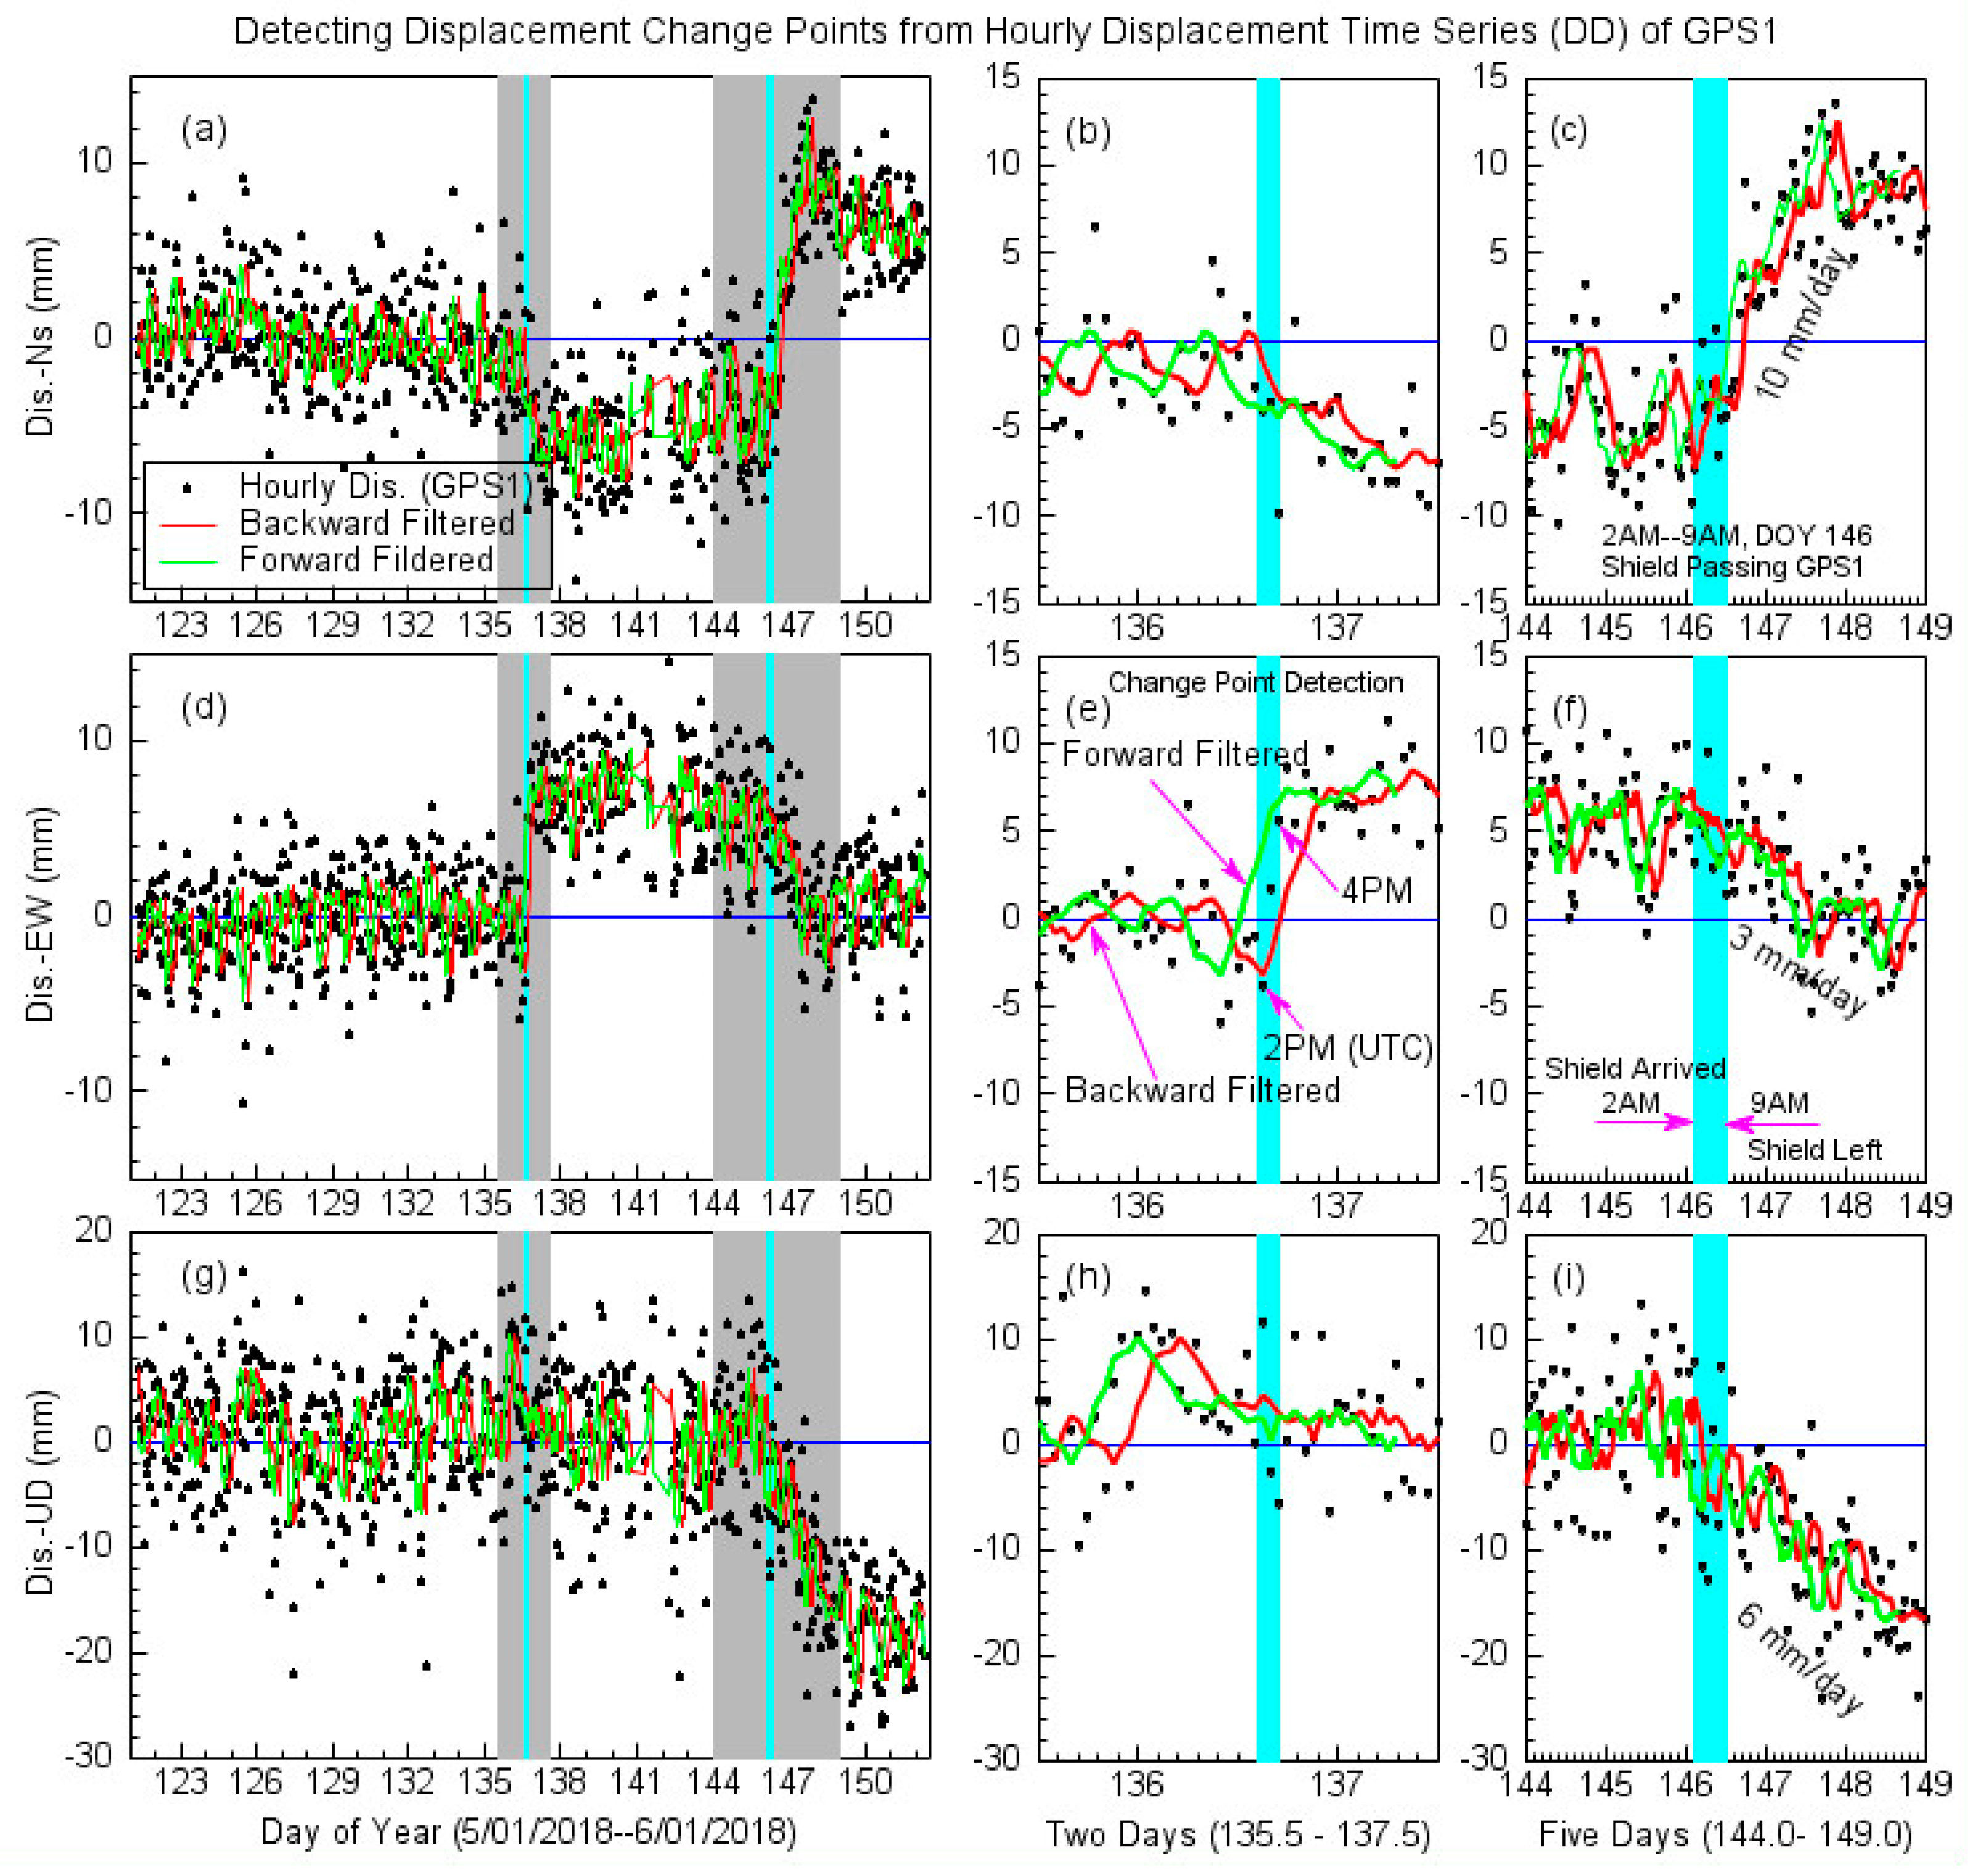
3.3. Change Point Detection
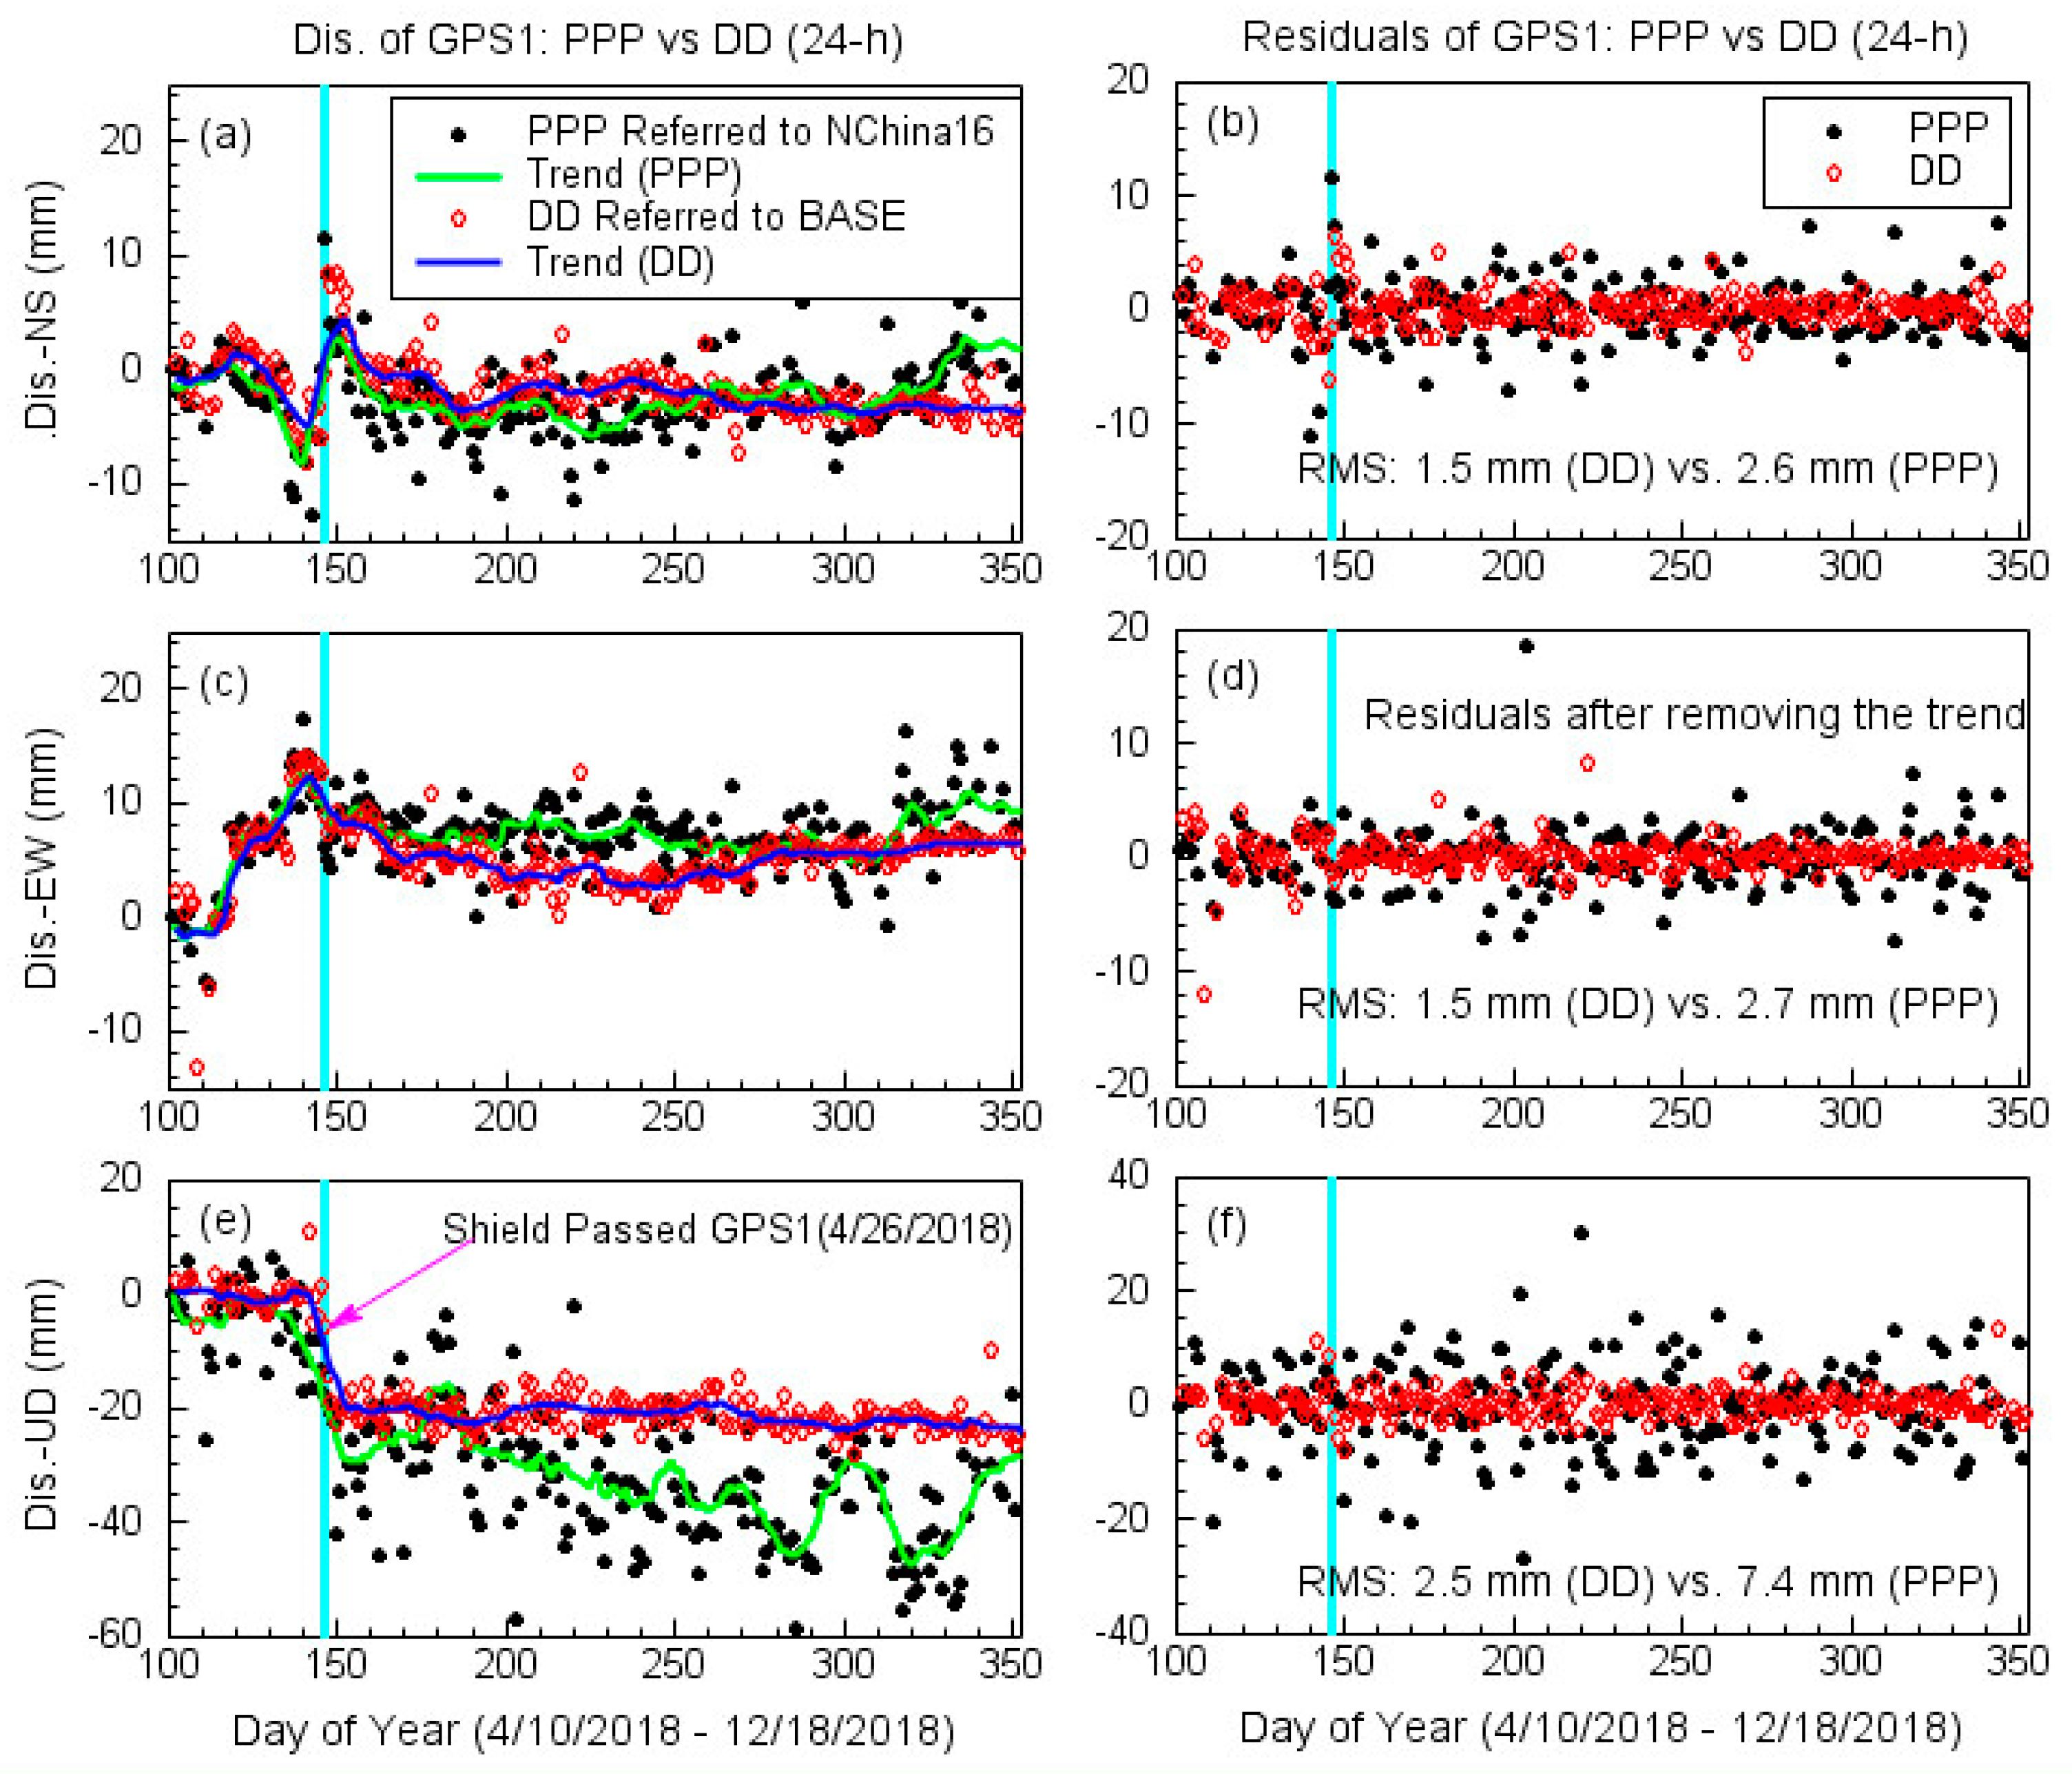
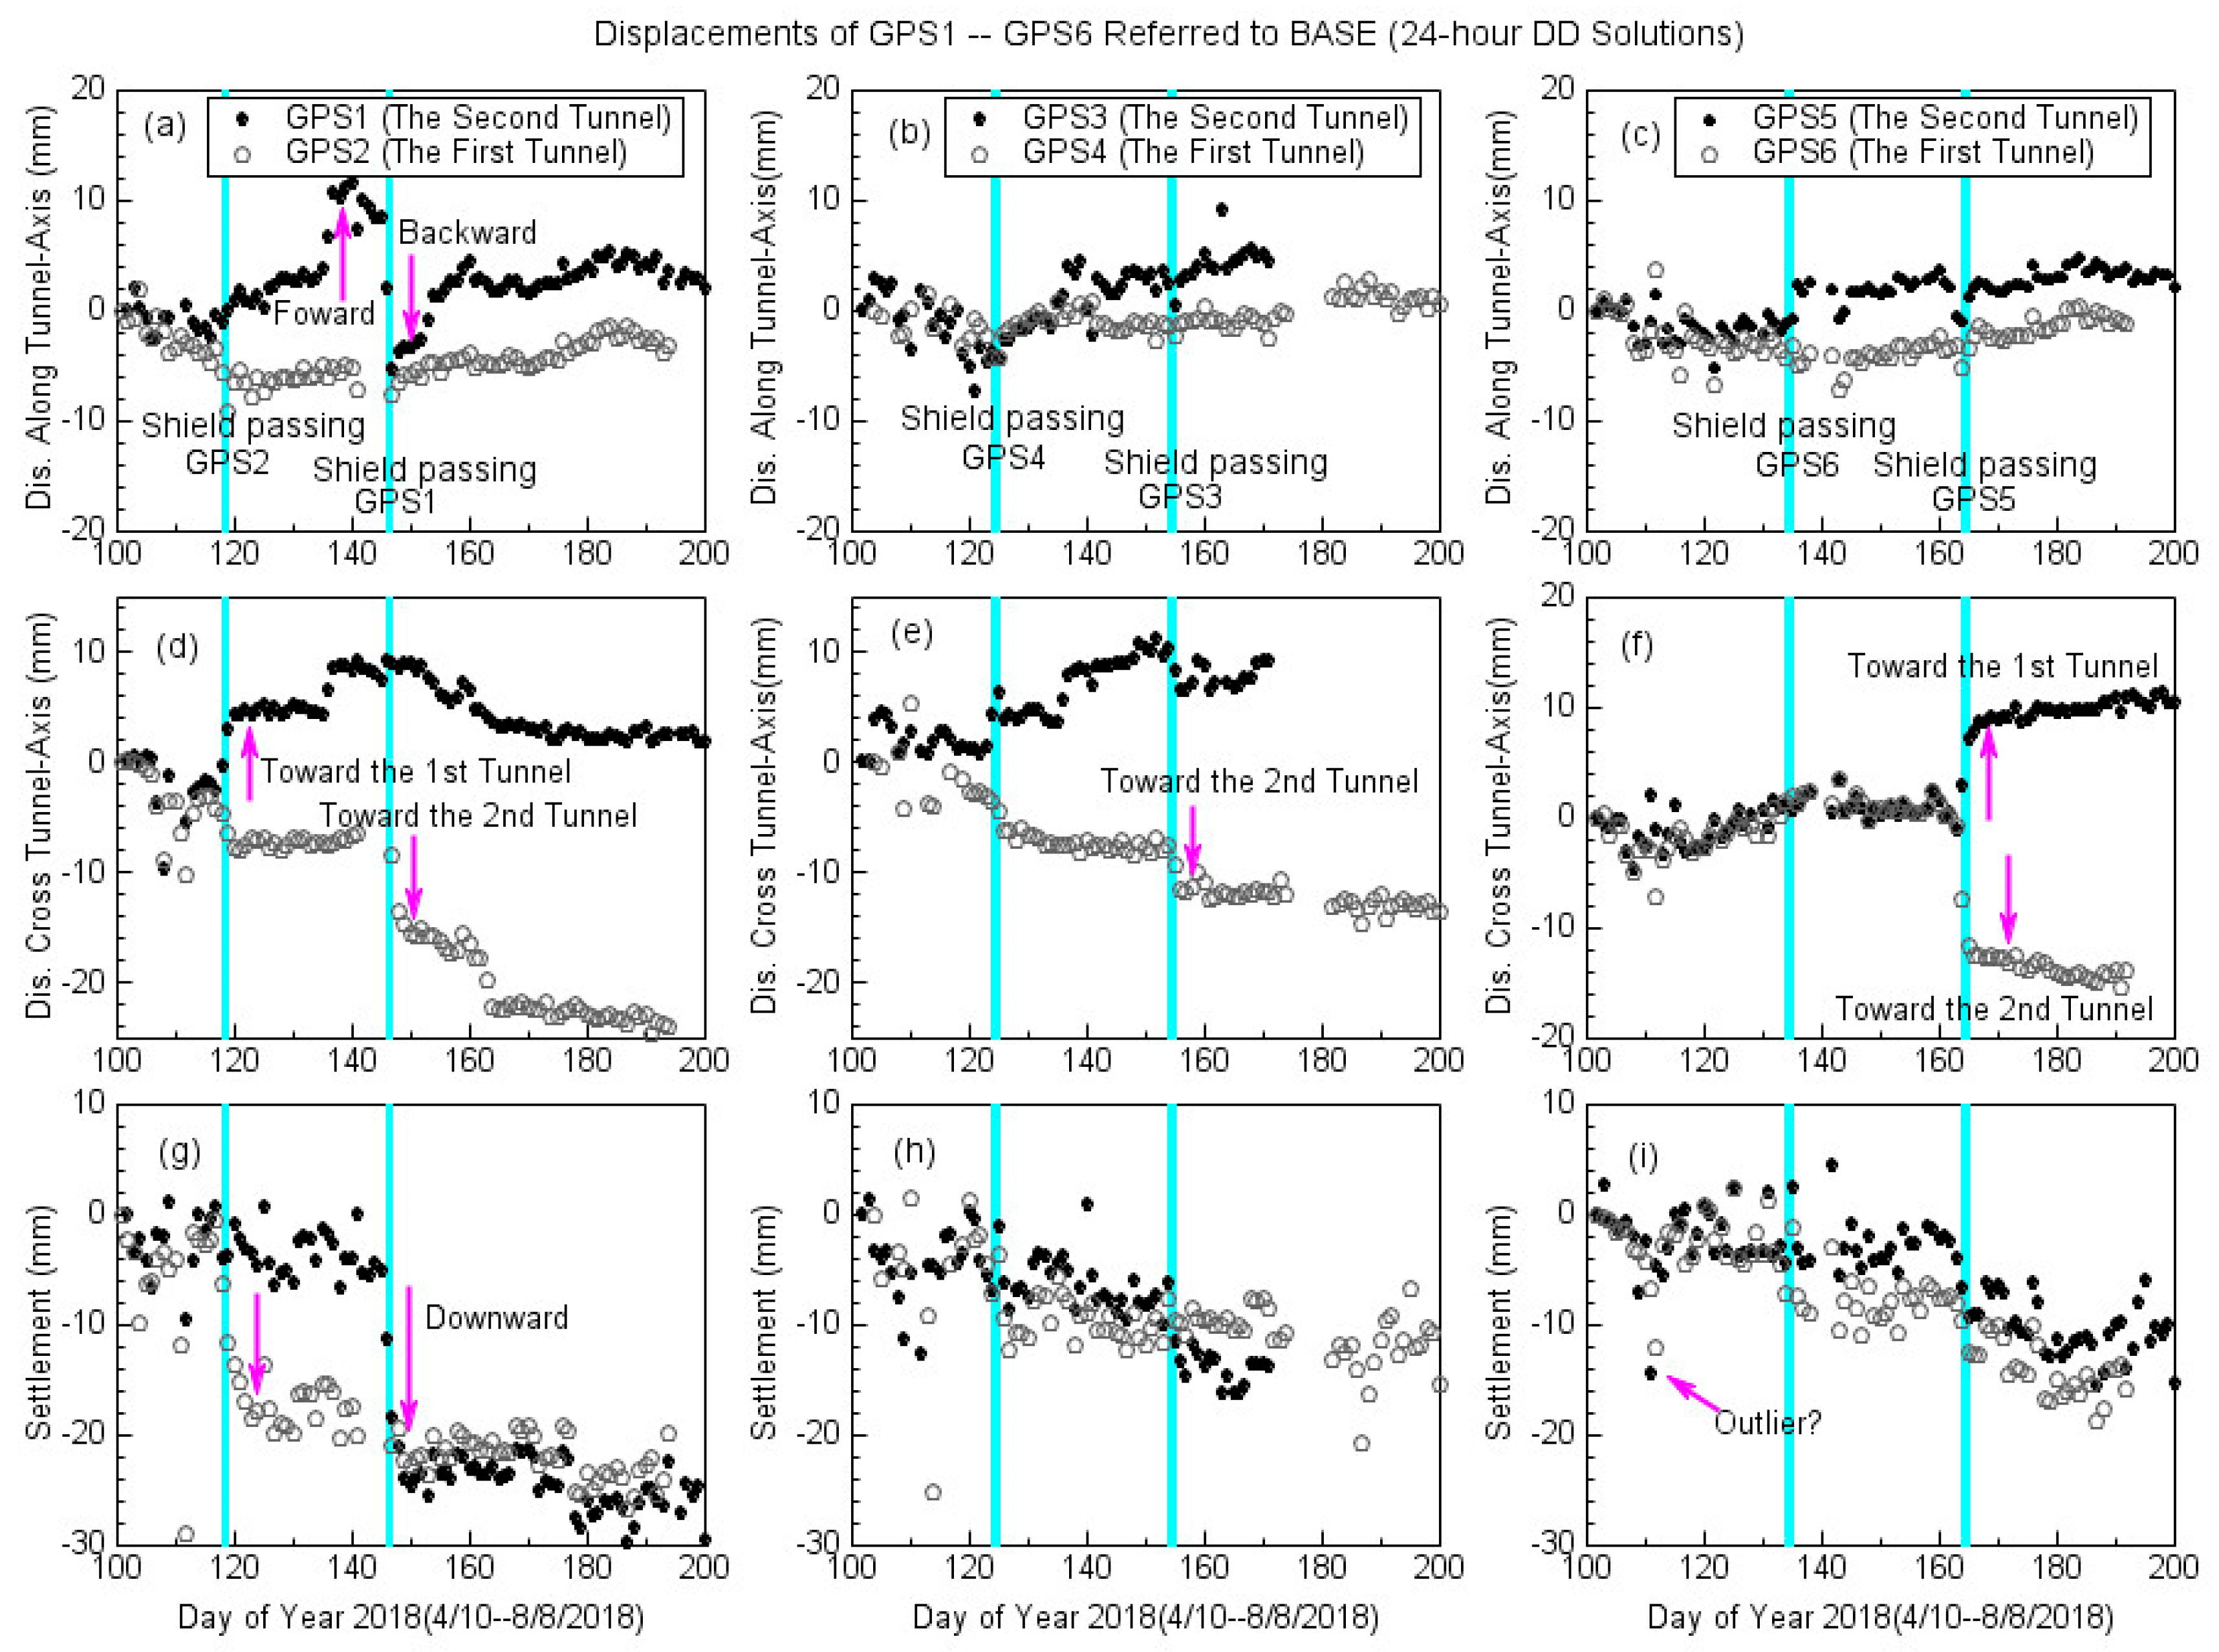
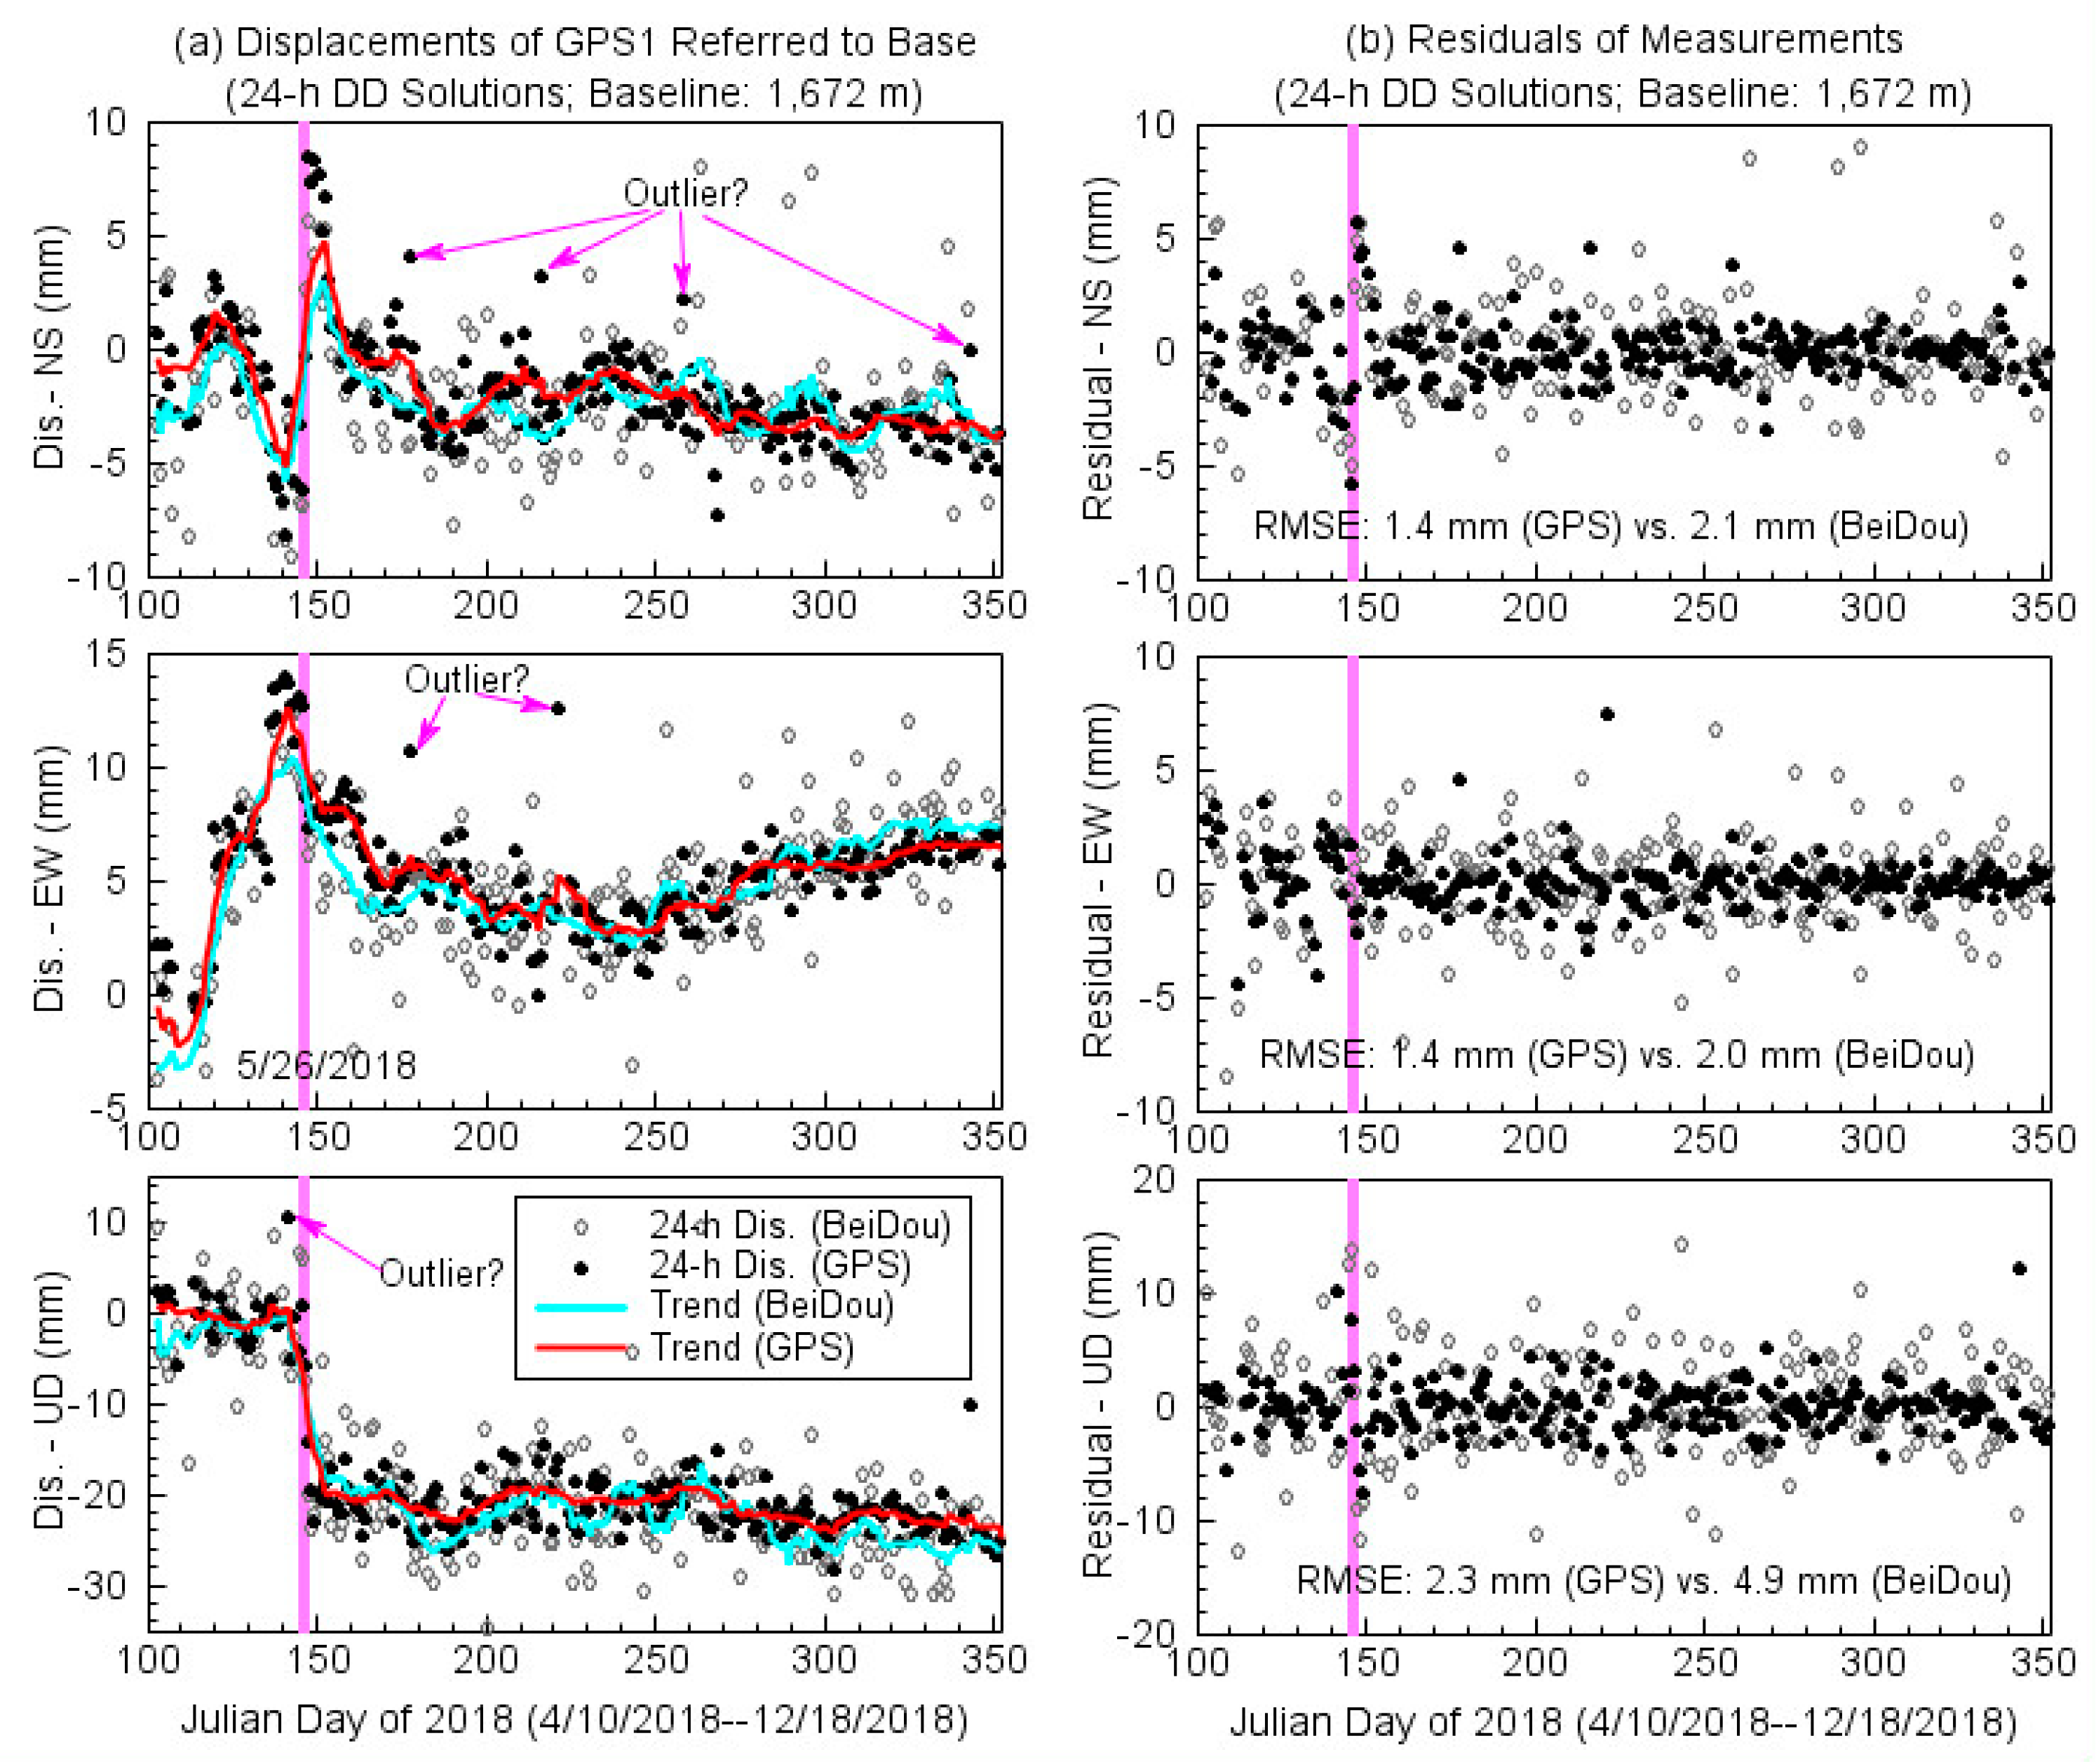
4. Results
5. Discussion
6. Conclusions
- Establishing a short-baseline GNSS network with one reference station and a group of rover stations fixed on monitoring objects;
- Monitoring the long-term stability of the base station using PPP, a stable regional or local reference frame, and a seasonal ground deformation model;
- Monitoring the movement of the rover antennas using the DD method in near real-time;
- Applying an automated CPD algorithm to aid in detecting minor abrupt-displacements and slow gradual-displacements at both base and rover sites in near real-time.
Author Contributions
Funding
Acknowledgments
Conflicts of Interest
References
- Yi, T.-H.; Li, H.-N.; Gu, M. Experimental assessment of high-rate GPS receivers for deformation monitoring of bridge. Measurement 2013, 46, 420–432. [Google Scholar] [CrossRef]
- Wang, J.; Meng, X.; Qin, C.; Yi, J. Vibration frequencies extraction of the forth road bridge using high sampling GPS data. Shock Vib. 2016, 2016, 1–18. [Google Scholar] [CrossRef]
- Yigit, C.O.; Gurlek, E. Experimental testing of high-rate GNSS precise point positioning (PPP) method for detecting dynamic vertical displacement response of engineering structures. Geomat. Nat. Haz. Risk. 2017, 8, 893–904. [Google Scholar] [CrossRef]
- Yu, J.; Yan, B.; Meng, X.; Shao, X.; Ye, H. Measurement of bridge dynamic responses using network-based real-time kinematic GNSS technique. J. Surv. Eng. 2016, 142. [Google Scholar] [CrossRef]
- Tang, X.; Roberts, G.W.; Li, X.; Hancock, C.M. Real-time kinematic PPP GPS for structure monitoring applied on the Severn Suspension Bridge, UK. Adv. Space Res. 2017, 60, 925–937. [Google Scholar] [CrossRef]
- Kaloop, M.; Elbeltagi, E.; Hu, J.; Elrefai, A. Recent advances of structures monitoring and evaluation using GPS time series monitoring systems: A review. ISPRS Int. J. Geo-Inf. 2017, 6, 382. [Google Scholar] [CrossRef]
- Meng, X.; Nguyen, D.T.; Xie, Y.; Owen, J.S.; Psimoulis, P.; Ince, S.; Chen, Q.; Ye, J.; Bhatia, P. Design and implementation of a new system for large bridge monitoring-GeoSHM. Sensors 2018, 18, 775. [Google Scholar] [CrossRef]
- Xi, R.; Jiang, W.; Meng, X.; Zhou, X.; He, Q. Rapid initialization method in real-time deformation monitoring of bridges with triple-frequency BDS and GPS measurements. Adv. Space Res. 2018, 62, 976–989. [Google Scholar] [CrossRef]
- Im, S.B.; Hurlebaus, S.; Kang, Y.J. Summary review of GPS technology for structural health monitoring. J. Struct. Eng. 2013, 139, 1653–1664. [Google Scholar] [CrossRef]
- Montillet, J.-P.; Szeliga, W.M.; Melbourne, T.I.; Flake, R.M.; Schrock, G. Critical infrastructure monitoring with Global Navigation Satellite Systems. J. Surv. Eng. 2016, 142. [Google Scholar] [CrossRef]
- Bao, Y.; Guo, W.; Wang, G.; Gan, W.; Zhang, M.; Shen, S. Millimeter-accuracy structural deformation monitoring using stand-alone GPS: Case study in Beijing, China. J. Surv. Eng. 2018, 144. [Google Scholar] [CrossRef]
- Li, H.N.; Li, D.S.; Song, G. Recent application of fiber optic sensors to health monitoring in civil engineering. Eng. Struct. 2004, 26. [Google Scholar] [CrossRef]
- Farrar, C.; Worden, K. An introduction to structural health monitoring. Phil. Trans. R. Soc. 2007, 365, 303–315. [Google Scholar] [CrossRef] [PubMed]
- Song, G.; Wang, C.; Wang, B. Structural health monitoring (SHM) of civil structures. Appl. Sci. 2017, 7, 789. [Google Scholar] [CrossRef]
- Sony, S.; Laventure, S.; Sadhu, A. A literature review of next-generation smart sensing technology in structural health monitoring. Struct. Control Health Monit. 2019, 26. [Google Scholar] [CrossRef]
- Zhu, H.H.; Xu, Q.W.; Liao, S.M.; Fu, D.M.; Yu, N. Experimental study on working parameters of EPB shield machine. Chin. J. Geotech. Eng. 2006, 28, 553–557. (In Chinese) [Google Scholar]
- Chen, R.P.; Zhu, J.; Liu, W.; Tang, X.W. Ground movement induced by parallel EPB tunnels in silty soils. Tunn. Undergr. Sp. Tech. 2011, 26, 163–171. [Google Scholar] [CrossRef]
- Li, X.; Yuan, D.; Guo, Y.; Cai, Z. Use of a 10.22 m diameter EPB shield: A case study in Beijing subway construction. Springerplus 2016, 5, 2004. [Google Scholar] [CrossRef]
- Li, P.F.; Chen, K.Y.; Wang, F.; Li, Z. An upper-bound analytical model of blow-out for a shallow tunnel in sand considering the partial failure within the face. Tunn. Undergr. Sp. Tech. 2019, 91. [Google Scholar] [CrossRef]
- Su, X.; Xu, W.; Du, S. Responses of groundwater vulnerability to artificial recharge under extreme weather conditions in Shijiazhuang City, China. J. Water Supply Res. T. 2014, 63, 224–238. [Google Scholar] [CrossRef]
- Wang, G.; Philips, D.; Joyce, J.; Rivera, F. The integration of TLS and continuous GPS to study landslide deformation: A case study in Puerto Rico. J. Geod. Sci. 2011, 1, 25–34. [Google Scholar] [CrossRef]
- Wang, G. Kinematics of the Cerca del Cielo, Puerto Rico landslide derived from GPS observations. Landslides 2011, 9, 117–130. [Google Scholar] [CrossRef]
- Liu, H.; Wang, G. Relative motion between St. Croix and the Puerto Rico-Northern Virgin Islands mlock derived from continuous GPS observations (1995–2014). Int. J. Geophysics 2015, 2015, 1–9. [Google Scholar] [CrossRef]
- Yang, L.; Wang, G.; Huérfano, V.; von Hillebrandt-Andrade, C.G.; Martínez-Cruzado, J.A.; Liu, H. GPS geodetic infrastructure for natural hazards study in the Puerto Rico and Virgin Islands region. Nat. Hazards 2016, 83, 641–665. [Google Scholar] [CrossRef]
- Liu, Y.; Sun, X.; Wang, G.; Turco, M.J.; Agudelo, G.; Bao, Y.; Zhao, R.; Shen, S. Current activity of the Long Point Fault in Houston, Texas constrained by continuous GPS measurements (2013–2018). Remote Sens. 2019, 11, 1213. [Google Scholar] [CrossRef]
- Wang, G.; Boore, D.M.; Tang, G.; Zhou, X. Some observations on colocated and closely spaced 1-second sampled GPS and ground-motion accelerograph data from the 2003 San Simeon (M 6.5), California, earthquake. Seism. Soc. Am. 2007, 97, 76–90. [Google Scholar] [CrossRef]
- Wang, G.; Blume, F.; Meertens, C.; Ibanez, P.; Schulze, M. Performance of high-rate kinematic GPS during strong shaking: Observations from shake table tests and the 2010 Chile earthquake. J. Geod. Sci. 2012, 2. [Google Scholar] [CrossRef]
- Wang, G. GPS Landslide Monitoring: Single Base vs. Network Solutions—A case study based on the Puerto Rico and Virgin Islands Permanent GPS Network. J. Geod. Sci. 2011, 1. [Google Scholar] [CrossRef]
- Wang, G. Millimeter-accuracy GPS landslide monitoring using Precise Point Positioning with Single Receiver Phase Ambiguity (PPP-SRPA) resolution: A case study in Puerto Rico. J. Geod. Sci. 2013, 3. [Google Scholar] [CrossRef]
- Wang, G.; Bao, Y.; Cuddus, Y.; Jia, X.; Serna, J.; Jing, Q. A methodology to derive precise landslide displacement time series from continuous GPS observations in tectonically active and cold regions: A case study in Alaska. Nat. Hazards 2015, 77, 1939–1961. [Google Scholar] [CrossRef]
- Wang, G.; Turco, M.; Soler, T.; Kearns, T.J.; Welch, J. Comparisons of OPUS and PPP solutions for subsidence monitoring in the greater Houston area. J. Surv. Eng. 2017, 143. [Google Scholar] [CrossRef]
- Wang, G.; Liu, H.; Mattioli, G.; Miller, M.; Feaux, K.; Braun, J. CARIB18: A stable geodetic reference frame for geological hazard monitoring in the Caribbean region. Remote Sensing 2019, 11, 680. [Google Scholar] [CrossRef]
- Geng, J.; Meng, X.; Dodson, A.H.; Teferle, F.N. Integer ambiguity resolution in precise point positioning: Method comparison. J. Geod. 2010, 84. [Google Scholar] [CrossRef]
- Zumberge, J.F.; Heflin, M.B.; Jefferson, D.C.; Watkins, M.M.; Webb, F.H. Precise point positioning for the efficient and robust analysis of GPS data from large networks. J. Geophys. Res. Solid Earth 1997, 102, 5005–5017. [Google Scholar] [CrossRef]
- Herring, T.A.; King, R.W.; Floyd, M.A.; Mcclusky, S.C. Introduction to GAMIT/GLOBK, Release 10.7; Massachusetts Institute of Technology: Cambridge, MA, USA, 2018. [Google Scholar]
- Bertiger, W.; Desai, S.D.; Haines, B.; Harvey, N.; Moore, A.W.; Owen, S.; Weiss, J.P. Single receiver phase ambiguity resolution with GPS data. J. Geod. 2010, 84, 327–337. [Google Scholar] [CrossRef]
- Wang, G.; Bao, Y.; Gan, W.; Geng, J.; Xiao, G.; Shen, J.S. NChina16: A stable geodetic reference frame for geological hazard studies in North China. J. Geodyn. 2018, 115, 10–22. [Google Scholar] [CrossRef]
- Rebischung, P.; Altamimi, Z.; Ray, J.; Garayt, B. The IGS contribution to ITRF2014. J. Geod. 2016, 90, 611–630. [Google Scholar] [CrossRef]
- Davis, J.L.; Wernicke, B.P.; Tamisiea, M.E. On seasonal signals in geodetic time series. J. Geophys. Res. Solid Earth 2012, 117. [Google Scholar] [CrossRef]
- Aminikhanghahi, S.; Cook, D.J. A survey of methods for time series change point detection. Knowl. Inf. Syst. 2017, 51, 339–367. [Google Scholar] [CrossRef]
- Truong, C.; Oudre, L.; Vayatis, N. A Review of Change Point Detection Methods. 2018. Available online: https://arxiv.org/pdf/1801.00718.pdf (accessed on 1 June 2019).
- Wang, G.; Soler, T. Using OPUS for measuring vertical displacements in Houston, Texas. J. Surv. Eng. 2013, 139, 126–134. [Google Scholar] [CrossRef]
- Do, N.A.; Dias, D.; Oreste, P.; Djeran-Maigre, I. 2D numerical investigations of twin tunnel interaction. Geomech. Eng. 2014, 6. [Google Scholar] [CrossRef]
- Suwansawat, S.; Einstein, H. Describing settlement troughs over twin tunnels using a superposition technique. J. Geotech. Geoenviron. 2007, 133, 445–468. [Google Scholar] [CrossRef]
- Vinod, M.; Khabbaz, H. Comparison of rectangular and circular bored twin tunnels in weak ground. Undergr. Sp. 2019. [Google Scholar] [CrossRef]
- Zhao, W.; Jia, P.J.; Zhu, L.; Cheng, C.; Han, J.; Chen, Y.; Wang, Z.G. Analysis of the additional stress and ground settlement induced by the construction of double-o-tube shield tunnels in sandy soils. Appl. Sci. 2019, 9, 1399. [Google Scholar] [CrossRef]
- Peck, R.B. Deep excavations and tunneling in soft ground. In Proceedings of the 7th International Conference on Soil Mechanics and Foundation Engineering, Mexico City, Mexico, 1969; State of the Art Volume. pp. 225–290. Available online: https://www.issmge.org/uploads/publications/1/38/1969_03_0010.pdf (accessed on 3 April 2019).
- O’Reilly, M.P.; New, B.M. Settlements above Tunnels in the United Kingdom—Their Magnitude and Prediction; Tunneling 82; Institute of Mining and Metallurgy: London, UK, 1982; pp. 173–181. [Google Scholar]
- Duan, S.; Huang, L.; Bao, Z.; Shen, P. Application of modified Peck formula in surface subsidence prediction of Changsha subway tunnel construction. J. Nat. Disasters 2015, 24, 164–169. (In Chinese) [Google Scholar] [CrossRef]
- Huang, L.; Duan, S.; Xie, Z.; Jiang, X. A revision of peck formula based on the surface subsidence due to metro excavation in Changsha. Electron. J. Geotech. Eng. 2015, 20, 2115–2123. [Google Scholar]
- Zhu, C. Control of surface settlement by considering shield tunneling technology. KSCE J. Civ. Eng. 2017, 21, 2896–2907. [Google Scholar] [CrossRef]
- Fang, Y.; He, C.; Nazem, A.; Yao, Z.; Grasmick, J. Surface settlement prediction for EPB shield tunneling in sandy ground. KSCE J. Civ. Eng. 2017, 21, 2908–2918. [Google Scholar] [CrossRef]
- Liu, J.; Ding, W.; Dai, Z.; Wang, H.; Jia, K. Analysis of ground loss and its factors induced by EPB shield tunnel construction. J. Chongqing Jianzhu Uni. 2017, 39, 1-C8. (In Chinese) [Google Scholar] [CrossRef]
- Hefny, A.M. Parametric studies on the interaction between existing and new bored tunnels. Tunn. Undergr. Sp. Tech. 2004, 19. [Google Scholar] [CrossRef]
- Cai, C.; Gao, Y.; Pan, L.; Zhu, J. Precise point positioning with quad-constellations: GPS, BeiDou, GLONASS and Galileo. Adv. Space Res. 2015, 56, 133–143. [Google Scholar] [CrossRef]
- Li, X.; Ge, M.; Dai, X.; Ren, X.; Fritsche, M.; Wickert, J.; Schuh, H. Accuracy and reliability of multi-GNSS real-time precise positioning: GPS, GLONASS, BeiDou, and Galileo. J. Geod. 2015, 89, 607–635. [Google Scholar] [CrossRef]
- Rabbou, M.A.; El-Rabbany, A. PPP accuracy enhancement using GPS/GLONASS observations in kinematic mode. Positioning 2015, 6, 1–6. [Google Scholar] [CrossRef]
- Yu, X.; Gao, J. Kinematic precise point positioning using multi-constellation Global Navigation Satellite System (GNSS) observations. ISPRS Int. J. Geo-Inf. 2017, 6, 6. [Google Scholar] [CrossRef]
- Shi, C.; Zheng, F.; Lou, Y.; Gu, S.; Zhang, W.; Dai, X.; Li, X.; Guo, H.; Gong, X. National BDS Augmentation Service System (NBASS) of China: Progress and assessment. Remote Sens. 2017, 9, 837. [Google Scholar] [CrossRef]
- Mohammed, J.; Moore, T.; Hill, C.; Bingley, R.M.; Hansen, D.N. An assessment of static precise point positioning using GPS only, GLONASS only, and GPS plus GLONASS. Measurement 2016, 88, 121–130. [Google Scholar] [CrossRef]
- Alcay, S.; Yigit, C. Network based performance of GPS-only and combined GPS/GLONASS positioning under different sky view conditions. Acta Geod. Geophys. 2017, 52, 345–356. [Google Scholar] [CrossRef]
- Msaewe, H.A.; Hancock, C.M.; Psimoulis, P.A.; Roberts, G.W.; Bonenberg, L.; de Ligt, H. Investigating multi-GNSS performance in the UK and China based on a zero-baseline measurement approach. Measurement 2017, 102, 186–199. [Google Scholar] [CrossRef]
- Wang, M.; Chai, H.; Liu, J.; Zeng, A. BDS relative static positioning over long baseline improved by GEO multipath mitigation. Adv. Space Res. 2015, 57, 782–793. [Google Scholar] [CrossRef]
- Dai, W.; Shi, Q.; Cai, C. Characteristics of the BDS carrier phase multipath and its mitigation methods in relative positioning. Sensors 2017, 17, 796. [Google Scholar] [CrossRef]
- Lei, W.Y.; Wu, G.C.; Tao, X.X.; Bian, L.; Wang, X.L. BDS satellite-induced code multipath: Mitigation and assessment in new-generation IOV satellites. Adv. Space Res. 2017, 60, 2672–2679. [Google Scholar] [CrossRef]
- Chen, X. Statistical multipath model comparative analysis of different GNSS orbits in static urban canyon environment. Adv. Space Res. 2018, 62, 1034–1048. [Google Scholar] [CrossRef]
- Zhang, Q.; Yang, W.; Zhang, S.; Liu, X. Characteristics of BeiDou navigation satellite system multipath and its mitigation method based on Kalman filter and Rauch-Tung-Striebel smoother. Sensors 2018, 18, 198. [Google Scholar] [CrossRef] [PubMed]
- Ge, Y.; Yang, X.; Qin, W.; Yang, H.; Guang, W.; Zhou, F.; Ouyang, M.; Wang, S. Mitigation of the multipath effect in BDS-based time transfer using a wave-absorbing shield. Adv. Space Res. 2019, 63, 2771–2783. [Google Scholar] [CrossRef]


| Rover Stations | Distance to Base (m) | Shield-Head Arriving (Beijing Time *) | Shield-Tail Leaving (Beijing Time *) | Total Time Passing the Site | |
|---|---|---|---|---|---|
| First Tunnel | GPS2 | 1679.584 | 16:16, April 28 | 12:28, April 29 | 20 h |
| GPS4 | 1794.432 | 05:13, May 04 | 13:44, May 04 | 8.5 h | |
| GPS6 | 1917.414 | 12:25, May 14 | 16:17, May 15 | 28 h | |
| Second Tunnel | GPS1 | 1672.586 | 10:14, May 26 | 17:08, May 26 | 7 h |
| GPS3 | 1795.117 | 02:56, Jun 03 | 12:40, Jun 04 | 34 h | |
| GPS5 | 1912.585 | 21:10, Jun 12 | 03:44, Jun 13 | 6.5 h |
© 2019 by the authors. Licensee MDPI, Basel, Switzerland. This article is an open access article distributed under the terms and conditions of the Creative Commons Attribution (CC BY) license (http://creativecommons.org/licenses/by/4.0/).
Share and Cite
Guo, W.; Wang, G.; Bao, Y.; Li, P.; Zhang, M.; Gong, Q.; Li, R.; Gao, Y.; Zhao, R.; Shen, S. Detection and Monitoring of Tunneling-Induced Riverbed Deformation Using GPS and BeiDou: A Case Study. Appl. Sci. 2019, 9, 2759. https://doi.org/10.3390/app9132759
Guo W, Wang G, Bao Y, Li P, Zhang M, Gong Q, Li R, Gao Y, Zhao R, Shen S. Detection and Monitoring of Tunneling-Induced Riverbed Deformation Using GPS and BeiDou: A Case Study. Applied Sciences. 2019; 9(13):2759. https://doi.org/10.3390/app9132759
Chicago/Turabian StyleGuo, Wen, Guoquan Wang, Yan Bao, Pengfei Li, Mingju Zhang, Qiuming Gong, Rui Li, Yang Gao, Ruibin Zhao, and Shuilong Shen. 2019. "Detection and Monitoring of Tunneling-Induced Riverbed Deformation Using GPS and BeiDou: A Case Study" Applied Sciences 9, no. 13: 2759. https://doi.org/10.3390/app9132759
APA StyleGuo, W., Wang, G., Bao, Y., Li, P., Zhang, M., Gong, Q., Li, R., Gao, Y., Zhao, R., & Shen, S. (2019). Detection and Monitoring of Tunneling-Induced Riverbed Deformation Using GPS and BeiDou: A Case Study. Applied Sciences, 9(13), 2759. https://doi.org/10.3390/app9132759