Article

Supplementation of Non-Dairy Creamer-Enriched High-Fat Diet with D-Allulose Ameliorated Blood Glucose and Body Fat Accumulation in C57BL/6J Mice

1
Department of Pharmacology, Kyungpook National University School of Medicine, Daegu 41566, Korea
2
Department of Food Science and Nutrition, Kyungpook National University, Daegu 41566, Korea
3
Center for Food and Nutritional Genomics Research, Kyungpook National University, Daegu 41566, Korea
4
Department of Biochemistry, School of Medicine, Keimyung University, Daegu 42601, Korea
5
CJ Cheiljedang Food Research Institute, Suwon 16495, Korea
*
Author to whom correspondence should be addressed.
These authors contributed equally to this work.
Appl. Sci. 2019, 9(13), 2750; https://doi.org/10.3390/app9132750
Submission received: 26 April 2019 / Revised: 19 June 2019 / Accepted: 5 July 2019 / Published: 8 July 2019
(This article belongs to the Section Applied Biosciences and Bioengineering)

Abstract

:
D-allulose, which has 70% of the sweet taste of sucrose but nearly no calories, has been reported to inhibit the absorption of lipids and suppress body weight gain in obese mice. Fats in non-dairy creamer consist of highly saturated fatty acids, which can cause various lipid disorders when consumed over a long period. We investigated whether D-allulose supplementation alleviates the effects of a non-dairy creamer-enriched high-fat diet on lipid metabolism. High-fat diets enriched with non-dairy creamer were administered to C57BL/6J mice with or without D-allulose supplementation for eight weeks by the pair-feeding design. Lipid metabolic markers were compared between the non-dairy creamer control group (NDC) and non-dairy creamer allulose group (NDCA). Body, adipose tissue, and liver weights, and fasting blood glucose levels, were significantly lower in the NDCA group than in the NDC group. Fecal fatty acid and triglyceride levels were significantly higher in the NDCA group than in the NDC group. Supplementing a non-dairy creamer-enriched high-fat diet with D-allulose improved overall lipid metabolism, including the plasma and hepatic lipid profiles, hepatic and adipose tissue morphology, and plasma inflammatory adipokine levels in mice. These results suggest that D-allulose can be used as a functional food component for preventing body fat accumulation from a high-fat diet that includes hydrogenated plant fats.

1. Introduction

Currently, the incidence and prevalence of excessive weight gain and fat accumulation followed by obesity has sharply increased throughout the world. A high-sucrose or high-fat diet can lead to the development of metabolic syndrome [1] by increasing blood levels of triglycerides (TG), continuously inducing visceral fat accumulation, and ultimately leading to insulin resistance [2], hyperglycemia [3], and obesity [4].
Recently, many researchers are paying attention to the rare sugar that are defined as “monosaccharides and their derivatives that are rare in nature” by the International Society of Rare Sugars. Among the various rare sugars, D-allulose, a C-3 epimer of D-fructose with a molecular formula C6H12O6 that has 70% of the sweetness of sugar but nearly zero calories, is not commonly found in nature [5]. It is only present in small quantities in D-glucose and D-fructose obtained from the hydrolysis of sucrose or D-glucose isomerization, as a result of the heating process during manufacturing [6]. However, currently, it can be mass-produced by chemical synthesis and is widely available as a sugar substitute at a much lower cost. D-allulose has health benefits with the calorie-reduction effect, such as improving insulin resistance, antioxidant capacity, and hypoglycemic control [5], and helps control diabetes and obesity [6,7]. This sugar substitute has been reported to increase the excretion of dietary TG, cholesterol, and fatty acids under isocaloric diet conditions in obese animal models [7].
We investigated whether D-allulose has lipid-lowering effects on the consumption of a high-fat diet (HFD) that is further enriched with non-dairy creamer in mice. Non-dairy creamers, generally used as milk substitutes for coffee, often contain hydrogenated fat, which is artificially produced by converting unsaturated fatty acids to saturated fatty acids. In general, a high saturated fatty acid intake induces dyslipidemia, which is associated with the risk of cardiovascular disease via abnormal regulation of blood lipid levels, by elevating total cholesterol, TG, and low-density lipoprotein (LDL) cholesterol, and decreasing high-density lipoprotein (HDL) cholesterol [8].
Hydrogenated palm oil was used as a non-dairy creamer in this study. Saturated fatty acids can promote cholesterol synthesis, and their content is higher in hydrogenated palm oil than in other vegetable oils [9]. This study is the first to investigate the effect of supplementation of hydrogenated non-dairy creamer-enriched HFD with D-allulose for preventing obesity in mice. We hypothesized that dietary supplementation of HFD enriched with non-dairy creamer and 5% D-allulose could overcome the undesirable effects of hydrogenated fats and high-fat levels in the diet on lipid metabolism in obese mice.

2. Materials and Methods

2.1. Analysis of the General and Fatty Acid Compositions of the Non-Dairy Creamer

Fatty acid analysis was conducted using a Hewlett-Packard 5890 gas–liquid chromatograph (Palo Alto, CA, USA) equipped with a 7673A automatic sampler, 3392A integrator, FID detector, and SP-2340-fused silica capillary column (0.32 mm × 3 mm) (Supelco, Inc., Bellefonte, PA, USA). The following conditions were used: temperature increase from 160 to 180 °C at 3 °C/min for feed fats, and 90 to 180 °C at 4 °C/min for milk fat. Gas flows: carrier nitrogen, 1 mL/min; hydrogen, 30 mL/min; air, 400 mL/min. Fatty acids were identified by comparison of their retention times with that of the internal standard and with retention times reported previously.

2.2. Animals and Diets

A total of 16 male C57BL/6J mice (4-week-old) were purchased from the Jackson Laboratory (Bar Harbor, ME, USA). The animals were maintained in a room with controlled temperature (20–23 °C) and lighting (alternating 12-h light/dark periods) and fed a pelletized commercial non-purified diet for 4 weeks after arrival. The mice were then randomly divided into two groups (n = 8) and fed the respective experimental diets for 8 weeks, as shown in Table 1.
The experimental HFD was based on the American Institute of Nutrition AIN-76 semisynthetic diet, containing 20% fat and 1% cholesterol, but corn oil was replaced with non-dairy creamer (NDC, negative control). The test group was fed the non-dairy creamer allulose (NDCA) diet, in which the sucrose in NDC was substituted with 5% D-allulose (w/w). D-allulose powder was supplied from CJ CheilJedang Corp. (Seoul, Korea).
The NDC group was administered an iso-energetic diet based on the energy intake of the NDCA group, in a pair-fed manner. Mice had free access to distilled water throughout the experiment. Food intake was measured every day, and body weights were measured every week. All animal procedures were approved by the Ethics Committee for Animal Studies at Kyungpook National University, Korea (2016-0096).

2.3. Plasma, Hepatic, and Fecal Lipid Profile Analysis

Plasma apolipoprotein A-I and apolipoprotein B levels were measured using a Nittobo enzymatic kit (Nittobo Medical Co., Tokyo, Japan), and plasma glucose, HDL cholesterol, TG, total cholesterol, glutamic oxaloacetic transaminase, and glutamate pyruvate transaminase levels were determined using Asan enzymatic kits (Asan, Seoul, Korea). Plasma free fatty acid level was determined using a non-esterified fatty acid (NEFA) kit (Wako, Osaka, Japan).
Hepatic and fecal lipids were extracted [10], and fecal samples from each group were collected daily for 1 week and subjected to lipid extraction. Dried lipid residues were dissolved in 1 mL of ethanol for TG, cholesterol, and fatty acid assays. Triton X-100 and sodium cholate solution in distilled water were added to 200 µL of dissolved lipid solution for emulsification. The TG, cholesterol, and fatty acid contents were analyzed using the same enzymatic kit as used for plasma analysis.

2.4. Lipid-Regulating Enzyme Activity Measurement

Samples were prepared and analyzed as described by Hulcher and Oleson [11]. Fatty acid synthase (FAS) activity was determined spectrophotometrically [12]. One unit of FAS activity represented the oxidation of 1 nmol NADPH/min at 30 °C. Fatty acid β-oxidation was determined by monitoring the reduction of NAD to NADH at 340 nm, and the activity was expressed as nmol reduced NAD/min/mg protein [13]. Carnitine palmitoyltransferase (CPT) activity was assayed as described by Markwell et al. [14]. Glucose-6-phosphate dehydrogenase activity was monitored spectrophotometrically [15], and the activity was expressed as nmol reduced NADPH/min/mg protein. Malic enzyme (ME) activity in the cytosol fraction was achieved by monitoring NADPH production at 340 nm and expressed as the production of NADPH nmol/mg protein/min [16]. Phosphatidate phosphatase (PAP) activity was measured according to Walton and Possmayer [17] and expressed as nmol/min/mg protein. Acetyl-coenzyme A acetyltransferases (ACAT) activity was determined according to the method of Gillies et al. [18]. 3-Hydroxy-3-methyl-glutaryl-coenzyme A reductase (HMGCR) activity was measured according to the method of Shapiro et al. [19].

2.5. Plasma Cytokine and Adipokine Measurement

Plasma plasminogen activator inhibitor-1 (PAI-1), resistin, leptin, monocyte chemoattractant protein-1, tumor necrosis factor-α, interleukin-6 (IL-6), and IL-10 levels were determined using a multiplex detection kit from Bio-Rad (Hercules, CA, USA). All samples were assayed in duplicate with a Luminex 200 LabMAP system (Luminex, Austin, TX, USA). Data analyses were conducted using the Bio-Plex Manager software version 4.1.1 (Bio-Rad). Plasma adiponectin was determined using a Mouse Adiponectin/Acrp30 Immunoassay kit (R&D Systems, Minneapolis, MN, USA).

2.6. Real-Time qPCR Analysis

All tissues were prepared and analyzed as previously described [20]. Total RNA was converted to cDNA using the QuantiTect Reverse Transcription kit (Qiagen, Hilden, Germany). RNA expression was quantified by real-time quantitative PCR using the QuantiTect SYBR Green PCR kit (Qiagen) and SDS7000 sequence-detection system (Applied Biosystems, Foster City, CA, USA). Primers were designed to detect uncoupling protein 1 (UCP1, 22227), peroxisome proliferator-activated receptor gamma coactivator 1-alpha (19017), NAD-dependent deacetylase sirtuin-1 (SIRT1, 93759), peroxisome proliferator-activated receptor gamma (19016), cAMP response element-binding protein (12912), cluster of differentiation 36 (CD36, 12491), scavenger receptor class B member 1 (SRB1, 20778), ATP-binding cassette transporter (ABCA1, 11303), Niemann–Pick C1-Like 1 (NPC1L1, 237636), and FAS (14101). Amplification was performed as follows: 9 °C for 10 min, 95 °C for 15 s, and 60 °C for 60 s, for a total of 40 cycles. The cycle threshold values were normalized using glyceraldehyde-3-phosphate dehydrogenase. Relative gene expression was calculated using the 2−ΔΔCt method [21].

2.7. Histopathology Analysis

Liver and epididymal white adipose tissue were removed from mice and fixed in a buffer solution containing 10% formalin. All fixed tissues were processed routinely for paraffin embedding, and 4-mm sections were prepared and stained with hematoxylin and eosin. Stained areas were viewed using an optical microscope (Nikon, Tokyo, Japan) at ×200 magnification.

2.8. Statistical Analysis

All data are presented as the mean and standard error. Statistical analysis was performed using SPSS software (version 22.0; SPSS, Inc., Chicago, IL, USA). Statistical differences between NDC and NDCA results were determined using the Student’s t-test when significant differences were identified between groups at p < 0.05.

3. Results

3.1. Components of Fatty Acids in Non-Dairy Creamer used for Animal Diet

The non-dairy creamer consisted of 65% carbohydrate, 33.275% fat, and 1% protein. Profiling of fatty acids present in non-dairy creamer revealed 15 types of fatty acids. The major fatty acids were lauric acid, myristic acid, stearic acid, and palmitic acid (Table 1).

3.2. Effect of Consumption of D-Allulose with Non-Dairy creamer as Part of a Dietary Fat Source on Body and Organ Weights

To investigate the effect of D-allulose supplementation and possible interaction of the D-allulose and non-dairy creamer-enriched HFD, male C57BL/6J mice were provided with NDC or NDCA diets for 8 weeks. Food intake and energy intake were approximately equal in the NDC and NDCA groups while initial body weights did not differ between groups (Figure 1a,b). However, the final body weight was significantly lower in the NDCA group than in the NDC group (Figure 1c). Correspondingly, total body weight gain and the food efficiency ratio were significantly higher in the NDC group than in the NDCA group (Figure 1d,e).
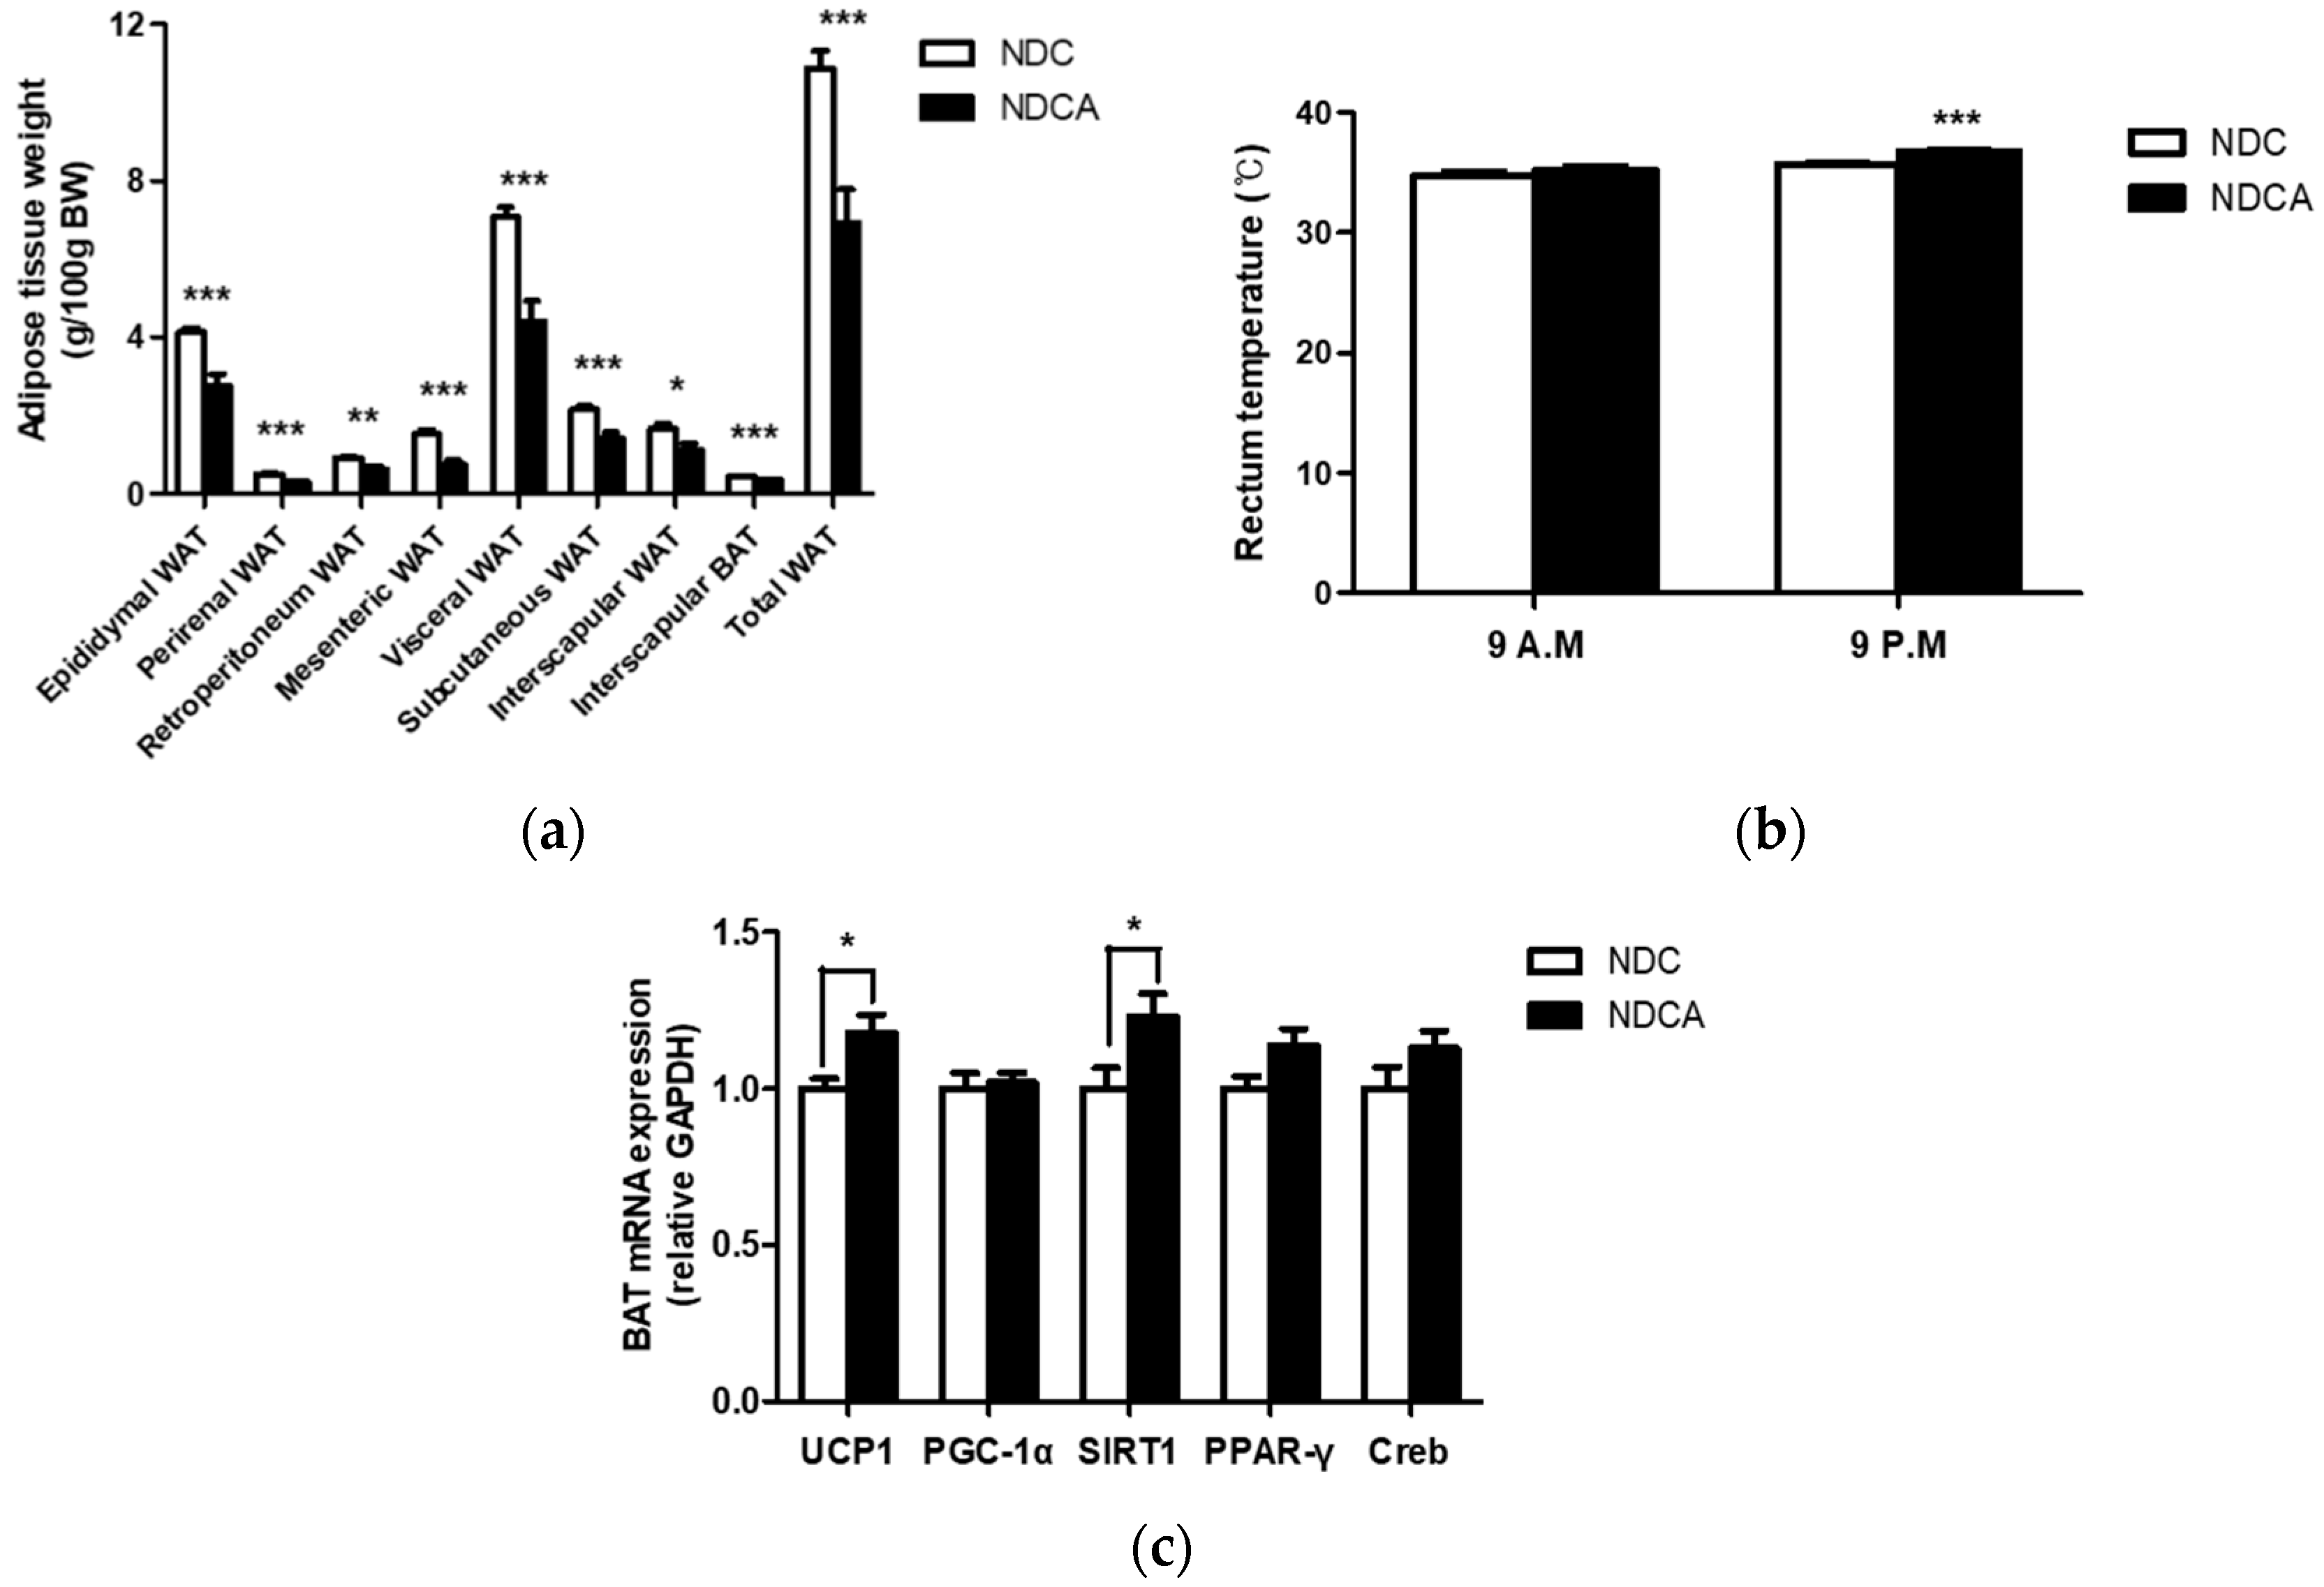
Liver weight was significantly higher in the NDC group than in the NDCA group. In contrast, kidney and muscle weights were significantly lower in the NDC group than in the NDCA group after 8 weeks (Figure 1f). Similarly, all adipose tissue weights were significantly higher in the NDC group than in the NDCA group (Figure 2a). For factors related to body weight, when mouse activity was high at 9 p.m., the rectal temperature was significantly increased in the NDCA group compared to the NDC group (Figure 2b). However, at 9 a.m., the rectal temperature did not differ between the NDCA and NDC groups (Figure 2b). Among factors affecting thermogenesis, brown adipose tissue (BAT), UCP1 and SIRT1 gene expressions were higher in the NDCA group than in the NDC group (Figure 2c).

3.3. Effect of Consumption of D-Allulose with Non-Dairy Creamer on Fecal Lipid Excretion and Plasma Lipid Profiles

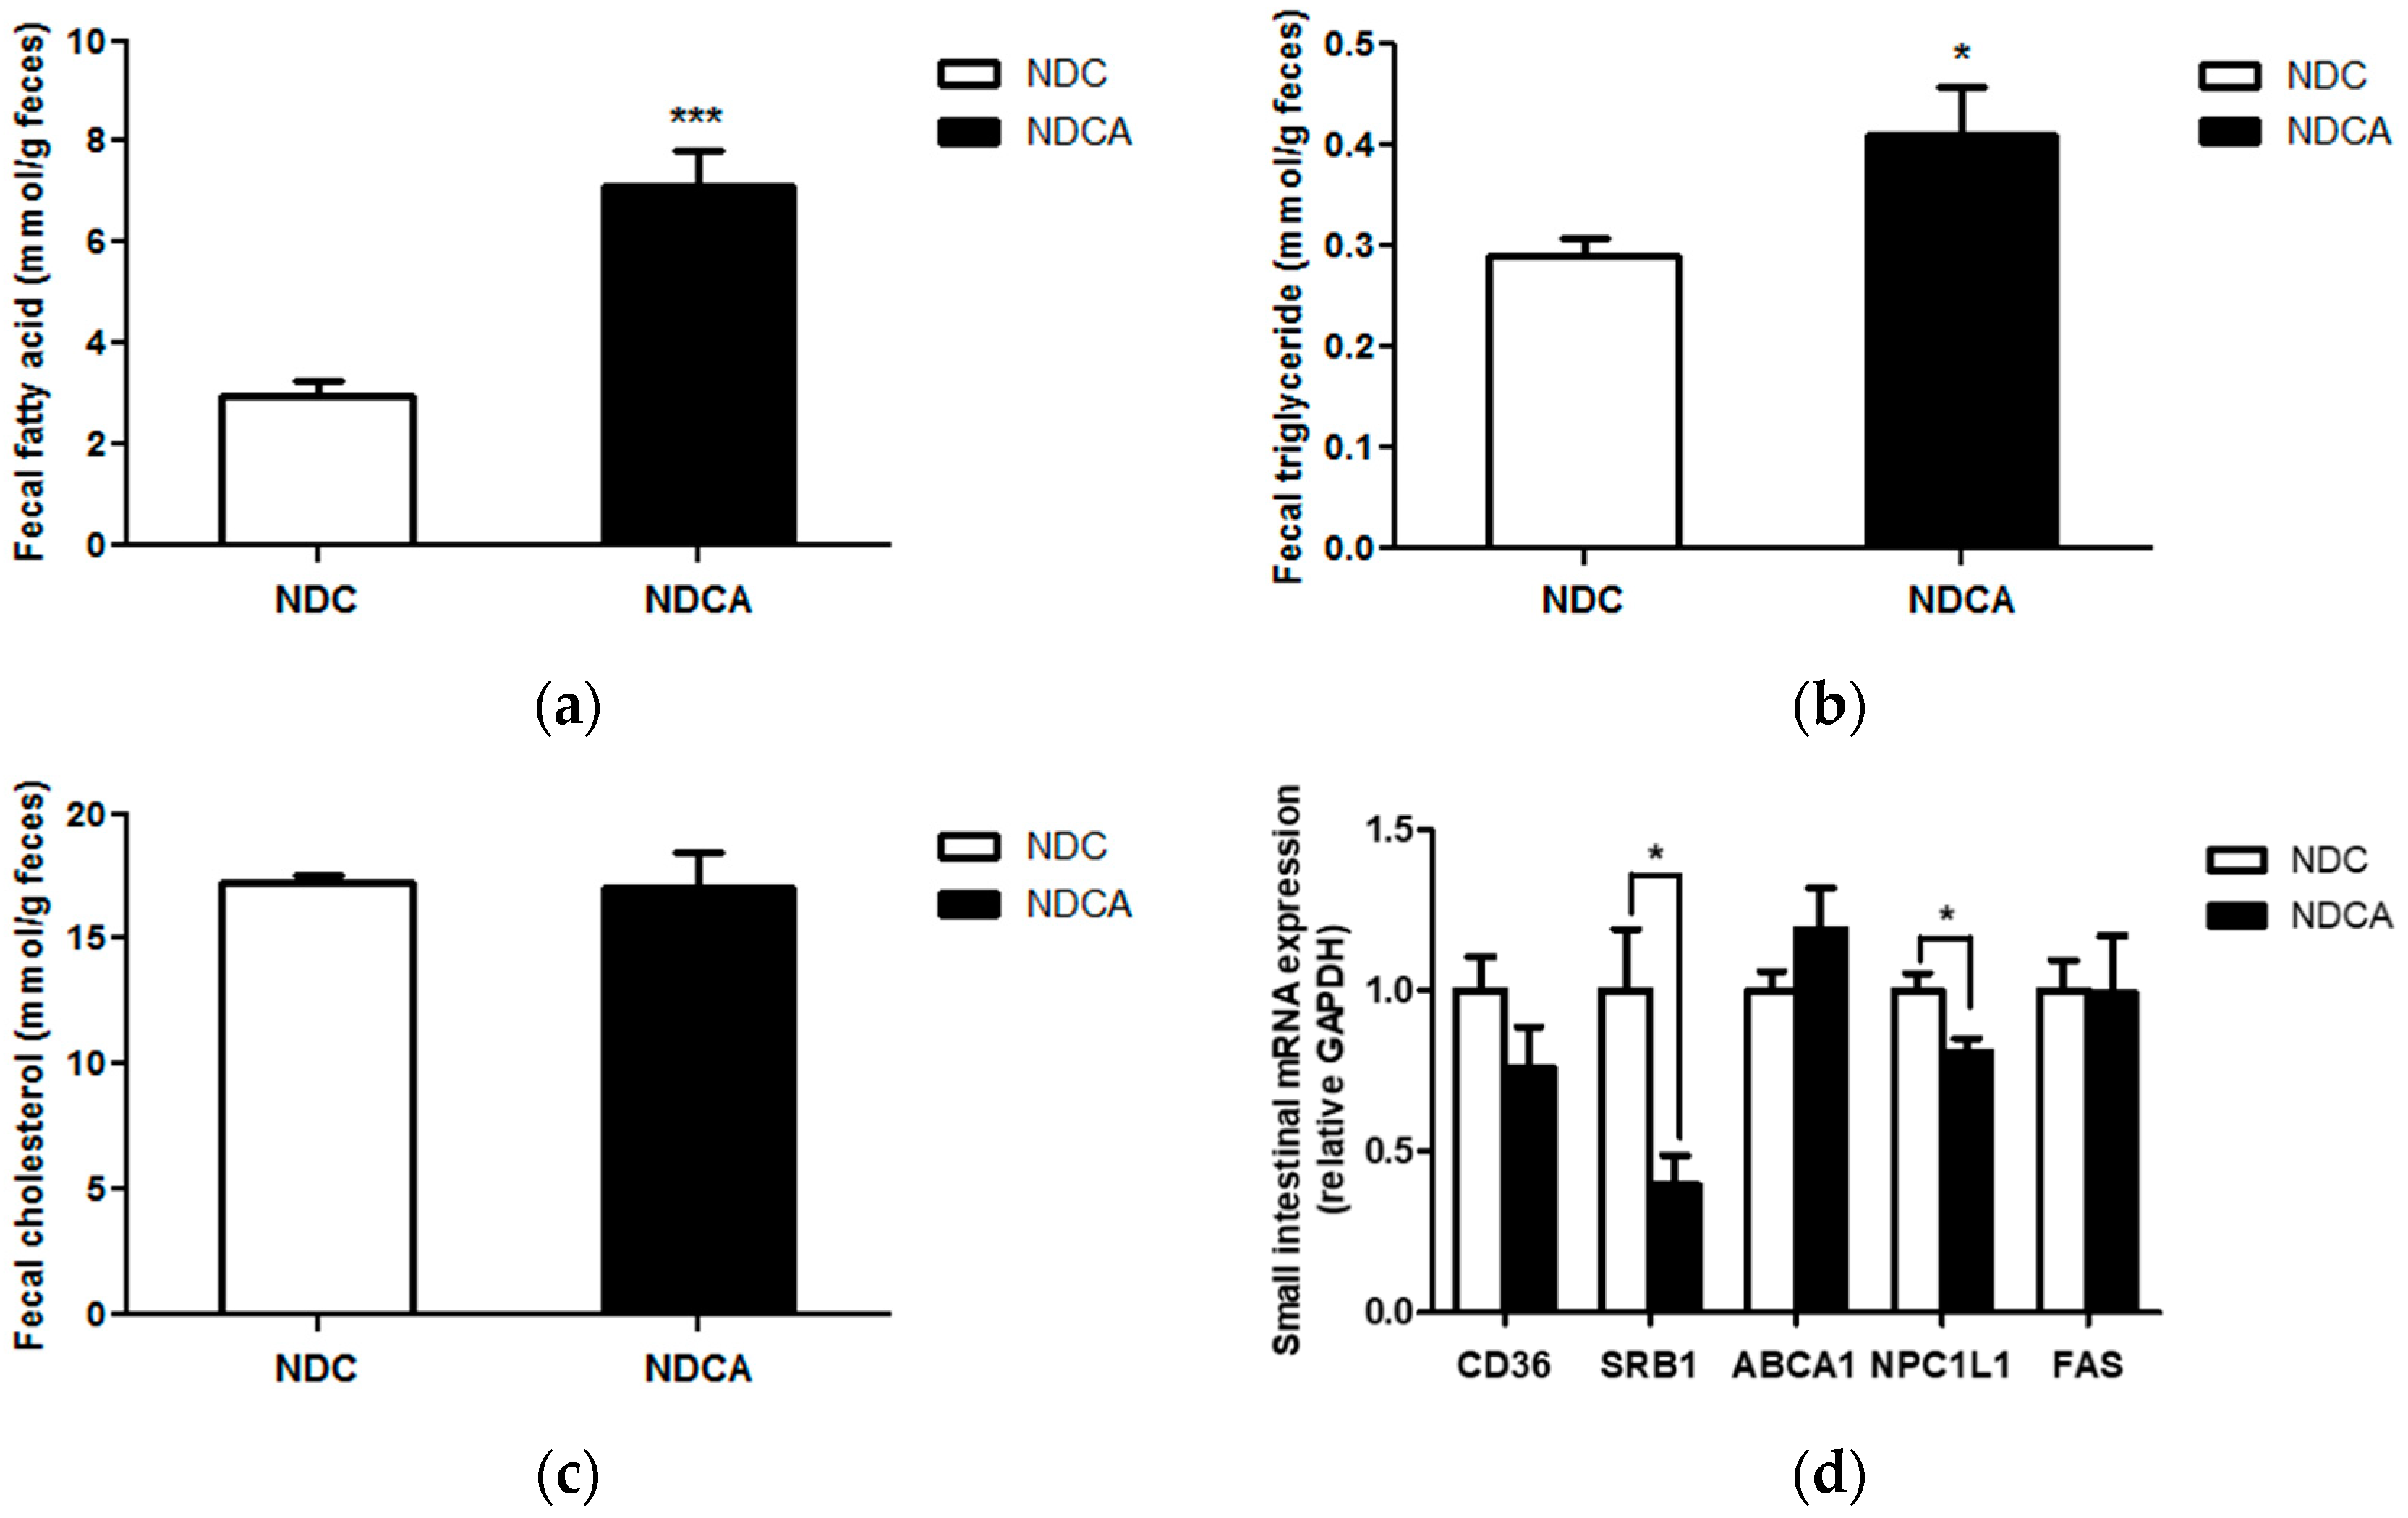
Fecal fatty acid and TG contents were significantly higher in the NDC group (Figure 3a,b) while the cholesterol excretion level was not different between groups (Figure 3c). Among the small intestinal mRNA expression of lipid metabolism-related factors, SRB-1 and LPC1L1 gene expressions were significantly lowered in the NDCA group (Figure 3d).
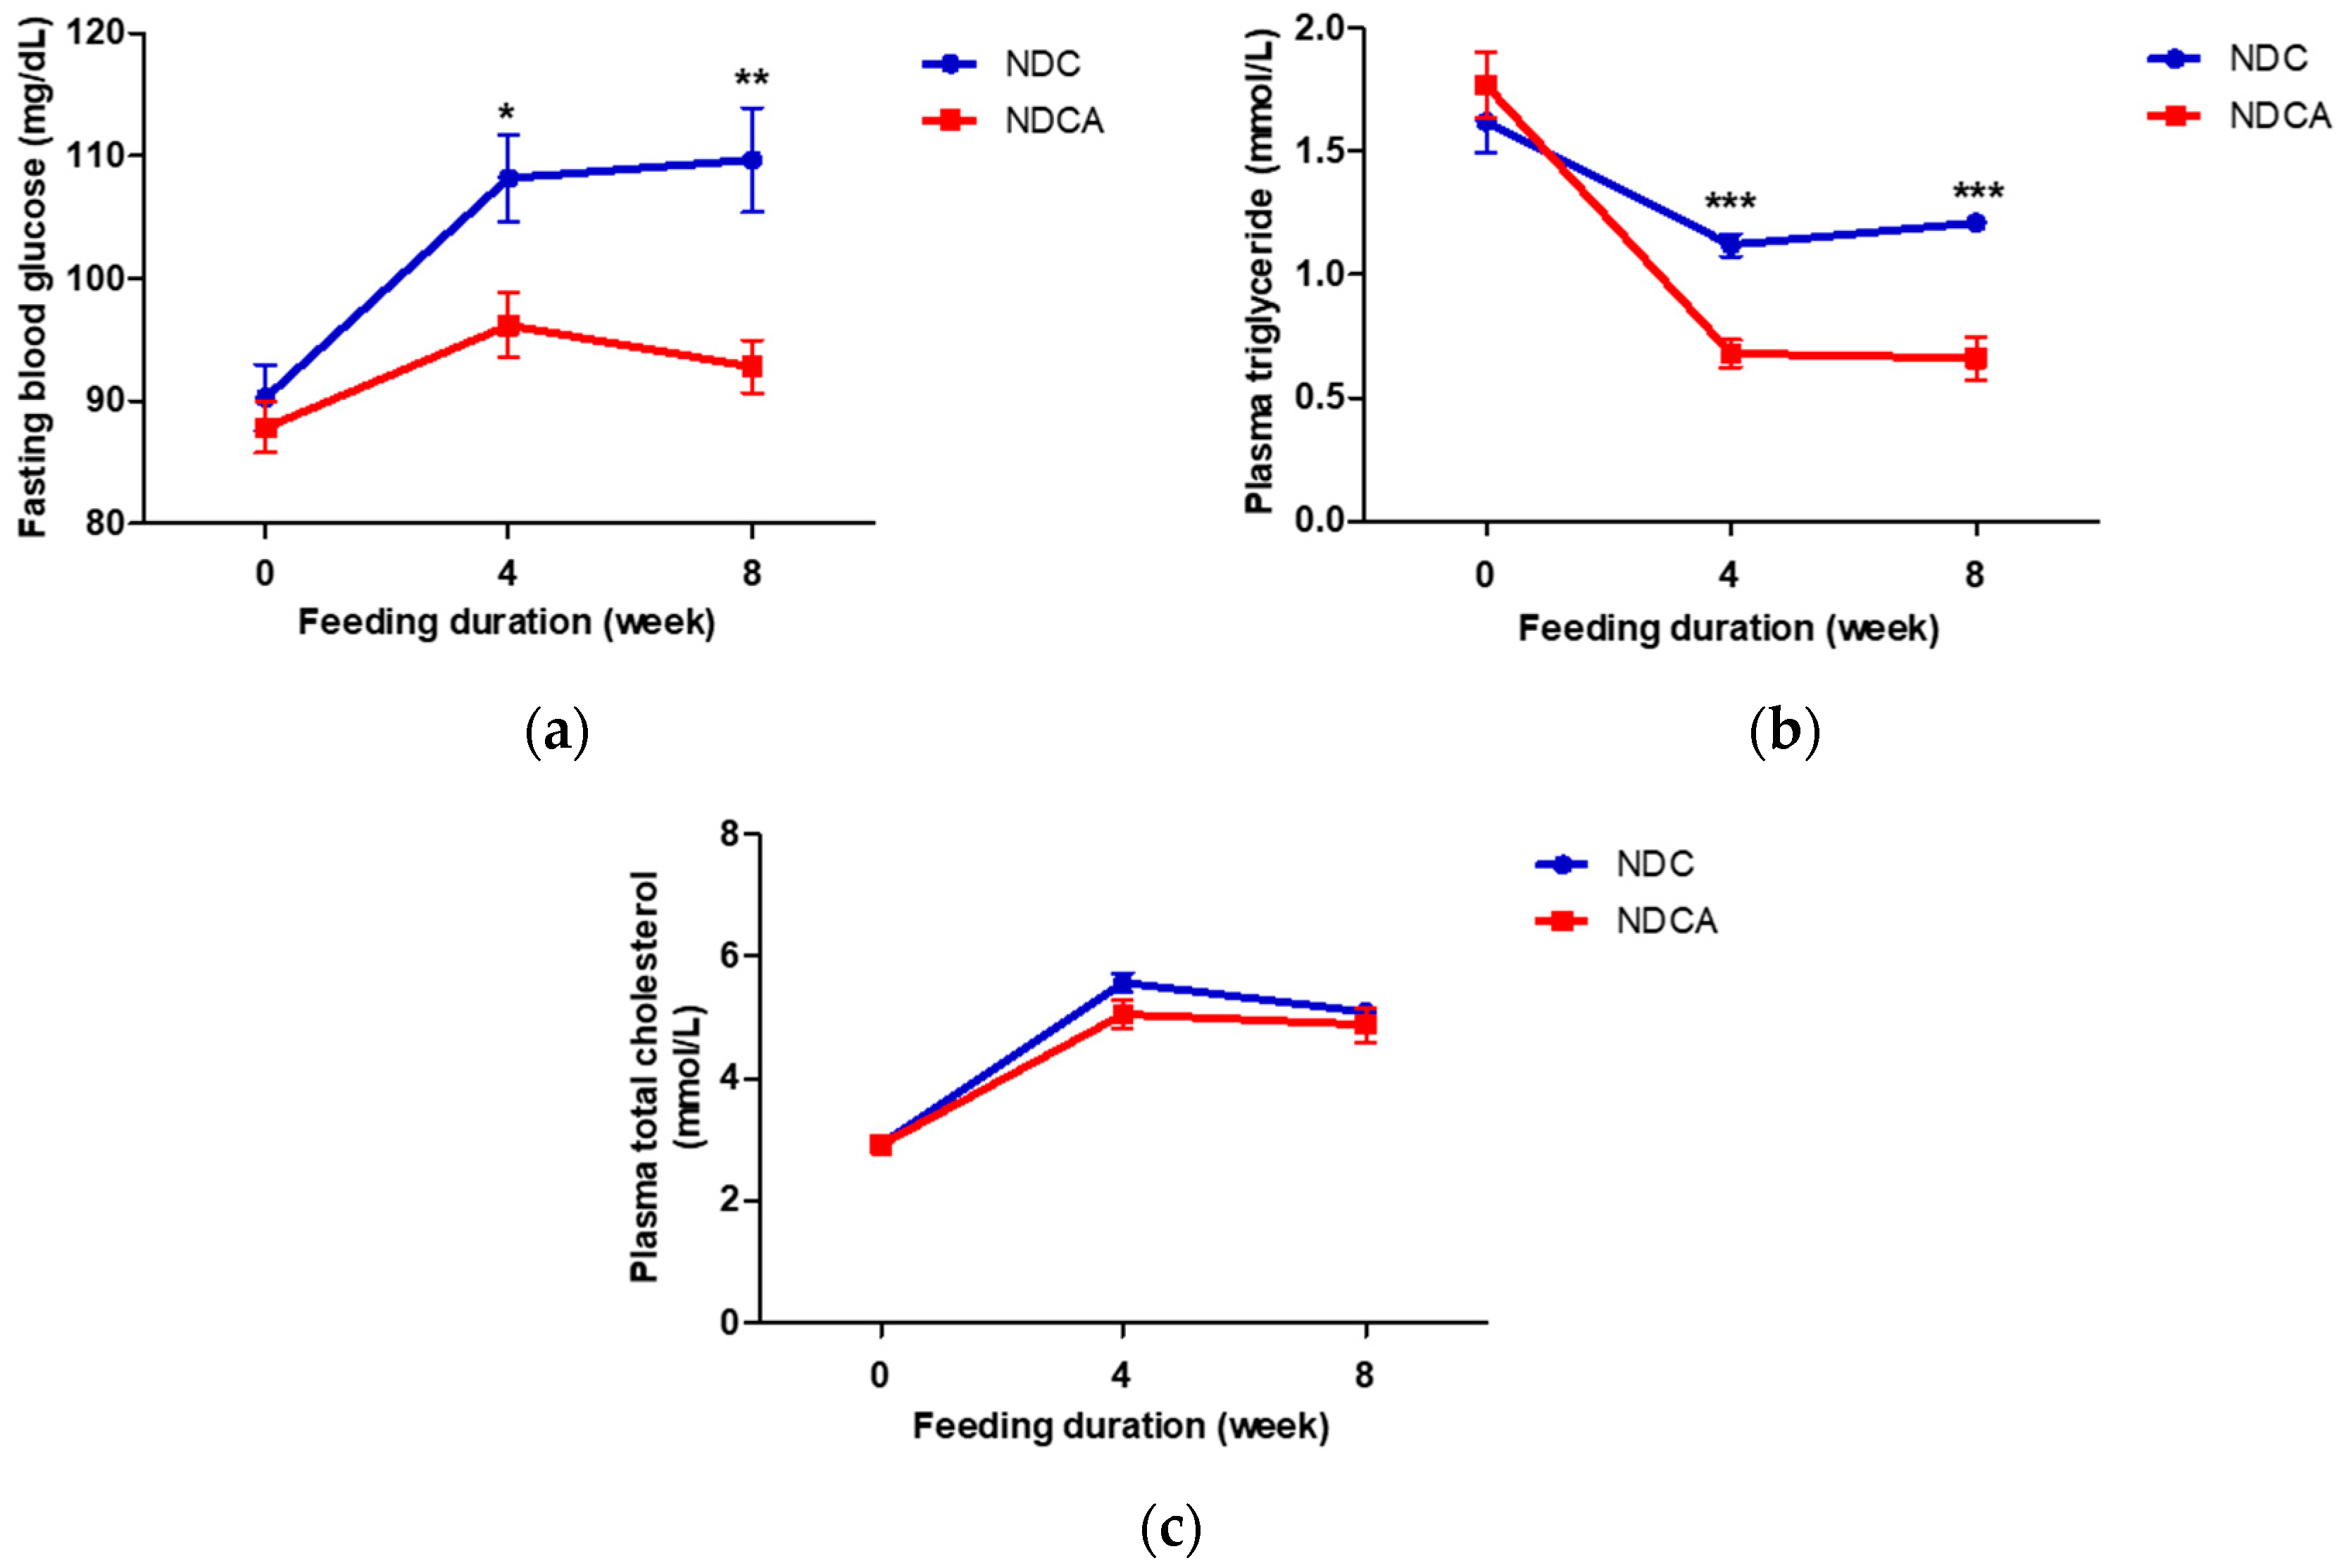
During the 8 weeks, the blood glucose concentration was more rapidly elevated in the NDC group than in the NDCA group, whereas plasma TG level was significantly lower in the NDCA group (Figure 4a,b). There was no change in plasma or fecal total cholesterol concentration (Figure 3c and Figure 4c). After 8 weeks, the levels of plasma glucose, TG, and glutamate pyruvate transaminase were significantly higher in the NDC compared with the NDCA group (Table 2).

3.4. Hepatic Lipid Profiles, Lipid-Regulating Enzyme Activities, and Tissue Morphology

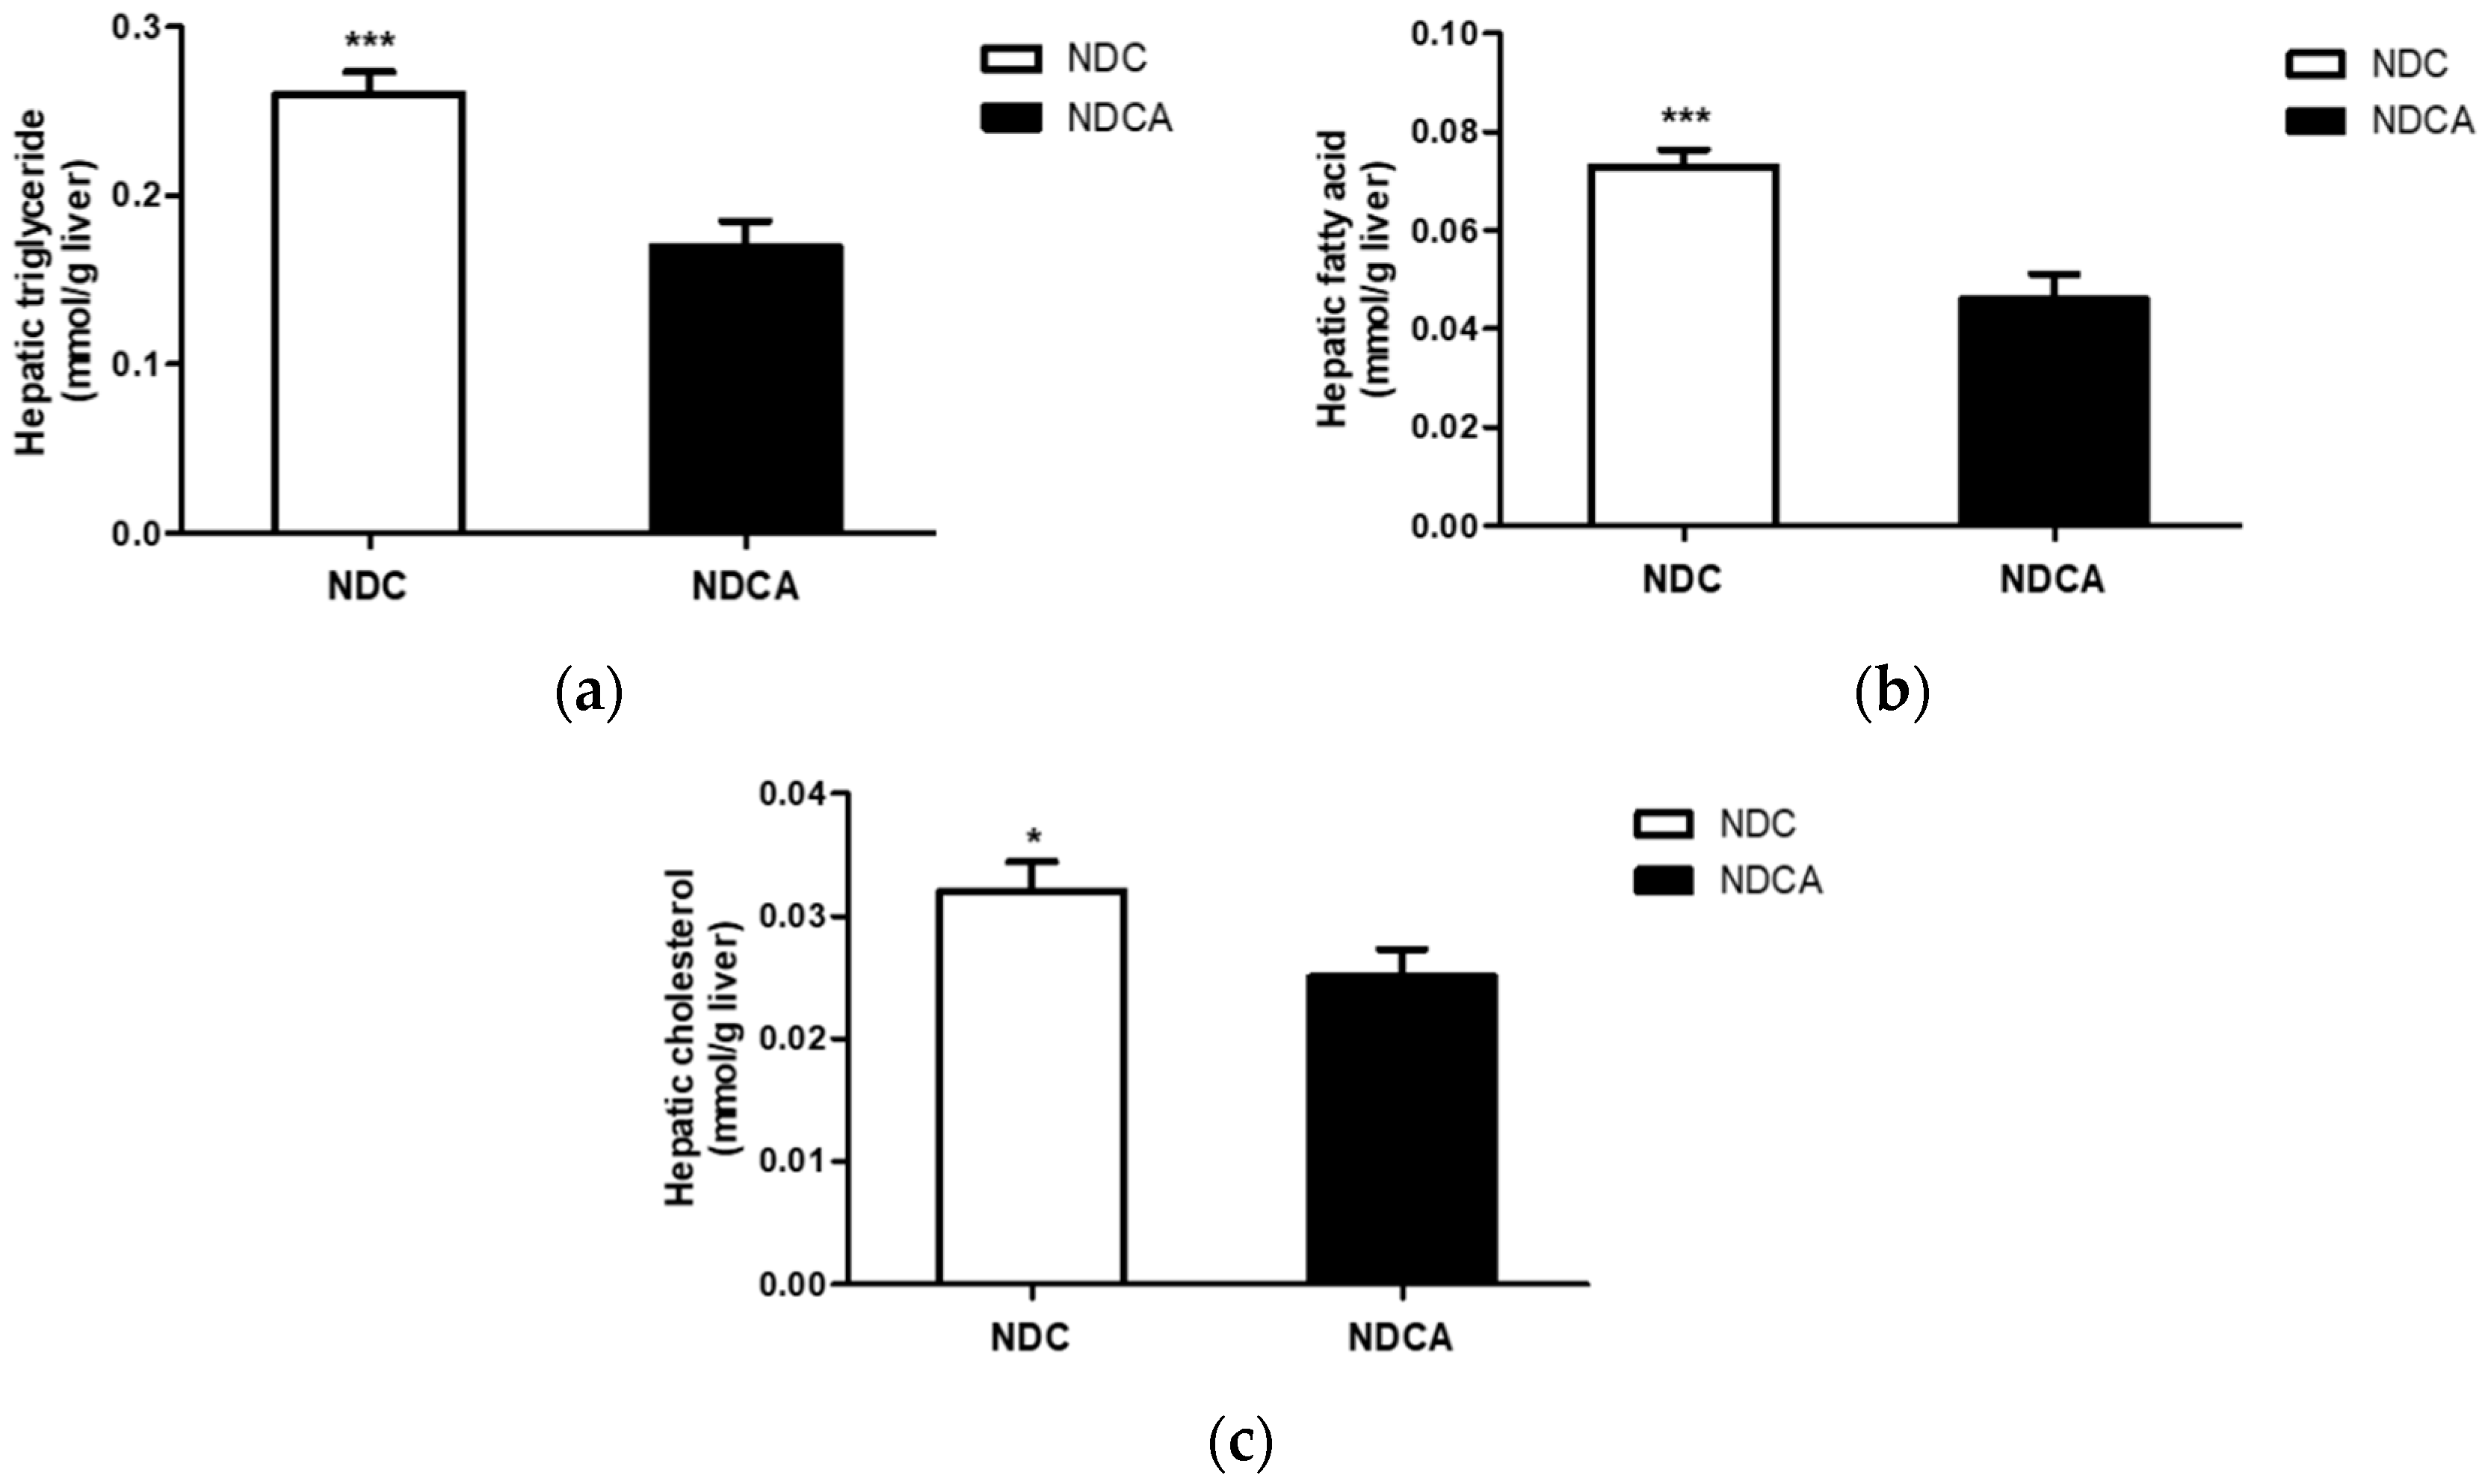
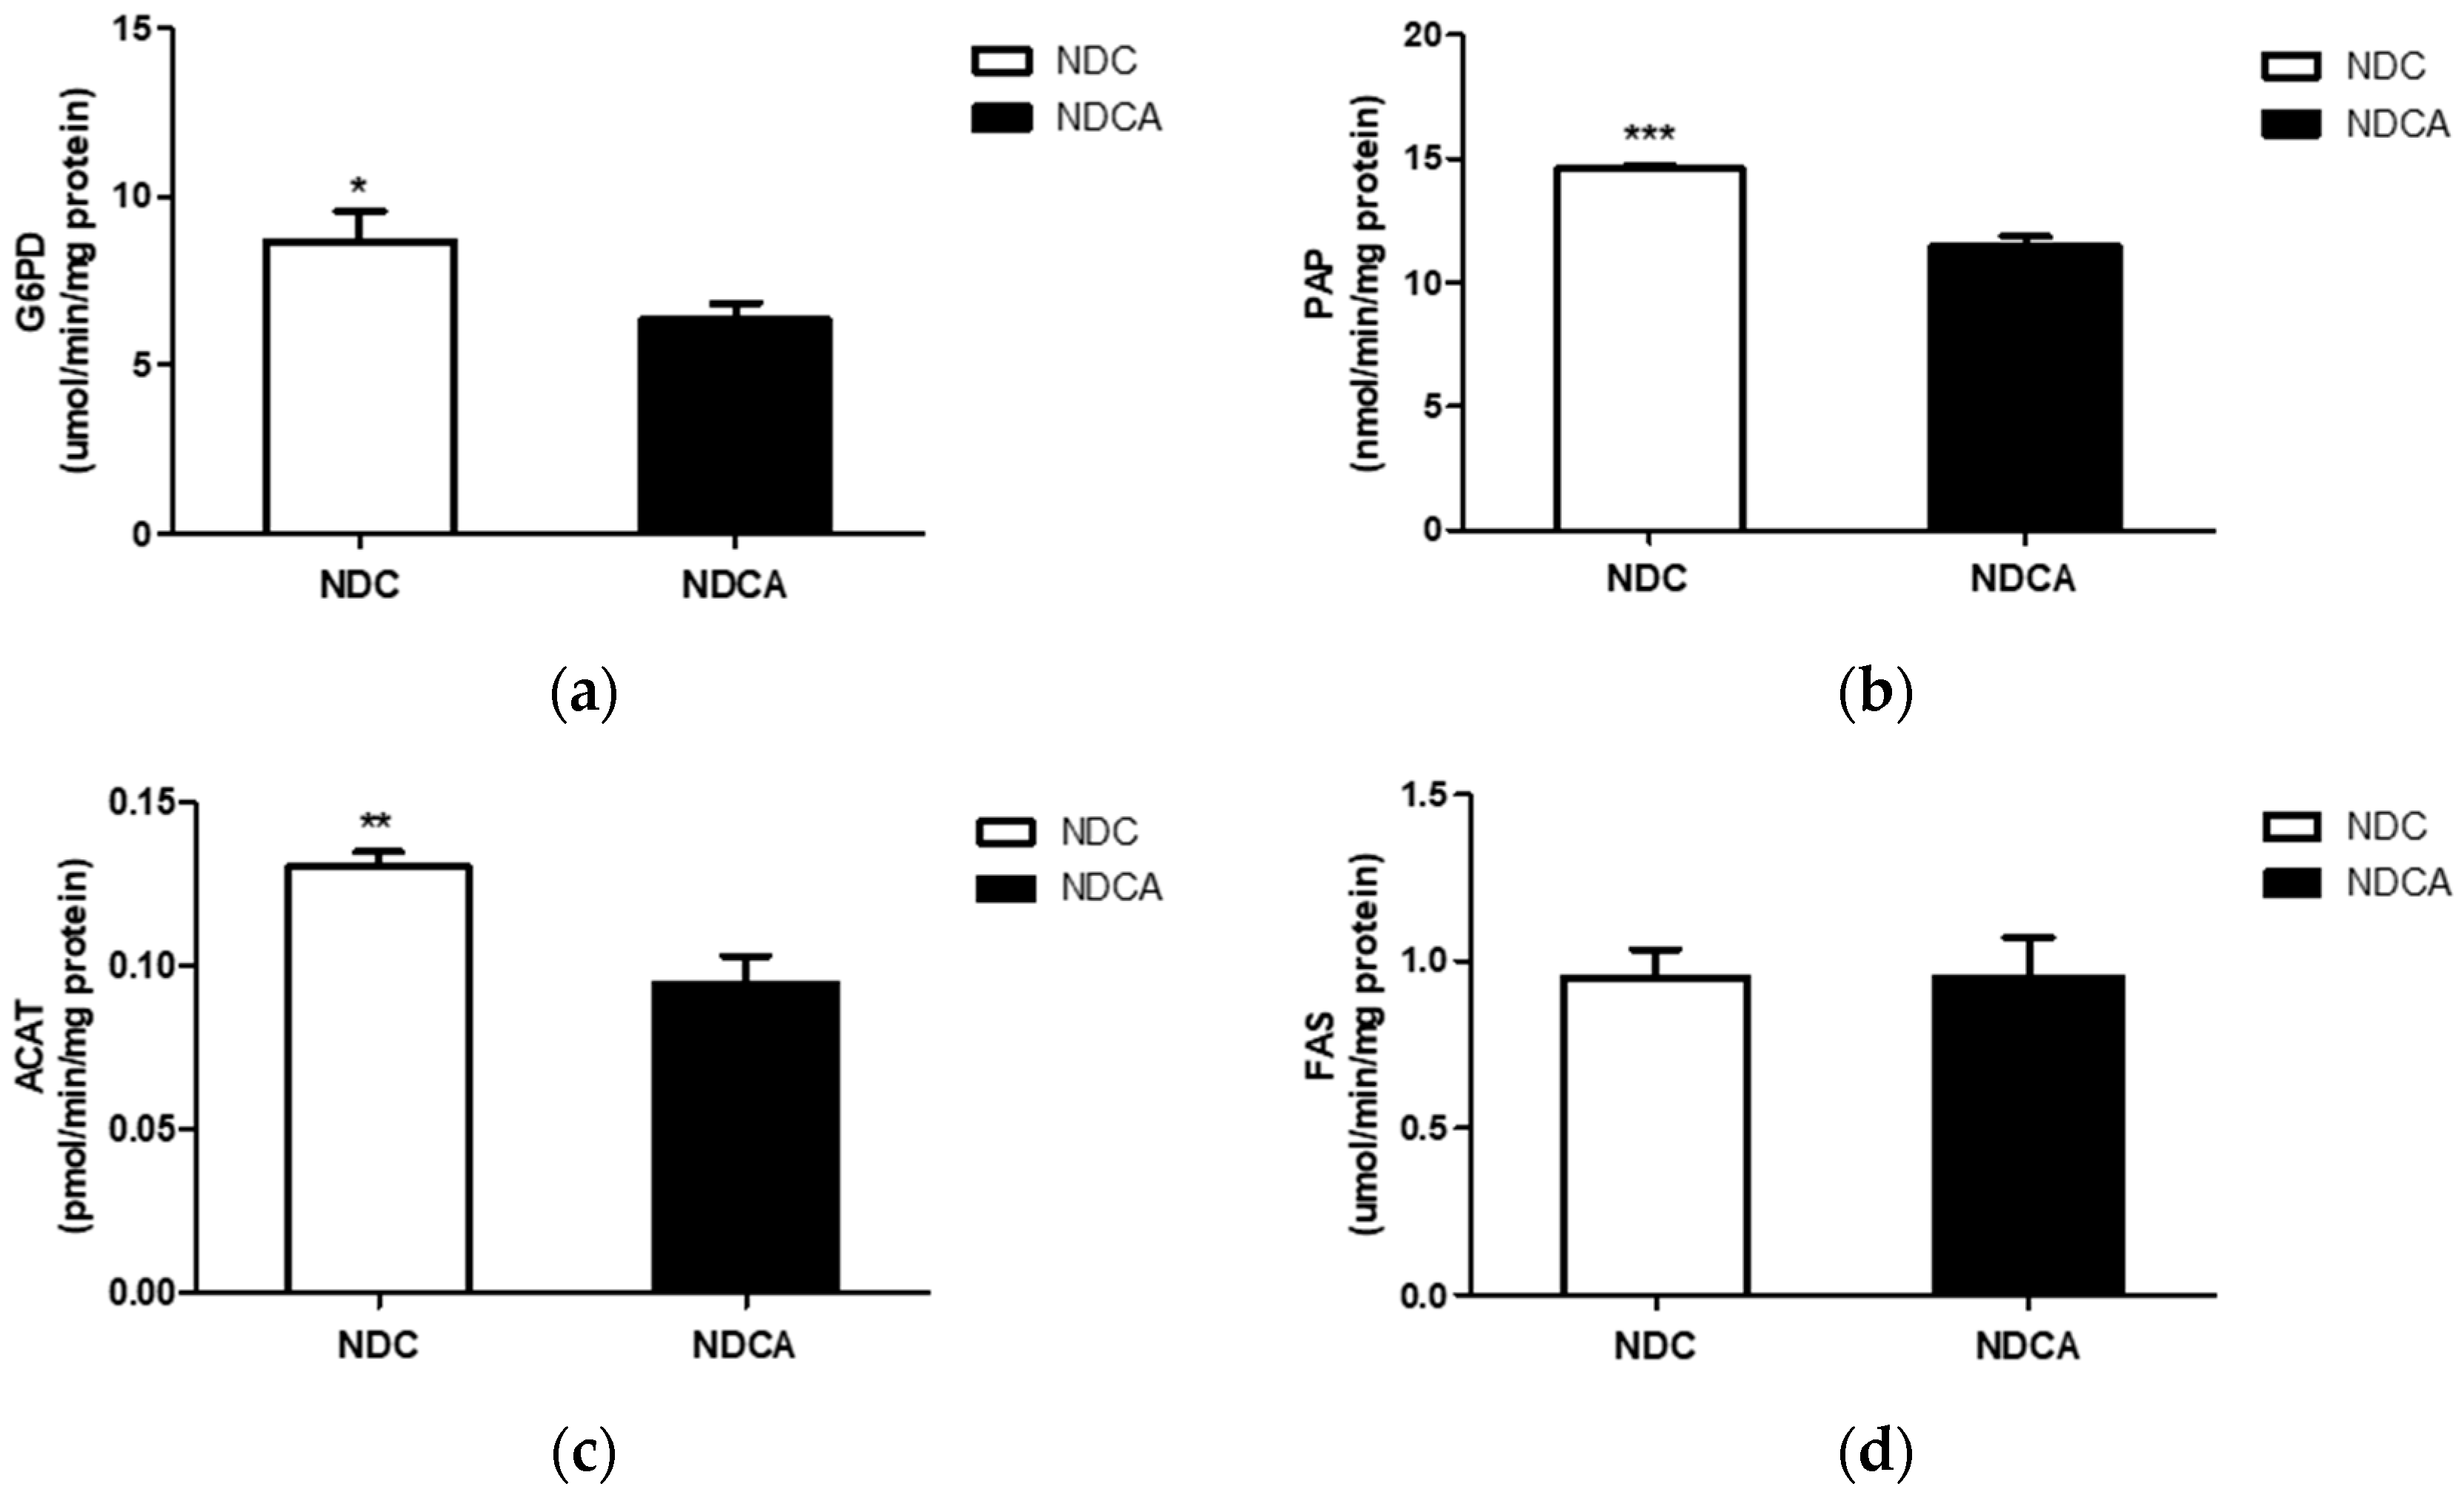
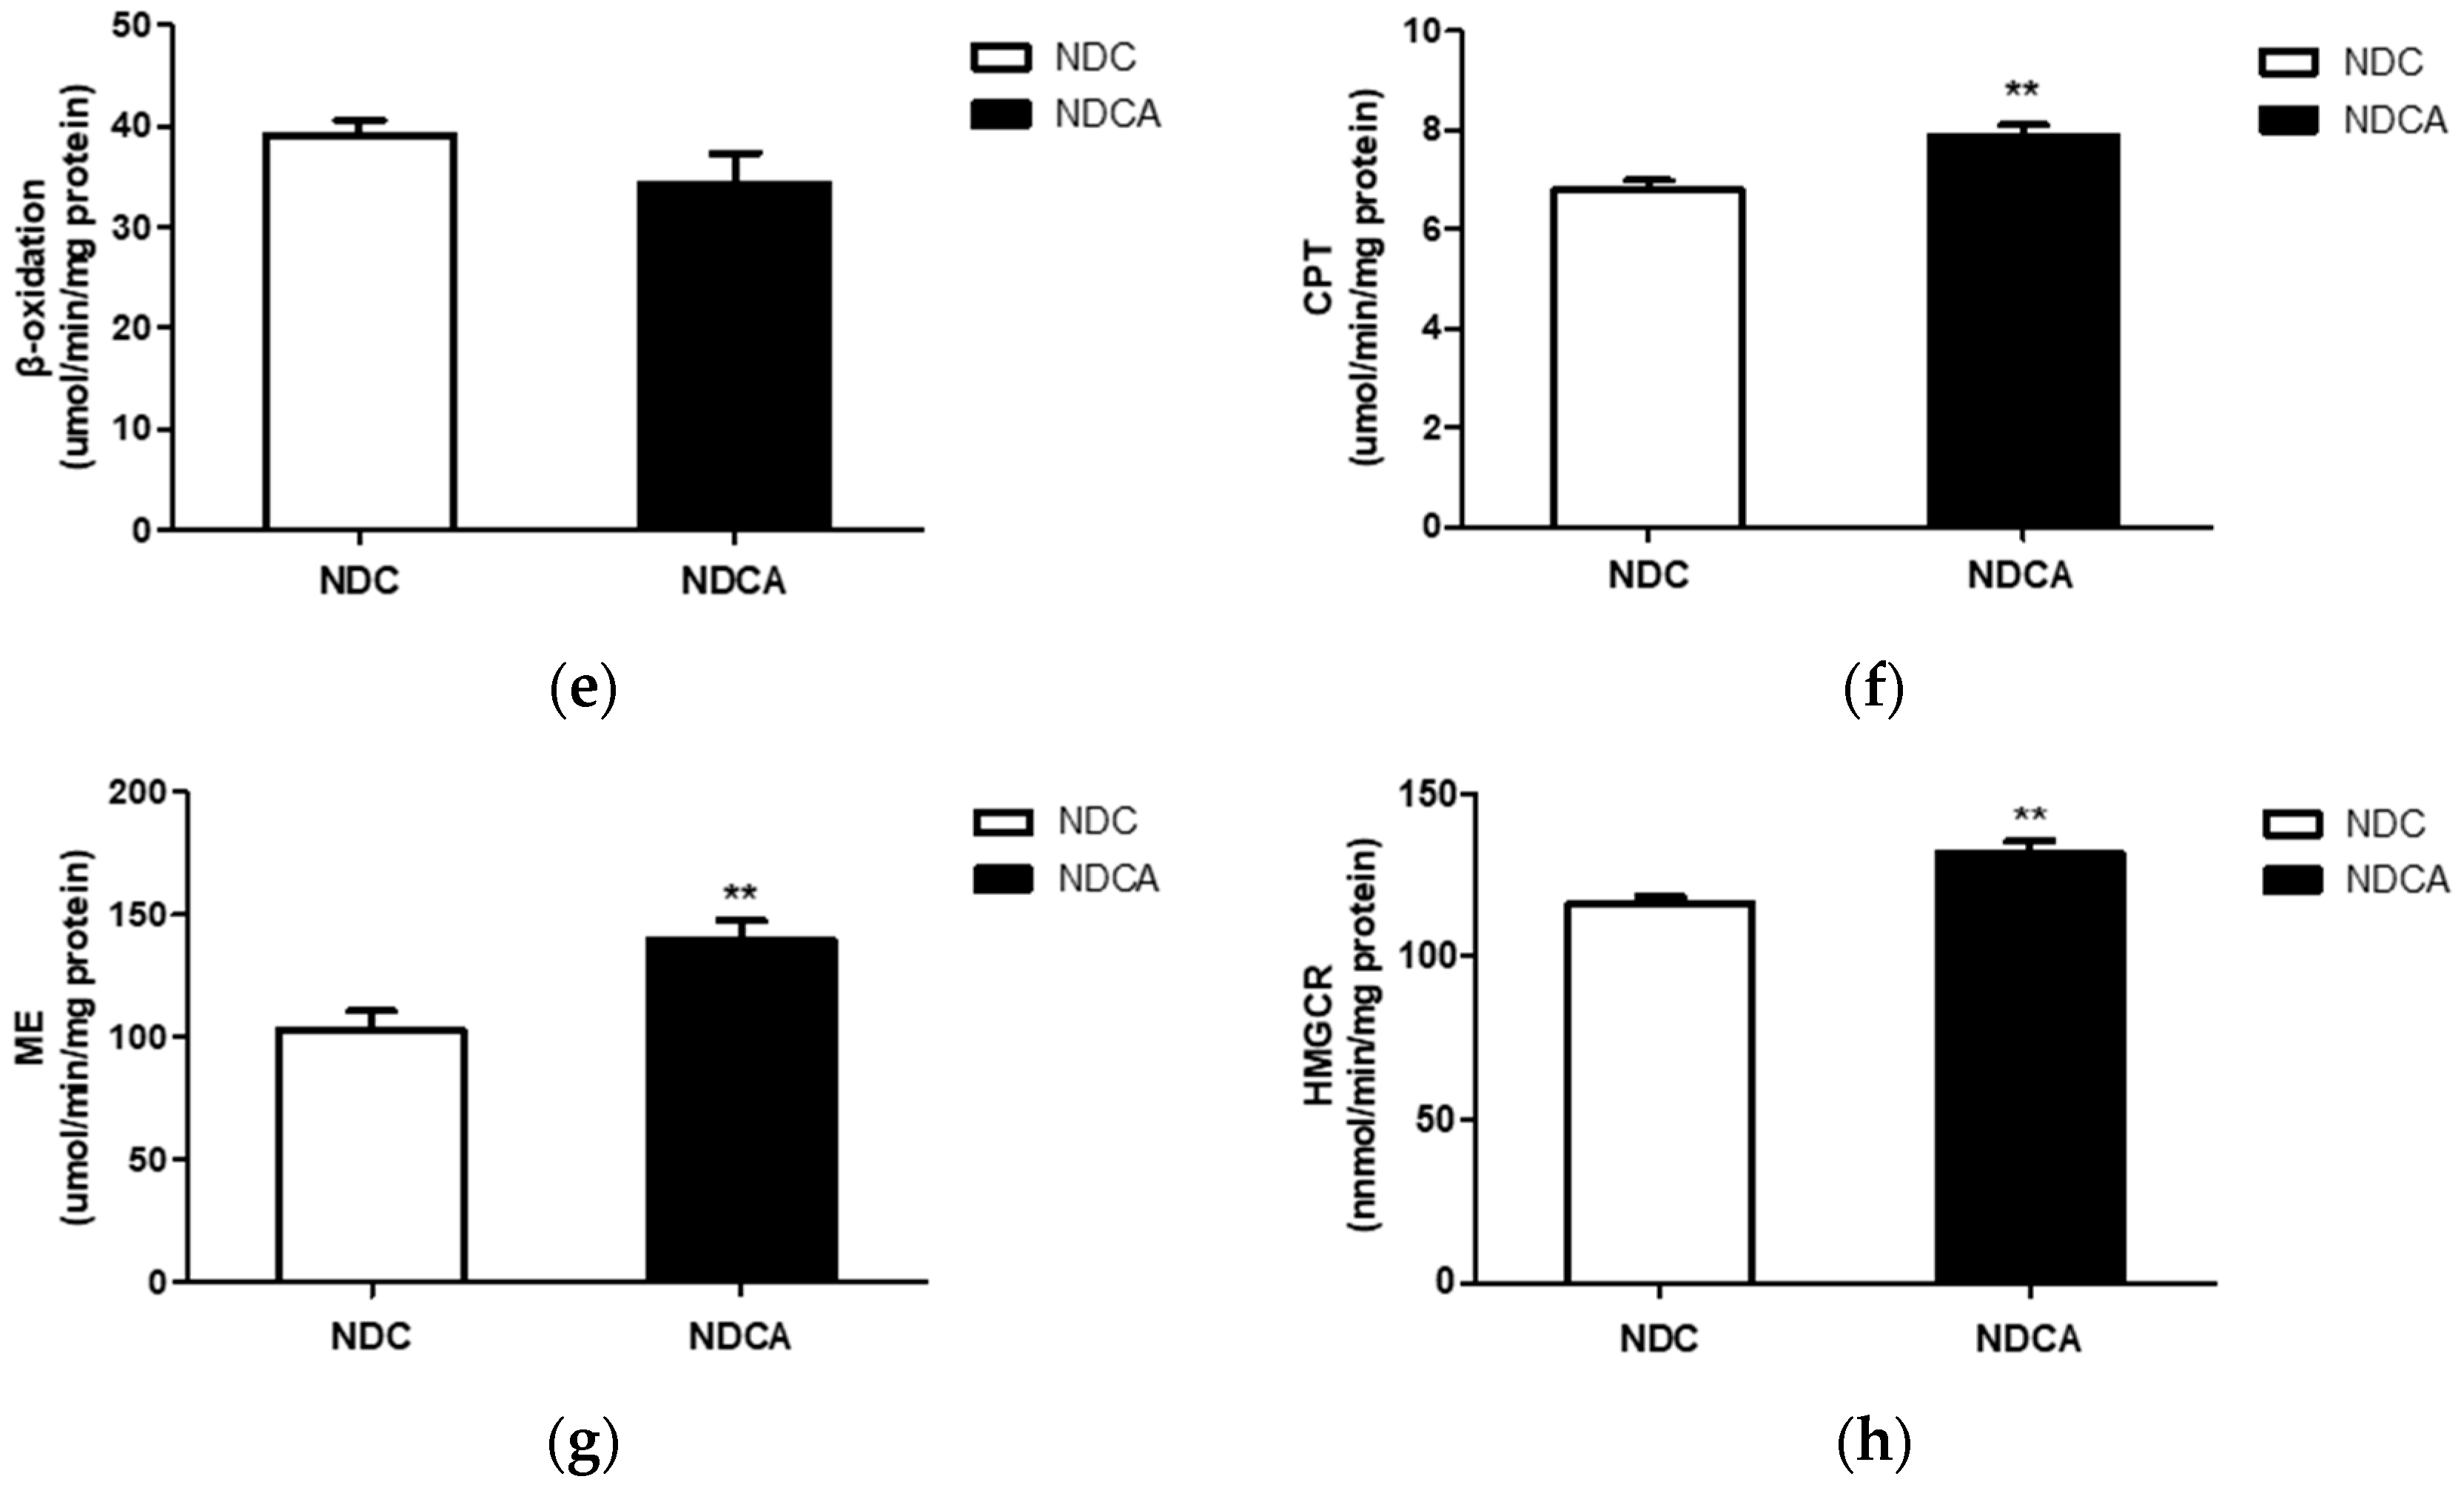
The NDCA group showed significantly lower hepatic TG, fatty acid, and cholesterol contents than the NDC group (Figure 5a–c). For lipid-regulating enzyme activities in the liver, glucose-6-phosphate dehydrogenase, PAP, and ACAT activities were significantly elevated in the NDC group compared with the NDCA group (Figure 6a–c). In contrast, the NDCA group showed significantly elevated CPT, ME, and HMGCR activities compared with the NDC group (Figure 6f–h). FAS and β-oxidation activities did not differ between groups (Figure 6d,e).
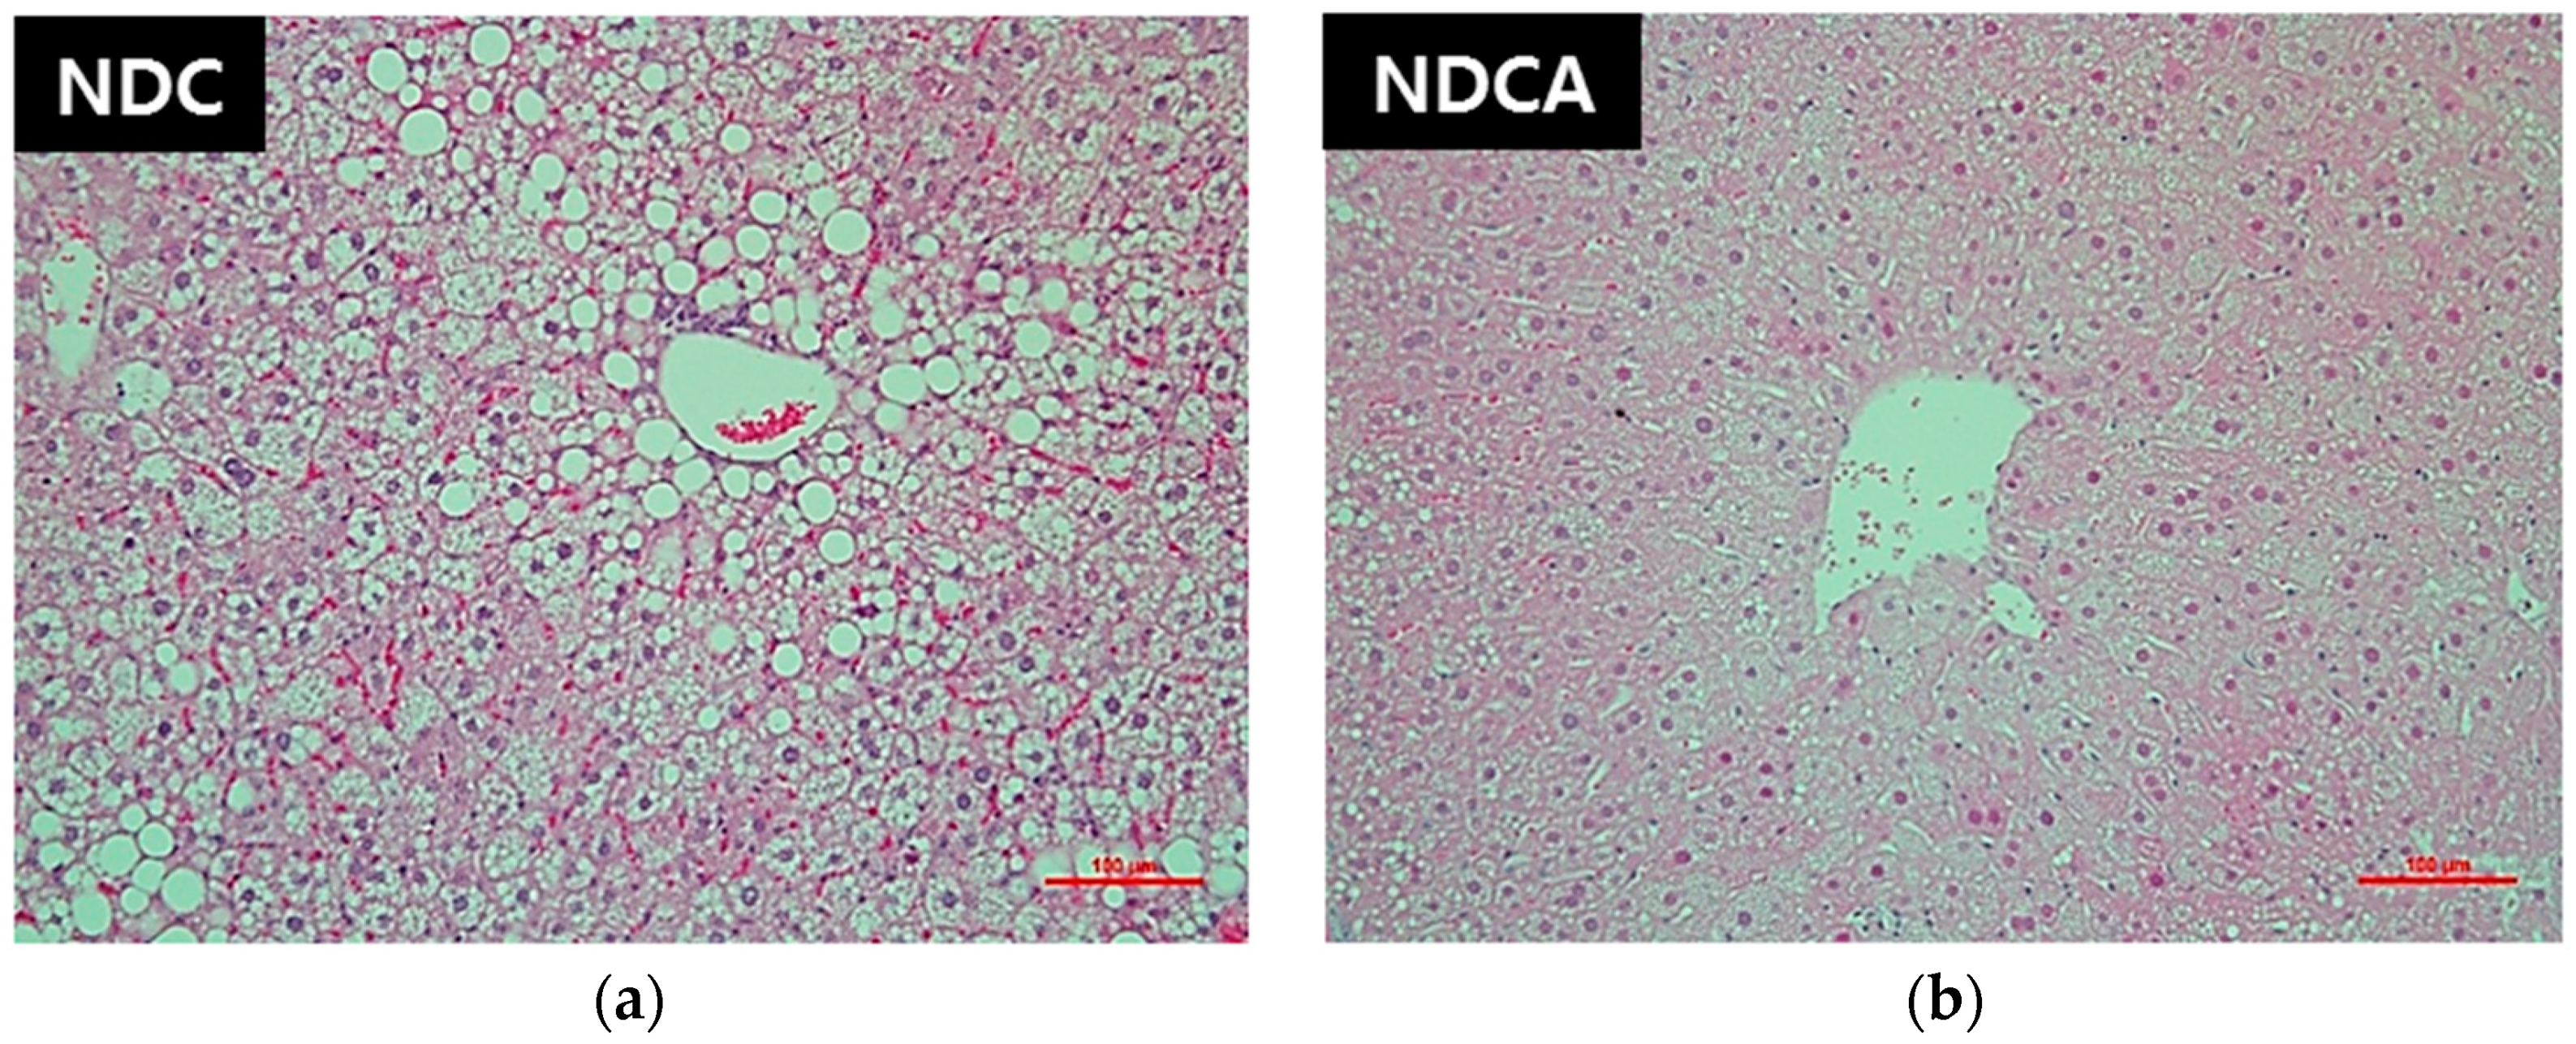
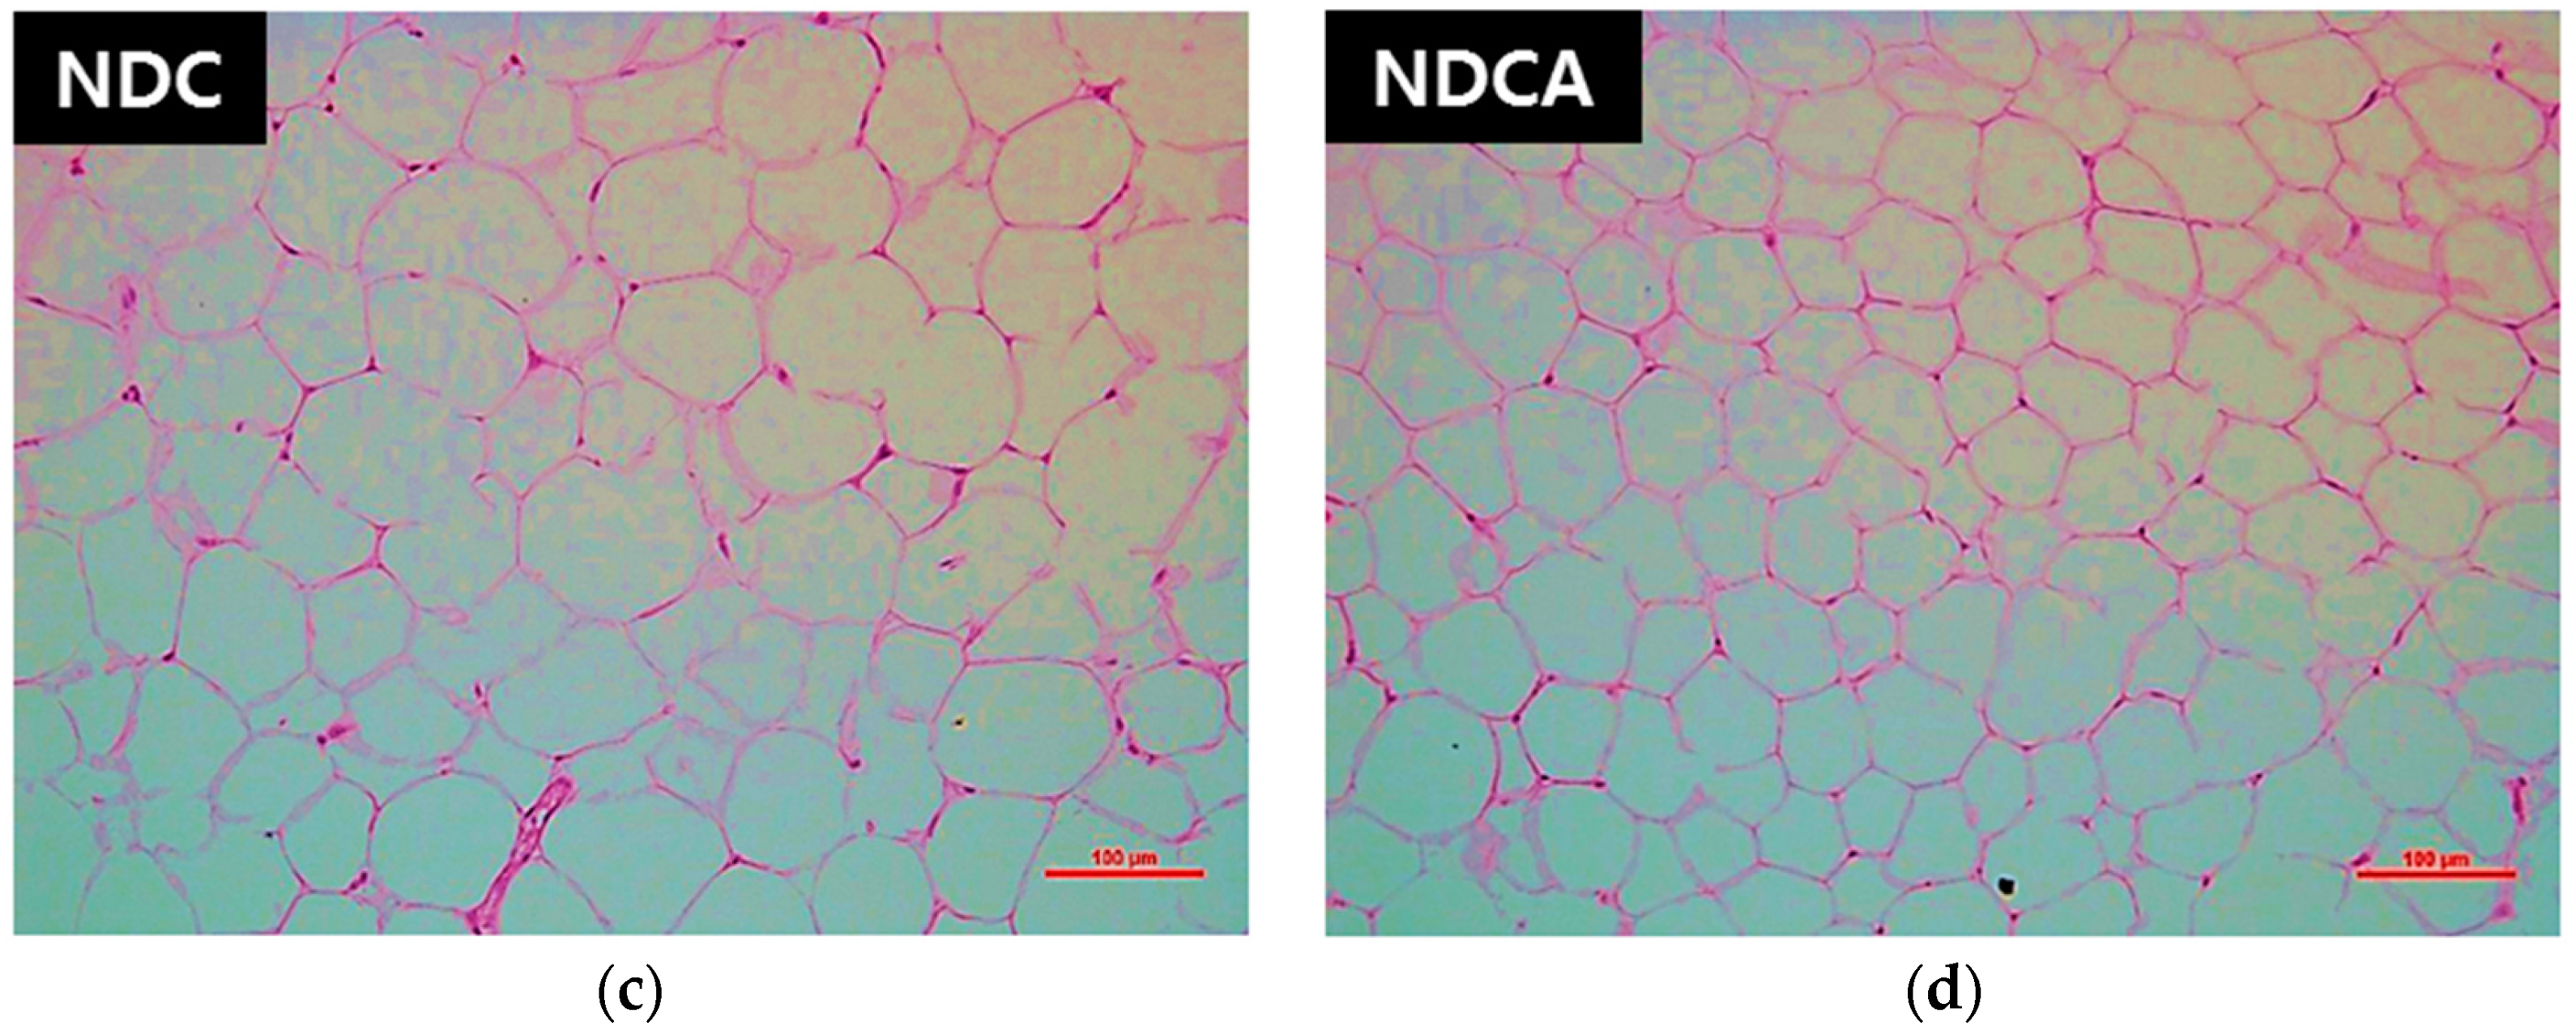
Hepatic tissue stained with hematoxylin and eosin showed larger sizes and greater numbers of lipid droplets in the NDC than NDCA group (Figure 7a,b). Additionally, epididymal adipocyte size was remarkably larger in the NDC group than in the NDCA group (Figure 7c,d).

3.5. Plasma Adipokines and Cytokines

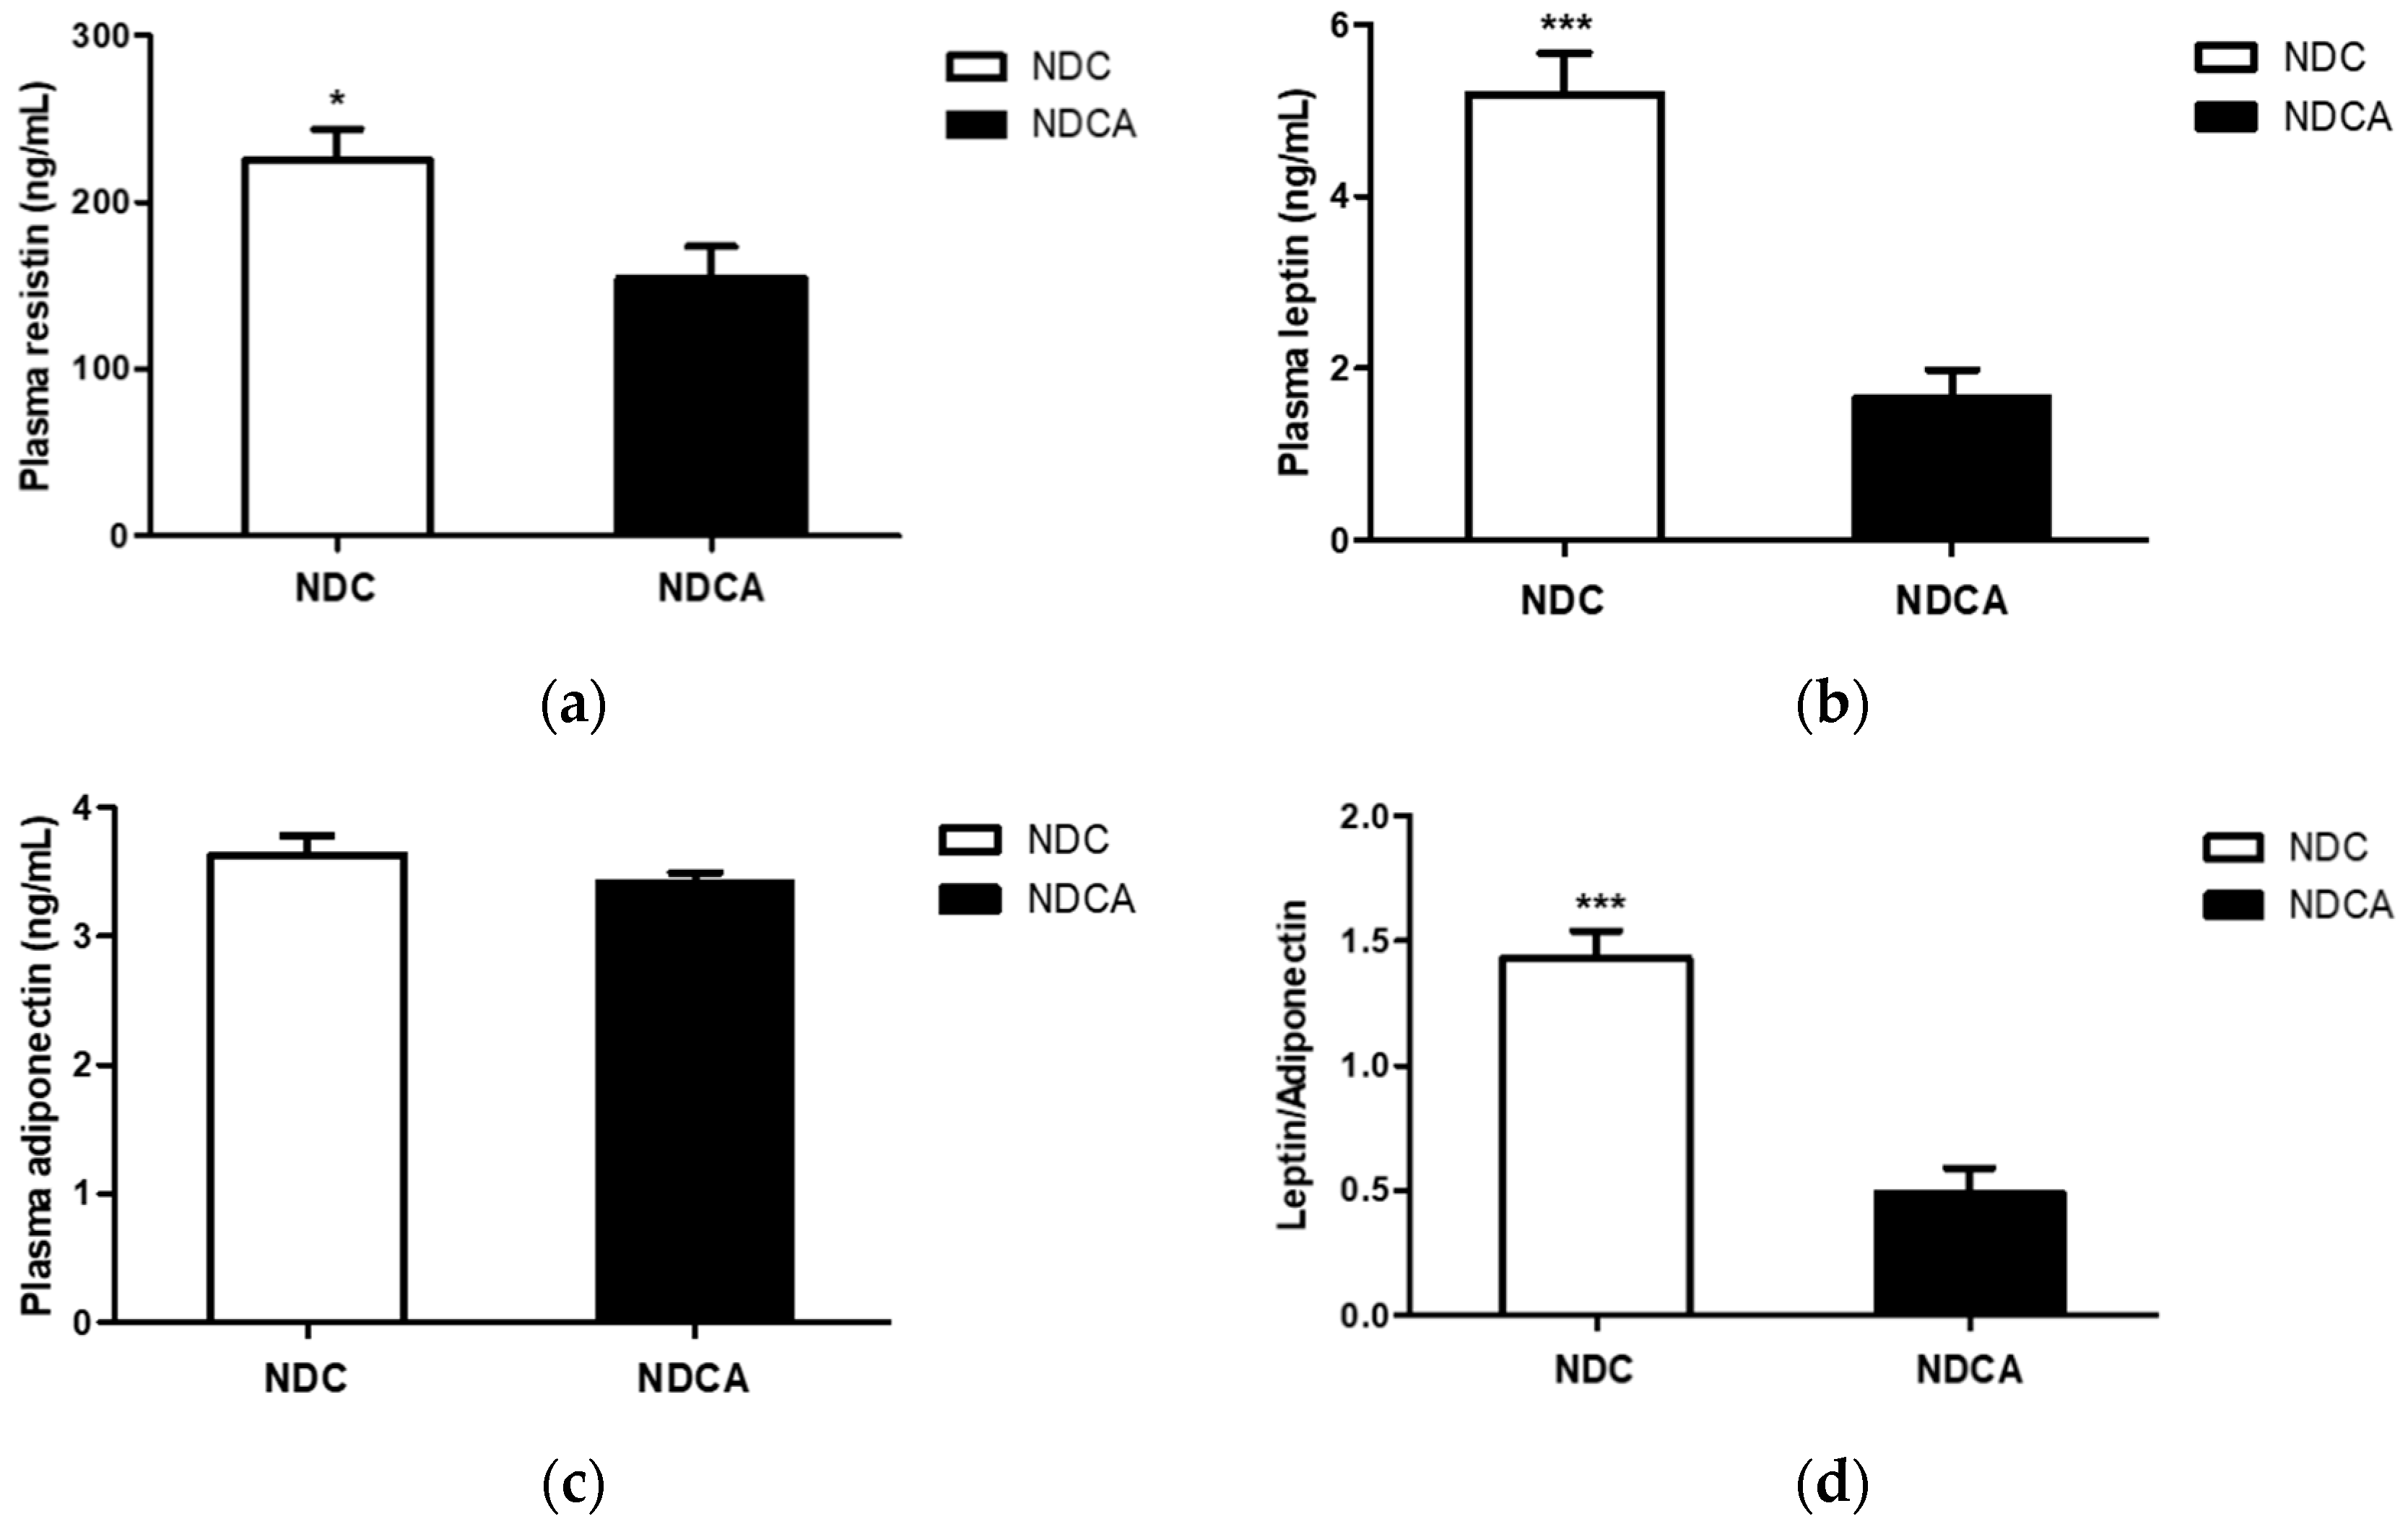
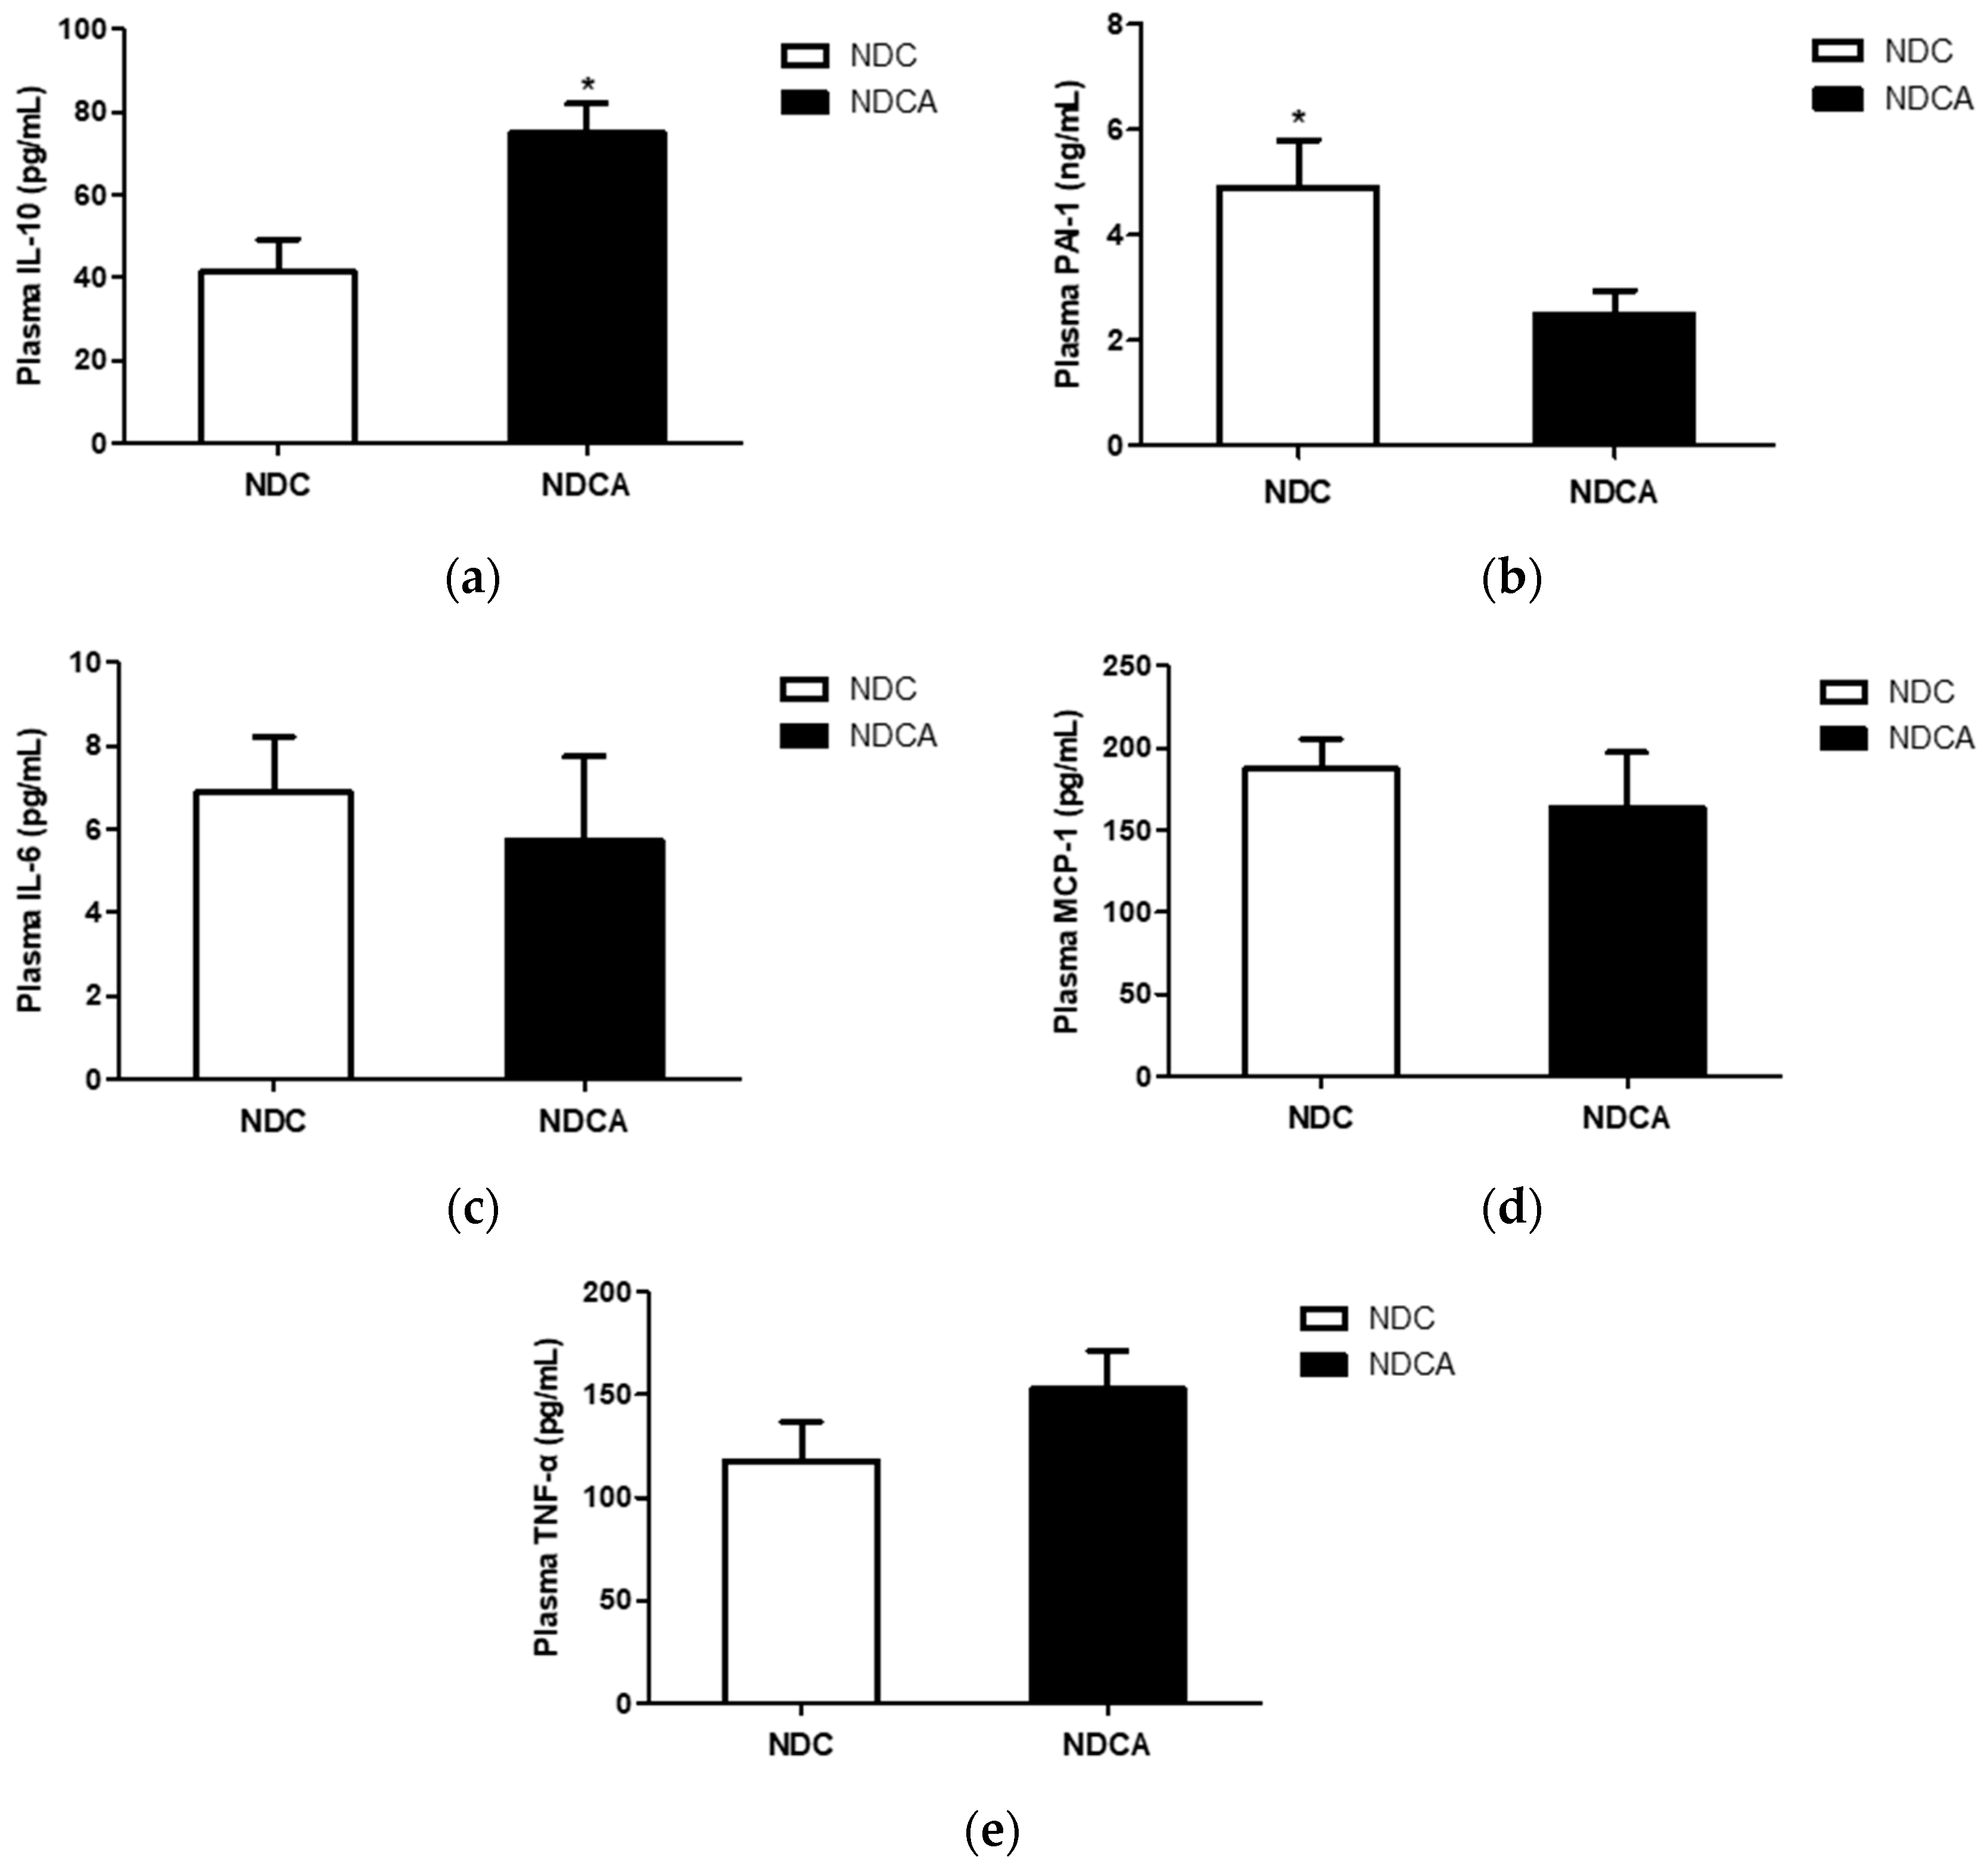
The NDCA diet led to significantly lower plasma resistin and leptin levels and leptin-to-adiponectin ratio compared with the NDC diet (Figure 8a,b,d), although plasma adiponectin was not affected (Figure 8c). IL-10, an anti-inflammatory factor in the plasma, was lower in the NDCA group than in the NDC group (Figure 9a). Interestingly, PAI-1, a pro-inflammatory factor, was significantly lower in the NDCA group than in the NDC group (Figure 9b). There were no differences in IL-6, monocyte chemoattractant protein-1, and tumor necrosis factor-α levels between groups (Figure 9c–e).

4. Discussion

Most sweeteners are rapidly digestible. However, consumption of excess sucrose and high-concentrated fructose have negative health effects on body weight and body fat control. Consequently, there is a growing interest in identifying sugar substitutes to be used as sweeteners. D-allulose, a zero-energy sweetener, shows physiological effects, such as reducing body fat, and so has been widely studied. However, the possible interactive effects of D-allulose and non-dairy creamer are unknown.
The major fatty acids in non-dairy creamer are lauric acid, myristic acid, stearic acid, and palmitic acid, which are saturated fatty acids. Lauric acid and myristic acid mainly account for approximately half of the fatty acid content in coconut milk, coconut oil, and palm kernel oil. As previously reported, a high intake of lauric acid increases very low-density lipoprotein cholesterol concentrations in healthy young women [22], and a high intake of myristic acid and palmitic acid lead to high LDL cholesterol and apolipoprotein B levels, with low HDL-to-LDL ratios in humans [23]. Among the saturated fatty acids, stearic acid and palmitic acid are known to have harmful physiological impacts. Consumption of high levels of palmitic acid can induce pro-inflammatory responses and leptin resistance, which are associated with energy homeostasis disorders in the liver as a result of diet-induced obesity [24] and increase the risk of developing cardiovascular disease by increasing LDL levels in the blood [25]. Stearic acid can induce lipotoxicity and apoptosis in pancreatic beta cells and progression to type 2 diabetes [26]. Thus, inhibiting the absorption of these saturated fats may prevent the diseases caused by the high intake of saturated fats.
In this study, using C57BL/6J mice that are susceptible to diet-induced obesity and share characteristics of human obesity compared with genetically obese animals [27], we confirmed that D-allulose prevented body fat accumulation during feeding of high dietary fat and hydrogenated palm oil-based non-dairy creamer.

4.1. D-Allulose Increased Fecal Lipid Excretion and Improved Plasma Lipid Profile

Dietary fats mainly include TG, sterols, and phospholipids [28], and is mostly degraded in the small intestine into fatty acids, monoglyceride, and free cholesterol by digestive enzymes. Increasing lipid excretion by limiting dietary fat absorption can partly decrease intestinal lipid absorption. In this study, D-allulose supplementation elevated lipid excretion, such as fecal fatty acids and TG, when added to an HFD enriched with hydrogenated palm oil.
It is plausible that as fecal lipid levels increase, dietary fat absorption decreases. This idea is partially supported by our results, showing that the expression of lipid absorption factors in the small intestinal epithelial cell lining was decreased. Among the lipid absorption factors measured, CD36, which acts as a bridge in the process of free fatty acid absorption [29], is upregulated by the presence of dietary fats in diabetes mellitus and genetic obesity [30]. Intestinal overexpression of SRB1, localized at the apical and basolateral membranes of enterocytes [31], leads to increased cholesterol, free fatty acid, and TG absorption [32]. ABCA1 is a major regulator of cellular cholesterol and phospholipid homeostasis, by mediating the efflux of cholesterol and phospholipids to lipid-poor apolipoproteins (apolipoprotein A-1 and apolipoprotein E), and ABCA1 is present in high quantities in tissues involved in lipid turnover, such as the liver, small intestine, and adipose tissue. NPC1L1, a glycosylated protein located in the brush-border membrane of enterocytes, acts as a cholesterol uptake transporter [33].
In the present study, the mRNA expressions of SRB1 and NPC1L1 in the small intestine were significantly decreased by D-allulose supplementation in the NDCA group. However, mRNA expression levels of CD36, ABCA1, and FAS in the small intestine were not different. This study involved feeding of a high-fat diet for 8 weeks. In a previous 16-week trial in C57BL/6J mice, D-allulose supplementation of an HFD revealed that small intestinal mRNA expression of factors related to lipid-regulatory absorption, such as CD36, ATP-binding cassette sub-family G member 5, ATP-binding cassette sub-family G member 8, and fatty acid transporter 4, was significantly decreased and the fecal cholesterol level was increased compared with the groups fed sugar substrates, such as erythritol, glucose, and fructose [7]. If the supplementation with allulose is prolonged, lipid absorption may continuously decrease, with the excretion of more lipids, and the mRNA expression of lipid absorption factors may decrease in the small intestine. These actions may have partly contributed to suppressing body weight gain and body fat accumulation in the NDCA group compared with the NDC group.
Thermogenesis is a metabolic process during which the body produces heat by using energy sources from the simultaneous occurrence of lipolysis or glycolysis. Thus, thermogenesis can promote body fat reduction and weight loss. UCP1 (thermogenin), a major thermogenic factor, is found in the mitochondria of BAT where it provides a mechanism for the enormous heat-generating capacity of the tissue [34]. UCP1 can generate heat by non-shivering thermogenesis and makes a quantitatively important contribution to countering heat loss in neonates, which would otherwise occur because of their high surface area-to-volume ratio. Also, activation of UCP1 in BAT is considered a promising new therapeutic avenue to combat hypertriglyceridemia and obesity [35,36]. The rectal temperature in the NDCA group was significantly increased at 9 p.m., the time at which mice were most active. Interestingly, the weight of interscapular BAT was lowered by the NDCA diet while the mRNA expression levels of UCP1 and SIRT1 were upregulated in BAT by the NDCA diet. These results partly explain the increased rectal temperature observed in the NDCA group.
In general, increased lipid excretion can affect blood glucose and plasma lipid profiles, via the energy balance. Plasma TG and glucose levels, as well as fasting blood glucose levels, were significantly reduced in the NDCA group compared with the NDC group. Particularly, the reduction of fasting blood glucose and plasma TG levels was prolonged until the final week. Fecal and plasma cholesterol levels were not changed by D-allulose supplementation in this experiment. These results may be related to a relatively short duration (8 weeks) of this study when compared to a previous 16-week trial in C57BL/6J mice. Long-term supplementation of D-allulose for at least 16 weeks or longer period in mice fed an HFD would be effective in increasing fecal cholesterol level and reducing plasma cholesterol level.

4.2. D-Allulose Altered Hepatic Lipid-Regulating Enzyme Activity and Tissue Fat Accumulation

As for the liver enzyme activities related to lipid metabolism, ME was upregulated by allulose in the NDCA diet because of the reaction of malate to pyruvate, which replenishes the Krebs cycle intermediates. Additionally, the NDCA diet elevated the levels of CPT, which converts fatty acids into acetyl-CoA for fatty acid oxidation. Furthermore, the activity of PAP, which may suppress TG synthesis, was decreased by the NDCA diet. HMGCR, a major rate-limiting enzyme in cholesterol synthesis, was increased in the NDCA group, which may be related to cholesterol homeostasis through the liver cholesterol reduction by allulose. ACAT activity, which promotes cholesterol storage by esterification of free cholesterol, was reduced by the NDCA diet. These results correspond to the hepatic cholesterol reduction in the NDCA group. Along with these metabolic processes induced by D-allulose supplementation in the non-dairy creamer-enriched HFD, body fat accumulation was suppressed, and adipocyte size and lipid droplets were reduced in the liver. These findings suggest that D-allulose ameliorated NAFLD by limiting hepatic lipid availability by activation of FA oxidation and fecal excretion of lipids, and by decreasing de novo TG synthesis, which is partially linked with the reduction of plasma TG level by D-allulose supplementation.

4.3. D-Allulose Reduced Plasma Pro-inflammatory Adipokine Levels

D-allulose in the non-dairy creamer-enriched HFD affected the levels of plasma adipokines, such as resistin and leptin, with were significantly lowered, along with the leptin-to-resistin ratio, by the NDCA diet, although adiponectin was not affected. The major function of leptin is to regulate adipose tissue mass through central hypothalamus-mediated effects on hunger, food energy use, physical exercise, and energy balance. However, leptin secretion levels are paradoxically increased in obesity [37] because leptin shows declined sensitivity in obese conditions, resulting in an inability to detect satiety [38]. Resistin, an abundant cysteine peptide hormone produced in adipose tissue [39], plays a role in energy metabolism. Serum resistin levels are increased with increased adiposity and decreased with decreased adiposity [40]. Adiponectin modulates metabolic processes, including glucose regulation and fatty acid oxidation [41], and can suppress metabolic and independent risk factors of metabolic syndrome [42]. In general, adiponectin levels are altered by long-term dietary treatment.
In the present study, the plasma leptin and resistin levels, and the leptin-to-adiponectin ratio were significantly decreased accompanied by a decreased body and fat-pad mass and adipocyte size in the NDCA group compared with the NDC group.
Another plasma anti-inflammatory factor, IL-10, and the pro-inflammatory factor, PAI-1, were modulated by the inclusion of D-allulose in the non-dairy creamer-enriched HFD. White adipose tissue secretes pro-inflammatory factors [43] while D-allulose significantly improved obesity by suppressing adipose tissue accumulation and thereby reducing the secretion of inflammatory factors.

5. Conclusions

Supplementation of D-allulose in a non-dairy creamer-enriched HFD elevated fecal lipids by regulating lipid metabolism. Although the positive effect of D-allulose was previously demonstrated, this study is the first to show a possible interaction between D-allulose and non-dairy creamer in an HFD. Despite the relatively short 8-week duration in experimental animals, daily consumption of 5% D-allulose dramatically altered lipid excretion and lipid metabolism, and altered plasma adipokine levels. These findings indicate the potential applications of D-allulose in developing functional foods or medicinal food components for preventing body fat accumulation related to diets high in fat plus hydrogenated fats.

Author Contributions

G.Y.D. performed the experiments and analyzed the data; E.-Y.K. edited the manuscript. Y.J.K. and Y.H. helped perform the experiments. S.-B.K. and Y.H.K analyzed fatty acids. M.-S.C. supervised this work, had full access to all data, and, therefore takes full responsibility for the integrity of the results and accuracy of the data analysis.

Funding

This research was funded by the Korean government through the National Research Foundation of Korea, grant number NRF-2016R1A2B4011329; and the Ministry of Science, ICT, and Future Planning through the National Research Foundation.

Acknowledgments

All samples were provided by the CJ CheilJedang Corporation (Seoul, Korea).

Conflicts of Interest

The authors declare no conflict of interest.

References

  1. Aguilera, A.A.; Diaz, G.H.; Barcelata, M.L.; Guerrero, O.A.; Ros, R.M. Effects of fish oil on hypertension, plasma lipids, and tumor necrosis factor-α in rats with sucrose-induced metabolic syndrome. J. Nutr. Biochem. 2004, 15, 350–357. [Google Scholar] [CrossRef] [PubMed]
  2. Lawlor, D.A.; Smith, G.D.; Ebrahim, S. Socioeconomic position and hormone replacement therapy use: Explaining the discrepancy in evidence from observational and randomized controlled trials. Am. J. Public Health 2004, 94, 2149–2154. [Google Scholar] [CrossRef] [PubMed]
  3. Lombardo, Y.B.; Drago, S.; Chicco, A.; Fainstein-Day, P.; Gutman, R.; Gagliardino, J.J.; Gomez Dumm, C.L. Long-term administration of a sucrose-rich diet to normal rats: Relationship between metabolic and hormonal profiles and morphological changes in the endocrine pancreas. Metabolism 1996, 45, 1527–1532. [Google Scholar] [CrossRef]
  4. Ten, S.; Maclaren, N. Insulin resistance syndrome in children. J. Clin. Endocrinol. Metab. 2004, 89, 2526–2539. [Google Scholar] [CrossRef] [PubMed]
  5. Chung, M.Y.; Oh, D.K.; Lee, K.W. Hypoglycemic health benefits of D-psicose. J. Agric. Food Chem. 2012, 60, 863–869. [Google Scholar] [CrossRef] [PubMed]
  6. Itoh, K.; Mizuno, S.; Hama, S.; Oshima, W.; Kawamata, M.; Hossain, A.; Ishihara, Y.; Tokuda, M. Beneficial effects of supplementation of the rare sugar “D-allulose” against hepatic steatosis and severe obesity in Lepob/Lepob mice. J. Food Sci. 2015, 80, H1619–H1626. [Google Scholar] [CrossRef] [PubMed]
  7. Han, Y.; Han, H.J.; Kim, A.H.; Choi, J.Y.; Cho, S.J.; Park, Y.B.; Jung, U.J.; Choi, M.S. D-Allulose supplementation normalized the body weight and fat-pad mass in diet-induced obese mice via the regulation of lipid metabolism under isocaloric fed condition. Mol. Nutr. Food Res. 2016, 60, 1695–1706. [Google Scholar] [CrossRef] [PubMed]
  8. Sacks, F.M.; Lichtenstein, A.H.; Wu, J.H.Y.; Appel, L.J.; Creager, M.A.; Kris-Etherton, P.M.; Miller, M.; Rimm, E.B.; Rudel, L.L.; Robinson, J.G.; et al. Dietary fats and cardiovascular disease: A presidential advisory from the American Heart Association. Circulation 2017, 136, e1–e23. [Google Scholar] [CrossRef]
  9. Loganathan, R., Jr.; Selvaduray, K.R.; Nesaretnam, K.; Radhakrishnan, A.K. Health promoting effects of phytonutrients found in palm oil. Malays. J. Nutr. 2010, 16, 309–322. [Google Scholar]
  10. Folch, J.; Ascoli, I.; Lees, M.; Meath, J.A.; Le, B.N. Preparation of lipide extracts from brain tissue. J. Biol. Chem. 1951, 191, 833–841. [Google Scholar]
  11. Hulcher, F.H.; Oleson, W.H. Simplified spectrophotometric assay for microsomal 3-hydroxy-3-methylglutaryl CoA reductase by measurement of coenzyme A. J. Lipid Res. 1973, 14, 625–631. [Google Scholar] [PubMed]
  12. Nepokroeff, C.M.; Lakshmanan, M.R.; Porter, J.W. Fatty acid synthase from rat liver. Methods Enzymol. 1975, 35, 37–44. [Google Scholar] [PubMed]
  13. Lazarow, P.B. Assay of peroxisomal β-oxidation of fatty acids. Methods Enzymol. 1981, 72, 315–319. [Google Scholar] [PubMed]
  14. Markwell, M.A.; McGroarty, E.J.; Bieber, L.L.; Tolbert, N.E. The subcellular distribution of carnitine acyltransferases in mammalian liver and kidney. A new peroxisomal enzyme. J. Biol. Chem. 1973, 248, 3426–3432. [Google Scholar] [PubMed]
  15. Pitkanen, E.; Pitkanen, O.; Uotila, L. Enzymatic determination of unbound D-mannose in serum. Eur. J. Clin. Chem. Clin. Biochem. 1997, 35, 761–766. [Google Scholar] [CrossRef] [PubMed]
  16. Grunberg-Manago, M.; Oritz, P.J.; Ochoa, S. Enzymatic synthesis of nucleic acidlike polynucleotides. Science 1955, 122, 907–910. [Google Scholar] [CrossRef]
  17. Walton, P.A.; Possmayer, F. Mg2+-dependent phosphatidate phosphohydrolase of rat lung: Development of an assay employing a defined chemical substrate which reflects the phosphohydrolase activity measured using membrane-bound substrate. Anal. Biochem. 1985, 151, 479–486. [Google Scholar] [CrossRef]
  18. Gillies, P.J.; Rathgeb, K.A.; Perri, M.A.; Robinson, C.S. Regulation of acyl-CoA: Cholesterol acyltransferase activity in normal and atherosclerotic rabbit aortas: Role of a cholesterol substrate pool. Exp. Mol. Pathol. 1986, 44, 329–339. [Google Scholar] [CrossRef]
  19. Shapiro, D.J.; Nordstrom, J.L.; Mitschelen, J.J.; Rodwell, V.W.; Schimke, R.T. Micro assay for 3-hydroxy-3-methylglutaryl-CoA reductase in rat liver and in L-cell fibroblasts. Biochim. Biophys. Acta 1974, 370, 369–377. [Google Scholar] [CrossRef]
  20. Shin, S.K.; Ha, T.Y.; McGregor, R.A.; Choi, M.S. Long-term curcumin administration protects against atherosclerosis via hepatic regulation of lipoprotein cholesterol metabolism. Mol. Nutr. Food Res. 2011, 55, 1829–1840. [Google Scholar] [CrossRef]
  21. Drewnowski, A.; Specter, S.E. Poverty and obesity: The role of energy density and energy costs. Am. J. Clin. Nutr. 2004, 79, 6–16. [Google Scholar] [CrossRef] [PubMed]
  22. Schwab, U.S.; Niskanen, L.K.; Maliranta, H.M.; Savolainen, M.J.; Kesaniemi, Y.A.; Uusitupa, M.I. Lauric and palmitic acid-enriched diets have minimal impact on serum lipid and lipoprotein concentrations and glucose metabolism in healthy young women. J. Nutr. 1995, 125, 466–473. [Google Scholar] [PubMed]
  23. Zock, P.L.; de Vries, J.H.; Katan, M.B. Impact of myristic acid versus palmitic acid on serum lipid and lipoprotein levels in healthy women and men. Arterioscler. Thromb. 1994, 14, 567–575. [Google Scholar] [CrossRef] [PubMed]
  24. Cheng, L.; Yu, Y.; Szabo, A.; Wu, Y.; Wang, H.; Camer, D.; Huang, X.F. Palmitic acid induces central leptin resistance and impairs hepatic glucose and lipid metabolism in male mice. J. Nutr. Biochem. 2015, 26, 541–548. [Google Scholar] [CrossRef] [PubMed] [Green Version]
  25. Diet, Nutrition and the Prevention of Chronic Diseases; WHO Technical Report Series, No. 916; World Health Organization: Geneva, Switzerland, 2003; pp. 1–149.
  26. Lu, H.; Hao, L.; Li, S.; Lin, S.; Lv, L.; Chen, Y.; Cui, H.; Zi, T.; Chu, X.; Na, L.; et al. Elevated circulating stearic acid leads to a major lipotoxic effect on mouse pancreatic beta cells in hyperlipidaemia via a miR-34a-5p-mediated PERK/p53-dependent pathway. Diabetologia 2016, 59, 1247–1257. [Google Scholar] [CrossRef] [PubMed] [Green Version]
  27. Collins, S.; Martin, T.L.; Surwit, R.S.; Robidoux, J. Genetic vulnerability to diet-induced obesity in the C57BL/6J mouse: Physiological and molecular characteristics. Physiol. Behav. 2004, 81, 243–248. [Google Scholar] [CrossRef]
  28. Iqbal, J.; Hussain, M.M. Intestinal lipid absorption. Am. J. Physiol. Endocrinol. Metab. 2009, 296, E1183–E1194. [Google Scholar] [CrossRef] [Green Version]
  29. Poirier, H.; Degrace, P.; Niot, I.; Bernard, A.; Besnard, P. Localization and regulation of the putative membrane fatty-acid transporter (FAT) in the small intestine. Comparison with fatty acid-binding proteins (FABP). Eur. J. Biochem. 1996, 238, 368–373. [Google Scholar] [CrossRef]
  30. Greenwalt, D.E.; Scheck, S.H.; Rhinehart-Jones, T. Heart CD36 expression is increased in murine models of diabetes and in mice fed a high fat diet. J. Clin. Investig. 1995, 96, 1382–1388. [Google Scholar] [CrossRef]
  31. Cai, L.; Eckhardt, E.R.; Shi, W.; Zhao, Z.; Nasser, M.; de Villiers, W.J.; van der Westhuyzen, D.R. Scavenger receptor class B type I reduces cholesterol absorption in cultured enterocyte CaCo-2 cells. J. Lipid Res. 2004, 45, 253–262. [Google Scholar] [CrossRef] [Green Version]
  32. Bietrix, F.; Yan, D.; Nauze, M.; Rolland, C.; Bertrand-Michel, J.; Comera, C.; Schaak, S.; Barbaras, R.; Groen, A.K.; Perret, B.; et al. Accelerated lipid absorption in mice overexpressing intestinal SR-BI. J. Biol. Chem. 2006, 281, 7214–7219. [Google Scholar] [CrossRef] [PubMed]
  33. Iyer, S.P.; Yao, X.; Crona, J.H.; Hoos, L.M.; Tetzloff, G.; Davis, H.R., Jr.; Graziano, M.P.; Altmann, S.W. Characterization of the putative native and recombinant rat sterol transporter Niemann-Pick C1 Like 1 (NPC1L1) protein. Biochim. Biophys. Acta 2005, 1722, 282–292. [Google Scholar] [CrossRef] [PubMed]
  34. Fedorenko, A.; Lishko, P.V.; Kirichok, Y. Mechanism of fatty-acid-dependent UCP1 uncoupling in brown fat mitochondria. Cell 2012, 151, 400–413. [Google Scholar] [CrossRef] [PubMed]
  35. Bartelt, A.; Heeren, J. The holy grail of metabolic disease: Brown adipose tissue. Curr. Opin. Lipidol. 2012, 23, 190–195. [Google Scholar] [CrossRef] [PubMed]
  36. Harms, M.; Seale, P. Brown and beige fat: Development, function and therapeutic potential. Nat. Med. 2013, 19, 1252–1263. [Google Scholar] [CrossRef] [PubMed]
  37. Caro, J.F.; Sinha, M.K.; Kolaczynski, J.W.; Zhang, P.L.; Considine, R.V. Leptin: The tale of an obesity gene. Diabetes 1996, 45, 1455–1462. [Google Scholar] [CrossRef] [PubMed]
  38. Pan, H.; Guo, J.; Su, Z. Advances in understanding the interrelations between leptin resistance and obesity. Physiol. Behav. 2014, 130, 157–169. [Google Scholar] [CrossRef] [PubMed]
  39. Wang, H.; Chu, W.S.; Hemphill, C.; Elbein, S.C. Human resistin gene: Molecular scanning and evaluation of association with insulin sensitivity and type 2 diabetes in Caucasians. J. Clin. Endocrinol. Metab. 2002, 87, 2520–2524. [Google Scholar] [CrossRef] [PubMed]
  40. Valsamakis, G.; McTernan, P.G.; Chetty, R.; Al Daghri, N.; Field, A.; Hanif, W.; Barnett, A.H.; Kumar, S. Modest weight loss and reduction in waist circumference after medical treatment are associated with favorable changes in serum adipocytokines. Metabolism 2004, 53, 430–434. [Google Scholar] [CrossRef]
  41. Diez, J.J.; Iglesias, P. The role of the novel adipocyte-derived hormone adiponectin in human disease. Eur. J. Endocrinol. 2003, 148, 293–300. [Google Scholar] [CrossRef] [Green Version]
  42. Renaldi, O.; Pramono, B.; Sinorita, H.; Purnomo, L.B.; Asdie, R.H.; Asdie, A.H. Hypoadiponectinemia: A risk factor for metabolic syndrome. Acta Med. Indones. 2009, 41, 20–24. [Google Scholar] [PubMed]
  43. Gustafson, B.; Hammarstedt, A.; Andersson, C.X.; Smith, U. Inflamed adipose tissue: A culprit underlying the metabolic syndrome and atherosclerosis. Arterioscler. Thromb. Vasc. Biol. 2007, 27, 2276–2283. [Google Scholar] [CrossRef] [PubMed]
Figure 1. Effects of supplementation of non-dairy creamer-enriched high-fat diet with D-allulose on body weight, food efficiency ratio (FER; body weight gain/energy intake per day), and organ weights in C57BL/6J mice fed a high-fat diet for 8 weeks: (a) food intake; (b) energy intake; (c) body weight; (d) total body weight gain; (e) FER; (f) organ weight. Data are mean ± SE. Significant differences between the 5% D-allulose group and without D-allulose group are indicated; * p < 0.05, ** p < 0.01, *** p < 0.001. NDCA, high-fat diet with non-dairy creamer +5% D-allulose; NDC, high-fat diet with non-dairy creamer.
Applsci 09 02750 g001aApplsci 09 02750 g001b
Figure 2. Effect of supplementation of a non-dairy creamer-enriched high-fat diet with D-allulose on adipose tissue weights, rectum temperature, and mRNA expression of genes related to thermogenesis factor in brown adipose tissue (BAT) of C57BL/6J mice fed the diet for 8 weeks: (a) adipose tissue weight; (b) rectum temperature; (c) BAT mRNA expression. Data are mean ± SE. Significant differences between the 5% D-allulose group and without D-allulose group are indicated; * p < 0.05, ** p < 0.01, *** p < 0.001. NDCA, high-fat diet with non-dairy creamer +5% D-allulose; NDC, high-fat diet with non-dairy creamer. WAT, white adipose tissue; UCP1, uncoupling protein 1; PGC-1α, peroxisome proliferator-activated receptor gamma coactivator 1-alpha; SIRT1, NAD-dependent deacetylase sirtuin-1; PPAR-γ, peroxisome proliferator-activated receptor gamma; Creb, cAMP response element-binding protein.
Applsci 09 02750 g002
Figure 3. Effect of supplementation of a non-dairy creamer-enriched high-fat diet with D-allulose on fecal lipid excretion and small intestine RT-PCR in C57BL/6J mice fed the diet for 8 weeks: (a) fecal fatty acid; (b) fecal triglyceride; (c) fecal cholesterol; (d) small intestinal mRNA expression. Data are mean ± SE. Significant differences between the 5% D-allulose group and without D-allulose group are indicated; * p < 0.05, *** p < 0.001. NDCA, high-fat diet with non-dairy creamer +5% D-allulose; NDC, high-fat diet with non-dairy creamer. CD36, cluster of differentiation 36; SRB1, scavenger receptor class B member 1; ABCA1, ATP-binding cassette transporter; NPC1L1, Niemann–Pick C1-Like 1; FAS, fatty acid synthase.
Applsci 09 02750 g003
Figure 4. Effect of supplementation of a non-dairy creamer-enriched high-fat diet with D-allulose on time course changes in fasting blood glucose, plasma triglyceride, and total cholesterol in C57BL/6J mice fed high-fat diet for 8 weeks: (a) fasting blood glucose; (b) plasma triglyceride; (c) plasma total cholesterol. Data are mean ± SE. Significant differences between the 5% D-allulose group and without D-allulose group are indicated; * p < 0.05, ** p < 0.01, *** p < 0.001. NDCA, high-fat diet with non-dairy creamer +5% D-allulose; NDC, high-fat diet with non-dairy creamer.
Applsci 09 02750 g004
Figure 5. Effect of supplementation of non-dairy creamer-enriched high-fat diet with D-allulose on changes in hepatic lipid levels in C57BL/6J mice fed the diet for 8 weeks: (a) hepatic triglyceride; (b) hepatic fatty acid; (c) hepatic cholesterol. Data are mean ± SE. Significant differences between the 5% D-allulose group and without D-allulose group are indicated; * p < 0.05, *** p < 0.001. NDCA, high-fat diet with non-dairy creamer +5% D-allulose; NDC, high-fat diet with non-dairy creamer.
Applsci 09 02750 g005
Figure 6. Effect of supplementation of non-dairy creamer-enriched high-fat diet with D-allulose on lipid-regulating enzyme activities in hepatic tissue in C57BL/6J mice fed the diet for 8 weeks: (a) glucose-6-phosphate dehydrogenase (G6PD) activity; (b) phosphatidate phosphatase (PAP) activity; (c) acetyl-coenzyme A acetyltransferases (ACAT) activity; (d) fatty acid synthase (FAS) activity; (e) β-oxidation activity; (f) carnitine palmitoyltransferase (CPT) activity; (g) malic enzyme (ME) activity; (h) 3-hydroxy-3-methyl-glutaryl-coenzyme A reductase (HMGCR) activity. Data are mean ± SE. Significant differences between the 5% D-allulose group and without D-allulose group are indicated; * p < 0.05, ** p < 0.01, *** p < 0.001. NDCA, high-fat diet with non-dairy creamer +5% D-allulose; NDC, high-fat diet with non-dairy creamer.
Applsci 09 02750 g006aApplsci 09 02750 g006b
Figure 7. Effect of supplementation of non-dairy creamer-enriched high-fat diet with D-allulose on hepatic and adipose tissue morphology in C57BL/6J mice fed the diet for 8 weeks: (a) hematoxylin and eosin-stained transverse section of the liver in the NDC group; (b) hematoxylin and eosin-stained transverse section of the liver in the NDCA group; (c) hematoxylin and eosin-stained transverse section of epididymal fat tissue in the NDC group; (d) hematoxylin and eosin-stained transverse section of epididymal fat tissue in the NDCA group. NDCA, high-fat with non-dairy creamer +5% D-allulose; NDC, high-fat diet with non-dairy creamer. Representative photomicrographs of the liver and epididymal fat are shown at ×200 magnification.
Applsci 09 02750 g007aApplsci 09 02750 g007b
Figure 8. Effect of supplementation of non-dairy creamer-enriched high-fat diet with D-allulose on changes in plasma adipokines in C57BL/6J mice fed the diet for 8 weeks; (a) plasma resistin; (b) plasma leptin; (c) plasma adiponectin; (d) plasma leptin-to-adiponectin ratio. Data are mean ± SE. Significant differences between the 5% D-allulose group and without D-allulose group are indicated; * p < 0.05, *** p < 0.001. NDCA, high-fat diet with non-dairy creamer +5% D-allulose; NDC, high-fat diet with non-dairy creamer.
Applsci 09 02750 g008
Figure 9. Effect of supplementation of a non-dairy creamer-enriched high-fat diet with D-allulose on plasma cytokines in C57BL/6J mice fed the diet for 8 weeks: (a) plasma interleukin-10 (IL-10); (b) plasma plasminogen activator inhibitor-1 (PAI-1); (c) plasma IL-6; (d) plasma monocyte chemoattractant protein-1 (MCP-1); (e) plasma tumor necrosis factor-α (TNF-α). Data are mean ± SE. Significant differences between the 5% D-allulose group and without D-allulose group are indicated; * p < 0.05. NDCA, high-fat diet with non-dairy creamer +5% D-allulose; NDC, high-fat diet with non-dairy creamer.
Applsci 09 02750 g009
Table 1. Composition of the experimental diets and fatty acid components in non-dairy creamer.
(a) Composition of the Experimental Diets
Negative Control GroupTest Group
Diet component 1)HFD with non-dairy creamer* (NDC)HFD with non-dairy creamer* +5% D-allulose (NDCA)
Casein2020
DL-methionine0.30.3
Corn starch11.111.1
Sucrose3732
Cellulose55
Non-dairy creamer 2)14.614.6
Lard5.45.4
Mineral mix 3)4.24.2
Vitamin mix 4)1.21.2
Choline bitartrate0.20.2
Cholesterol11
tert-Butylhydroquinone0.0040.004
D-allulose-5
Total (%)100100
kcal/g4.0473.847
(b) Composition of Fatty Acid Components in Non-Dairy Creamer
Fatty AcidPercentage of Fatty Acid in Non-Dairy Creamer (%)
Lauric acid15.06
Myristic acid5.78
Stearic acid4.03
Palmitic acid3.40
Caprylic acid2.67
Capric acid1.95
Caproic acid0.22
Arachidic acid0.05
Oleic acid0.04
Heptadecanoic acid0.02
Pentadecanoic acid0.01
Lignoceric acid0.01
Behenic acid0.01
Tridecanoic acid0.01
Phospholipid0.015
Total fat33.275
1) NDC and NDCA is composed of 40% fat, 43% carbohydrate, and 17% protein; 2) non-dairy creamer is composed of 65% carbohydrate, 33.275% fat, and 1% protein (*energy of non-dairy creamer, 5.319 kcal/g); 3) American Institute of Nutrition (AIN)-76 mineral mixture (g/kg): calcium phosphate, 500; sodium chloride, 74; potassium citrate, 2220; potassium sulfate, 52; magnesium oxide, 24; manganese carbonate, 3.5; ferric citrate, 6; zinc carbonate, 1.6; cupric carbonate, 0.3; potassium iodate, 0.01; sodium selenite, 0.01; chromium potassium sulfate, 0.55; sucrose 118.03; 4) AIN-76 vitamin mixture (g/kg): thiamin HCl, 0.6; riboflavin, 0.6; pyridoxine HCl, 0.7; nicotinic acid, 0.003; D-calcium pantothenate, 0.0016; folate, 0.2; D-biotin, 0.02 cyanocobalamin (vitamin B12), 0.001; retinyl palmitate premix, 0.8; DL-α-tocopheryl acetate, premix, 20; cholecalciferol (vitamin D3), 0.0025; menaquinone (vitamin K), 0.05; antioxidant, 0.01; sucrose, finely powdered, 972.8.
Table 2. Effect of supplementation of a non-dairy creamer-enriched high-fat diet with D-allulose on plasma lipid profiles and glutamic oxaloacetic transaminase (GOT) and glutamate pyruvate transaminase (GPT) levels in C57BL/6J mice fed the diet for 8 weeks.
NDCNDCA
Glucose (mM)16.31 ± 1.04 *11.93 ± 1.23
Free fatty acids (mM)1.03 ± 0.190.98 ± 0.25
Triglycerides (mM)1.21 ± 0.035 ***0.66 ± 0.089
Total C (mM)5.09 ± 0.134.88 ± 0.28
HDL C (mM)2.84 ± 0.602.69 ± 0.18
Non-HDL C (mM)2.27 ± 0.142.19 ± 0.12
HTR (%)55.44 ± 1.7854.99 ± 1.44
AI0.81 ± 0.0580.82 ± 0.048
Apo A-I (mg/dL)35.93 ± 1.3638.42 ± 0.39
Apo B (mg/dL)1.80 ± 0.201.43 ± 0.23
Apo B/Apo A-I0.050 ± 0.00550.037 ± 0.0060
GOT (IU/L)37.18 ± 3.1635.78 ± 3.58
GPT (IU/L)23.85 ± 2.83 *16.43 ± 1.48
Data are mean ± SE. Significant differences between the 5% D-allulose group and without D-allulose group are indicated; * p < 0.05, ** p < 0.01, *** p < 0.001. NDCA, high-fat diet with non-dairy creamer +5% D-allulose; NDC, high-fat diet with non-dairy creamer. HDL, high-density lipoprotein cholesterol; HTR, (HDL cholesterol/total cholesterol) × 100; AI, atherogenic index, [(total cholesterol) − (HDL cholesterol)]/HDL cholesterol; Apo A-I, apolipoprotein A-I; Apo B, apolipoprotein B; GOT, glutamic oxaloacetic transaminase; GPT, glutamate pyruvate transaminase.