Article

The Effects of Differences in Individual Characteristics and Regional Living Environments on the Motivation to Immigrate to Hometowns: A Decision Tree Analysis

1
Faculty of Science and Engineering, Chuo University, 1-13-27 Kasuga, Bunkyo, Tokyo 112-8551, Japan
2
Faculty of Human Sciences, Institute of Human and Social Sciences, Kanazawa University, Kakuma-cho, Kanazawa, Ishikawa 920-1192, Japan
3
Graduate School of Agricultural and Life Sciences Department of Global Agricultural Sciences, The University of Tokyo, 1-1-1, Yayoi, Bunkyo, Tokyo 113-8657, Japan
4
Graduate School of Education, The University of Tokyo, 7-3-1 Hongo, Bunkyo, Tokyo 113-0033, Japan
*
Author to whom correspondence should be addressed.
Appl. Sci. 2019, 9(13), 2748; https://doi.org/10.3390/app9132748
Submission received: 23 May 2019 / Revised: 20 June 2019 / Accepted: 2 July 2019 / Published: 7 July 2019
(This article belongs to the Section Civil Engineering)

Abstract

:
Population decline and rural–urban population disparities are serious problems in Japan. This study aims to investigate the relationship between people’s motivations to migrate to their hometowns (“U-turn migration”) and their evaluations of the living environments of both their hometowns and current places of residence. An online questionnaire survey was conducted for people living in multiple places in Japan. By using the data of respondents’ U-turn motivations and their evaluations of living environments, we conducted a decision tree analysis to quantitatively describe the multilayered relationship between the environments and people’s motivations, and we focused on patterns that can ameliorate the population disparities. These are the major findings: first, living environments in both the hometown and at the current place of residence affected the U-turn motivations. Second, respondents were divided into several groups based on similar U-turn motivation structures, and with different demographic characters among the groups. Additionally, the evaluations of some living environments tend to depend on the city size or geographic locations. Although some groups’ U-turn migrations may improve population disparities, the improvement and maintenance of living environments are necessary. The results can help local governments in identifying the living environments that need development, and in estimating the feasibility of U-turn migrations.

1. Introduction

1.1. Background and Purpose of Study

Recently, population decline and rural–urban population disparities have occurred simultaneously in Japan. Three major (Tokyo, Nagoya, Osaka) metropolitan areas maintain an adequate population. By contrast, the population outflow in other provincial cities has continued, especially cities in rural areas. In addition to rural–urban population disparities, intraregional disparities between urban centers and suburban areas in each area are serious problems as well [1].
The total population of the whole of Japan has been declining since it peaked in 2004. If this trend continues to 2050, the population is expected to decline by approximately 25% from the population in 2005 [2]. At present, with the population’s natural increase (deduction of the numbers of births and deaths), in Japan, the ratio of natural increase is decreasing in all cities except for the Okinawa prefecture [3]. This means that it is difficult to anticipate population growth by the number of births in most areas.
In addition, when focusing on net migration (difference in the number of immigrations and that of emigrations), the ratio was negative in 33 out of 47 prefectures. The other 14 prefectures contain municipalities with large cities, such as an ordinance-designated city and the 23 wards of Tokyo (i.e., cities with more advanced urban functions that are more convenient to live in). Despite the positive net migration change in seven of the 10 prefectures located in metropolitan areas, only five prefectures of the 37 in rural areas (Gunma, Toyama, Ishikawa, Fukuoka, Okinawa) have a positive rate. If these tendencies of population flow continue, several smaller cities in rural areas will be unable to maintain their urban functions. A previous survey showed that approximately 20% of residential areas are expected to become non-residential areas by 2050 [4]. If urban functions are to be maintained through an appropriate population size, the population shift must be controlled in two directions: population shift from low-density outlying areas to densely populated urban centers, and population shift from urban centers to low-density areas. The former shift should be restrained, whereas the latter should be promoted.
Migrations are roughly classified into two types: spontaneous and imposed. Imposed migrations are often caused by reasons that are irrespective of the willingness of people, such as job relocation. On the other hand, spontaneous migrations happen when people have strong motivations to migrate after considering multiple factors (e.g., economic comfort, employment opportunities) [5,6]. This paper focuses on the relationship between the motivation for spontaneous migration and individuals’ evaluations of their living environments. A previous survey in Japan [7] concluded that living environments significantly influenced individuals’ choices regarding where to live. If the living environments of a region are perceived as good, this may motivate people to migrate to the region. In addition, if the region is well developed, and people perceive it to have a good quality of life, they may live in the region for a long time [8]. Further urban development in provincial regions would also help migration. However, living environments are divided into various categories; therefore, it is difficult for local governments to judge the appropriate living environments to develop that would influence motivations against or toward migration. If the relationship between people’s evaluation of living environments and their migration motivation is quantitatively clarified, it can become supportive information for policy making.
Although there are various destinations for migrants, the U-turn migration phenomenon—in which people return to their hometowns—is one of the migration types that can improve population disparities in Japan. This is because promoting U-turn migrations have a higher possibility of increasing the populations of rural cities than recruiting new residents. The 8th Annual Population and Social Security Survey [9] showed that approximately 20~40% of people left the prefectures in which they had originally resided. Furthermore, those whose hometowns were rural areas migrated mainly to prefectures located in the three metropolitan areas, especially to prefectures with larger cities. By contrast, people whose hometown was in the three metropolitan areas mainly moved within these metropolitan areas. This means that large populations have outflowed from rural areas to metropolitan areas, increasing the difficulties for rural areas in attracting residents from the metropolitan areas. Therefore, the migration of people from their rural hometowns is one of the main reasons for population disparities.
In some cases, to improve these population disparities, it may be useful to increase the population of rural areas by recruiting the new residents who have never resided in such areas. However, a previous survey [10] showed that people living in metropolitan areas were more hesitant to live in the rural areas than those living in other rural areas. On the other hand, 54.5% of the residents of rural areas were people who had moved due to a U-turn migration. The ratio of U-turn migrants was higher than that of new residents who had migrated from other regions. This implies that although numerous people emigrated, U-turn migrants still played an important role in maintaining urban functions in rural areas. Many small, rural Japanese governments have actively promoted people’s U-turns with policies.
Moreover, the same survey demonstrated that individuals’ hometowns have more of a special meaning for them than other destinations. Further, it mentioned that people want to live in regions with which they have strong associations (e.g., the region of birth and/or upbringing). Harrison [11] also indicated that people often chose to return to places they had once left, despite having other alternatives.
According to the results of previous surveys, one of the reasons for the recent population disparities in Japan is people’s continuous migration from their smaller, rural hometowns to larger cities in metropolitan areas. However, it also means that there are many potential return migrants (i.e., people whose return migration to their hometown contribute to the improvement of population disparities) stay yet in metropolitan areas. Moreover, it is assumed that these individuals have a more positive attitude toward migration to their hometown than toward migration to other regions where they have never lived, provided that living conditions in both prospective regions for migration are almost the same. Indeed, in the rural areas, U-turn migrants are becoming accounts for a relatively large percentage of all rural residents. Therefore, in the current Japanese situation, promoting U-turn migrations to smaller hometowns in rural areas is one of the ways to improve population disparities than recruiting new residents.
However, because of the numerous gaps between the living environments (e.g., convenience, economic condition) of metropolitan areas and rural cities, it is difficult to make a sufficient number of potential U-turn migrants return to the rural areas. In fact, the poor living conditions are a concern for people who intend to return to their hometowns [12]. Especially in small cities, the development of living environments is considered an important task to attract more people, as well as provide employment opportunity [13]. This raises questions about which living environments should be developed further, and what level of development is necessary in each environment. If these questions are answered using appropriate measures, local governments will be able to solve the concrete problems in each region, and U-turn migration would become more practicable for improving population disparities.
To address these questions, it is necessary to clarify which living environments and conditions heighten people’s motivations for U-turn migration. Numerous studies to this end have been conducted in Japan [6,14,15,16,17]. The subjects of these studies were people (especially younger adults) who moved back to rural and depopulated areas. The researchers found several critical reasons that influenced these people’s decisions. However, the current population disparity in Japan is not only a problem for depopulated rural villages but also for provincial cities that flourished in the past. Moreover, when people migrate, two regions are involved (in the case of U-turn migration, individuals’ current residence and the hometown). Therefore, it is obvious that people compare the living environments of both locations to make a decision. Nonetheless, few studies have quantitatively measured the influence of people’s current residences on U-turn motivations.
This study introduces quantitative measures of the relationship between individuals’ U-turn motivations and their evaluations of the living environments. Based on the results, we clarify the structures of people’s U-turn motivations that would improve the population disparities in Japan. In addition, we propose which living environments are necessary to develop. Then, we provide helpful information for local governments that want to conduct the appropriate development of living environments to promote these people’s U-turn migration. The target subjects of this study are people of various attributes living in various places in Japan.
Data from a questionnaire survey were analyzed from three perspectives. First, we used decision tree analyses to describe the multilayered relationships between the U-turn motivations and the evaluations of living environments. We also determined which living environments are deciding factors for U-turn migration, and what level of development is required for each factor. The influence of the living environments of the current residence was considered in the analysis.
Secondly, we assessed the demographic attributes and urban characteristics of the current residences and hometowns of respondents’ groups that were categorized in the decision tree. This enables local governments to clarify which living environments they should develop according to their target populations and estimate the contribution of people’s U-turn migration in the improvement of population disparities in Japan.
Finally, we examined whether respondents’ evaluations of important factors varied on the basis of the urban features of the current and possible future residences. The results help predict the likelihood of U-turn migration for individuals, using information about their current residences and hometown.

1.2. Literature Review

Past studies have examined the population drift and choice of residential locations. There are several approaches that can be employed to this end.
One way to assess the population flow is by using census data. The total number or the ratio of people who moved into or out of each region is reported in the census. If the characteristics of each region are further examined, the factors that influence people’s migrations (i.e., of the “push” and “pull” factors) can be determined by analyzing the relationship between the data for in- and out-migration. For example, Conway and Houtenville [18] assessed the reasons for and consequences of the residential choices of migrant younger elderly people versus older elderly people in the United States (US). Based on the gravity model, they found that, when choosing a destination for migration, the younger elderly are affected by moderate climates and policies (e.g., income taxes and welfare spending), whereas the older elderly leave their former resident states because of a high cost of living and property taxes. In Japan, a similar approach was conducted in some studies. Kondo et al. [19] described the dynamics of migration flows within the Tokushima prefecture, based on the utility gap of regions calculated from the statistical data (e.g., land price, the number of facilities) and the location of each city. The results indicated that the utility gap between the city areas and rural areas accounted for the population disparities. A series of studies by Ai focused on the population flow patterns of local district scales in the Greater Tokyo Area, first by examining the entire population [20], and then by narrowing the subjects down to the young and productive age generations [21]. Both studies extracted multiple factors (e.g., accessibility to facilities, population density, and land use ratio) as well as the required development threshold that affected for each region’s population growth.
Their findings determined the factors that cause population disparity in each area. In addition, these studies also suggested that important factors that affected the propensity to migrate included the personal attributes of migrants. However, if only the net extent of the population flows among areas are used as indices, it is not possible to understand the relationship between people’s motivations of migrant and living environments. This is because population data from censuses only provide the general results of population movements. Thus, we cannot judge whether individuals’ migration is spontaneous one or not.
To counter this problem, some studies used questionnaire surveys to elicit data about individuals’ choice regarding place of residence, along with their disposition toward and their preferences for living environments. These data enable us to reveal the factors that affect spontaneous migration.
An assessment of residential preferences is one of the approaches. Although many studies focused on the preferences of housing type, several studies included regional characters of the current places of residence. Some studies focused on the community (population) size and the locations of residence. Hwang and Albrecht [22] examined the preferences for the community size and location and evaluated the satisfaction of residents in Texas. They found that the mismatch rate differed with the location of communities. By using survey data conducted in the US, Fredrickson et al. [23] focused on the people’s preferences for and satisfaction with the community of current residences as the factors that affected the people’s migration intensions. Their results indicated that preferences and community satisfaction were interrelated, and each had an independent effect on migration.
In addition, Fuguitt and Zuiches [24] examined not only the preferences for community size and location but also the living environments. They found that people who wanted to live in large cities expressed different preferences for living environments from those who wanted to live near or away from large cities. This study provided more details relevant to regional development by paying attention to specific living environments. Gustavus and Brown [25] also focused on the preferences for specific living environments, such as jobs, schools and health care facilities. This study compared salience and satisfaction among the former place of residence, the destination migrated to, and the town that was the second candidate for migration. Their results indicated that people decided where to migrate by comparing a set of alternative destinations along with the original place of residence. Furthermore, preferences and evaluations of people may change according to their individual attributes (e.g., gender, family type) or life stage [26,27]. The results of these studies indicated the importance of simultaneously considering features of the current and potential places of residence along with individual attributes.
However, these studies did not consider specific destinations. When specific destinations are included, people can evaluate the living environments in the regions. If these evaluations are available, local governments can address the gap between the current living environments and the more ideal conditions for spontaneous migrants. For precise evaluations, people were required to have proper understandings of the destinations. For migration within the same city, individuals may be able to evaluate the living environments with some accuracy, even if they have never lived in the region [28]. However, in many cases, people move across prefectures, with little knowledge about their destination. In addition, although the studies cited above did evaluate satisfaction with the current residences of migrated people, people who have not yet migrated may have different viewpoints and evaluations [29,30]. Therefore, we need the precise evaluations of the destination regions of potential migrants who have not yet migrated.
U-turn migration is a good example of migration in which the destination is clear. Individuals already have the experience of living in hometowns and can evaluate the living environment more precisely than for other regions. U-turn migrants have been called “return migrations” in some studies. Most research focused on international return migrations [31,32]. Nonetheless, several studies have focused on the internal return migrations in the same country. Some studies emphasized the economic context and factors; for example, return migrants were seen as “failures” who found it difficult to continue living in former regions because of low educational achievements or working skills [15,33,34]. By contrast, “successful” return migrants have been in the focus of other studies. These people brought their skills acquired at former places of residence and positively affected the development of their hometowns [35,36].
On the other hand, studies conducted recently argued that this “success–failure” dichotomy is insufficient to explain the reasons for return migrations because they omitted the non-economic reasons. Emotional and social factors also seem to be reasons for people’s spontaneous migrations. Rérat [37] examined the factors in young graduates’ return migration within Switzerland and found that even highly skilled migrants considered not only the labor market conditions but also non-economic factors. Reichert et al. [29] assessed the reasons for return migrations to rural areas in the US among people in their late twenties to late forties, while comparing the cases of the returned and non-returned. Through interviews, they found that although non-returnees considered poor employment conditions in rural areas as barriers to their return, the social and physical factors were more decisive factors. Furthermore, Harrison [11] focused on the “place-specific” factor, which includes the historical contexts of cities and the experiences of people through which they identify with the place. Their study utilized open-ended interviews of young and educated “boomerangers” to Youngstown, Ohio. Their results indicated that place-specific considerations worked in combination with the economic and social factors.
In Japan, studies in this field considered multi-faceted factors. Kobayashi [16] focused on the increasing numbers of return migrations of young men who also switched jobs to rural agriculture in the 1990s. Using a questionnaire survey and interviews, they found that the main reason for respondents’ U-turn migrations was to succeed in their family businesses, and they also found that fewer people returned to their hometown because of a dissatisfaction with their lives in urban cities. Okazaki et al. [17] focused on one village in the Miyazaki Prefecture, where the number of returnees was increasing. Using questionnaires, they found that economic and family factors were the main reasons for return migration. In addition, the results also indicated the reasons for this were different depending on the period of people’s return.
These studies outlined the characteristics of returnees to rural areas, and the factors that affected their decision to return. However, the aim of our study is to contribute toward a greater understanding of potential U-turn migrants who have not yet returned, while focusing on the development of living environments. Several previous studies [11,28] implied that non-returnees may assign a different significance to the same factors and those who had already returned may have stronger identifications with or connection to their hometowns than non-returnees. In order to improve population disparities, it is important to promote non-returnees’ U-turn migrations by enhancing their motivation.
There are few quantitative analyses of the presence, absence, or degrees of interrelationships among the factors (i.e., multilayered structure, necessity of satisfaction with several factors simultaneously). Moreover, although Gustavus and Brown [25] pointed out that people consider the condition of current residences before migration, most studies did not account for the influence of the current environments. Park and Kim [38] used the differences in objective indices related to living environments of the origin locations and destinations of migrants in Korea as variables. However, it is also important to account for migrants’ subjective evaluations of living environments as elements that directly affect their motivation toward U-turn migration. Because individuals may have varied evaluation standards, they may differently evaluate the same objective conditions. Therefore, it is indispensable to assess such subjective evaluations in this study.
Furthermore, the subjective evaluations of various living environments in both origin locations and destinations should be considered. In Japan, Katada et al. [39] analyzed the case of return migration from an urban city to a rural village in the Aichi Prefecture. They indicated that the gap in the evaluation of the rural and urban living environments influenced the respondents’ decisions to move to the urban area. However, they focused mainly on family factors (e.g., presence or absence of parents or siblings, as well as, housing properties) to determine the reasons for return migrations, and they did not take multiple living environme1nts into consideration.
Additionally, regarding the cases in Japan, most studies have been emphasized on the returns to rural and small villages. However, populations continue to decline even in the center of provincial cities; thus, the problem should be considered on a national scale. Their findings may be inadequate or outdated for the present conditions in Japan.
Our study considered these problems and limitations. Using data from the whole of Japan, we performed a quantitative analysis to assess the relationship between concrete evaluations of living environments in both current residences and hometowns, and the motivation toward U-turn migration.

2. Materials and Methods

2.1. Data from the Online Questionnaire Survey

An online questionnaire survey was conducted in January 2016. The respondents included people from all prefectures of Japan. They were members of the consumer panel of a research company (MyVoice Communications, Inc.; http://www.myvoice.co.jp/), and were chosen as the number of respondents from each prefecture was almost the same. Such a set of respondents was considered to avoid a lack of balance regarding the respondents’ current locations. If the study samples were selected based on the current population distribution in Japan, the sample would mostly comprise those who live in large cities in metropolitan areas. This was not desirable for our research design, as it would hinder a comparison of the regional differences in the U-turn motivations.
First, we collected data regarding each respondent’s current residence and hometown. We defined “hometown” as the region in which each respondent had lived longest during the period of ages 0 to 14 years of age. The respondents chose the name of a prefecture and provided the name of the municipality as a free answer. For respondents’ current residence, we also asked the zip codes.
The respondents also provided evaluations of twenty living environments of each region. These living environments were selected through a discussion between the three researchers in this study. The twenty living environments were selected to cover the eight categories of U-turn migration according to Okazaki et al. [17], excluding “cultural life in mountain villages.” These living environments broadly covered the economic, family, and social factors determined by the aforementioned studies as reasons for U-turn migration. The respondents ranked each living environment on a 5-point Likert scale, ranging from “high”, “rather high”, and “neutral”, to “rather low” and “low”. We also included an alternative as “not applicable to me”, for instances wherein a respondent is unable to evaluate that factor (e.g., no parents, no inherited lots or houses). In the analyses, we regarded these questionnaire responses as “positive”, “negative”, or “other” (neutral). Therefore, on the basis of another study [40], we combined the two responses—“neutral” and “not applicable to me”—into one category for analysis. These questionnaire responses were assigned numerical values; for example, high = 5, medium = 3, and low = 1. We also enquired about the motivations behind both settlement in the current locale of residents and migration to a hometown, using the same five-point Likert scale. The response choices were combined into three categories: high = 5 or 4, medium = 3, and low = 2 or 1. The data obtained from this survey are available on Figshare (DOI; 10.6084/m9.figshare.8050280).

2.2. Methodology

We first conducted Chi-square tests to assess the relationships between the evaluations of the living environments of both the current residences and hometowns, as well as the motivations for remaining in the current residence and for U-turn migration. We examined the differences in the influence of the living environments on each type of motivation to assess the influence of the current residence on U-turn motivation.
Thereafter, we performed a decision tree analysis by using the Classification and Regression Tree (CART) method to assess the U-turn motivations according to respondents’ evaluations of the living environments in their current residences and their hometowns. This time, we also focused on the gaps between the evaluations of the living environments in the current residences those of the hometowns.
The decision tree analysis method was originally developed by Breiman et al. [41]. This method is known as the classification/regression tree analysis and is one of the machine learning methods for constructing prediction models from data [42]. The method involves generating a classifying model with hierarchical conditional branches. Samples for analysis can include both categorical and continuous variables, and one of the categorical variables is often used as a response while others are used as predictors. Based on these predictors, for each sample, which class it should be categorized in is systematically predicted. Decision tree analysis attracts considerable attention these days for the following two advantages: (1) clear visualization of conditional branch rules, (2) no need to standardize or perform other kinds of processes. Recently, due to its convenience and powerful algorithm, decision tree analysis has been applied in various research fields [43,44,45,46].
The explanatory variables were separated into four categories:
  • Evaluation of the living environments in the place of current residence (20 variables),
  • Evaluation of each living environment in the hometown (20 variables),
  • Differences in evaluations between both regions (20 variables), and
  • Traveling time between the region of current residence and hometown (1 variable).
Each explanatory variable was treated on an interval scale. For categories 1 and 2, we used the 5-point evaluation of each living environment. These indices were to test the hypothesis that “there may be some decisive living environments in each region.” We assumed that if the evaluations of specific variables related to the current residence or hometown is above or below a certain value, then this living environment directly affects a person’s propensity for U-turn migration, thus making it unnecessary to compare the gap.
Indices in category 3 were calculated as the difference between an individual’s evaluation of each living environment—of the current residence and hometown. These indices were integers ranging from −4 to 4. A positive value indicates that the respondent favors the current place of residence over their hometown. A value of 0 suggests that the evaluations of both areas are almost equivalent. These indices were used to assess the hypothesis that “people’s motivation toward U-turn migration was sometimes decided by a comparison between the living environments in current residences and the hometowns.” For the traveling time between the two regions, we used the route search service provided by Yahoo! Japan (https://transit.yahoo.co.jp/) to determine the time required to travel between the public offices of both regions (no limitation for transportation methods). We calculated the values of the variance inflation factors for each of the sixty-one variables. None exceeded 10 and, therefore, we used all variables in the decision tree analysis.
The CART method was used for selecting the variables for the model. The minimum sample size of a parent node was set at 20, and that of a child node at 7. To avoid overfitting, we adopted the Min+1SE method [41] for pruning. In this method, the complexity parameter (CP) is set to prune a decision tree by using a cross-validation method. The CP is determined as the maximum of the error value within the range of one standard error from the minimum error value of the cross validation.
Based on the respondents’ grouping performed by the decision tree analysis, we generated crosstabs and conducted Chi-square tests to examine the demographic characters of these groups. In the examination of the relationship between U-turn motivation and the evaluation of the living environments, we used individuals’ U-turn motivation (three rankings after combination, as described above) as a dependent variable.
Finally, we analyzed the likelihood of each group’s U-turn migration and its contribution to the improvement of population disparities in Japan. To this end, we focused on the cities’ characters, especially their sizes. We examined the evaluations of living environments that tended to be affected by city size, after which we assessed whether each group’s U-turn migration would improve the population disparities. These analyses were also conducted using crosstabs and Chi-square tests. IBM SPSS version 23 and R Ver. 3.2.0 was used for these analyses. For the decision tree analysis, we used the rpart package.

3. Results and Discussions

3.1. Characteristics of Survey Participants

A total of 1056 people participated in this survey. Their characteristics are summarized in Table 1. The spatial distribution of respondents’ current residence is shown in Figure 1. Among all respondents, 511 people answered that their current place of residence was not their hometown. Figure 2 shows their spatial distribution based on their hometowns.
Table 2 shows the respondents’ evaluations of the living environments in their current places of residence and their hometowns.

3.2. The Relationship between U-Turn Motivation and the Evaluation of Living Environments

Table 3 shows the U-turn motivation of the respondents who answered that their current place of residence was not their hometown, based on their overall rating of living environments in their hometowns.
The results in Table 3 suggest that respondents are not motivated toward U-turn migration as a whole, because the ratio of people whose U-turn motivation ranked high was smaller than the ratio of the other two groups. However, there is an expectedly significant association between higher evaluations of the living environments in hometowns and the motivations toward U-turn migration.
Table 4 shows all respondents’ propensity to stay in their current residence, based on their overall rating of the living environment of their current residence.
The relationship between willingness to remain at the current residence and the evaluation of the overall living environment also demonstrated a similar tendency. However, a comparison between the data in Table 3 and Table 4 reveals some differences. The ratio of respondents whose willingness to stay at their current residences was over 80% when their evaluations of the living environment of their current residence was high. On the other hand, even if their evaluations were low, approximately half the respondents had high willingness to stay in place. In comparison, even though respondents evaluated their hometown’s living environment as high, the ratio of respondents with a high U-turn motivation below 40%. As expected, when the evaluation of their hometown’s living environments was low, the ratio of respondents whose U-turn motivation was low reached approximately 80%.
These results suggest that, for all groups, both the inclination to remain in place and to return to their hometowns is strongly influenced by the living environments in each region. However, the results also indicate that people would rather stay in their current places of residence than return to their hometowns, even when their evaluations of the living environments of both locales are similar.

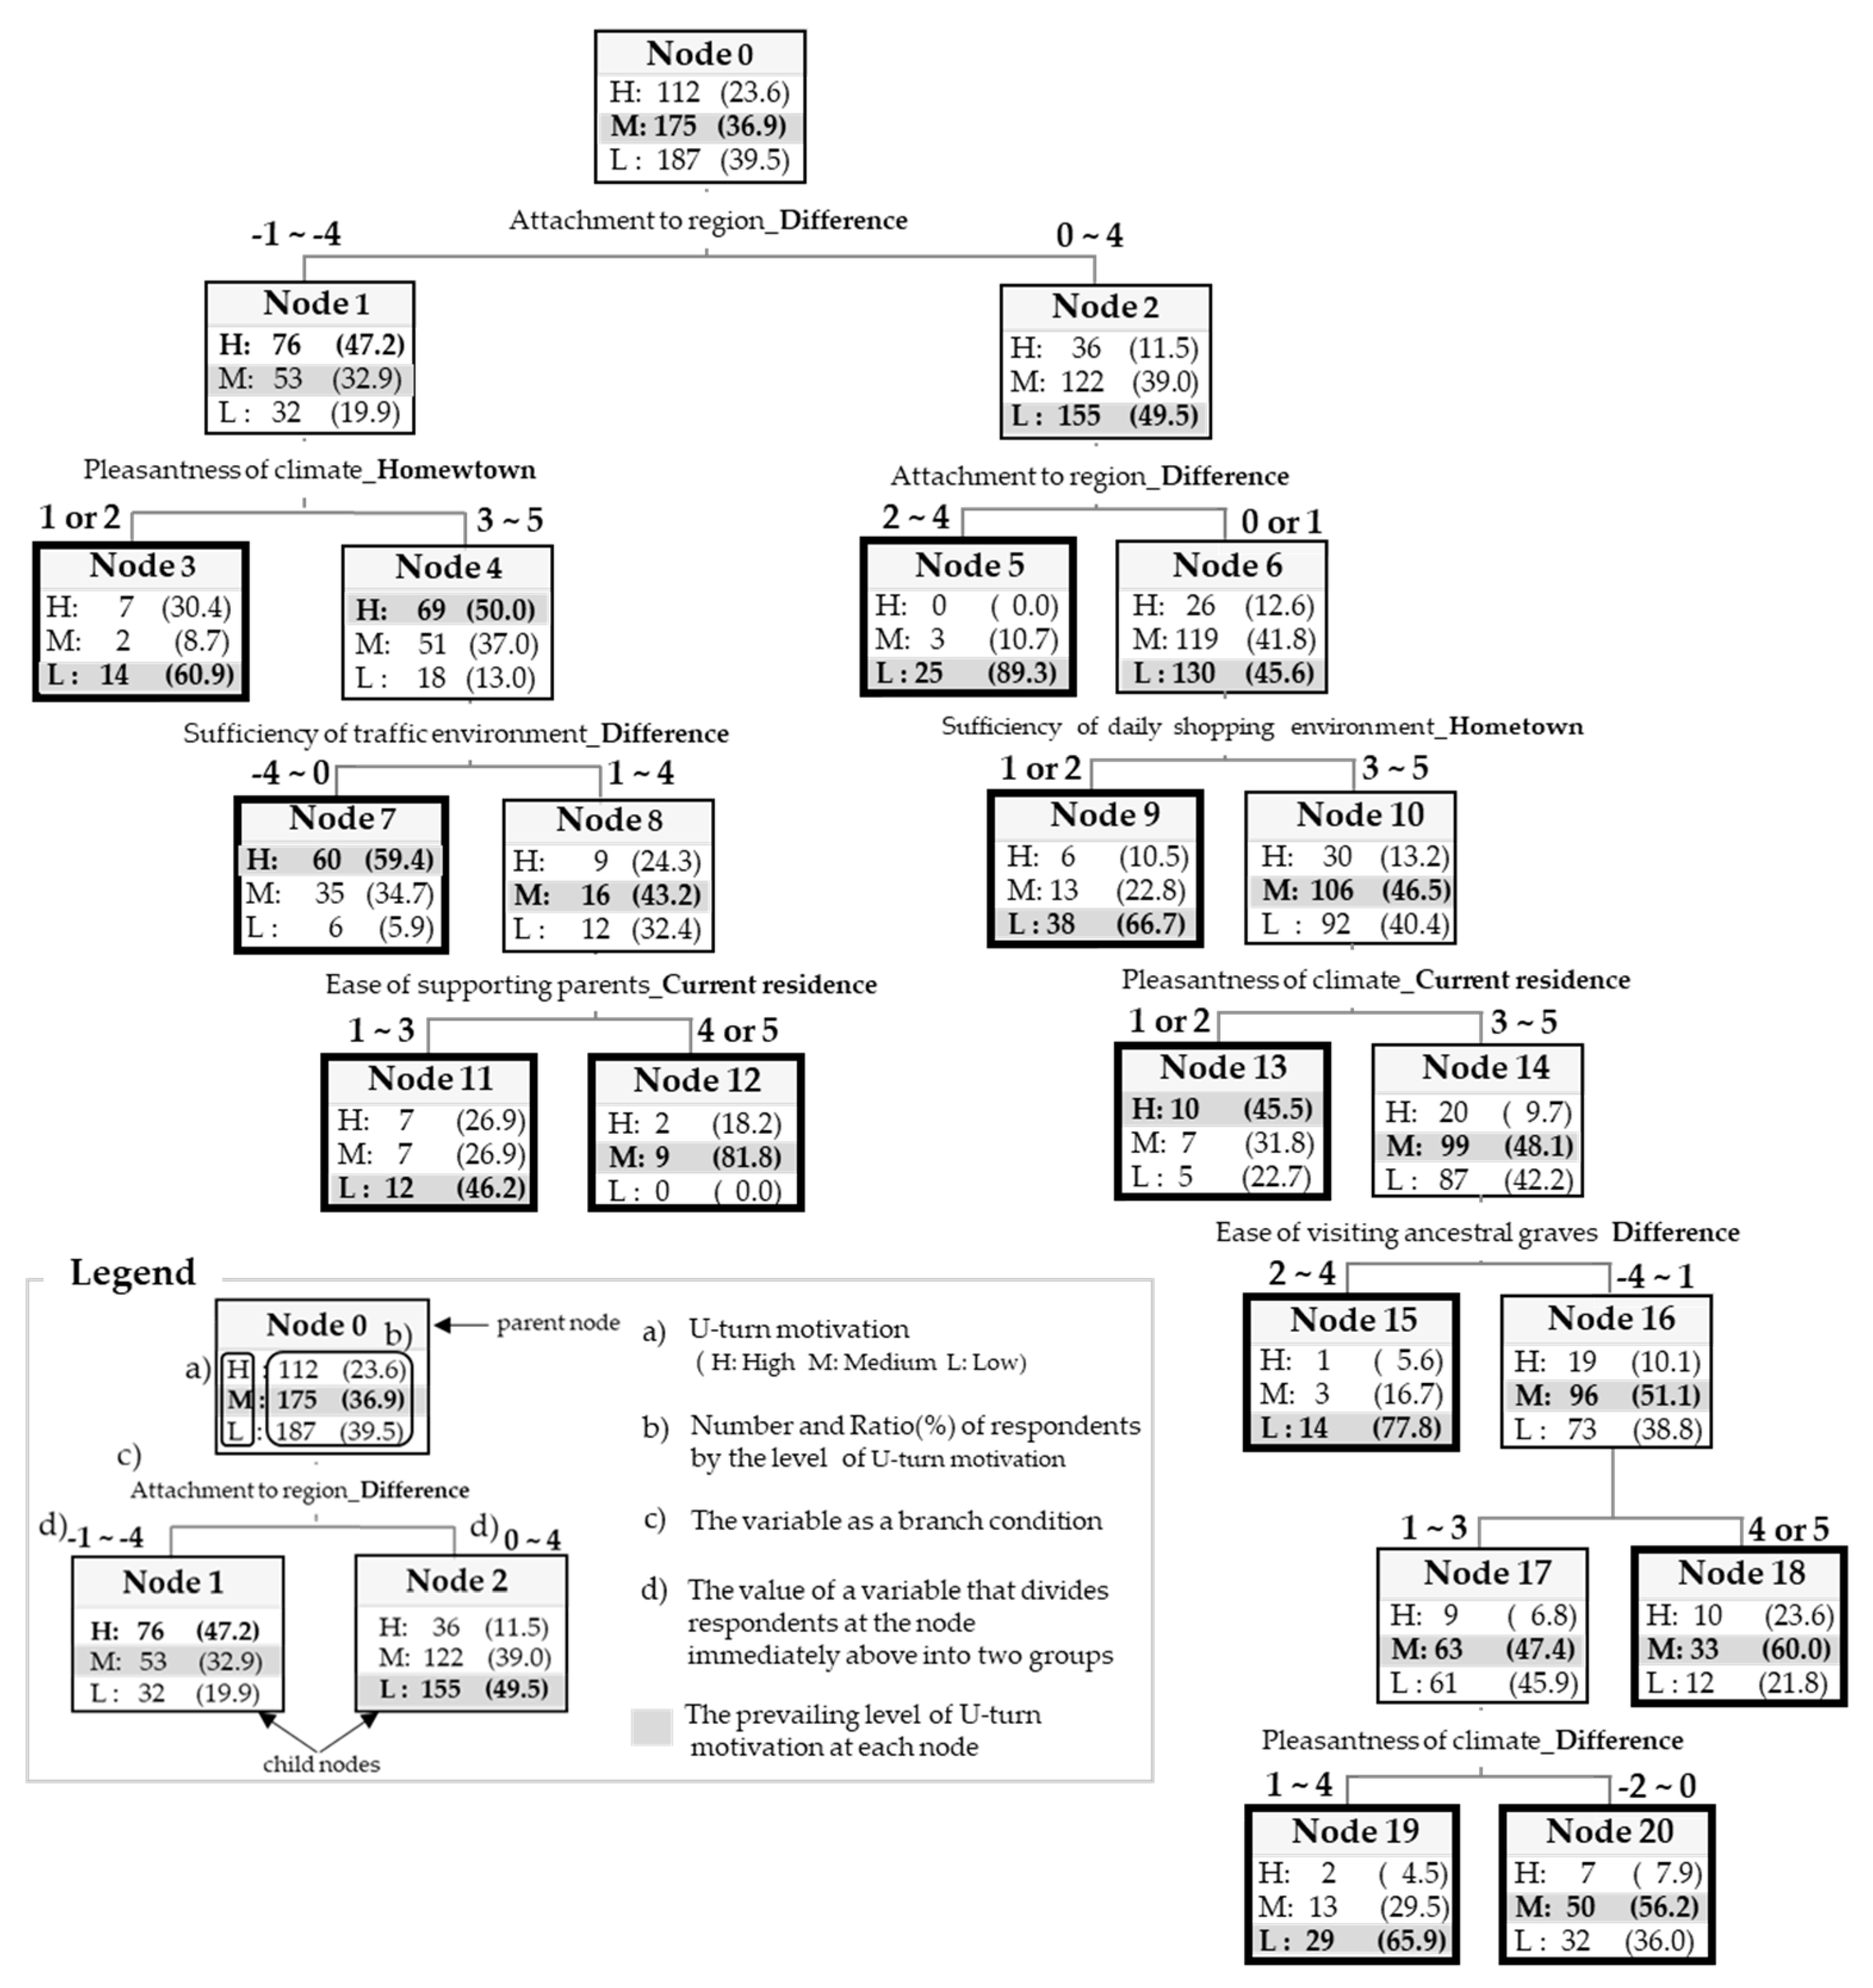
3.3. Structure of Respondents’ U-Turn Motivation by Living Environments as Important Factors

We conducted a decision tree analysis to extract the living environments as important factors for U-turn motivation. This analysis also aimed to categorize the respondents by the structure of their U-turn motivation. The subjects for analysis comprised 474 respondents who answered that their hometowns were different from their current residential areas, and for whom all data for variables (i.e., U-turn motivation, evaluations of twenty living environments of both regions, traveling time of travel distance between current residences and hometowns) were complete. Approximately 4.6% of these people answered that their current residences and their hometowns were within the same municipality. However, we found that the regions of the current residence and hometowns differed in their detailed answers (e.g., different administrative wards in the same ordinance-designated city, or their current residences and hometowns were in different municipalities before a municipal merger). We regarded these respondents as having a possibility of U-turn migration. The result of the pruned decision tree (the value of CP was 0.017) is shown in Figure 3. The error rate calculated from the result of cross-validation (samples were divided in 10 groups) was 49.9%. These respondents were finally categorized into eleven last nodes, represented by the bold-lined boxes. The branch conditions of each last node are summarized in Table 5.
All nine branch conditions in the tree were about the evaluations of the living environments. Seven out of twenty living environments were adopted as branch conditions that concerned respondents’ U-turn motivations. When the hierarchic relations of these branch conditions were assessed, there were items about the spiritual connection to the regions (Attachment to Region) at the top of the tree, and items about comfortableness and convenience (Daily Shopping, Pleasantness of Climate, and Traffic) in the middle of the tree. At the bottom were environments related to family properties or human relationships (Caring for Inherited Lots or Houses, Supporting Parents, Visiting Ancestral Graves). The evaluation of regional attachment and climate were early branch conditions, and they reappeared in subsequent branch conditions. When Node 1 and Node 2, or Node 3 and Node 4, are compared, the difference between the evaluations of these two living environments significantly modified changed the tendency of U-turn migration.
All patterns of regional evaluations (only hometown, only current region, or the difference between both regions) were adopted as branch conditions. At almost all branches, if the evaluation of a living environment for the hometowns was lower or higher than that for the current residence, the U-turn motivation varied in direct association with the next branch destination. Moreover, there were five instances in which a high (5 or 4) or low (1 or 2) evaluation of hometowns or current residences were directly linked to lower U-turn motivation. In addition, we focused on the distribution ratio of U-turn motivation at each last node. At six nodes (Node 3, 5, 9, 11, 15, 19), the prevailing level of U-turn motivation was low. By contrast, the number of last nodes where the prevailing level of U-turn motivation was in the middle (Node 12, 18, 20) and high (Node 7, 13) were fewer. These results provide an understanding of the reason why spontaneous U-turn migrations do not occur frequently in the current conditions in Japan.
There are other findings derived from the branching process. For example, at Node 15, the U-turn motivation was mostly low. However, the distribution ratio of U-turn motivation changed through the branching processes before the last node and was influenced by the living environments in the current residence and hometown. When the branch process developed up to the Node 6, approximately half the respondents indicated low U-turn motivation, due to the gap in their attachments to the regions. In the next steps, a better shopping environment in the hometown encouraged the U-turn motivation of the group. Finally, a better environment for visiting ancestral graves at the current place of residence decreased the U-turn motivation of the group. These results suggest that individuals’ U-turn motivation is developed through the multilayered influences of the living environments in both regions.
Previous studies also examined the influence of the living environments in hometowns on the U-turn motivation. However, their study designs did not sufficiently focus on the influences on current residences of individuals, as well as the multilayered influences of the living environments of both regions. Our study design did include such influences, which provided new findings on a multilayered decision process related to the U-turn motivation of people not presently living in their hometowns.
Moreover, in this multilayered structure, two types of living environments emerged as important factors. The first type includes the living environments that should be developed to enhance U-turn motivations. The second includes the existing hometown conditions that should be maintained due to their appeal, or for not being deterrents for potential U-turn migrants. For example, for Node 3, the evaluation of Pleasantness of Climate was the former type of factor, and Attachment to Region was the latter factor. In this node, the negative evaluation of the climate condition in respondents’ hometowns was a decisive factor for reducing their U-turn motivation, despite the fact that their attachment to the hometown exceeded their attachment to the current place of residence. However, only improving the problems of bad climate through developments for enhancing pleasantness may not be a sufficient measure to enhance their U-turn motivation. If less attention is paid for maintaining or enhancing the evaluation of the attachment, the evaluation would become lower, and the hometowns no longer meet all required conditions that are necessary to enhance U-turn motivation. This may rather reduce people’s U-turn motivation.
These findings quantitatively demonstrate a need for policies that promote U-turn migration, while simultaneously considering each environment in the migration process and the various environmental factors related to people’s U-turn motivation simultaneously, including their ties to factors in their current places of residence.

3.4. The Structure of U-Turn Motivation and the Demographic Characters of Each Respondents’ Group

In the previous section, we discussed the multilayered relationship between U-turn motivation and living environments. In order to appropriately promote people’s U-turn motivation by applying this model, it is necessary to examine the characteristics of each last node and grasp whether each group’s U-turn migrations can improve the population disparities in Japan. For this purpose, we first assessed the characteristics of each last node while focusing on the relationship between the demographic attributes of individuals and the structure of U-turn motivation derived from the evaluations of living environments. The results of this analysis would provide local governments with useful information about which living environments they should develop for attracting people with specific attributes that contribute to the population sustainability (i.e., appropriate population size and age distribution to maintain the urban functions) of the regions.
Table 6 shows the distribution ratio for the demographic characteristics (age, gender, family structure, and birth order, i.e., eldest son or not) of individuals in the last nodes of the decision tree. We focused on groups that were statistically significant, or those considerably deviated appreciably from the distribution ratio for a group of all respondents. The notable demographic characteristics are summarized in Table 7.
In Node 3, there were more young people aged under 40, women, and married couples that did not live with children, than in other nodes. The prevailing level of U-turn motivation was low due to negative evaluations of the climate in respondents’ hometowns, despite the stronger attachment to hometowns than to current residences. A total of 78.3% of respondents in Node 3 had a car in their household, and most people did not live with children. It was assumed that approximately 60% of their parents were not older elderly and were not required nursing care yet (assuming an average age difference of thirty years). Respondents at Node 3 tended to base their U-turn motivations on only abstract ideas related to attachment or climate and were not concerned with the more practical living conditions—such as childcare, support for parents, and transportation—because they had fewer problems in general.
On the contrary, in Node 5, the ratios of unmarried people and those over age 60 were higher. Only their attachment to the regions influenced their U-turn motivations. Most respondents had low motivation toward U-turn migration due to stronger attachment to their current regions of residence. A previous survey [48] showed that, in Japan, older people generally lived at their current residences longer than the younger generations. Another study indicated that continuing to live in the same place was one of the reasons for forming an attachment to the place [49]. Such a strong attachment to the current residence reduced respondents’ U-turn motivations. In addition, it is also assumed that the respondents paid less attention to other living conditions such as convenience and family factors due to their ages and single marital status.
Many respondents at Node 9 also demonstrated low U-turn motivation. While the evaluations of their attachment to their hometowns were almost the same as those for their current regions of residence, a poor shopping environment in their hometowns reduced their U-turn motivations. In this node, approximately 90% of the respondents were married, and included more women than men. In Japan, women commonly shop for daily commodities, and more so after marriage. This result suggests that their shopping behavior is directly related to their motivations toward return migration.
For the nodes discussed above, the living environments related to comfort and convenience of the regions, or attachment to the regions were important factors for U-turn motivation. However, they were not decisive factors for many respondents at Node 15. These respondents seemed to not consider these conditions as critical problems in either their hometowns or current places of residence. For them, family property or relationships (e.g., ease of supporting parents and visiting ancestral graves) were decisive factors. In fact, their evaluations of attachment to the hometowns was almost equivalent to those of their current regions of residence. In addition, the shopping environment in their hometowns and climatic conditions in their current residences were both positively evaluated. Nevertheless, they tended to have low U-turn motivation because their current residences allowed for easy management of their ancestral graves. In Japan, sometimes ancestral graves are not located in hometowns because of the changing location with the migration of family members or the integration of other relatives’ graves. The node was consisted only of respondents 40 years and older. Their parents had either already passed away, or respondents had to consider the management of their graves by succession. They would have to visit graves periodically, and sometimes beyond their livelihood zones. Therefore, we assumed that easy management of their ancestral graves at the current residences may became decisive factors for their U-turn motivation.
Likewise, Nodes 12 and 18 also emphasized the factor related to family properties or human relationships as the last branch condition. Again, most respondents were aged 30 to 39 years old or 50 to 59 at Node 12, and over 40 at Node 18. Assuming that the age difference between them and their parents was 30 years old, some parents of the respondents at Node 12 may require nursing care from them as younger or older elderly adults. The parents of respondents at Node 18 would be aged over 70 years; thus, many had taken over the management of their parents’ houses and properties. In addition, according to Table 6 and Table 7, the ratio of the eldest sons (including a “substantive” eldest son who lost an elder brother or brothers) at Node 12 was highest among all nodes, and that of Node 18 also exceeded over 50%. In Japan, the eldest son and his household generally accepts the responsibility of taking care of and managing parental property.
Generally, in Japan, the evaluations of living environments related to family properties or relationships were higher for hometowns than those for current residences as shown in Table 2. That is because people tend to live away from home independently, while their parents and housing property continue to stay at their hometown. The influences of these living environments are much stronger than those of other destinations for migration, for people whose parents have become older (especially for eldest sons). Other studies have indicated that these family-related factors may motivate U-turn migration. This result affirms this motivation as a strong factor for decision making.
Regarding the different influences among these nodes, in contrast to the case of Node 15, the evaluations of family-related factors were not critical as for Node 12 and Node 18 respondents. Their evaluations of other living environments in both regions conflicted to some extent because each region had different levels of attractiveness to live. They demonstrated a neutral motivation toward U-turn migration, even after considering the factors related to family properties or relationships. At Node 15, the ratio of respondents whose age was over 60 was much higher than at the other two nodes. A previous survey in Japan [10] showed that the more people age, the more negative their desire for migration to their places of birth and childhood became. The same survey also showed that this tendency was strong among people aged over 60.
This suggests that people at Node 15 had low motivation toward U-turn migration because of their ages and the existing good conditions regarding family factors, and despite their lack of negative motivations toward migrating to their hometowns. By contrast, the influence of family factors seemed to be smaller for respondents at Nodes 12 and 18 than for those at Node 15. Their younger age appeared to dispose them more positively toward a U-turn migration.
The results in this section suggest that it is important to understand the relationships between the demographics characteristics and the influence of living environments on U-turn motivation (i.e., which living environments tend to enhance or reduce U-turn motivation, and whether each living environment is a decisive factor) to promote successful U-turns of the target groups.

3.5. Relationship between the Evaluations of Living Environments and City Characteristics

The results in Section 3.3 indicate that along with the living environments in hometowns, those in the current residences also influenced people’s U-turn motivations. For more effective regional development, it is important to grasp whether each living environment has specific tendencies that depend on unique regional characters. If some tendencies are clarified, the local governments may be better positioned to predict the likelihood of U-turn migration by the current conditions of their regions, or by future conditions that they will realize to meet migrants’ needs. In this section, we focused mainly on city size. It is an important characteristic of cities in the discussion of population disparities, because the population of the municipality is well considered to determine city size (type) in Japan.
Table 8 shows the relationship between city size and the evaluation of living environments used in the decision tree.
Significant associations were found between the city size and evaluations of the transportation and shopping environments, and ease of visiting ancestral graves. For ease of visiting ancestral graves, a test was conducted for the evaluations of both regions, and a significant association was found with only the current residence. For the transportation shopping environments, the larger city size was found to be associated a higher evaluation. These environments are generally developed intensively thorough urban planning in order to meet the needs of a large population. On the other hand, evaluations of visiting ancestral graves had a significant relationship only with the current residences. Moreover, in this case, the relationship was opposite to that of the other two living environments. Several people have better access to plots for their family graves in their hometowns. However, in the large cities, it is difficult to secure lands for new graves that is close to people’s neighborhoods because of intensive land utilization for buildings and a stronger tendency to consider graves as “not in my back yard (NIMBY)” facilities.
The evaluations of other living environments (i.e., attachment to the regions, climate, the ease of supporting parents, and ease of management of inherited lots or houses) had no significant relationship with the city size.
However, as for climate, there was another important factor related to evaluation. Nodes 3 and 13 were last nodes in which low evaluations of the climate reduced the U-turn motivation. When tallied, the ratio of respondents whose hometowns (Node 3) and current residences (Node 13) was located—wholly or partially—in a heavy snowfall area (Figure 4) was much higher (Node 3, 56.5%; Node 13, 54.5%) than the average of all nodes (15.1%). Intense cold and heavy snowfall had a significant influence on the evaluations of climate.
These findings help the local governments of people’s hometowns to effectively develop the region. By combining these with the results from the decision tree, they could estimate the feasibility of a U-turn in the current condition, or the feasibility in the future after further developments of living environments. If individuals’ U-turn motivations are influenced by the evaluation of a particular living environment of one region (hometown or current residence), and the evaluation has a significant relationship with the urban characteristics mentioned above, each local government may be able to estimate the number of people who appear to give an evaluation that meets the branch condition from the city size. Moreover, if the difference between the evaluations of both regions influenced individuals’ U-turn motivations, local governments should determine the conditions required for development (i.e., whether it is necessary to get much higher evaluation than that of other regions, or equivalent evaluation or an equivalent evaluation) from the results of the decision tree. Using the findings in this section, they can estimate the gaps between their own and other regions, using the data of the distributions of potential return migrants’ current residences and their city sizes.

3.6. The Possibility of Promoting Respondent’s U-Turn to Improve the Population Disparities

The results above demonstrate that there are several groups of respondents (last nodes of the decision tree) who had different combinations of living environments as the components of their U-turn motivations. The respondents in each group had different demographic attributes. These results can assist in the construction of living environments or make policies in the regions that promote U-turn migration. Moreover, the results also indicate that the evaluation of several living conditions depends on the urban character of the respondents’ hometowns or current places of residence, notably city size and geographical location. Our results aid in assessing the feasibility of U-turn migration in the current living conditions of each region, and in the new conditions after development.
The results in Section 3.3 show that there are two groups of respondents for which U-turn motivation is high due to good environments in their hometowns, or poor environments in their current locales. However, it is arguable that unless people migrate from large population centers to less dense regions, the impact of improving population disparity will be small or negative. By contrast, in small hometowns for which potential returnees’ U-turn motivations are low, if people’s U-turn motivation is enhanced by solving problems through further development, their U-turn migration to these regions will contribute to improved population disparity. In this section, we assess this possibility of improving population disparity demonstrated by each respondent group in the decision tree. Furthermore, we recommend plans or policies for developing the regional living environments, which is necessary to improve the population disparity for the future regional sustainability.
Table 9 shows the distribution ratio of (1) the city size of respondents’ current residences, (2) the difference between city size of the hometown and place of current residence, and (3) the change in the region of residence in urban areas caused by their hypothetical U-turn. Based on these results, the notable characteristics of the hypothetical change after respondents’ U-turn are summarized in Table 10.
First, several respondents at Nodes 7 and 13 had high motivations toward U-turn migration. In addition, these nodes’ branch conditions contained the living environments that have significant relationships with city features. More respondents (Node 7, 22.8%; Node 13, 27.3%) would migrate from provincial areas to the three major metropolitan areas if they conduct their U-turn migration. In addition, over half these respondents would migrate to larger cities with better shopping or transportation environments, which affects their U-turn motivations. The U-turn motivations of the respondents in these groups have the possibility of increasing, and not reducing, the population disparity, which is an undesirable outcome for Japan. It seems that preventing population outflow from current smaller cities and less populated areas is necessary. One solution is to develop the living environments of these respondents and develop their current places of residence to be more attractive. According to the results of the decision tree, these conditions include the transportation environment (Node 7), attachment to regions (Node 7), and pleasantness of climate (Node 13).
A relationship was found between the evaluations for transportation environment and the city size. For Node 7, respondents’ U-turn motivation was affected by the gap in this factor. However, the jurisdictions of the current residences of over 60% respondents were smaller than those of their hometowns. Therefore, for local governments in these regions must conduct assessments to and interventions to exceed the evaluations of the hometowns.
The evaluation of climate was also significantly low in the heavy snowfall areas. Over half the respondents at Node 13 were living in these areas. Therefore, it is important to prevent population outflow by enhancing residents’ evaluations of the pleasantness of climate. Generally, people living in heavy snowfall areas face difficulties such as snow removal around their houses and traveling in snowy conditions. Examples of effective countermeasures according to an earlier survey [50] include providing more substantial snow removal services for roads, and the adoption of snow-resistant house construction materials or snow melting equipment in built environments, and the provision of financial support. These countermeasures may enhance tolerance to the bad climate and improve their individual evaluations.
Unlike these two living conditions, attachment to the region did not display a significant relationship with the characteristics of cities. Nonetheless, attachment to the region did have a positive relationship with many respondents’ U-turn motivations. This implies that every local government can improve its residents’ evaluations regardless of the city size. Previous studies said that it is important to have frequent contact with regional environments and resources (e.g., urban facilities, nature) through daily movement and having positive impressions of the regional community and local government is important [51,52]. According to these findings, it is effective to provide mobility services that enable peoples’ contact with these regional resources and introduce positive information regarding such regional resources.
Contrary to Nodes 7 and 13, the U-turn motivations of respondents at Nodes 3 and 9 were low due to the bad climatic conditions (Node 3) or insufficient shopping environments (Node 9). At Node 9, over half the respondents’ hometowns were smaller than their current residence. At this node, there were more women and married couples, who have considerable potential to contribute toward a sustainable population structure. Approximately 70% of respondents would move from one rural area to another rural area or stay within the same rural area. Therefore, their U-turn may have a small impact on improving population disparity between the three major metropolitan areas versus other provincial areas. However, the findings also suggest that their U-turns have some potential for improving population disparities within rural areas, which occur between larger provincial cities and smaller depopulated villages.
To achieve this, it is vital to develop the shopping environments of smaller cities. The lack of developed shopping environments in small cities has been recently identified as a social problem in Japan [53]. The results in Table 8 also demonstrate that the shopping environments in smaller cities are evaluated as insufficient. Although it is often difficult to implement a spontaneous increase in the number of stores due to low demands and business opportunities in smaller cities, a number of services that support local shopping (e.g., mobile sales wagons, internet shopping and delivery services) have emerged [54]. Previous studies have demonstrated their effectiveness in mitigating people’s difficulties in daily shopping [55,56]. If these cities develop their accessibility to stores, a sufficient selection of items, and satisfactory shopping experiences by introducing these services for respondents at Node 9, the U-turn motivation of people may increase and contribute to the improvement of population disparities.
Though the majority of U-turn motivations at Node 3 were also low, the ratio of people who migrated to rural hometowns from the three major metropolitan areas was the second highest among all nodes. The younger respondents and women at this node also have the potential to contribute toward a sustainable population structure. In addition, the results showed that the low U-turn motivations of respondents are explained by their low evaluations of climate caused by living in heavy snowfall areas. Thus, the discussion of the means to ameliorate this concern for Node 13 is also applicable in this case.
Nodes 5 and 11 also hold promise to change to improve population disparities among the three metropolitan areas and other rural areas. At Node 5, although the contribution to the improvement of population sustainability was low due to a high ratio of elderly people, attachment to hometown was an important factor for enhancing U-turn motivations. In order to promote their U-turn migrations, measures are required to raise respondents’ attachment to their hometowns. According to the findings of previous studies, one strategy is to increase the opportunities for people to connect with their regional environments and resources, by providing financial aid or a social system to make their visits to their hometowns easier. Another is to remotely inform them of regional information such as good news or regional resources (e.g., through social networking service or internet). This may invoke pride for their hometowns in people and enhance their attachment. Furthermore, similar steps may also prove effective for potential U-turn migrants at Node 9, whose attachment to their hometowns conflicts with their attachment to the current residential locations.
By contrast, the respondents at Node 11 had stronger attachments to their hometowns than to their current residences. These respondents’ evaluations of the climate conditions in their hometowns were relatively high. Likewise, their evaluation of the ease of supporting their parents was also an important factor for their U-turn motivation. However, low evaluations of this living environment reduced their U-turn motivations. Although it is contrary to the results of other branches, it is assumed that respondents whose U-turn motivation were medium were preferentially extracted at Node 12. The rest were respondents at Node 11, for whom a higher evaluation of the transportation environment at their current residential places exerted a stronger influence. However, it is necessary to assess the effects of the evaluations of ease of supporting parents in order to plan countermeasures. A weak but positive correlation (r = 0.22, N = 474) was found between the U-turn motivations and the evaluations of this living environment in the hometown. This suggests that the better the environment for supporting parents in hometowns, the higher the respondents’ U-turn motivations. The development of the conditions under which people can migrate to support their parents is important for this group. For example, recently in Japan, several local governments have started providing financial support to children when they migrate to their parents’ cities of residence [57]. Living near parents also offers benefits for the children’s generation as their parents can look after the grandchildren. The enrichment of these support systems may boost these people’s decisions regarding a U-turn migration.
For Node 11, it is necessary to develop the transportation environments in respondents’ hometowns. However, many of the respondents in this group were living in bigger cities, such as ordinance-designated cities or the 23 wards of Tokyo; by implication, their hometowns tend to be smaller in size. It is not easy for these places to develop a level of transportation that competes with big cities. Thus, it is important to utilize the existing urban planning system, including restructuring of the previous transportation system, such as location normalization planning.

4. Conclusions

4.1. Summary of Study and Applicability of Findings

This study involved a survey of respondents across Japan to arrive at suggestions for developing the regional living environments to promote people’s spontaneous U-turn migrations. Our final goal was to provide suggestions for the improvement of population disparities in the whole of Japan by people’s U-turn migrations.
Our analyses focused on the relationships between respondents’ evaluations of the living environments and their disposition toward U-turn migration. The questionnaire included questions related to living conditions. Using a decision tree analysis of the responses to these questions, we determined the living environments that affect people’s U-turn motivations, and the kinds of development that may spur actual return migration. In the decision tree model, respondents were classified into eleven groups of members with similar demographic features and requirements for regional living environments. The results indicate a multilayered relationship between U-turn motivation and the evaluations of various living environments. By adopting this approach, we were able to determine not only the factors with some potential for promoting U-turn migration, but also factors that may prevent U-turns.
One of our important findings was that respondents’ U-turn motivations were affected by not only their evaluation of the living environments in their hometowns, but also by their evaluations of the current places of residence. In several instances, the current place of residence worked independently from the conditions in the hometown; however, in other cases, they interacted and influenced U-turn motivation. Through quantitative analyses and interpretations, this study partly explains people’s decision-making processes for U-turn migration.
The influence of individual living conditions in the decision tree indicates that enhancing the evaluation of the attachment to regions and the climate were indispensable for promoting people’s U-turns. The differences in evaluations of these items strongly altered the tendency toward U-turn migration, appearing as the first branch condition from Node 0 or Node 1. In addition, the living environments related to family properties and relationships were also important factors for U-turn, especially for the eldest sons and their families. In Japan, the eldest son and his household are generally responsible for caretaking of his elderly parents, along with the inheritance and management of parental properties; these properties and relatives were often located in the respondents’ hometowns. These results add quantitative evidence to the findings of previous studies that used qualitative approaches.
Regarding the distribution ratio of the U-turn motivation for each group, motivation was low over half the decision tree groups. Although several groups had high U-turn motivations, their motivations tended to encourage the population disparities as their return migration would take them to cities with larger populations. Large cities tended to receive high evaluations because of their favorable transportation environments and shopping opportunities. In conjunction with these results, living conditions related to convenience sometimes became critical factors for reducing U-turn motivation. The case of shopping environment for respondents at Node 9 is an example; however, their potential U-turns may significantly contribute toward the improvement of population disparities, as many of them would return to rural provincial areas or smaller cities.
Other groups, such as Nodes 5 and 11, had more respondents whose hometowns were located in rural provincial areas or smaller cities. The U-turn migration of respondents at these nodes can also bring improvements to population disparities. For these groups, the living environments of which the evaluations depended on the city size were not included or did not represent as critical deterrents to U-turn motivations. However, for encouraging the U-turn migrations of the members of these groups, it was necessary to enhance the living conditions in their hometowns or fill the gap between their evaluations of the current residences and those of hometowns.
These results suggest that spontaneous U-turn migrations can improve population disparities, but these cases do not easily occur under the present circumstances in Japan. Especially for hometowns in rural provincial areas or in smaller cities, it is necessary to secure an appropriate size and composition of the population. To encourage people’s U-turn migrations through the development of living conditions in hometowns, it is important to clarify the target groups, as well as to determine the living environments that need development. In addition, planners need to understand the current conditions of living environments in their own locations, and in the cities in which potential U-turn migrants now live, especially if the selected living environments depend on city size or geographic characteristics as their centerpieces to development. However, thus far, it has been difficult for planners to select the appropriate conditions that they should be developed. It was also difficult to judge in what cases they should consider the living environments of other cities. This is partly because of the variety of the living environments and the preference of individuals.
This study contributes to a systematic analysis of the relationship between people’s U-turn motivations and their evaluations of living environments. In addition, we assessed the attributional characters of respondents in each group. If the attributions (e.g., gender, age, family type) of potential return migrants are determined for promoting U-turn, as we have attempted to do here, the results will provide local governments with useful information for planning and developing attractive living environments.
As a result, some local governments in smaller cities may need to develop those living environments in the current places of residence and hometowns that influence the U-turn motivations. It is important for them to further assess if and how the evaluation of these living conditions may depend on the character of the city. To this end, realistic policy making must bridge the current gap between both regions. Our findings also help determine the conditions that must be met for the targets groups to conduct their spontaneous U-turn. According to analysis in this study, the evaluation of three kinds of living environments (i.e., transportation, shopping, visiting ancestral graves) tended to depend on city size, while the evaluations for climate tended to depend on the geographic characteristics (e.g., heavy snow fall). If these living environments are included in the people’s requirements for U-turns, the local governments can estimate the scale of improvements to living conditions and intervene accordingly. From these findings, local governments can also gauge the feasibility of meeting these requirements. Estimation and feasibility studies can be conducted by selecting particular living environments as priority candidates for development and understanding the current places of residence of potential U-turn migrants. On the other hand, if local environments consider the living conditions not related to city size, such as attachment to the region, policies to enhance their evaluations will be useful countermeasures against the attractions of large cities, while taking advantage of smaller cities’ unique features.
However, it is noteworthy that local governments should not concentrate only on the living environments as problems. In this study, we determined two types of living environments that were important factors for people’s return migrations. One consisted of the living conditions that should be enhanced through more development, while the other included living conditions that should be maintained at their present levels. If little attention is paid to the latter living environments, the region may be unable to meet all necessary conditions for increasing the U-turn motivation of target groups. In some instances, these motivations may even decline. Thus, acknowledging the multilayered relationships between the living conditions can help to prevent such negative outcomes.

4.2. Limitations and Future Directions

This study provides new findings regarding the relationships among people’s U-turn motivations and their subjective evaluations of living environments. These findings can help local governments to create policies for promoting U-turns and improving population disparities in Japan. However, there are some limitations that call for further research.
First, more advanced analytical methods should be utilized. The information root node variation (IRNV) method [58] is one such method. This would overcome the weakness of the decision tree method in which the adopted branch rules are constrained by the root variable. The IRNV method would provide more robust explanations for the reasons for U-turn migration.
Second, additional steps in individuals’ decision-making processes should be taken into account. To directly examine the influence of the evaluations of living environments, we focused on the motivation of people toward U-turn migrations. However, we did not examine the influence of possibility, such as economic conditions or social positions. These factors are considered when people decide to migrate. We did not compare the importance of these factors in the decision-making process; such a comparison will provide invaluable findings regarding the common factors among decision stages or stage-specific factors. It is likely that stage-specific factors are not essential in decision making, but they may be important considerations for enhancing the satisfaction of lives and encouraging a longer settlement. Outcomes from such research would enable local governments to plan and develop policies more effectively.
Third, future research should not only consider the subjective evaluations of the living environments, but also their objective measures. Although we determined how much development each region needs by using respondents’ subjective evaluations, we did not yet examine the relationships between their subjective evaluations and objective conditions. Clarification of this relationship will provide standards for development targets with objective indices.
Finally, considerations of other destinations of migration are also necessary. In this study, we selected a specific destination—the hometown. However, the destinations of people’s spontaneous migration should be more varied in future research. Destinations other than hometowns may potentially improve population disparities. Although we prioritize U-turn migration in this study, for some regions, new residents who have never lived in the region may contribute to population sustainability. Among the living environments that affect U-turn motivations, developing the transportation or daily shopping environments in rural and smaller cities would also enhance the attractiveness of the regions for new residents. If another survey is conducted, we can verify the impact of the development of these living environments not only on return migrants, but also on new residents. The development of one living environment that enhances both types of people’s motivation to migrate would be a more effective countermeasure for improving population disparities in Japan. Future studies should focus on understanding the larger context of decisions to migrate and the motivations behind them.

Author Contributions

Conceptualization, S.T. and H.N.; methodology, S.T., H.N. and S.H.; validation, S.T., S.H. and H.N.; formal analysis, S.T.; investigation, S.T., H.N., S.H. and T.Y.; data curation, S.T. and T.Y.; writing—original draft preparation, S.T.; writing—review and editing, S.T.; visualization, S.T.; supervision, S.T.; project administration, S.T.; funding acquisition, H.N.

Funding

This research was funded by the Ministry of Land, Infrastructure, Transport and Tourism in 2015 (for Hayashi, N.) and the APC was funded by JSPS KAKENHI GRANT NUMBER 17K14785.

Acknowledgments

This work is supported by the Ministry of Land, Infrastructure and Transport and JSPS KAKENHI GRANT NUMBER 17K14785.

Conflicts of Interest

The authors have no conflict of interest to declare. The funders had no role in the design of the study; in the collection, analyses, or interpretation of data; in the writing of the manuscript, or in the decision to publish the results.

Appendix A

Table A1. The value of importance of each variable adopted in the decision tree.
VariableImportance 1
Attachment to region_Difference31.01
Pleasantness of climate_Hometown8.03
Pleasantness of climate_Current residence5.01
Pleasantness of climate_Difference9.73
Sufficiency of traffic environment_Hometown5.43
Ease of supporting parents_Current residence4.03
Sufficiency of daily shopping environment_Hometown5.75
Ease of visiting ancestral graves_Hometown4.47
Ease of caring for inherited lots or houses_Hometown3.63
1 The values of importance were not normalized. Each value was computed using the rpart package of R ver.3.2.0. The definition of importance and methods of calculation were based on Breiman et al. [41].

References

  1. Fukutsuka, Y.; Abe, T. The impacts on the living environment caused by regional population gaps, and its countermeasures—Toward maintenance and preservation of the secondary-nature in mountainous areas. Q. J. Pub. Pol. Mgmt. 2007, 1, 15–32. [Google Scholar]
  2. Long-Term Transition of the Total Population in Japan. Available online: http://www.soumu.go.jp/main_content/000273900.pdf (accessed on 7 June 2019).
  3. The Summary of the Result of Population Estimation in October 2018. Available online: https://www.stat.go.jp/data/jinsui/2018np/index.html (accessed on 7 June 2019).
  4. Summary about Future Direction of Examinations for a Longitudinal Perspective of Sustainable National Land. Available online: http://www.mlit.go.jp/common/000134593.pdf (accessed on 12 February 2019).
  5. Sato, R.; Kidokoro, T.; Seta, F. Difference of preference pattern about local lifestyle image between people interested in migration and people able to migrate: Focusing on the image about quality of lifestyle and workstyle after migration. J. City Plan. Inst. Jpn. 2014, 49, 945–950. [Google Scholar]
  6. Hayashi, N.; Sugino, H.; Sekiguchi, T. A basic study on migrations of out-migrants to their native place—From the view of wish, demand and possibility related to migration. In Proceedings of the Spring Conference of The Association of Rural Planning, Tokyo, Japan, 14 April 2018; pp. 42–43. [Google Scholar]
  7. A Study toward Establishing a Multigenerational Society and a Recycling-Based Society by Grasping Factors in the Choices of Dwelling Place and Living Arrangement. Available online: http://www.mlit.go.jp/pri/kouenkai/syousai/pdf/research-p140528/08.pdf (accessed on 12 February 2019).
  8. Wakabayashi, Y. Evaluation of the residential environment using subjective measures of life quality: A case study of Tama New Town, Tokyo. Notes Theor. Geogr. 1998, 11, 9–29. [Google Scholar]
  9. The 8th Annual Population and Social Security Surveys. Available online: http://www.ipss.go.jp/ps-idou/j/migration/m08/mig08.asp (accessed on 7 June 2019).
  10. White Paper on Land Infrastructure, Transport and Tourism in Japan. 2015. Available online: http://www.mlit.go.jp/hakusyo/mlit/h26/index.html (accessed on 12 February 2019).
  11. Harrison, J.A. Rust Belt boomerang: The pull of place in moving back to a legacy city. City Community 2017, 16, 263–283. [Google Scholar] [CrossRef]
  12. Data on Population Flow to the Regions. Available online: http://www.soumu.go.jp/main_content/000460085.pdf (accessed on 12 February 2019).
  13. Summary of a Survey about Factors of Migration and Settlement, and Living Condition in Small Municipality. Available online: https://www.keieiken.co.jp/survey/goo/pdf/20140708.pdf (accessed on 12 February 2019).
  14. Ogawa, K.; Fukada, H. A study of young people’s U-turn behavior in “Kaso” communities with rapid decrease of population. Jpn. J. Exp. Soc. Psychol. 1976, 16, 110–120. [Google Scholar] [CrossRef]
  15. Yamaguchi, Y.; Esaki, Y.; Matsuyama, K. Return migration of new university graduates and their job seeking processes: A case study of Shonai Region, Yamagata Prefecture. Q. J. Geogr. 2010, 62, 211–221. [Google Scholar] [CrossRef]
  16. Kobayashi, T. A study of the reasons and mechanisms by which young men resign from non-agricultural jobs and succeed their parents in farming. Jpn. J. Farm Manag. 2002, 40, 1–10. [Google Scholar]
  17. Okazaki, K.; Goto, H.; Yamazaki, Y. A study on several factors in increasing of returnees—In case of village Nishimera, Miyazaki Prefecture. J. City Plan. Inst. Jpn. 2004, 39, 25–30. [Google Scholar]
  18. Conway, K.S.; Houtenville, A.J. Out with the old, in with the old: A closer look at younger versus older elderly migration. Soc. Sci. Q. 2003, 84, 309–328. [Google Scholar] [CrossRef]
  19. Kondo, A.; Aoyama, Y.; Takada, H. Study on migration in rural region. Infrastuct. Plan. Rev. 1995, 12, 171–178. [Google Scholar] [CrossRef]
  20. Ai, H. How living environment indices effect on population change patterns of local districts: An analysis on urban area in the Greater Tokyo Area. J. City Plan. Inst. Jpn. 2014, 49, 567–572. [Google Scholar]
  21. Ai, H. Indexing of living environment attracts young and productive age generations: An analysis based on local districts within the Greater Tokyo Metropolitan Area. J. City Plan. Inst. Jpn. 2016, 51, 860–866. [Google Scholar]
  22. Hwang, S.S.; Albrecht, D.E. Constrains to the fulfillment of residential preference among Texas homebuyers. Demography 1987, 24, 61–76. [Google Scholar] [CrossRef] [PubMed]
  23. Fredrickson, C.; Heaton, T.B.; Fuguitt, G.V.; Zuiches, J.J. Residential preferences in a model of migration intentions. Popul. Environ. 1980, 3, 280–297. [Google Scholar] [CrossRef]
  24. Fuguitt, G.V.; Zuiches, J.J. Residential preference and population distribution. Demography 1975, 12, 491–504. [Google Scholar] [CrossRef] [PubMed]
  25. Gustavus, S.O.; Brown, L.A. Place attributes in a migration decision context. Environ. Plan. A 1977, 9, 529–548. [Google Scholar] [CrossRef]
  26. Kim, T.K.; Horner, M.W.; Marans, R.W. Life cycle and environmental factors in selecting residential and job locations. Hous. Stud. 2005, 20, 457–473. [Google Scholar] [CrossRef]
  27. Nishiyama, Y.; Nakatani, J.; Kurisu, K.; Aramaki, T.; Hanaki, K. Analysis of residential choice behavior based on classification of residential preference. Environ. Syst. Res. 2011, 67, II_1–II_10. [Google Scholar] [CrossRef]
  28. Dökmeci, V.; Berköz, L. Residential-location preferences according to demographic characteristics in Istanbul. Landsc. Urban Plan. 2000, 48, 45–55. [Google Scholar] [CrossRef]
  29. Reichert, C.V.; Cromartie, J.B.; Arthun, R.O. Reasons for returning and not returning to rural U.S. communities. Prof. Geogr. 2012, 66, 58–72. [Google Scholar] [CrossRef]
  30. Niedomysl, T.; Amcoff, J. Why return migrants return: Survey evidence on motives for internal return migration in Sweden. Popul. Space Place 2010, 17, 656–673. [Google Scholar] [CrossRef]
  31. Vega, A.; Hirschman, K. The reasons older immigrants in the United States of America report for returning to Mexico. Ageing Soc. 2017, 39, 722–748. [Google Scholar] [CrossRef] [Green Version]
  32. Reichert, C.V. Returning and new Montana migrants: Socio-economic and motivational differences. Growth Chang. 2002, 32, 447–465. [Google Scholar] [CrossRef]
  33. Newbold, K.B. Counting migrants and migrations: Comparing lifetime and fixed-interval return and onward migration. Econ. Geogr. 2001, 77, 23–40. [Google Scholar] [CrossRef]
  34. Pekkala, S. Migration flows in Finland: Regional differences in migration determinants and migrant types. Int. Reg. Sci. Rev. 2003, 26, 466–482. [Google Scholar] [CrossRef]
  35. Constant, A.; Massey, D.S. Return migration by German guestworkers: Neoclassical versus new economic theories. Int. Migr. 2002, 40, 5–38. [Google Scholar] [CrossRef]
  36. Démurger, S.; Xu, H. Return migrants: The rise of new entrepreneurs in rural China. World Dev. 2011, 39, 1847–1861. [Google Scholar] [CrossRef]
  37. Rérat, P. Highly qualified rural youth: Why do young graduates return to their home region? Child. Geogr. 2012, 12, 70–86. [Google Scholar] [CrossRef]
  38. Park, J.; Kim, K. The residential location choice of the elderly in Korea: A multilevel logit model. J. Rural Stud. 2016, 44, 261–271. [Google Scholar] [CrossRef] [Green Version]
  39. Katada, T.; Hirobata, Y.; Aoshima, N. A dynamic out/in migration model for rural depopulation problems. J. Jpn. Soc. Civ. Eng. 1990, 1990, 105–114. [Google Scholar]
  40. Uyama, M.; Yoshino, A.; Kitano, S. What drives residents to protest against the construction of a NIMBY Facility? Quantitative analysis based on a virtual survey. Ikoma J. Econ. 2013, 11, 155–167. [Google Scholar]
  41. Breiman, L.; Eriedman, J.H.; Olshen, R.A.; Stone, C.J. Classification and Regression Trees; Chapman and Hall/CRC: London, UK, 1984; pp. 1–92, 217–264. [Google Scholar]
  42. Rokach, L.; Maimon, O. Decision Trees. In Data Mining and Knowledge Discovery Handbook; Maimon, O., Rokach, L., Eds.; Springer: Boston, MA, USA, 2005; pp. 165–192. [Google Scholar]
  43. Milsum, J.H. Determining optimal screening policies using decision trees and spreadsheets. Comput. Biol. Med. 1989, 19, 231–243. [Google Scholar] [CrossRef]
  44. Byrd, E.T.; Gustke, L. Using decision trees to identify tourism stakeholders: The case of two Eastern North Carolina counties. Tour. Hosp. Res. 2007, 7, 176–193. [Google Scholar] [CrossRef]
  45. An, J.; Yoshida, T.; Munemoto, J. Study on fear of visitors of elderly people living alone in suburban housing estates. J. Archit. Plan. 2009, 74, 735–742. [Google Scholar] [CrossRef]
  46. Gutiérrez, S.L.M.; Rivero, M.H.; Ramírez, N.C.; Hernández, E.; Aranda-Abreu, G.E. decision trees for the analysis of genes involved in Alzheimer’s disease pathology. J. Theor. Biol. 2014, 357, 21–25. [Google Scholar] [CrossRef] [PubMed]
  47. Consideration of Aim and Indices for Improving Social Infrastructure by City Size. Available online: http://www.mlit.go.jp/singikai/koutusin/koutu/shoiinkai/5/images/42.pdf (accessed on 12 February 2019).
  48. An Attitude Survey about Participation in Regional Societies of Elderly People. 2003. Available online: https://www8.cao.go.jp/kourei/ishiki/h15_sougou/html/0-1.html (accessed on 12 February 2019).
  49. Brown, B.; Perkins, D.; Brown, G. Place attachment in a revitalizing neighborhood: Individual and block levels of analysis. J. Environ. Psychol. 2003, 23, 259–271. [Google Scholar] [CrossRef]
  50. A Survey for Succeeding Method to Spend the Comfortable Lives in a Snowy Distinct. Available online: http://www.mlit.go.jp/kokudoseisaku/chisei/crd_chisei_tk_000038.html (accessed on 12 February 2019).
  51. Suzuki, H.; Fujii, S. Study on effects of contact level to regional environment during travel on emotional attachment to local areas. J. Jpn. Soc. Civ. Eng. 2008, 64, 179–189. [Google Scholar] [CrossRef]
  52. Hikichi, H.; Aoki, T. Investigation of psychological process of attachment formation to residence. In Proceedings of the 1st Conference for Architecture and Infrastructure Environment, JSCE, Tokyo, Japan, 10 December 2005; Volume 1, pp. 232–235. [Google Scholar]
  53. Sekiguchi, T.; Hino, K.; Ishii, N. Analysis of shopping behavior of elderly people considering the satisfaction of quality and distance to grocery stores—Focusing on the “Latent shopping refuges”. J. City Plan. Inst. Jpn. 2016, 51, 372–379. [Google Scholar]
  54. The List of Support Programs for Disadvantaged Shoppers by Local Governments. 2017. Available online: http://www.meti.go.jp/policy/economy/distribution/29fyjichitai.pdf (accessed on 12 February 2019).
  55. Suzuki, Y.; Hosaka, A.; Hino, S. Study on shopping shuttle bus services effect and problem for elderly in marginal village. J. Jpn. Soc. Civ. Eng. 2016, 72, I_731–I_742. [Google Scholar]
  56. Iwama, N.; Tanaka, K.; Komaki, N.; Ikeda, M.; Asakawa, T. Mapping residential areas of elderly people at high risk of undernutrition: Analysis of mobile sales wagons from the viewpoint of food desert issues. J. Geogr. 2016, 125, 583–606. [Google Scholar] [CrossRef]
  57. Hino, K.; Ishii, N.; Sekiguchi, T.; Baba, H. Current situation and benefits of living near relatives in a far suburban residential area—Case study in Koma-Musashidai District in Hidaka City, Saitama. J. Archit. Plan. 2018, 83, 1497–1504. [Google Scholar] [CrossRef]
  58. Moral-García, S.; Castellano, J.G.; Mantas, C.J.; Montella, A.; Abellán, J. Decision tree ensemble method for analyzing traffic accidents of novice drivers in urban areas. Entropy 2019, 21, 360. [Google Scholar] [CrossRef]
Figure 1. The spatial distribution of respondents’ current residences by municipal unit.
Applsci 09 02748 g001
Figure 2. The spatial distribution of respondents’ hometowns by municipal unit.
Applsci 09 02748 g002
Figure 3. The results of the decision tree analysis, showing eleven nodes (bold-lined boxes) representing significant categories.
Applsci 09 02748 g003
Figure 4. The heavy snowfall areas in Japan.
Applsci 09 02748 g004
Table 1. Demographic characteristics of respondents.
VariableN%
Total 1056100
GenderMale58755.6
Female46944.4
Age<30767.2
30–3918117.1
40–4932630.9
50–5924323
≧6023021.8
Marital status and living with a child or childrenUnmarried33231.4
Married and living with a child/children45743.3
Married but not living with any child/children26725.3
Municipal type of current residence 1,2Ordinance-designated city 4, the 23 wards of Tokyo 17116.2
Heartland city, specially designated city33932.1
City with population ≧ 0.1 million20319.2
City with population < 0.1 million27325.9
Town and village 706.6
Municipal type of hometown 1,2Ordinance-designated city 4, the 23 wards of Tokyo 12925.9
Heartland city, specially designated city11322.6
City with population ≧ 0.1 million7815.6
City with population < 0.1 million12725.5
Town and village5210.4
Area of current residence 3Three major metropolitan areas of Japan24122.8
Other areas81577.2
Area of hometown 2,3Three major metropolitan areas of Japan18537.1
Other areas31462.9
1 Municipalities were categorized with reference to the previous survey in Japan [47]. The population of each municipality was based on the national census taken on October 1st, 2015. 2 Respondents who answered that their current residences and hometown were the same were excluded from the aggregation. 3 “Three major metropolitan areas” refers to the Tokyo area (Tokyo, Kanagawa, Saitama, and Chiba Prefectures), Nagoya area (Aichi, Gifu, and Mie Prefectures) and Osaka area (Osaka, Kyoto, Hyogo, and Nara Prefectures). 4 Ordinance-designated cities comprise a type of local government in Japan. Each ordinance-designated city has over half a million of people, and most of the administrative powers and responsibilities are normally attached to the prefectural governments. There are several administrative wards in an ordinance-designated city and each ward has its own public office.
Table 2. A list of living environments and respondents’ evaluations.
Current ResidenceHometown
NMeanSDMeanSD
Sufficiency of daily shopping environment5113.521.093.301.16
Sufficiency of medical, welfare and nursing environment5113.290.963.240.98
Sufficiency of working environment 5113.080.963.061.05
Sufficiency of child-rearing environment5113.300.913.250.90
Sufficiency of traffic environment5113.071.203.191.18
Sufficiency of communications infrastructure5113.520.943.401.00
Ease of securing residences5113.450.983.340.95
Few objectionable facilities5113.590.963.490.90
Pleasantness of climate5113.571.063.441.01
Sufficiency of green and natural environment5113.740.943.571.05
Low risk of natural disasters5113.521.093.451.00
Attachment to region5113.240.963.500.92
Abundance of regional events 5113.240.913.290.89
Ease of participation in community5113.160.873.270.84
Sufficiency of religious facilities (shrines and temples)5113.340.973.330.97
Sufficiency of support from parents and other relatives5113.041.003.460.92
Sufficiency of support from other people5113.030.913.350.89
Ease of management for inherited lots or houses5112.940.923.240.92
Ease of supporting parents5112.981.073.411.01
Ease of visiting ancestral graves5112.961.123.421.08
Table 3. The difference in U-turn motivation according to the evaluation of living environments in their hometown.
Ratio (Adjusted Residuals)
Level of U-Turn Motivation
NHighMediumLow
All respondents51123.537.039.5
Overall rating of living environment 1,2High23136.8(6.45)37.7(0.29)23.5(−5.87)
Medium22414.3(−4.33)41.5(1.87)44.2(1.91)
Low565.4(−3.39)16.1(−3.44)78.6(6.33)
1 The 5-point scale rankings were combined into three levels for analysis (high = 5, 4; medium = 3; low = 2, 1).2 Significant relationships were found at the two-sided 1% significance level (Chi-squared test).
Table 4. Willingness to remain at the current residence determined by the evaluation of the living environment at current place of residence.
Ratio (Adjusted residuals)
Level of Willingness to Stay
NHighMediumLow
All respondents105661.027.011.9
Overall rating of living environment 1,2High56781.7(14.8)14.2(−9.94)3.8(−8.69)
Medium38339.4(−10.8)46.2(10.5)14.4(1.84)
Low10628.3(−7.27)25.5(−0.39)46.2(11.5)
1 As described above, the 5-point scale rankings were combined into three ranks: high = 5, 4; medium = 3; low = 2, 1. 2 Significant relationships were found at the two-sided 1% significance level (Chi-squared test).
Table 5. The summaries of branch conditions and their rankings at each last node.
NodeBranch Conditions 1 (Living environment; The Evaluation)
Node 3Attachment to region; Hometown > Current residence
→ Pleasantness of climate in Hometown; Low
Node 5Attachment to region; Hometown < Current residence (Especially difference > 2)
Node 7Attachment to region; Hometown > Current residence
→ Pleasantness of climate in Hometown; Medium or High
→ Sufficiency of traffic environment; Hometown ≧ Current residence
Node 9Attachment to region; Hometown ≦ Current residence (Especially difference = 0 or 1)
→ Sufficiency of daily shopping environment in Hometown; Low
Node 11Attachment to region; Hometown > Current residence
→ Pleasantness of climate in Hometown; Medium or High
→ Sufficiency of traffic environment; Hometown < Current residence
→ Ease of supporting parents in Current residence; Low or Medium
Node 12Attachment to region; Hometown > Current residence
→ Pleasantness of climate in Hometown; Medium or High
→ Sufficiency of traffic environment; Hometown < Current residence
→ Ease of supporting parents in Current residence; High
Node 13Attachment to region; Hometown ≦ Current residence (Especially difference = 0 or 1)
→ Sufficiency of daily shopping environment in Hometown; Medium or High
→ Pleasantness of climate in Current residence; Low
Node 15Attachment to region; Hometown ≦ Current residence (Especially difference = 0 or 1)
→ Sufficiency of daily shopping environment in Hometown; Medium or High
→ Pleasantness of climate in Current residence; Medium or High
→ Ease of visiting ancestral graves; Hometown < Current residence
(Especially difference > 2)
Node 18Attachment to region; Hometown≦ Current residence (Especially difference = 0 or 1)
→ Sufficiency of daily shopping environment in Hometown; Medium or High
→ Pleasantness of climate in Current residence; Medium or High
→ Ease of visiting ancestral graves; Hometown ≧ Current residence,
(Including difference = 1 as the case that both evaluations are almost the same)
→ Ease of caring for inherited lots or houses in Hometown; High
Node 19Attachment to region; Hometown≦ Current residence (Especially difference = 0 or 1)
→ Sufficiency of daily shopping environment in Hometown; Medium or High
→ Pleasantness of climate in Current residence; Medium or High
→ Ease of visiting ancestral graves; Hometown ≧ Current residence,
(Including difference = 1 as the case that both evaluations are almost the same)
→ Ease of caring for inherited lots or houses in Hometown; Low or Medium
→ Pleasantness of climate; Hometown > Current residence
Node 20Attachment to region; Hometown≦ Current residence (Especially difference = 0 or 1)
→ Sufficiency of daily shopping environment in Hometown; Medium or High
→ Pleasantness of climate in Current residence; Medium or High
→ Ease of visiting ancestral graves; Hometown ≧ Current residence,
(Including difference = 1 as the case that both evaluations are almost the same)
→ Ease of caring for inherited lots or houses in Hometown; Low or Medium
→ Pleasantness of climate; Hometown ≦ Current residence
(Especially difference is = −2~0)
1 Branch conditions were ordered from the one located at the top of the decision tree. Therefore, the order mostly coincided with the ranking of the importance of variables, which was computed to determine the U-turn motivation (Appendix A).
Table 6. The distribution ratio of the demographic characteristics of individuals in each group.
WholeNodeNodeNodeNodeNodeNodeNodeNodeNodeNodeNode
357911121315181920
N47423281015726112218554489
Age **1
<305.78.73.67.91.87.70.018.20.03.62.36.7
30–3917.130.410.720.814.015.445.518.20.07.313.621.3
40–4929.321.725.034.731.634.618.218.238.940.013.627.0
50–5922.417.421.417.821.123.136.418.216.732.736.416.9
≧6025.521.739.318.831.619.20.027.344.416.434.128.1
Gender
Male52.343.567.947.545.646.272.750.055.663.656.849.4
Female47.756.532.152.554.453.827.350.044.436.443.250.6
Family structure **1
Unmarried21.926.132.119.810.534.69.122.716.716.431.824.7
Married and living with a child, children46.421.739.352.554.442.372.731.850.054.522.750.6
Married but not living with a child, children, or no child31.652.228.627.735.123.118.245.533.329.145.524.7
Whether the respondent is the eldest son
Eldest son38.239.150.034.736.830.863.631.822.254.538.632.6
Others61.860.950.065.363.269.236.468.277.845.561.467.4
1 **: p < 0.05; no sign: not significant (Chi-square test).
Table 7. The notable demographic characteristics of each node.
NodeThe Notable 1 Demographic Characteristics
of Each Node
Prevailing Level of U-Turn Motivation
Node 3- The ratio of younger people (age < 40), women and married couples who did not live with children, than for other nodes Low
- Approximately 80% of respondents had a car in their household
Node 5- The ratio of both unmarried respondents and those over the age of 60 were higher than of other nodesLow
Node 7-High
Node 9- Approximately 90% of respondents were marriedLow
- More women than men
Node 11-Low
Node 12- Most respondents were 30 to 39 years old or 50 to 59 years oldMedium
- The ratio of the eldest sons was highest of all nodes
Node 13-High
Node 15- Respondents were only 40 years and olderLow
(especially, over 40% of respondents were over 60 years old)
Node 18- Most respondents were over 40 years oldMedium
- The ratio of the eldest sons was over 50%
Node 19-Low
Node 20-Medium
1 Only the characteristics that were mentioned in the texts below have been described.
Table 8. Relationship between city size and the evaluation of living environments.
Evaluation of Living Environment
Current ResidenceHometown
HighMediumLowHighMediumLow
Attachment 1N = 173N = 227N = 74N = 231N = 199N = 44
Ordinance-designated city,
the 23 wards of Tokyo
22.518.921.62626.629.5
Heartland city,
specially designated city
24.325.62320.323.120.5
City with population ≧ 0.1 million16.821.617.614.717.115.9
City with population < 0.1 million28.926.9726.825.625
Town and village 7.578.112.17.59.1
Transportation environment
(Current residence: ***, Hometown: ***) 1
N = 184N = 138N = 152N = 194N = 155N = 125
Ordinance-designated city,
the 23 wards of Tokyo
27.72111.840.72012.8
Heartland city,
specially designated city
26.123.923.723.225.214.4
City with population ≧ 0.1 million20.118.818.411.918.718.4
City with population < 0.1 million19.62937.518.626.537.6
Town and village 6.57.28.65.79.716.8
Climate 1N = 269N = 136N = 69N = 233N = 166N = 75
Ordinance-designated city,
the 23 wards of Tokyo
21.623.511.627.927.720
Heartland city,
specially designated city
25.32521.722.721.118.7
City with population ≧ 0.1 million17.821.320.31219.918.7
City with population < 0.1 million2922.834.827.922.928
Town and village 6.37.411.69.48.414.7
Visiting ancestral graves
(Current residence: **) 1
N = 109N = 245N = 120N = 216N = 177N = 81
Ordinance-designated city,
the 23 wards of Tokyo
13.822.922.527.323.232.1
Heartland city, specially designated city16.526.129.219.423.223.5
City with population ≧ 0.1 million22.917.1201319.814.8
City with population < 0.1 million 34.926.924.228.724.922.2
Town and village 11.96.94.211.697.4
Supporting parents1N = 122N = 235N = 117
Ordinance-designated city,
the 23 wards of Tokyo
1822.619.7
Heartland city,
specially designated city
17.228.524.8
City with population ≧ 0.1 million2317.418.8
City with population < 0.1 million33.623.830.8
Town and village8.27.76
Shopping environment
(Hometown: ***) 1
N =219N = 146N = 109
Ordinance-designated city,
the 23 wards of Tokyo
35.221.915.6
Heartland city,
specially designated city
24.222.614.7
City with population ≧ 0.1 million 14.617.116.5
City with population < 0.1 million 20.22638.5
Town and village 5.912.314.7
Management for inherited lots or houses 1 N = 144N = 270N = 60
Ordinance-designated city,
the 23 wards of Tokyo
25.726.330
Heartland city,
specially designated city
19.42320
City with population ≧ 0.1 million 13.216.718.3
City with population < 0.1 million 28.525.921.7
Town and village 13.28.110
1 A statistical test was conducted for the living environments adopted in Figure 3. For cases in which the difference in evaluation of both regions were adopted, a statistical test was conducted for the evaluation of each region. ***: p < 0.01; **: p < 0.05; no sign: not significant (Chi-square test).
Table 9. Characteristics of the city of residence and hypothetical change after respondents’ U-turn.
WholeNodeNodeNodeNodeNodeNodeNodeNodeNodeNodeNode
357911121315181920
N47423281015726112218554489
City size of current residence 1
Ordinance-designated city, the 23 wards of Tokyo 20.717.432.112.924.634.69.118.211.129.118.220.2
Heartland city, Specially designated city24.726.121.430.726.319.20.018.227.816.436.422.5
City with population
≧0.1 million
19.221.725.018.812.319.245.59.122.212.720.523.6
City with population
< 0.1 million
28.130.414.332.728.119.245.536.422.238.218.224.7
Town and village7.44.37.15.08.87.70.018.216.718.26.89.0
Difference of city size of hometown (Compared with current residence) 1 ***
Larger39.930.432.161.426.319.236.445.533.338.231.840.4
Same category25.934.832.114.922.823.127.331.838.927.331.829.2
Smaller34.834.835.723.850.957.736.422.727.834.536.430.3
Change of Urban area by U-turn1 ***
Within three major metropolitan
areas
21.913.021.414.917.515.454.59.138.925.529.527.0
From other areas to three major metropolitan areas16.28.714.322.87.00.00.027.316.718.211.422.5
From three major metropolitan areas to other areas7.217.414.35.08.826.90.04.50.05.52.34.5
Within other areas54.660.950.057.466.757.745.559.144.450.956.846.1
1 ***: p < 0.01; no sign: not significant (Chi-square test).
Table 10. Notable characteristics of the hypothetical change after respondents’ U-turn of each node.
NodeThe Characteristics of Hypothetical Change
after Respondents’ U-Turn
Prevailing Level of U-Turn Migration
Node 3- The ratio of people who migrated to rural hometowns from the three major metropolitan areas was the second highest of all nodesLow
Node 5- The ratio of people who migrated to rural hometowns from the three major metropolitan areas was relatively highLow
Node 7- Approximately 20% of respondents would migrate from provincial areas to the three major metropolitan areas
- More than 50% of respondents would migrate to larger cities
High
Node 9- Approximately 70% of respondents would move from one rural region to another rural region or stay within same areaLow
Node 11- The ratio of people who migrated to rural hometowns from the three major metropolitan areas was the highest of all nodesLow
Node 12-Medium
Node 13- Approximately 30% of respondents would migrate from provincial areas to the three major metropolitan areasHigh
Node 15-Low
Node 18-Medium
Node 19-Low
Node 20-Medium
1 Only the characteristics that were mentioned in the texts below have been described.

