Article

The Effects of Asphalt Migration on the Dynamic Modulus of Asphalt Mixture

1
School of Transportation Engineering, Changsha University of Science and Technology, Hunan 410004, China
2
National Engineering Laboratory of Highway Maintenance Technology, Changsha University of Science and Technology, Changsha 410004, China
*
Author to whom correspondence should be addressed.
Appl. Sci. 2019, 9(13), 2747; https://doi.org/10.3390/app9132747
Submission received: 31 May 2019 / Revised: 28 June 2019 / Accepted: 3 July 2019 / Published: 7 July 2019

Abstract

:
Asphalt migration is one of the significant detrimental effects on asphalt pavement performance. In order to simulate the state after the occurrence of asphalt migration amid asphalt pavement layers and further investigate the effects of asphalt migration on the dynamic modulus of asphalt mixture, samples with different asphalt contents layers were firstly separated into the upper and lower half portions and then compacted together. By conducting the dynamic modulus test with the Superpave Simple Performance Tester (SPT), the variation laws of the dynamic modulus (|E*|) and the phase angle (δ) at different testing temperatures and loading frequencies were analyzed in this paper. Further, the dynamic modulus and the stiffness parameter (|E*|/sinδ) at the loading frequency of 10 Hz and testing temperature of 50 °C were illustrated. Simultaneously, the master curves of the dynamic modulus and phase angle of asphalt mixtures under different testing conditions were constructed to better investigate the effects of asphalt migration on the dynamic modulus by means of Williams–Landel–Ferry (WLF) equation and Sigmoidal function. Results show that, after the asphalt migration, the dynamic modulus of asphalt mixtures increase with the increasing loading frequency while they decrease with the increasing testing temperature; the dynamic modulus and the stiffness parameter are the highest when asphalt mixtures have the optimum asphalt content layers, and then decrease with the incremental difference of asphalt content in the upper and lower half portions. Besides this, different from the master curves of dynamic modulus, the master curves of phase angle firstly increase with the increase of loading frequency to the highest point and then decrease with the further increase of loading frequency and are not as smooth as that of dynamic modulus. It can be concluded that the asphalt migration has compromised the mixture’s mechanical structure, and the more asphalt migrates, the weaker the mechanical properties of asphalt mixture will be. Additionally, based on the shift factors and master curves in the time–temperature superposition principle (TTSP), the effects of asphalt migration on the dynamic modulus and the variation laws of the dynamic modulus of asphalt mixture after the occurrence of asphalt migration can be better construed at the quantitative level.

1. Introduction

Permanent deformation (rutting), which can be caused by asphalt migration is considered a main distress in asphalt pavements and also a high concern for road engineers, particularly in hot climate and rainy areas, such as southern China. When asphalt pavement transforms from anhydrous to water-saturated status, its failure mode changes from fracturing to shear deformation [1,2], which is subjected to temperature and overlarge stress in the upper layers of asphalt pavement [3], easily leading to structural damage of the pavement. Studies have shown that the rutting of asphalt pavement has a good correlation with the number of load cycles [4]. Ghazi et al. [5] demonstrated that the difference of rutting depth at 19,200 loading cycles between limestone and basalt asphalt mixtures was statistically significant. High temperature, overloads (even with short duration), and small load cycles can result in road rutting and accelerate its further development [6,7]. Wang et al. [8] evaluated the effects of properties of the sensitive layer on the rutting at different temperatures by statistical analysis. Results revealed that the high temperature stability of the asphalt intermediate course had the greatest effect on the rutting development. Subsequently, to this end, they developed some new materials to improve the road performance of asphalt pavement [9].
A phenomenon called asphalt migration (also termed flushing/bleeding), where asphalt travels in one direction upwards (down to top) amid pavement layers in the wheel path, happens under adverse factors. An underlying substrate that becomes too soft under the effect of high temperature and heavy load may render the aggregates pushed into the lower layers of pavement, so the asphalt travels to the upper layers [10]. Besides the permanent deformation, the migrated asphalt can even trigger safety concerns by coating the micro surface of aggregates and then creating a slick pavement surface with a lower skid resistance [11].
Thus, it is necessary to investigate the variation laws of the mechanical properties of asphalt pavement after the occurrence of asphalt migration. One way to do that is to study and analyze asphalt mixture’s corresponding mechanical parameters, such as the dynamic modulus (|E*|), stiffness parameter (|E*|/sinδ), and phase angle (δ), etc. by simulating the post-state of asphalt migration in laboratory test. Currently, Superpave Simple Performance Tester (SPT) is commonly used to obtain these parameters of asphalt mixture due to its good applicability, accuracy, and operability [12,13,14].
It is known that asphalt mixture is a typical viscoelastic material and can show different mechanical behaviors at different temperatures. Moreover, its fabrication and paving temperature ranges from −40 to 160 °C [15,16,17]. Due to the limited experimental conditions and technologies, however, it is difficult to obtain the dynamic modulus of asphalt mixture over such wide of testing temperature and loading time (or frequency) [18]. However the master curve is a good solution to this concern. Based on the time–temperature superposition principle (TTSP), the master curve can effectively exhibit and predict the mechanical properties of asphalt mixture in a wider range of temperature and loading time or frequency [19]. In TTSP, the effects of temperature and loading time (or frequency) on the mechanical properties of viscoelastic materials are considered equivalent, i.e., the mechanical properties of viscoelastic materials at a low temperature are equivalent to that at a short loading time (or higher frequency) and vice versa [20]. Consequently, according to the TTSP, the master curves of the dynamic modulus and phase angle of asphalt mixture can be plotted based on shift factors and non-linear least squares regression analysis [21,22].
However, most of the current studies on the mechanical properties of asphalt pavement are focused on the pre-migration of asphalt, and few on the post-migration of asphalt [23,24,25]. Also, it is not yet clear how these mechanical properties will change after the occurrence of asphalt migration.
Therefore, the objective of this investigation is to analyze the dynamic modulus (|E*|) and the stiffness parameter (|E*|/sinδ), as well as the phase angle (δ) of asphalt mixtures through SPT under different testing conditions by simulating the status after the occurrence of asphalt migration, and then demonstrate the variation laws of these mechanical properties based on master curves.

2. Materials and Methods

2.1. Basic Materials

2.1.1. Aggregates

Aggregates used in this investigation were crushed limestone from a local quarry in Changsha, China. The test results of basic properties of the aggregates are given in Table 1. All the properties of aggregates complied with the requirements of the Chinese Test Methods of Aggregate for Highway Engineering (JTG E42-2005) [26]. The aggregates have an angular shape and rough surface texture, and a nominal maximum size of 13.2 mm. The gradation curve of aggregates is shown in Figure 1. The design gradation of aggregates complied with the requirements of AC-13 dense-graded asphalt mixture according to the Chinese Technical Specification for Construction of Highway Asphalt Pavements (JTG F40-2004) [27].

2.1.2. Bitumen

The asphalt binder used in this investigation was A70# matrix asphalt with a penetration grade of 70, supplied by Shell (China) Limited, and was commonly used in road engineering in China. The main physical properties of the asphalt binder, listed in Table 2, were tested according to the Chinese Standard Test Method of Bitumen and Bituminous Mixture for Highway Engineering (JTG E20-2011) [28].

2.2. Specimen Preparation

The specimens were preliminary manufactured according to the standard Marshall mixture design procedure. The optimum asphalt content was determined to be 5.0% by weight of asphalt mixture and the air void was controlled as 4.0%.
As mentioned previously, asphalt migration refers to a phenomenon that asphalt travels in one direction upwards (down to top) amid pavement layers in the wheel path due to adverse factors, such as high temperature and heavy load. Therefore, to simulate the state after the occurrence of asphalt migration and further investigate the effects of asphalt migration on the dynamic modulus of asphalt mixture, a different method of sample fabrication was designed for SPT tests. A Superpave gyratory compactor (SGC, CONTROLS Corporation, Italy) was adopted for the sample compaction procedure. The vertical pressure was set as 600 kPa (87 psi) and the angle of gyration was set as 1.25°. The gyration rate was set as 30 revolutions per minute. In this study, five groups of cylindrical samples with different asphalt contents in the upper and lower half layers were manufactured and four replicates were produced for each mix. According to the results of asphalt extraction test of asphalt mixture that we have previously done, as well as Pan’s research [29], the maximum amount of asphalt migration is determined to be about 1% and the gradient increment for each group is 0.3%. The asphalt contents of five groups of samples are given in Table 3.
During the manufacturing procedure of specimen, for each group of samples, firstly, one loose asphalt mixture was separated into two half portions, which have the same mass but different asphalt content, with one prepared for the lower layer of the cylindrical mold and another for the upper layer. The mass of the whole loose mixture was determined by the sample density obtained by the former Marshall test and the volume of SGC sample (170 mm × Φ150 mm, i.e., 150 mm in diameter and 170 mm in height). Secondly, the lower half portion mixture was poured into the mold and then slightly tamped with a tamping rod. Thirdly, the upper half portion was poured over the top of the mold and then tamped slightly. Fourthly, the whole mold of mixture containing two layers was compacted into a cylinder of 170 mm × Φ150 mm by a SGC. Then, the standard SPT sample of 150 mm × Φ100 mm (100 mm in diameter and 150 mm in height) was obtained by coring and sawing the SGC sample (170 mm × Φ150 mm) with a core-drilling machine and an electric saw (cut the top and bottom of the samples 10 mm each). Air void content for all standard SPT samples was controlled as 4 ± 0.5%. The preparation procedure and demonstration of samples are shown in Figure 2 and Figure 3.

2.3. Experimental Procedure

In this study, Superpave Simple Performance Tester (SPT, IPC Global Corporation, Bonny Hills, Australia), a servo-hydraulic machine, was adopted for the dynamic modulus test (Figure 4). Three different testing temperatures (20 °C, 35 °C, 50 °C), and nine different loading frequencies (25 Hz, 20 Hz, 10 Hz, 5 Hz, 2 Hz, 1 Hz, 0.5 Hz, 0.2 Hz, 0.1 Hz) at each temperature, were adopted to be successively applied to the cylindrical asphalt mixture samples. During the whole test, sinusoidal axial compressive stress was imposed on samples and the strain was controlled to the range of 85–115 με according to the recommendation of NCHRP9-19 (National Cooperative Highway Research Program 9-19, USA), and the test was under the condition of uniaxial unconfined pressure.

3. Results and Discussion

3.1. Effects of Loading Frequency and Testing Temperature on the Dynamic Modulus

Asphalt mixture can be considered a linear viscoelastic material at low strain level. Its stress–strain relationship under a continuous sinusoidal (i.e., haversine) load is defined by a complex number called the “complex modulus”. The absolute value of the complex modulus is defined as the dynamic modulus [30]. Research indicated that the dynamic modulus of asphalt mixture has a good correlation with its field rutting resistance [31]. In this study, the dynamic modulus (|E*|) and the phase angle (δ) were determined by the following equations [32]:
| E | = σ / ε
δ = ( T i / T p ) · 360
where |E*| is the dynamic modulus (MPa); σ is the peak dynamic stress (MPa); ε is the peak recoverable axial strain (με); δ is the phase angle (°); Ti is the time lag between a cycle of stress and strain (s); Tp is the time for a stress cycle (s). Generally, the higher the dynamic modulus value is, the more resistant to rutting (permanent deformation) the asphalt mixture will be. The lower the phase angle value, the more elastic the asphalt mixture.
Table 4, Table 5 and Table 6 show the test results of the dynamic modulus and phase angle at different testing temperature, respectively, where G-S represents group of samples; M-P represents the mechanical parameters; S-P represents the statistic parameters; | E ¯ | is the average value of dynamic modulus; δ ¯ is the average value of phase angle; σ is the standard deviation; C v is the coefficient of variation (%).
For the construction of master curves, the shift factors should be obtained firstly. In this paper, the Williams–Landel–Ferry (WLF) equation was adopted to calculate the shift factors (Equation (3)):
lg α T = C 1 ( T T r ) C 2 + ( T T r )
where α T is the shift factor; C 1 and C 2 are constants depending on the reference temperature; Tr is the reference temperature in Kelvin; T is the test temperature in Kelvin.
The WLF equation is widely used in the calculation of shift factors and has a limitation of applicable temperature range of Tg < T < Tg + 100 °C (Tg: glass transition temperature), in which range, the equation applicable results satisfy the test data better [33]. With shift factors, the curves at other temperature can be shifted to the reference temperature to form the master curve.
The Sigmoidal function is considered to fit the master curves of the dynamic modulus of asphalt mixtures well by shift factors [34]. In this paper, the Sigmoidal function (shown in Equation (4)) is adopted to determine the predicted dynamic modulus values by nonlinear least square method fitting in Origin software (OriginPro 2016, OriginLab Corporation).
lg | E | = δ + α 1 + e β + γ ( lg f r )
f r = f × α T
where δ is the minimum value of |E*|; δ + α is the maximum value of |E*|; β and γ are parameters describing the shape of the Sigmoidal function; f r is the reduced frequency at reference temperature (Hz); f is the loading frequency (Hz).
The shift factors at different reference temperature are shown in Table 7. The fitting parameters values of Sigmoidal function by Origin nonlinear least square fitting are shown in Table 8.
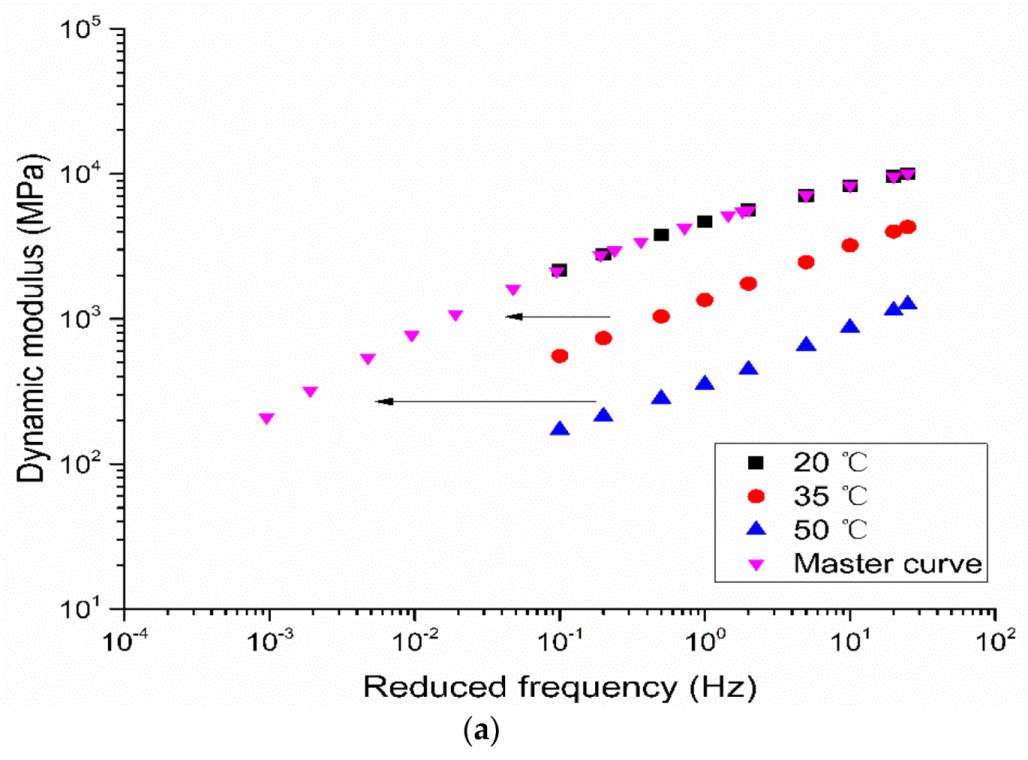
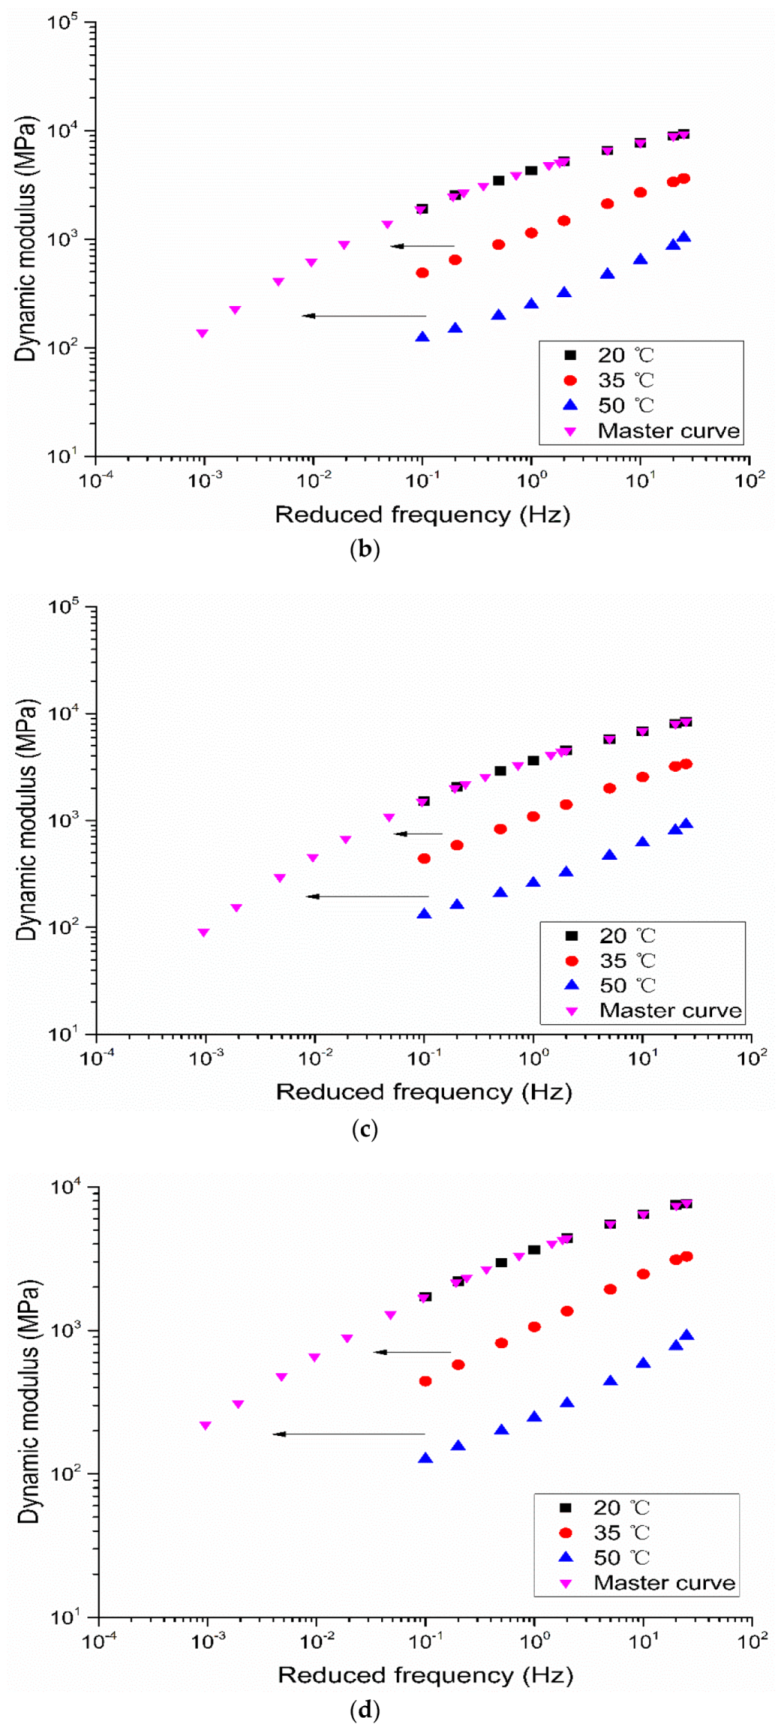
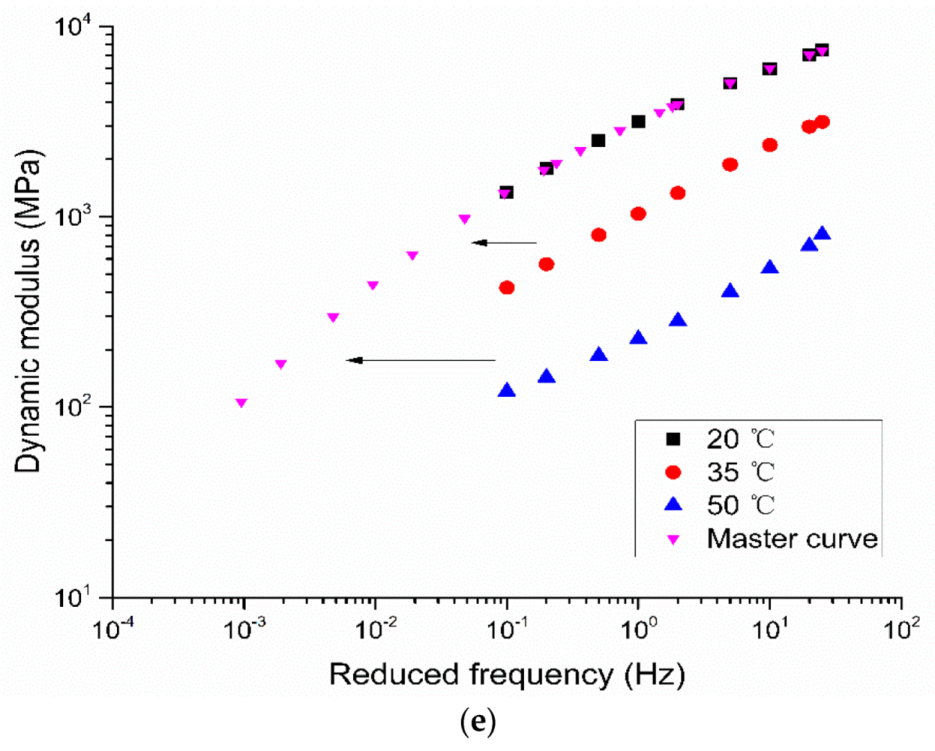
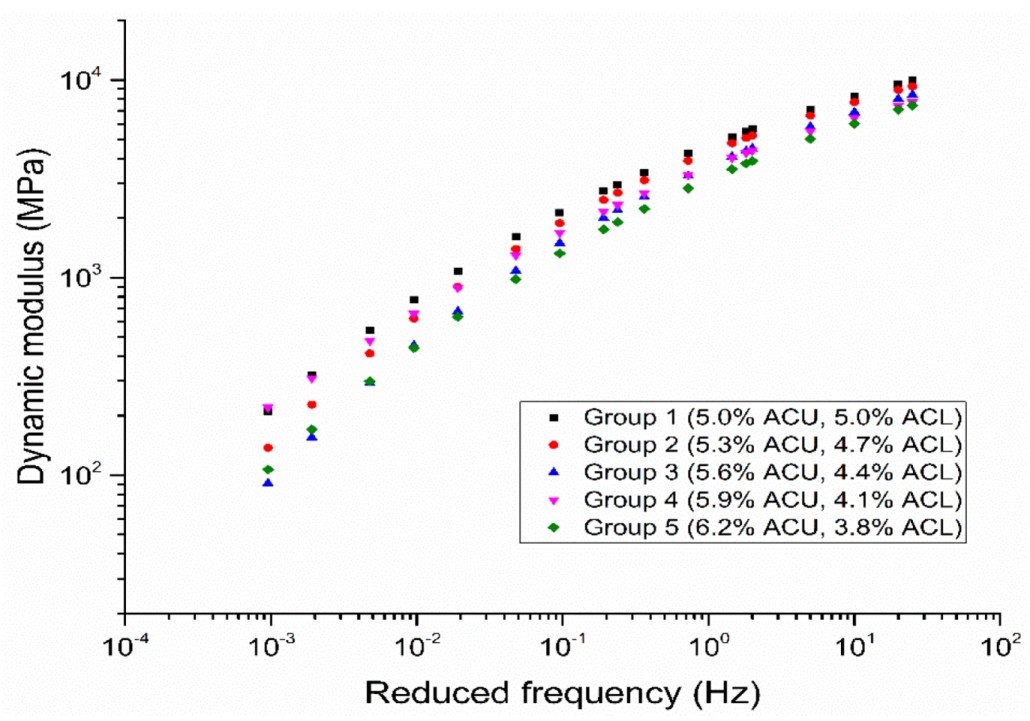
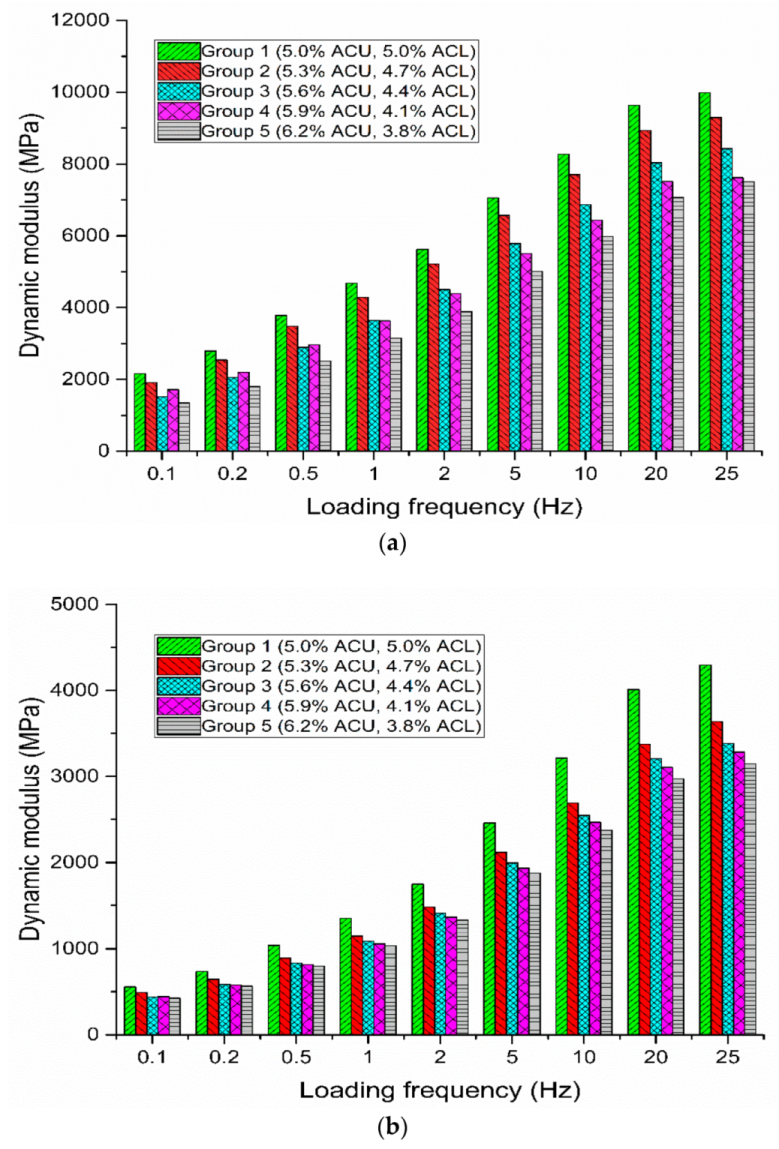
Figure 5 presents the correlation between the dynamic modulus (|E*|) and loading frequency of five groups of asphalt mixture samples at different testing temperatures. 
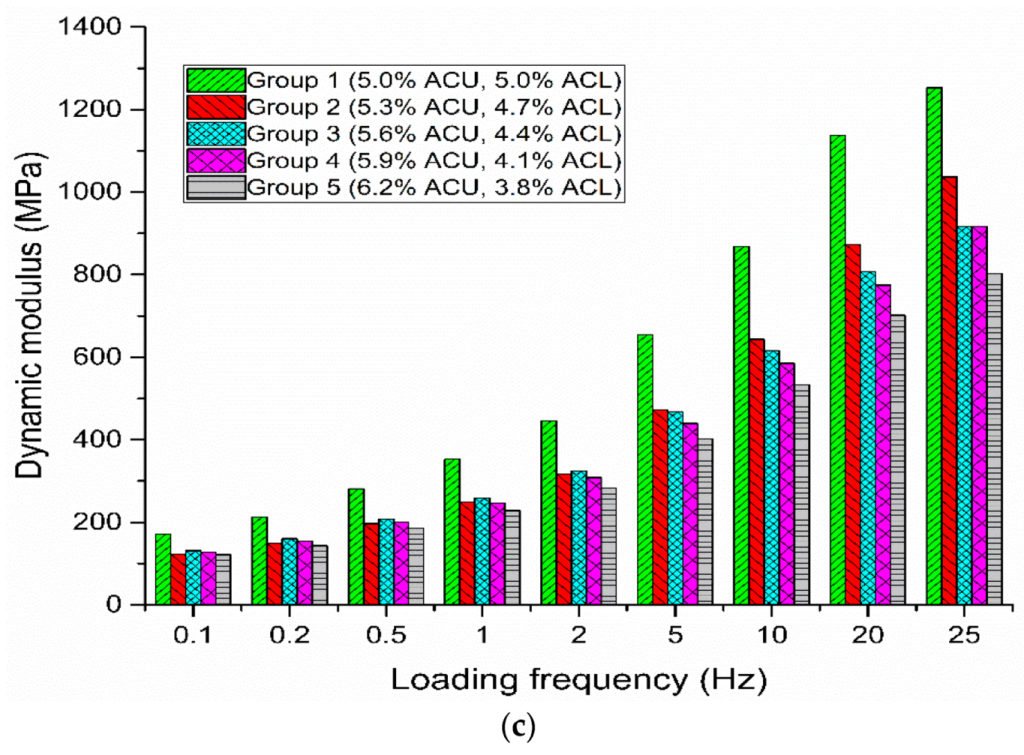
Figure 6 shows the master curves of dynamic modulus test results. Figure 7 shows the master curves of dynamic modulus of five groups of samples.
As expected, from Figure 5 and Figure 6, the dynamic modulus of asphalt mixtures increase monotonously with the increase of loading frequency while they decrease with the increase of testing temperature. This suggests that asphalt mixtures mainly behave elastic at low temperature but are viscous at high temperature. Besides this, as is shown in Figure 5c, the difference of dynamic modulus of five groups of asphalt mixtures are not distinct at low frequencies (less than 1 Hz), while the distinctions become obvious at high frequencies (from 1 Hz to 25 Hz), indicating that at high temperature, the difference of dynamic modulus at low frequencies is smaller than at high frequencies. According to the TTSP, a short time or a high frequency is equivalent to a low temperature and vice versa. So this may explain the phenomenon that permanent deformation (rutting) commonly occurs at the road section of steep slopes, intersections, and bus stations, etc., where, vehicles are in a status of slow speed, frequent braking, and long contact time between tires and the road surface. In addition, it can be seen from Figure 5 and Figure 6 that at each frequency, the dynamic modulus of the first group of asphalt mixture samples (have the optimum asphalt content of 5.0% in upper half layer and lower half layer) are the highest and then become smaller with the incremental difference of asphalt content in the upper and lower half portions. This suggests that the asphalt migration has compromised the mixture’s mechanical structure and the more asphalt migrates, the weaker the mechanical properties of the asphalt mixture will be. The simulation method of the state of asphalt migration in this paper can help us better construe this issue at the quantitative level. Moreover, from Figure 6 and Figure 7, the shift factors and master curves have widened the testing range and can relatively precisely predict the trend of the dynamic modulus in a wider range. Specifically, in Figure 7, the master curves of dynamic modulus of five groups of samples flatten out with the increasing frequency and the dynamic modulus of the first group are highest, which is in accordance with the result reported above.

3.2. Effects of Loading Frequency on the Phase Angle

When the asphalt mixture bears the dynamic load, a phenomenon occurs where the strain response lags behind the loading stress. The degree of this lag can be characterized by phase angle (δ) (i.e., δ represents the viscoelasticity of asphalt mixture). Similar to the dynamic modulus, the master curves of the phase angle can be also obtained by the shift factors. 
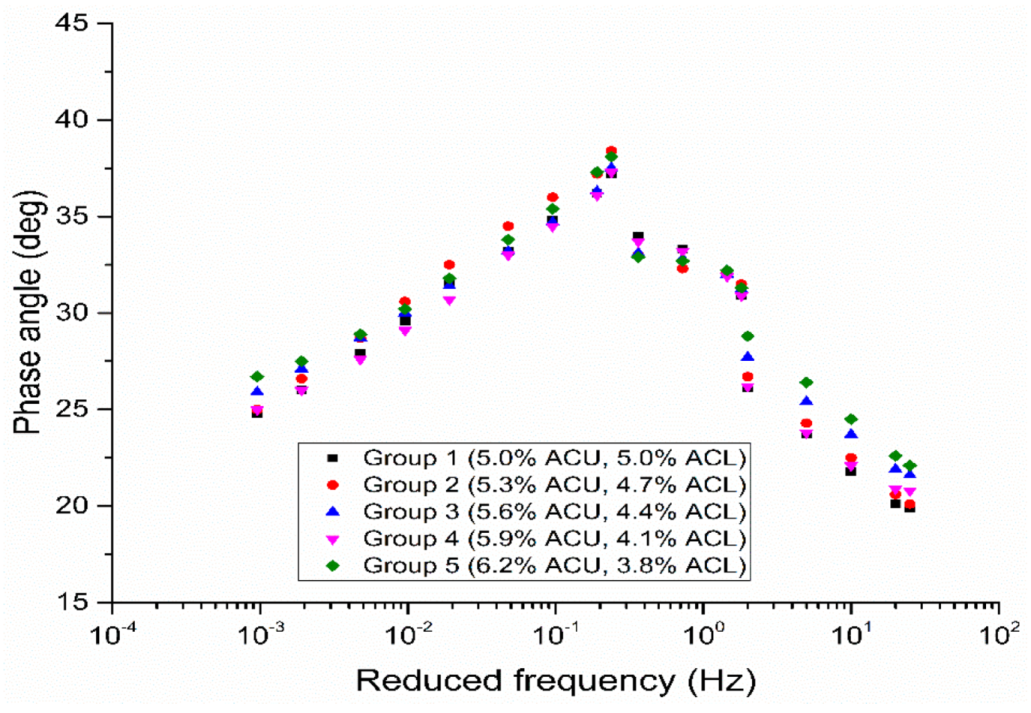
Figure 8 presents the master curves of phase angle of five groups of samples.
As is shown in Figure 8, different from the master curves of dynamic modulus, the master curves of phase angle firstly increase with the increase of loading frequency to the highest point and then decrease with the further increase of loading frequency. This is because at low temperature, the asphalt mixture behaves as elastic and is mainly subjected to asphalt binder, so when temperature increases (or frequency decreases), the asphalt binder becomes soft and behaves as viscous, then leading to the increment of phase angle. At high temperature, asphalt mixture mainly behaves as viscous and the influence of the asphalt binder on the mixture becomes weak while the interlocking force between aggregates on mixture becomes distinct. Thus, with the further increase of temperature (or decrease of frequency), the phenomenon where the aggregates skeleton mainly bears the loading stress becomes more obvious, then leading to the decline of the phase angle. Additionally, compared with the dynamic modulus, the phase angle usually exhibits an overall upward or downward trend at one single temperature and mutation point. Therefore, the master curves of phase angle are not as smooth as that of dynamic modulus. Moreover, it can be seen from Figure 8 that the phase angle of the first group (5.0% ACU and 5.0% ACL) are the smallest, indicating that the asphalt migration has compromised the aggregates skeleton and aggravated strain response lag. With the simulation method of the state of asphalt migration in this paper, this phenomenon can be better understood at the quantitative level.

3.3. Analysis of |E*| and |E*|/sinδ

According to Witczak’s research, the dynamic modulus (|E*|) and the stiffness parameter (|E*|/sinδ) of asphalt mixture have a good correlation with the rutting resistance of asphalt pavement, and the stiffness parameter of asphalt mixture can more precisely reflect its rutting resistance at relative high service temperature [35]. Generally, the higher the stiffness parameter value, the more resistant to rutting (permanent deformation) the asphalt mixture.
In this study, the dynamic modulus and the stiffness parameter were accessed at the intermediate loading frequency of 10 Hz and high testing temperature of 50 °C. The test results are shown in Figure 9.
Figure 9 presents that the dynamic modulus and the stiffness parameter of five groups of asphalt mixtures decrease with the incremental difference of asphalt content in the upper and lower half layers and have the highest values at the optimum asphalt content (5.0% ACU and 5.0% ACL). This suggests that the asphalt migration has weakened the rutting resistance of asphalt mixture, and the more asphalt migrates, the less rutting resistance of the asphalt mixture. It is mainly due to the fact that, on one hand, when the asphalt migration has occurred at high temperature, the free asphalt in the upper half layer increases (as is simulated in this paper), having strengthened the lubrication between asphalt and aggregates (i.e., reduced the cohesion), and finally reduced the rutting resistance. Similarly, on the other hand, when asphalt migration has occurred at high temperature, the structural asphalt in the lower half layer decreases, having reduced the cohesion between asphalt and aggregates, so the rutting resistance of asphalt mixture declines. Therefore, it can be concluded that when asphalt migration occurs amid the asphalt pavement layers in hot climate regions, the rutting resistance of asphalt pavement becomes weaker and the rutting becomes worse.

4. Conclusions

In order to investigate the effects of asphalt migration on the dynamic modulus of asphalt mixture, the asphalt mixture samples with five different asphalt contents layers were prepared for the dynamic modulus test with a Simple Performance Tester (SPT). By constructing the master curves of dynamic modulus and phase angle, the effects of asphalt migration on the dynamic modulus and the variation laws of the dynamic modulus (|E*|) and phase angle (δ) at different testing temperatures and loading frequencies were analyzed in this paper. Additionally, the dynamic modulus (|E*|) and the stiffness parameter (|E*|/sinδ) at the loading frequency of 10 Hz and testing temperature of 50 °C were also studied to further investigate the effects of asphalt migration on the rutting resistance of asphalt mixture at relatively high temperature. Based on the laboratory test results, the following conclusions were drawn:
By simulating the state after the occurrence of asphalt migration amid asphalt pavement layers and constructing the master curves with the WLF equation and Sigmoidal function based on the time–temperature superposition principle (TTSP), the effects of asphalt migration on the dynamic modulus and the variation laws of the dynamic modulus of asphalt mixture after the occurrence of asphalt migration were investigated at the quantitative level.
The dynamic modulus test makes it apparent that the dynamic moduli of asphalt mixtures increase with the increasing loading frequency, while they decrease with the increasing testing temperature. The dynamic modulus of the first group of asphalt mixture samples (with the optimum asphalt content of 5.0% in upper half layer and lower half layer) are the highest and then become smaller with the incremental differences of asphalt content in the upper and lower half portions. This indicates that the asphalt migration has compromised the mixture’s mechanical structure and the more asphalt migrates, the weaker the mechanical properties of asphalt mixture will be.
Different from the master curves of dynamic modulus, the master curves of phase angle firstly increase with the increase of loading frequency to the highest point, and then decrease with the further increase of loading frequency. The master curves of phase angle are not as smooth as that of dynamic modulus. Moreover, the phase angle of the first group of samples (5.0% ACU and 5.0% ACL) are the smallest, indicating that the asphalt migration has compromised the aggregates skeleton and aggravated strain response lag.
In the analysis of the dynamic modulus and stiffness parameter of asphalt mixture, the dynamic modulus and stiffness parameter of five groups of asphalt mixtures decrease with the incremental difference of asphalt content in the upper and lower half layers and have the highest values at the optimum asphalt content (5.0% ACU and 5.0% ACL). This suggests that the asphalt migration has weakened the rutting resistance of asphalt mixture at relatively high temperature and the more asphalt migrates, the less rutting resistance of asphalt mixture.
According to the research in this study, the effects of asphalt migration on the dynamic modulus and the variation laws of the dynamic modulus of asphalt mixture after the occurrence of asphalt migration can be better construed. This may help road engineers to figure out the correlation between asphalt migration and mechanical properties of asphalt mixture during the design of asphalt pavement, and to avoid asphalt migration and road rutting to a greater extent. For example, limiting the vehicle speed and axial load, as well as using some constructing materials with preferable high temperature resistance, such as stiffer asphalt or fiber mixture, etc., may be effective ways to reduce asphalt migration and road rutting.

Author Contributions

H.W. conceptualization, methodology, designing the experiment and writing—review and editing; S.Z. conducted experiments, data curation, investigation and writing—original draft preparation; G.L. helped conducting tests and data curation.

Funding

This research was funded by the National Natural Science Foundation of China (grant number 51478052); Hunan Transportation Department [grant number 201825]; Guangdong Transportation Department [grant number 2013-01-002].

Conflicts of Interest

The authors declare no conflict of interest.

References

  1. Zou, X.L.; Sha, A.M.; Jiang, W. Study of the performance of high modulus modified asphalt mixture in hot and rainy areas. J. Hefei Univ. Technol. 2015, 38, 1381–1386. [Google Scholar]
  2. Guo, F.; Tan, H.Z.; Shao, L.G. Analysis of CT scanning test and mechanical response of water-load coupling based on asphalt pavement early water damage. J. Highw. Transp. Res. Dev. 2014, 10, 38–44. [Google Scholar]
  3. Staub de Melo, J.V.; Trichês, G. Effects of organophilic nanoclay on the rheological behavior and performance leading to permanent deformation of asphalt mixtures. J. Mater. Civ. Eng. 2016, 28. [Google Scholar] [CrossRef]
  4. Hafeez, I.; Kamal, M.A. Creep compliance: A parameter to predict rut performance of asphalt binders and mixtures. Arab. J. Sci. Eng. 2014, 39, 5971–5978. [Google Scholar] [CrossRef]
  5. Ghazi, G.A.; Taisir, S.K.; Turki, I.A.O.; Ahmad, M.N. Laboratory study for comparing rutting performance of limestone and basalt Superpave asphalt mixtures. J. Mater. Civ. Eng. 2013, 25, 21–29. [Google Scholar] [CrossRef]
  6. Zhu, H.R.; Sun, L. Mechanistic rutting prediction using a two-stage viscoelastic-viscoplastic damage constitutive model of asphalt mixtures. J. Eng. Mech. 2013, 139, 1577–1591. [Google Scholar] [CrossRef]
  7. Sabahat, H.; Mumtaz, A.K.; Imran, H. Modeling and correlating rut depth observed in different asphalt mixture performance tests. J. Eng. Technol. 2018, 37, 553–570. [Google Scholar] [CrossRef]
  8. Wang, H.; Zhang, Q.S.; Tan, J.Q. Investigation of layer contributions to asphalt pavement rutting. J. Mater. Civ. Eng. 2009, 21, 181–185. [Google Scholar] [CrossRef]
  9. Wang, H.; Yang, Z.; Zhan, S.; Ding, L.; Jin, K. Fatigue performance and model of polyacrylonitrile fiber reinforced asphalt mixture. Appl. Sci. 2018, 8, 1818. [Google Scholar] [CrossRef]
  10. South African National Roads Agency Limited (SANRAL). Design and construction of surfacing seals. In Technical Recommendations for Highways TRH3; South African National Roads Agency Limited: Pretoria, South Africa, 2007. [Google Scholar]
  11. Rizzutto, S.J.; La Bar, J.; Johannes, P.T.; Bahia, H.U. Use of a variable rate spray bar to minimize wheel path bleeding for asphalt-rubber chip seal applications. J. Mater. Civ. Eng. 2015, 27. [Google Scholar] [CrossRef]
  12. Mohammad, L.N.; Saadeh, S.; Obulareddy, S.; Cooper, S. Characterization of Louisiana asphalt mixtures using Simple Performance Tests. J. Test. Eval. 2008, 36, 5–16. [Google Scholar] [CrossRef]
  13. Ghazi, G.A.; Turki, I.A.O.; Taisir, S.K.; Mohammad, S.E. Studying rutting performance of Superpave asphalt mixtures using unconfined dynamic creep and Simple Performance Tests. Road Mater. Pavement Des. 2018, 19, 315–333. [Google Scholar] [CrossRef]
  14. Vargas-Nordcbeck, A.; Leiva-Villacorta, F.; Aguiar-Moya, J.P.; Loria-Salazar, L. Evaluating moisture susceptibility of asphalt concrete mixtures through Simple Performance Tests. Transp. Res. Board. 2016, 2575, 70–78. [Google Scholar] [CrossRef]
  15. Dudowicz, J.; Douglas, J.F.; Freed, K.F. The meaning of the “universal” WLF parameters of glass-forming polymer liquids. J. Chem. Phys. 2015, 142, 014905. [Google Scholar] [CrossRef] [PubMed]
  16. Zhang, J.; Fan, Z.; Pei, J.; Li, R.; Chang, M. Multiscale validation of the applicability of micromechanical models for asphalt mixture. Adv. Mater. Sci. Eng. 2015, 937126. [Google Scholar] [CrossRef]
  17. Ma, T.; Wang, H.; Zhao, Y.; Huang, X.; Wang, S. Laboratory investigation of crumb rubber modified asphalt binder and mixtures with warm-mix additives. Int. J. Civ. Eng. 2017, 15, 185–194. [Google Scholar] [CrossRef]
  18. Counto, U.J. The effect of the elastic modulus of the aggregate on the elastic modulus, creep and creep recovery of concrete. Mag. Concr. Res. 1964, 16, 129–138. [Google Scholar] [CrossRef]
  19. Toraldo, E.; Mariani, E. Effects of polymer additives on bituminous mixtures. Constr. Build. Mater. 2014, 65, 38–42. [Google Scholar] [CrossRef]
  20. Forough, S.A.; Nejad, F.M.; Khodaii, A. An investigation of different fitting functions to accurately model the compressive relaxation modulus master curve of asphalt mixes. Road Mater. Pavement Des. 2015, 16, 767–783. [Google Scholar] [CrossRef]
  21. Ling, M.; Luo, X.; Gu, F.; Lytton, R.L. Time-temperature-aging-depth shift functions for dynamic modulus master curves of asphalt mixtures. Constr. Build. Mater. 2017, 157, 943–951. [Google Scholar] [CrossRef]
  22. Nobakht, M.; Sakhaeifar, M.S. Dynamic modulus and phase angle prediction of laboratory aged asphalt mixtures. Constr. Build. Mater. 2018, 190, 740–751. [Google Scholar] [CrossRef]
  23. Lee, J.; Moon, S.J.; Im, J.; Yang, S. Evaluation of moisture susceptibility of asphalt mixtures using dynamic modulus. J. Test. Eval. 2017, 45. [Google Scholar] [CrossRef]
  24. Rodezno, M.C.; West, R.; Taylor, A. Flow number test and assessment of AASHTO TP 79–13 rutting criteria comparison of rutting performance of hot-mix and warm-mix asphalt mixtures. Transp. Res. Rec. 2015, 2507, 100–107. [Google Scholar] [CrossRef]
  25. Mostafa, A.E.; Louay, N.M.; Emad, K.; Hao, Y.; Eyad, M. Quantification of damage in the dynamic complex modulus and flow number tests using X-Ray computed tomography. J. Mater. Civ. Eng. 2011, 23, 1687. [Google Scholar] [CrossRef]
  26. JTG E42-2005. Test Methods of Aggregate for Highway Engineering; China Communications Press: Beijing, China, 2005. [Google Scholar]
  27. JTG F40-2004. Technical Specifications for Construction of Highway Asphalt Pavements; China Communications Press: Beijing, China, 2004. [Google Scholar]
  28. JTG E20-2011. Standard Test Methods of Bitumen and Bituminous Mixtures for Highway Engineering; China Communications Press: Beijing, China, 2011. [Google Scholar]
  29. Pan, Y.H.; Ye, Y.J.; Cai, J.A.; Yuan, J.W.; Liang, S.T.; Chen, Z. Determination of 18 polycyclic aromatic hydrocarbons migrated from asphalt based waterproof coating by solid phase microextraction/gas chromatography-mass spectrometry. J. Instrum. Anal. 2018, 37, 772–777. [Google Scholar]
  30. Kaloush, K.E.; Witczak, M.; Sotil, A.; Way, G. Laboratory evaluation of asphalt rubber mixtures using the dynamic modulus (E*) test. In Proceedings of the 82th Transportation Research Board Annual Meeting, Washington, DC, USA, 12–16 January 2003. [Google Scholar]
  31. Witczak, M.W.; Fonseca, O.A. Revised predictive model for dynamic (complex) modulus of asphalt mixtures. J. Transp. Res. Rec. 1996, 1540, 15–23. [Google Scholar] [CrossRef]
  32. Wu, S.P.; Ye, Q.S.; Li, N.; Yue, H.B. Effects of fibers on the dynamic properties of asphalt mixtures. J. Wuhan Univ. Technol. 2007, 22, 733–736. [Google Scholar] [CrossRef]
  33. Yin, Y.; Huang, W.; Lv, J.; Ma, X.; Yan, J. Unified construction of dynamic rheological master curve of asphalts and asphalt mixtures. Int. J. Civ. Eng. 2018, 16, 1057–1067. [Google Scholar] [CrossRef]
  34. Esra’a, I.A.; Abo-Qudais, S.A. Hot mix asphalt time-temperature shifting and fitting technique: A comparative study. Constr. Build. Mater. 2017, 146, 514–523. [Google Scholar] [CrossRef]
  35. Witczak, M.W. Simple Performance Test for Superpave Mix Design; NCHRP Report 465; National Academy Press: Washington, DC, USA, 2002. [Google Scholar]
Figure 1. Gradation curve of aggregates.
Applsci 09 02747 g001
Figure 2. Sample Preparation procedure.
Applsci 09 02747 g002
Figure 3. Demonstration of samples: (a) the original SGC sample and the sample after coring and sawing; (b) the SPT samples.
Applsci 09 02747 g003
Figure 4. Simple Performance Tester.
Applsci 09 02747 g004
Figure 5. The correlation between the dynamic modulus and loading frequency (ACU: asphalt content in the upper half layer, ACL: asphalt content in the lower half layer): (a) 20 °C; (b) 35 °C; (c) 50 °C.
Applsci 09 02747 g005aApplsci 09 02747 g005b
Figure 6. The master curves of dynamic modulus test results (reference temperature: 20 °C): (a) Group 1; (b) Group 2; (c) Group 3; (d) Group 4; (e) Group 5.
Applsci 09 02747 g006aApplsci 09 02747 g006bApplsci 09 02747 g006c
Figure 7. The master curves of dynamic modulus of five groups of samples (reference temperature: 20 °C).
Applsci 09 02747 g007
Figure 8. The master curves of phase angle of five groups of samples (reference temperature: 20 °C).
Applsci 09 02747 g008
Figure 9. The variations of dynamic modulus and the stiffness parameter of five groups of samples (10 Hz, 50 °C): (a) |E*|; (b) |E*|/sinδ.
Applsci 09 02747 g009
Table 1. Basic properties of aggregates.
PropertiesStandardRequirementsTest Results
Los Angeles abrasion loss (%)T0317≤2816.4
Soundness (%)T0314≤120.89
Flat and elongated particles (%)T0312≤1513.7
Water absorption (%)T0304≤2.00.57
Apparent specific gravityT0304≥2.62.775
Table 2. Main physical properties of asphalt binder.
Testing IndicesStandardRequirementsTest Results
25 °C Penetration (0.1 mm)T060460 to 8073
Penetration index (PI)T0604−1.5 to +1.0−1.21
Softening point (°C)T0606≥4651
15 °C Ductility (cm)T0605>100>100
60 °C Viscosity (Pa·s)T0625>180209
Flash point (°C)T0611≥260294
Wax content (%)T0615≤2.21.2
Table 3. The asphalt contents of five groups of specimens.
Group of Samples12345
Asphalt contents (%)Upper half layer5.05.35.65.96.2
Lower half layer5.04.74.44.13.8
Table 4. The test results of the dynamic modulus and phase angle at 20 °C.
G-SM-PS-PLoading Frequency (Hz)
2520105210.50.20.1
1|E*| (MPa) | E ¯ | 998996328270706056244675378027892160
σ325.8212.2302.9120.9202.4153.5213.083.6120.9
C v 3.32.23.71.73.63.35.63.05.6
δ (deg) δ ¯ 19.920.121.823.726.127.929.331.131.8
σ0.50.60.50.80.61.31.00.61.0
C v 2.43.12.53.62.14.73.41.93.2
2|E*| (MPa) | E ¯ | 929689377703657152144291347825381907
σ431.0221.2243.0307.4143.2322.6108.9140.182.9
C v 4.62.53.24.72.77.53.15.54.3
δ (deg) δ ¯ 20.120.622.524.326.728.429.931.932.8
σ0.60.50.90.80.90.81.21.11.7
C v 3.12.34.23.13.22.94.03.45.0
3|E*| (MPa) | E ¯ | 842580366864578445053640289120521520
σ327.1189.8226.6103.3136.564.7165.062.468.6
C v 3.92.43.31.83.01.85.73.04.5
δ (deg) δ ¯ 21.621.923.725.427.729.430.732.232.7
σ0.60.40.80.61.10.61.00.40.7
C v 2.92.03.52.33.92.13.11.22.0
4|E*| (MPa) | E ¯ | 761975136432550643923631296321961713
σ610.5693.8290.9283.9133.3169.069.2100.961.9
C v 8.09.24.55.23.04.72.34.63.6
δ (deg) δ ¯ 20.820.922.123.826.227.929.531.332.0
σ1.41.00.81.00.60.91.11.81.0
C v 6.55.03.54.22.43.23.65.83.1
5|E*| (MPa) | E ¯ | 750570655981501438873147250917961344
σ260.2182.4234.3139.0132.1131.370.472.687.5
C v 3.52.63.92.83.44.22.84.06.5
δ (deg)22.122.624.526.428.830.431.633.033.4
σ1.00.60.80.61.01.31.21.72.1
C v 4.42.63.42.33.44.33.75.16.4
Table 5. The test results of the dynamic modulus and phase angle at 35 °C.
G-SM-PS-PLoading Frequency (Hz)
2520105210.50.20.1
1|E*| (MPa) | E ¯ | 4296401232152461174813511041736556
σ139.0243.3106.468.279.274.949.047.923.6
C v 3.26.13.32.84.55.54.76.54.2
δ (deg) δ ¯ 30.932.133.334.034.534.033.232.030.6
σ1.11.41.01.01.10.81.41.51.3
C v 3.54.53.03.03.12.44.24.74.3
2|E*| (MPa) | E ¯ | 363733742693212014811145892646490
σ173.770.9113.3119.968.273.837.816.035.6
C v 4.82.14.25.74.66.44.22.57.3
δ (deg) δ ¯ 31.532.132.333.033.232.631.730.229.0
σ0.61.11.50.91.40.41.20.61.5
C v 2.13.44.82.84.11.33.72.05.2
3|E*| (MPa) | E ¯ | 338432072546199614101089833585439
σ112.9134.377.290.398.087.038.329.336.3
C v 3.34.23.04.57.08.04.65.08.3
δ (deg) δ ¯ 31.232.032.833.133.132.431.530.129.0
σ1.20.91.70.61.41.81.11.40.8
C v 3.72.85.21.84.35.63.34.82.8
4|E*| (MPa) | E ¯ | 328431062468193413641057815577443
σ195.089.085.4100.560.465.824.626.337.5
C v 5.92.93.55.24.46.23.04.68.5
δ (deg) δ ¯ 30.931.933.233.734.033.532.631.530.4
σ1.31.71.20.71.71.51.11.61.3
C v 4.15.33.72.04.94.63.35.14.3
5|E*| (MPa) | E ¯ | 314729722374187813301036801564424
σ162.5132.2130.940.397.249.446.948.329.8
C v 5.24.45.52.17.34.85.98.67.0
δ (deg) δ ¯ 31.332.232.732.933.432.931.930.529.1
σ1.41.12.41.42.01.71.31.62.1
C v 4.43.57.44.36.15.24.05.37.1
Table 6. The test results of the dynamic modulus and phase angle at 50 °C.
G-SM-PS-PLoading Frequency (Hz)
2520105210.50.20.1
1|E*| (MPa) | E ¯ | 12531137868655446353281213171
σ47.647.566.325.224.129.210.98.08.8
C v 3.84.27.63.85.48.33.93.85.1
δ (deg) δ ¯ 37.236.234.833.231.529.627.926.024.8
σ1.91.50.91.01.71.21.71.11.3
C v 5.24.12.53.15.44.26.24.25.4
2|E*| (MPa) | E ¯ | 1037873643472317249197149123
σ68.739.337.817.414.111.314.39.86.5
C v 6.64.55.93.74.54.67.26.65.3
δ (deg) δ ¯ 38.437.236.034.532.530.628.726.625.0
σ1.61.22.21.11.50.81.01.91.4
C v 4.03.26.13.24.52.63.57.15.7
3|E*| (MPa) | E ¯ | 916807616468324259208160131
σ38.342.420.318.113.415.814.98.86.7
C v 4.25.33.33.94.16.17.25.55.1
δ (deg) δ ¯ 37.536.334.733.231.430.028.727.125.9
σ1.51.61.12.30.91.51.21.51.1
C v 4.14.53.27.12.85.14.25.54.2
4|E*| (MPa) | E ¯ | 917775585439309247200155127
σ45.439.744.419.111.613.39.59.55.9
C v 5.05.17.64.33.85.44.86.14.7
δ (deg) δ ¯ 37.336.134.533.030.729.127.626.025.0
σ1.52.11.82.01.01.31.92.11.4
C v 4.15.75.16.13.24.46.78.05.5
5|E*| (MPa) | E ¯ | 803701533402283228186143121
σ72.546.227.921.913.812.88.29.69.0
C v 9.06.65.25.54.95.64.46.77.5
δ (deg) δ ¯ 38.137.335.433.831.830.228.927.526.7
σ1.62.61.62.01.72.21.62.31.5
C v 4.26.94.45.95.27.25.58.45.5
Table 7. The values of shift factors at different reference temperature.
Reference Temperature (°C)Values of Shift Factors ( lg α T )
20 °C35 °C50 °C
200−1.1398−2.0198
351.53460−1.1398
503.71231.53460
Table 8. The values of fitting parameters of Sigmoidal function by Origin (reference temperature: 20 °C).
Group of SamplesAsphalt Contents (%)Values of Fitting ParametersCorrelation Coefficient
Upper Half LayerLower Half Layer δ α β γ R-Square (R2)
15.05.0−16.529721.1705−3.0329−0.31070.99994
25.34.7−34.480139.0201−3.7386−0.33570.99987
35.64.4−30.167134.7170−3.5301−0.33520.99997
45.94.1−0.54304.9250−1.6089−0.41770.99972
56.23.8−38.927043.6006−3.5857−0.28010.99988

