Article

A PEC Thrice Subtraction Method for Obtaining Permeability Invariance Feature in Conductivity Measurement of Ferromagnetic Samples

1
School of Mechatronic Engineering, China University of Mining and Technology, Xuzhou 221116, China
2
School of Information and Control Engineering, China University of Mining and Technology, Xuzhou 221116, China
3
School of Automation Engineering, Nanjing University of Aeronautics and Astronautics, Nanjing 210016, China
4
Nondestructive Detection and Monitoring Technology for High Speed Transportation Facilities, Key Laboratory of Ministry of Industry and Information, Nanjing University of Aeronautics and Astronautics, Nanjing 210016, China
*
Authors to whom correspondence should be addressed.
Appl. Sci. 2019, 9(13), 2745; https://doi.org/10.3390/app9132745
Submission received: 17 May 2019 / Revised: 4 July 2019 / Accepted: 5 July 2019 / Published: 7 July 2019
(This article belongs to the Special Issue Nondestructive Testing (NDT))

Abstract

:

Featured Application

The work is potential to obtain a permeability invariance (PI) feature in pulsed eddy current (PEC) signals for reducing the permeability and environment magnetic field influence in the conductivity measurement of ferromagnetic samples.

Abstract

Conductivity, as an important index of structural health monitoring, can be used to evaluate heat treatment condition, and sort different materials or measure the stress of mechanical parts. However, the permeability of a measured sample has significant impact on the detected signal in pulsed eddy current (PEC) testing, which is prone to measurement errors due to the effect of permeability change. In this paper, a thrice subtraction method is investigated and utilized to obtain a permeability invariance (PI) feature for reducing permeability effect in conductivity measurement of ferromagnetic samples. The thrice subtraction method is based on the PEC signals of sample and air, the difference signal between the difference PEC signal and its normalization signal, and the difference signal between the difference normalization signal and its standard deviation. In the thrice subtraction signals, the behavior of the obtained PI feature is analyzed by experiments and simulations. The results demonstrate that the thrice subtraction method is a practicable program and the PI feature is potential to measure the conductivity of ferromagnetic samples. The work reported in this paper provides an effective approach to obtain a PI feature for estimating the conductivity of ferromagnetic samples without a permeability effect.

Graphical Abstract

1. Introduction

Conductivity, as a parameter of ferromagnetic materials, can serve as an index to sort different materials, and evaluate heat treatment condition or measure the stress of mechanical parts [1,2,3]. Due to the advances in electromagnetic nondestructive evaluation, pulsed eddy current (PEC) testing has become a feasible and preferred technique for measuring conductivity of materials in recent years [4,5]. However, for ferromagnetic samples, the measurement of conductivity is affected by the inhomogeneity of tested samples and the confounding cross-sensitivity to conductivity and permeability, which is undesirable in precision PEC testing [6,7]. Especially, the influence of permeability is complex and irregular. On the other hand, correspondingly, the permeability of ferromagnetic material will change when the environmental magnetic field changes. Therefore, reducing the permeability effect or the influence of environmental magnetic field in the measurement of electrical conductivity of ferromagnetic samples is an important problem to be solved in PEC testing. It is important and meaningful to improve the detection accuracy of conductivity of ferromagnetic samples.
In PEC testing, the measurements of conductivity and permeability have been studied by many scholars in recent years. Adewale et al. [8] decoupled the influence of permeability and conductivity in PEC measurements and the contributions of the electromagnetic properties (permeability and conductivity) were analyzed with a view to isolate the influence of these two properties. It was found that the conductivity effects are prominent in the rising edge of the transient response and the permeability effects are prominent in the stable phase of the transient response. Chen et al. [4] studied the electrical conductivity measurement of ferromagnetic metallic materials using the PEC technique. In the measurement of conductivity, an inverse problem method based on a PEC analytical model was proposed to determine the conductivity and permeability of ferromagnetic plates. Dziczkowski et al. [9] described the method of determining the equivalent parameters of the coil, a scaling method for a conductivity meter based on the elimination of liftoff on conductivity results, and a proposition for an effective method to measure the conductivity of rough elements. Lu et al. [1,10] found a conductivity lift-off invariance phenomenon and proposed an inverse problem method to determinate the conductivity and permeability of ferrite metallic plates. Wang et al. [2] proposed an eddy current measurement method to determinate electrical conductivity of samples, which indicated that the logarithm of phase signature of impedance change basically varies linearly with electrical conductivity. Yu et al. [11] observed a conductivity invariance phenomenon of eddy current non-destructive testing (NDT), and used it to estimate the magnetic permeability of metals without the influence of its conductivity. Ye et al. [12] proposed a novel approach based on decay time (DT) using PEC and a highly sensitive magnetoresistive (MR) sensor in conductivity measurement of materials. The results indicate that the DT parameter is linearly correlated with material conductivity allowing it to be used for estimating the conductivity from the PEC measurement. According to the above studies, it is found that the conductivity measurements of ferromagnetic samples with a permeability effect are rarely studied by using PEC testing when permeability changes. These works also revealed that the change of PEC signals caused by conductivity and permeability is indistinguishable in the measurement of ferromagnetic samples. In other words, when the conductivity is measured, the influence of permeability can not be reduced or eliminated in PEC signals. Thus, it is important and significant to reduce the influence of permeability on PEC signals, and accurately measure the conductivity of ferromagnetic samples when permeability changes.
It is known that liftoff point of intersection (LOI), as a desirable signal feature, is independent of liftoff distance [13]. The LOI is a common intersection point of PEC signals when liftoff distance changes. For the permeability effect on PEC signals, a similar method can be considered in the conductivity measurement to reduce the influence of permeability. Thus, similarly, a common intersection invariance point feature is needed in PEC signals of ferromagnetic samples for reducing the permeability effect when sample permeability changes or the environmental magnetic field changes. Therefore, in the measurement of conductivity, it is important and significant to propose a method to obtain a permeability invariance (PI) feature for reducing permeability effect or environmental magnetic field influence.
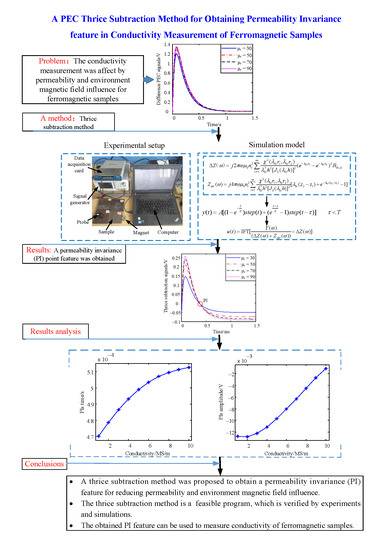
The main contribution of this paper is that a thrice subtraction method is proposed to obtain a PI point feature in PEC signals of ferromagnetic samples for reducing the permeability effect or environmental magnetic field influence. Correspondingly, the availability of the thrice subtraction method and the obtained PI feature is analyzed and discussed. The rest of this paper is organized as follows: in Section 2 the PEC analytical model is formulated from a harmonic eddy current model, the thrice subtraction method is introduced in Section 3, the simulation results are analyzed in Section 4, in 
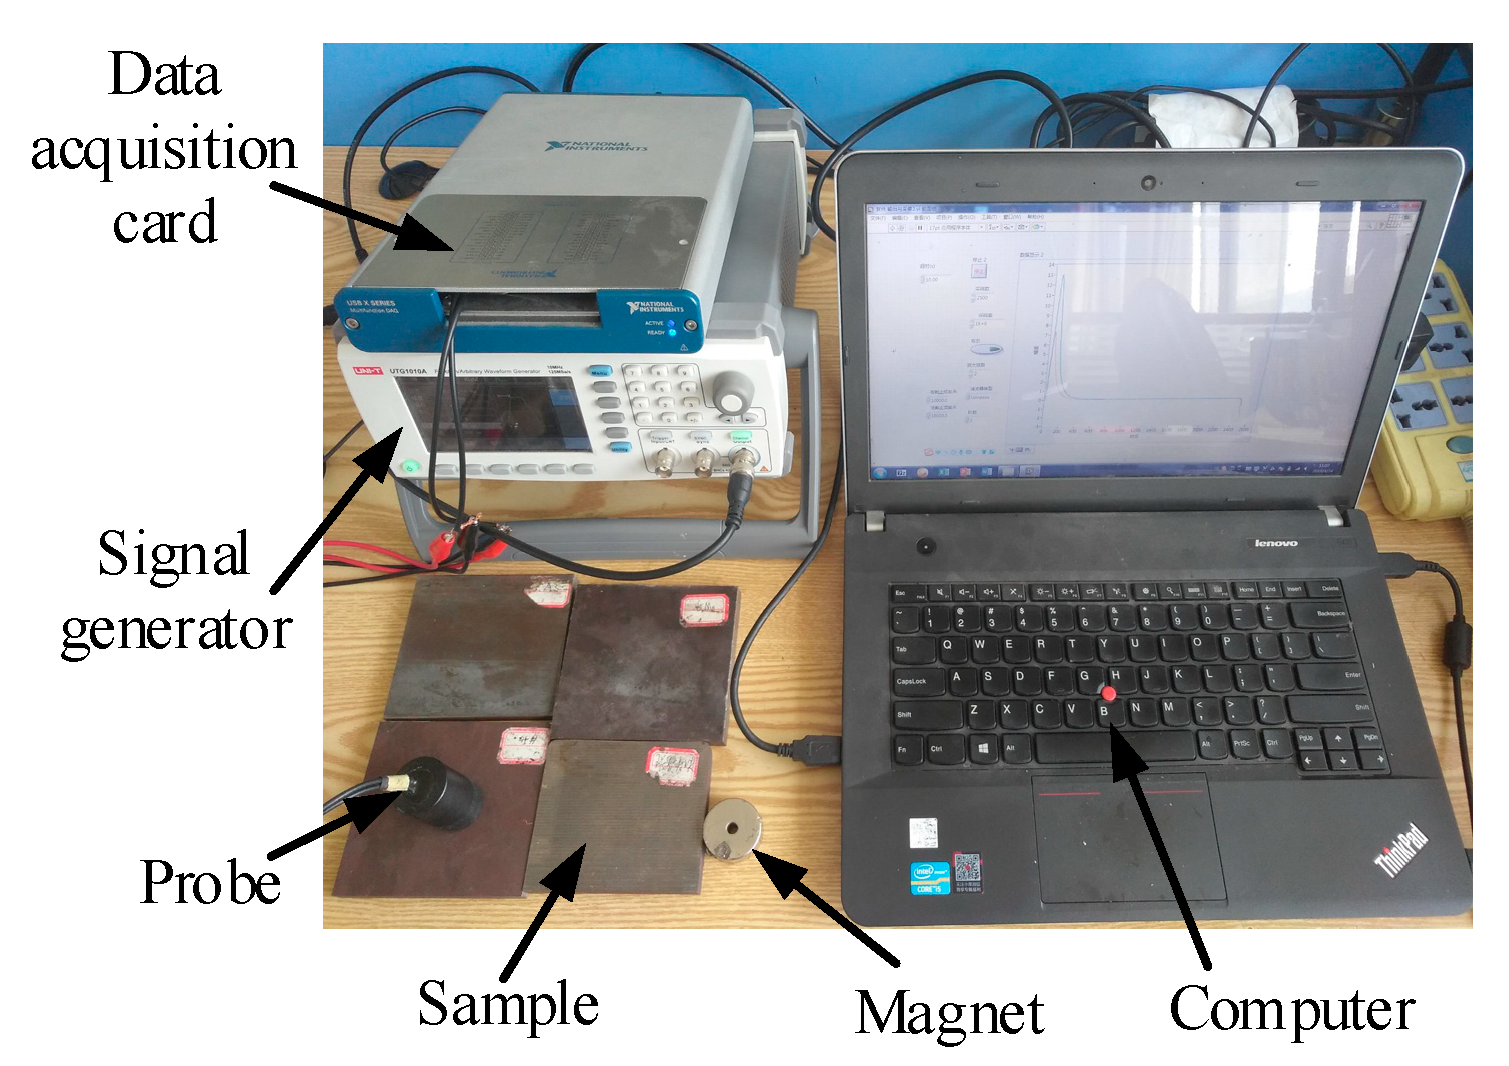
Section 5 the experiments are performed for verifying the simulation results and finally, Section 6 presents the concluding remarks.

2. Formulation of the PEC Analytical Model

The PEC analytical model, as an effective tool, has been used to analyze the change of PEC signals caused by thickness, conductivity and permeability [4,14]. According to previous studies, it can be found that it is very difficult to directly construct a PEC analytical model. However, on the other hand, it is simpler to construct a PEC analytical model based on the harmonic eddy current analytical model. It is known that a periodic pulse signal can be expressed as a Fourier series of trigonometric functions. Therefore, in this paper, the PEC analytical model is reconstructed through using the harmonic eddy current analytical model. The main process is shown in Figure 1.
In the process of constructing the PEC analytical model, a pulse voltage signal y ( t ) serves as an excitation signal of the coil sensor. The difference PEC signal Δ u ( t ) is the voltage change of the coil sensor when a plate is tested. The harmonic eddy current responses Δ Z ( ω ) and Z a i r ( ω ) in the frequency domain are the basis of the PEC model construction, which have been built in previous studies [15,16]. The case for the coil sensor above a conductive plate was considered, as illustrated in Figure 2. The PEC probe was an air-core cylindrical coil. The plate under research was assumed to be linear, homogeneous and isotropic. The electrical conductivity, permeability and thickness of the measured metallic plate are denoted as σ , μ and d , respectively, where μ = μ 0 μ r (μ0 is the permeability of the vacuum, μ r is the relative permeability of the metallic plate). An artificial magnetic insulation boundary was placed at h .
Based on the harmonic eddy current response and spectral pulse signals, the difference PEC response can be formulated by performing Kirchhoff’s Law in the frequency domain. It signifies that the algebraic sum of the voltages of the coil sensor is always equal to zero in a closed loop, which can be expressed as Δ U = | U p l a t e U a i r | = | I × ( Z p l a t e Z a i r ) | . Correspondingly, the difference PEC response in the frequency domain can be obtained. Where U p l a t e and Z p l a t e are the voltage and impedance signal of coil sensor when a plate is tested, U a i r and Z a i r are the voltage and impedance signal of the coil sensor when the coil sensor is in air, the voltage signal U a i r and the impedance signal Z a i r serve as a reference signal, Δ U is the difference PEC response between the detection signal Uplate and reference signal U a i r , I is the current of coil sensor, Δ Z = | Z p l a t e Z a i r | is the impedance change response when a plate is tested. Correspondingly, the difference PEC response in the frequency domain can be expressed as
Δ U ( ω ) = Y ( ω ) Δ Z ( ω ) + Z a i r ( ω ) × Δ Z ( ω )
where Y ( ω ) denotes the Fourier transform of pulse voltage signal y ( t ) , Z p l a t e ( ω ) = Δ Z ( ω ) + Z a i r ( ω ) , Y ( ω ) / ( Δ Z ( ω ) + Z a i r ( ω ) ) = I .
By using inverse Fourier transform (IFT), the difference PEC signal in the time domain can be expressed as
Δ u ( t ) = IFT [ Δ U ( ω ) ] .
Based on the results, a numerical calculation program can be written in MATLAB software (MTLAB R2014a, Math Works, Inc, Natick, Massachusetts, United States, 2014). Correspondingly, some scientific explanations can be verified by numerical method.
In Equation (1), when the air-core coil is excited by harmonic excitation [15], the impedance change of air-core coil can be written as
Δ Z ( ω ) = j 2 π ω μ 0 n c 2 i = 1 χ 2 ( λ 0 i r 1 , λ 0 i r 2 ) λ 0 i 7 h 2 [ J 0 ( λ 0 i h ) ] 2 ( e λ 0 i z 1 e λ 0 i z 2 ) 2 R 0 i , 1 i .
On the other hand, for the case of the air-core coil in air [15], the impedance can be expressed as
Z a i r ( ω ) = j 4 π ω μ 0 n c 2 i = 1 χ 2 ( λ 0 i r 1 , λ 0 i r 2 ) λ 0 i 7 h 2 [ J 0 ( λ 0 i h ) ] 2 [ λ 0 i ( z 2 z 1 ) + e λ 0 i ( z 2 z 1 ) 1 ] .
In Equation (3), the R 0 i , 1 i can be expressed as
R 0 i , 1 i = ( λ 0 i μ r ) 2 λ 1 i 2 + e 2 λ 1 i d [ λ 1 i 2 ( λ 0 i μ r ) 2 ] ( λ 1 i + λ 0 i μ r ) 2 e 2 λ 1 i d ( λ 1 i λ 0 i μ r ) 2
where n c = N c / ( r 2 r 1 ) ( z 2 z 1 ) , N c denotes the number of the coil turns, r 2 , r 1 are the outer and inner radius of the coil, ( z 2 z 1 ) denotes the height of the coil, λ 0 i is the i t h positive root of the Bessel function J 1 ( λ 0 h ) , J m is the m t h order Bessel function of the first kind, R 0 i , 1 i is a constant related to the conductivity, permeability and thickness of measured metallic plates, λ 1 i = λ 0 i 2 + j ω σ μ .
In order to obtain the difference PEC response for simulating transient induced voltage, the periodic pulse signal is applied. Combined with the superposition principle and inverse Fourier transform, the PEC transient response can be reconstructed from the harmonic eddy current response [17,18]. For the T-periodic pulse, the formula can be expressed as
y ( t ) = A [ ( 1 e t a ) s t e p ( t ) + ( e τ t a 1 ) s t e p ( t τ ) ] τ < T
where, a is the time constant, s t e p ( t ) is the step function, A is the amplitude value of excitation current, τ is the excitation time, T is the excitation period.

3. Thrice Subtraction Method

By analyzing previous research ideas [13,
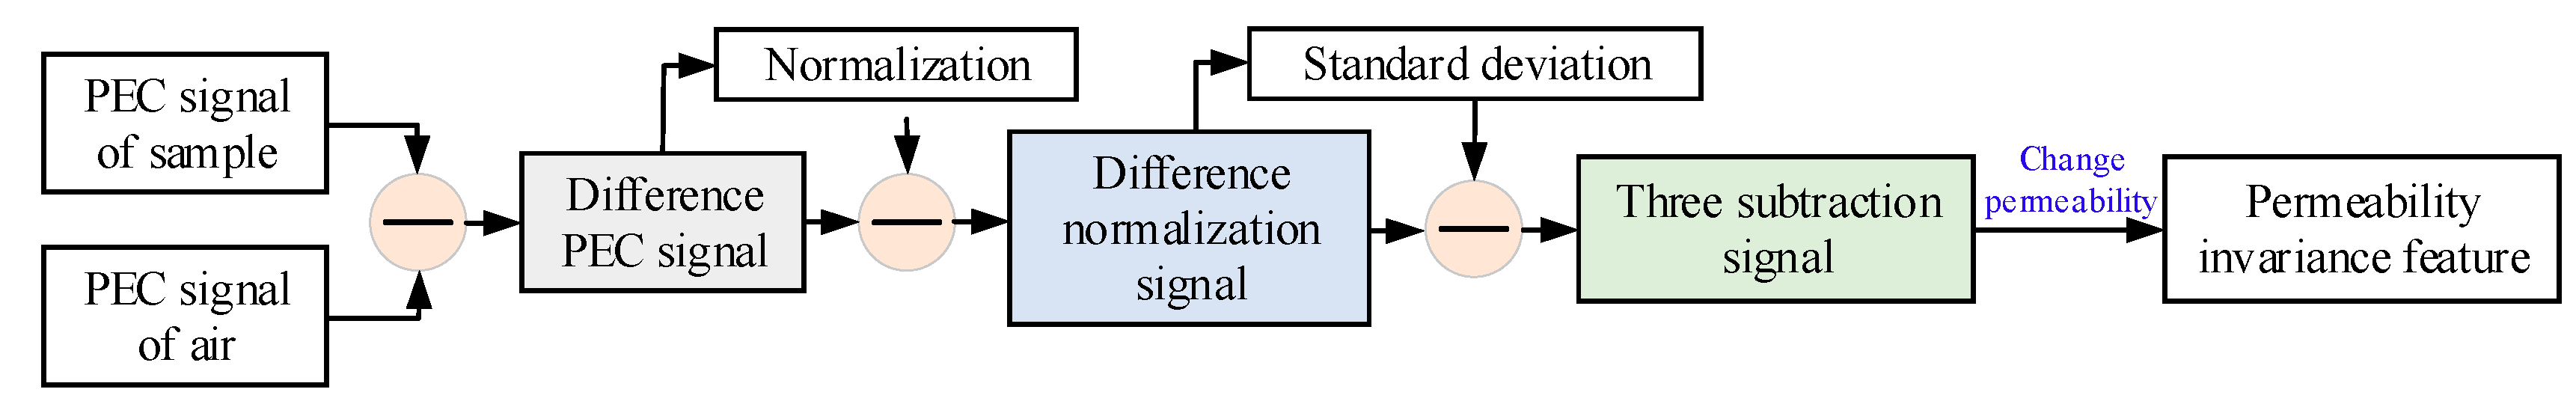
19], a thrice subtraction method was proposed to obtain a PI feature for reducing the effect of permeability change. The thrice subtraction method included three subtraction steps and the operating process is shown in 
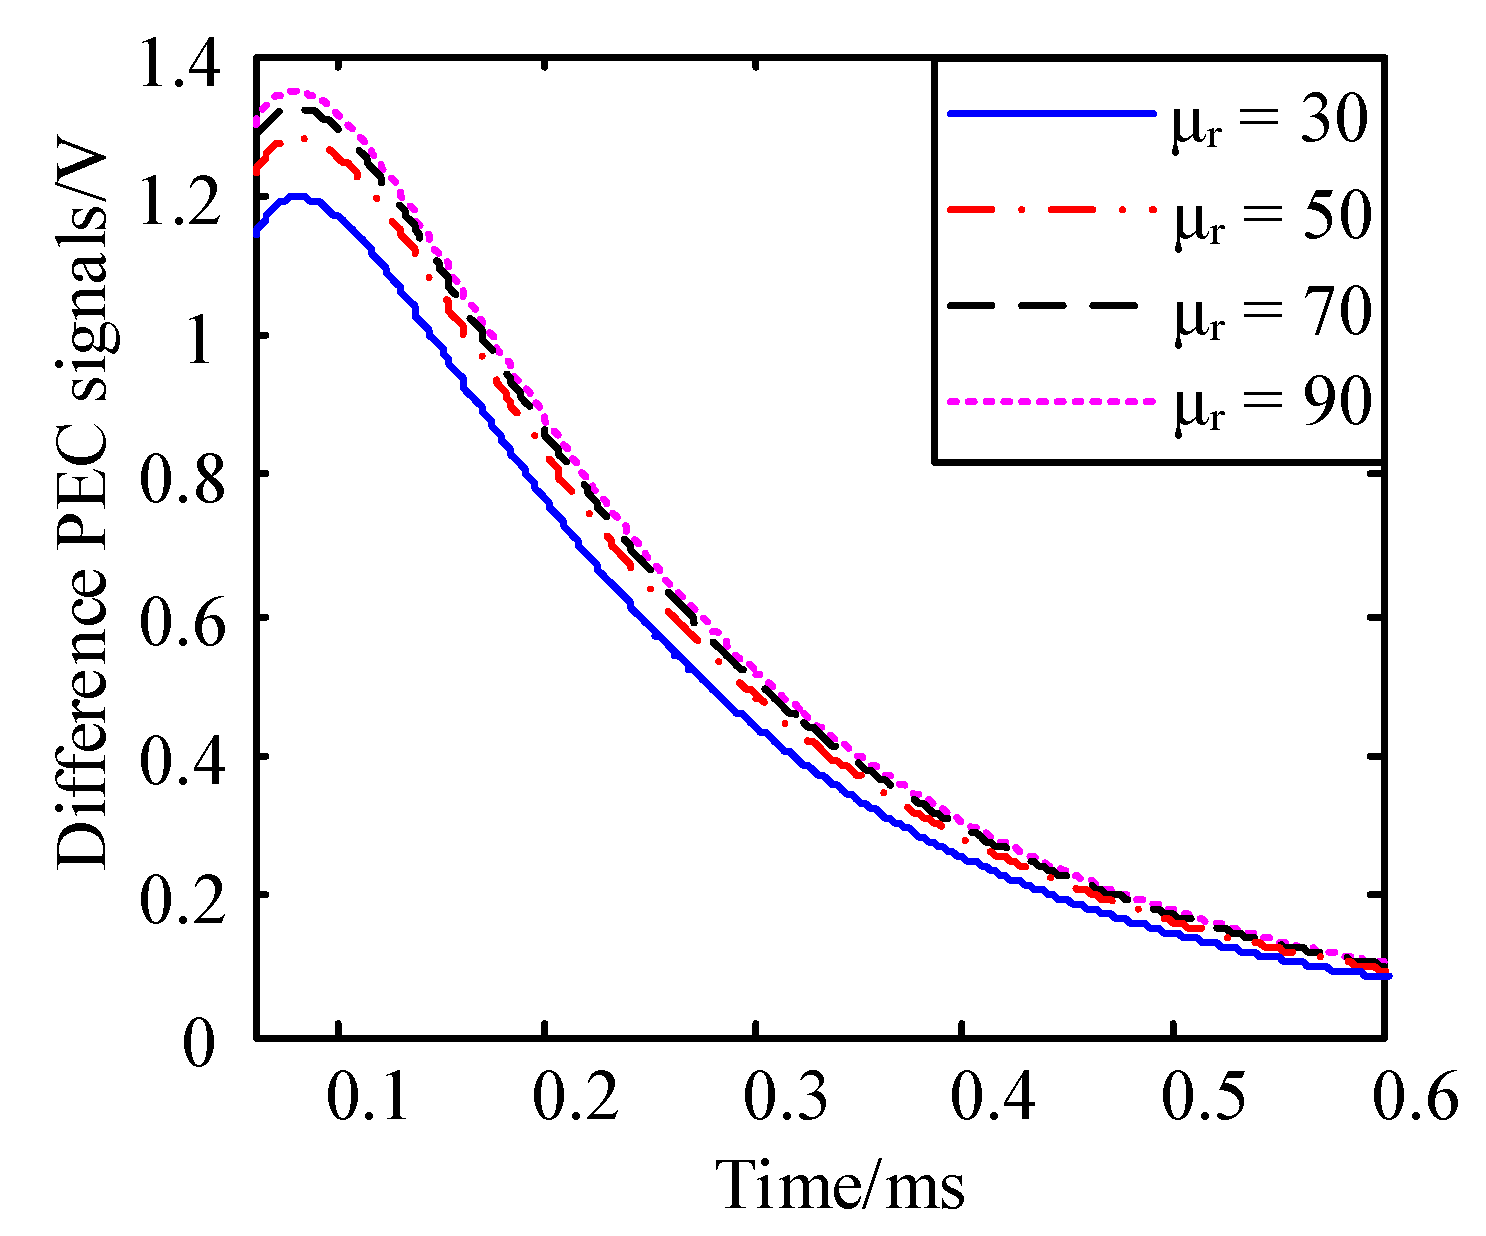
Figure 3. The first subtraction was implemented to eliminate the effect of PEC signal from air. A difference PEC signal was obtained after the subtraction process. Then, the normalization signal of the difference PEC signal was obtained and the second subtraction was performed between the difference PEC signal and its normalization signal, which was used to amplify the variation of the difference PEC signal. Next, the standard deviation of the difference normalization signal was calculated and the third subtraction was implemented, which was used to reduce the effect of permeability. Finally, the PI feature could be extracted from thrice subtraction signals when permeability changed. The detailed steps are described below.
First, the subtraction between PEC signals of sample and air is implemented to obtain the difference PEC signal. The subtraction process can be shown as
Δ U ( t ) = | U ( t ) p l a t e U ( t ) a i r |
where, U ( t ) p l a t e is the PEC signal of sample, U ( t ) a i r is the PEC signal of air.
Second, the subtraction between the difference PEC signal and its normalization signal is performed to obtain the difference normalization signal. The difference normalization signal can be formulated as
U d n o r m = Δ U ( t ) Δ U ( t ) max ( Δ U ( t ) )
where, Δ U ( t ) max ( Δ U ( t ) ) denotes the normalization signal of the difference PEC signal, max ( Δ U ( t ) ) denotes the maximum value of the difference PEC signal.
Then, the third subtraction between the difference normalization signal and its standard deviation is calculated to obtain the thrice subtraction signal. The thrice subtraction signal can be expressed as
U s t d = U d n o r m s t d ( U d n o r m )
where, s t d ( U d n o r m ) denotes the standard deviation of the difference normalization signal.
By changing the permeability of samples, the different thrice subtraction signals can be obtained and the PI feature can be extracted by mutual subtraction between them as
U s t d 1 U s t d 2 = 0 .
Finally, by solving Equation (10), the amplitude and time of the PI feature can be obtained. It is easy to think that the common point of both different signals, called the PI feature point, is unaffected by the change in permeability. In other words, the PI feature is immune to the permeability effect.

4. Simulation Results

4.1. PI Feature Acquisition

According to the PEC analytical model, the numerical simulation code was written in MATLAB software to simulate the PEC signal with different relative permeability and verify the thrice subtraction method. In simulations, the height, inner and outer radius of the probe coil were 6 mm, 4 mm and 6 mm, respectively. There were 300 turns of coil. The boundary was set to h = 20 r 2 = 120   mm . The pulse excitation had a 10 V amplitude, 200 Hz frequency and 50% duty cycle. The time constant of pulse excitation was set to 33 μ s . The excitation signal of pulse voltage is shown in Figure 4. In Figure 5, the difference PEC signals are shown when permeability changes. It can be observed that the difference PEC signals integrally decreased when relative permeability decreased. Especially, in the partially enlarged drawing shown in Figure 6, the variation of difference PEC signal is obvious. The results indicated that the difference PEC signals did not show intersection phenomenon and the permeability effect was obvious when permeability changes.
Under the condition that the rise time of pulse excitation is constant, when excitation pulse frequency increased, the difference PEC signals changed as shown in Figure 7. It was observed that the change of excitation pulse frequency led to the change of excitation pulse period. In experiments, the difference PEC signals were recorded when it was triggered by the rising or falling of pulse excitation. It can be seen that the difference PEC signal did not change in the first half part of the difference PEC signal, as shown in Figure 7a, when the excitation pulse frequency changes at lower excitation pulse frequency. When the pulse frequency was higher, the recorded difference PEC signal in first half part of periodic pulse was incomplete and there was no stationary part in difference PEC signal, as shown in Figure 7b. When the rising time of pulse excitation changed, as shown in Figure 8, it can be observed that the response time of the difference PEC signals to stationary section was shorter.
By using the thrice subtraction method based on the above difference PEC signals, the thrice subtraction signals could be obtained from the difference PEC signals, as shown in Figure 9. It was observed that the amplitude of thrice subtraction signals was smaller than that in the difference PEC signals. An intersection point phenomenon was exhibited in the thrice subtraction signals, which is called a PI signal feature. It was observed that at the intersection point of thrice subtraction signals, the thrice subtraction signals were independent of permeability effect. The PI feature was immune to permeability change. According to above analyses, it is known that the thrice subtraction signal was affected by excitation pulse frequency and rising time of pulse excitation. Thus, some limits are needed in the application of PI phenomenon. In order to keep the method practical, the excitation pulse frequency should be kept lower when rising time of pulse excitation is longer.

4.2. Behavior of PI Feature

When conductivity and thickness of samples changed, the PI time and amplitude were changed, as shown in Figure 10 and Figure 11. It was found that the PI amplitude and time changed when the thickness changed from about 0 to 2 mm and the conductivity changed from about 0 to 10 MS/m, which signified that the thickness and conductivity of sample could be measured by testing the PI amplitude and time. When the thickness was larger than 2 mm and conductivity changed from 0 to 3 MS/m, the PI time and amplitude changed with increasing conductivity. When the thickness was larger than 2 mm and the conductivity changed from 3 MS/m to 10 MS/m, the PI time did not change. The results demonstrated that the detection range of conductivity was from 0 to 10 MS/m when the thickness was smaller than 2 mm and the detection range of conductivity was from 0 to 3 MS/m when the thickness was larger than 2 mm. It also indicated that the conductivity measurement was only suitable for a certain range when sample thickness was determined.
When the conductivity of sample was 3.2 MS/m, the PI time and amplitude curves are depicted with thickness in Figure 12. It was observed that the PI time and amplitude were changed when thickness was smaller than 3.6 mm. When sample thickness was larger than 4 mm, the PI time and amplitude were almost unchanged, which signified that the thickness of sample did not affect the PI feature with increasing thickness. The PI time and amplitude curves are shown with conductivity in Figure 13 for a thickness samples of 0.8 mm. It was found that the PI time and amplitude increased with increasing conductivity. The PIs changes along a curve with increasing conductivity. The results indicated that the PI time and amplitude could serve as an index of conductivity when sample thickness was constant, which signified that the conductivity of ferromagnetic samples could be determined by testing PI time or amplitude. In other words, the thrice subtraction method was a feasible program to obtain a PI feature for reducing the effect of permeability in conductivity measurements of ferromagnetic samples. The results indicated that the behavior of PI feature was affected by the conductivity and thickness of the samples. Thus, in practical measurement of sample conductivity, the thickness of sample should keep constant and the other variables should also remain unchanged in testing. When the thickness of sample was bigger than skin depth of eddy current in conductivity measurement, the thickness did not affect the change of PI feature, as shown in Figure 10 and Figure 11. However, the measurement range of conductivity was changed. In order to measure the conductivity of the sample, the thickness of sample should be known and the size of sample should also be the same.

5. Experimental Setup and Results

5.1. Experimental Setup

As shown in Figure 14, the experimental setup included a computer, signal generator (DG1022Z), data acquisition card (NI USB-6356) and probe. The pulse excitation signal was obtained from the signal generator and applied to the probe. The data acquisition card communicated with computer by USB interface. The data acquisition card was set to trigger on the rising edge, which means that the PEC signal was recorded when the signal rising edge began. The probe signal was processed by low pass filter and was enlarged in LabVIEW software (LabVIEW 2015, NI, United States, 2015). The ferromagnetic material can be seen as many small magnetic domain structures. When the environmental magnetic field changes, the magnetic domain organization is ordered in the direction of the magnetic field. Therefore, a magnet can be used to change the environmental magnetic field so that the permeability of the ferromagnetic material is considered to have changed. In order to change the permeability of ferromagnetic samples, a magnet piece was used to change the magnetic field caused by material permeability. The magnet piece was only used to change the magnetic field in the testing environment, which means that any magnet piece could be used in testing. The distance between magnet and sample was set to change the size of the magnetic field, as shown in Figure 15.

5.2. Results and Discussion

In experiments, the pulse excitation had a 10 V amplitude, a 200 Hz frequency and a 50% duty cycle. The sampling frequency was 1 MHz and the sampling point was 2500. When the rising edge was triggered, the data acquisition card began to record the probe signals. The samples included 45# steel, 65Mn steel, A3 steel and nodular cast iron plates. The sample had a length of 100 mm, width of 100 mm and height of 10 mm. The conductivities of the samples are listed in Table 1, which were measured using the four-wire Kelvin resistivity measurement method [20,21] in a laboratory environment on samples with a polished top surface.
Figure 16 shows the difference PEC signals when the distance between the magnet and sample changed. It was observed that the difference PEC signals integrally increased or decreased when the magnet distance changed. In terms of 45# steel, 65Mn steel, A3 steel and nodular cast iron samples, the difference PEC signals did not exhibit intersection phenomenon and the amplitude of difference PEC signals was obviously affected. The results were consistent with the simulation results, which indicated that the difference PEC signals were affected when permeability changes and the PI feature did not appear.
Based on the above differences PEC signals, the thrice subtraction method was used to obtain thrice subtraction signals and the PI feature. Figure 17 shows that a PI feature appeared in thrice subtraction signals in terms of 45# steel, 65Mn steel, A3 steel and nodular cast iron samples. At the PI feature, the thrice subtraction signals were almost independent of the permeability effect. Furthermore, the PI features were extracted from thrice subtraction signals, as shown in Figure 18. It was observed that the PI time and amplitude increased along a curve with increasing conductivity. The change rule of conductivity was consistent with the actual measurement. The result was in agreement with the simulation result under a certain condition, which demonstrated that by testing PI amplitude and time, the conductivity of ferromagnetic samples could be determined without the permeability effect. The results pointed that the thrice subtraction method was a feasible program to obtain a PI feature for reducing the permeability effect in the conductivity measurement of ferromagnetic samples.
In PEC testing, the formulation of the PEC model was established in a simplified condition. Thus, the simulation results fit one specific case in terms of a certain condition. The simulation results were available to verify the change law of the PEC response with different thickness, conductivity and permeability. The simulations may have led to the inconsistency with experimental results under the same conditions. On the other hand, due to the measurement error, there may have been deviation in the conductivity measured by the four-wire Kelvin resistivity measurement method. According to experiment and simulation results, it was feasible to verify the variation and trend of the conductivity in terms of real value. Although there were some shortcomings in the simulations and experiments, the change law of conductivity and variation of conductivity was consistent with the actual measurement, which demonstrated that the measurement results were feasible and the proposed method was effective.

6. Conclusions

Permeability, as an influence factor, will lead to measurement error in conductivity measurement of ferromagnetic samples when it changes. In this paper, the effect of permeability was considered in the PEC measurement of conductivity of ferromagnetic samples. In order to reduce the permeability effect, a thrice subtraction method was proposed to obtain a PI feature in conductivity measurement of ferromagnetic samples. The PI phenomenon was verified and the behavior of the PI feature was analyzed with changes in conductivity and thickness. Following that, the experiments were implemented to verify the availability of the thrice subtraction method and the practicality of the obtained PI feature in the conductivity measurement. The results demonstrated that the thrice subtraction method was a feasible program to obtain a PI feature for reducing the permeability effect. The PI feature has the potential to enable the measurement of conductivity of ferromagnetic samples without the permeability effect. The next step for further research is to measure ferromagnetic materials with unknown conductivity and evaluate the thickness of ferromagnetic samples.

Author Contributions

Conceptualization, D.W., M.F., B.C. and Z.X.; methodology, D.W.; software, D.W.; validation, M.F., B.C., P.W. and Z.X.; formal analysis, Z.X.; investigation, D.W. and Z.X.; resources, M.F. and B.C.; data curation, D.W.; writing—original draft preparation, D.W. and Z.X.; writing—review and editing, M.F., B.C. and P.W.; visualization, D.W.; supervision, M.F. and P.W.; project administration, B.C. and P.W.; funding acquisition, M.F.

Funding

This work was supported in part by the National Natural Science Foundation of China under grant 51677187, and in part by the Priority Academic Program Development of Jiangsu Higher Education Institutions.

Acknowledgments

The authors would like to thank the editors and reviewers for giving significant and insightful comments.

Conflicts of Interest

The authors declare no conflict of interest.

References

  1. Lu, M.; Xu, H.; Zhu, W.; Yin, L.; Zhao, Q.; Peyton, A.; Yin, W. Conductivity Lift-off Invariance and measurement of permeability for ferrite metallic plates. NDT E Int. 2018, 95, 36–44. [Google Scholar] [CrossRef]
  2. Wang, C.; Fan, M.; Cao, B.; Ye, B.; Li, W. Novel Noncontact Eddy Current Measurement of Electrical Conductivity. IEEE Sens. J. 2018, 18, 9352–9359. [Google Scholar] [CrossRef]
  3. Rodrigues, N.M.; Rosado, L.S.; Ramos, P.M. A portable embedded contactless system for the measurement of metallic material conductivity and lift-off. Measurement 2017, 111, 441–450. [Google Scholar] [CrossRef]
  4. Chen, X.; Lei, Y. Electrical conductivity measurement of ferromagnetic metallic materials using pulsed eddy current method. NDT E Int. 2015, 75, 33–38. [Google Scholar] [CrossRef]
  5. Lefebvre, J.H.V.; Dubois, J.M.S. Lift-off point of intercept (LOI) behavior. Rev. Prog. Quant. Nondestruct. Eval. Vols 24a 24b 2005, 760, 523–530. [Google Scholar]
  6. Lu, M.Y.; Zhu, W.Q.; Yin, L.Y.; Peyton, A.J.; Yin, W.L.; Qu, Z.G. Reducing the Lift-Off Effect on Permeability Measurement for Magnetic Plates from Multifrequency Induction Data. IEEE Trans. Instrum. Meas. 2018, 67, 167–174. [Google Scholar] [CrossRef]
  7. Tian, G.Y.; He, Y.; Adewale, I.; Simm, A. Research on spectral response of pulsed eddy current and NDE applications. Sens. Actuators A Phys. 2013, 189, 313–320. [Google Scholar] [CrossRef]
  8. Adewale, I.D.; Tian, G.Y. Decoupling the Influence of Permeability and Conductivity in Pulsed Eddy-Current Measurements. IEEE Trans. Magn. 2013, 49, 1119–1127. [Google Scholar] [CrossRef]
  9. Dziczkowski, L. Elimination of Coil Liftoff from Eddy Current Measurements of Conductivity. IEEE Trans. Instrum. Meas. 2013, 62, 3301–3307. [Google Scholar] [CrossRef]
  10. Lu, M.; Xie, Y.; Zhu, W.; Peyton, A.J.; Yin, W. Determination of the magnetic permeability, electrical conductivity, and thickness of ferrite metallic plates using a multi-frequency electromagnetic sensing system. IEEE Trans. Ind. Inform. 2018. [Google Scholar] [CrossRef]
  11. Yu, Y.T.; Zou, Y.; Al Hosani, M.; Tian, G.Y. Conductivity Invariance Phenomenon of Eddy Current NDT: Investigation, Verification, and Application. IEEE Trans. Magn. 2017, 53. [Google Scholar] [CrossRef]
  12. Ye, C.; Su, Z.; Rosell, A.; Udpa, L.; Udpa, S.; Capobianco, T.; Tamburrino, A. A decay time approach for linear measurement of electrical conductivity. NDT E Int. 2019, 102, 169–174. [Google Scholar] [CrossRef]
  13. Tian, G.Y.; Li, Y.; Mandache, C. Study of Lift-Off Invariance for Pulsed Eddy-Current Signals. IEEE Trans. Magn. 2009, 45, 184–191. [Google Scholar] [CrossRef]
  14. Ulapane, N.; Alempijevic, A.; Miro, J.V.; Vidal-Calleja, T. Non-destructive evaluation of ferromagnetic material thickness using Pulsed Eddy Current sensor detector coil voltage decay rate. NDT E Int. 2018, 100, 108–114. [Google Scholar] [CrossRef]
  15. Fan, M.; Huang, P.; Ye, B.; Hou, D.; Zhang, G.; Zhou, Z. Analytical modeling for transient probe response in pulsed eddy current testing. NDT E Int. 2009, 42, 376–383. [Google Scholar] [CrossRef]
  16. Chen, X.; Lei, Y. Excitation current waveform for eddy current testing on the thickness of ferromagnetic plates. NDT E Int. 2014, 66, 28–33. [Google Scholar] [CrossRef]
  17. Fan, M.B.; Cao, B.H.; Yang, X.F. Analytical time-domain model of transient eddy current field in pulsed eddy current testing. Acta Phys. Sin. 2010, 59, 7570–7574. [Google Scholar]
  18. Mandache, C.; Lefebvre, J.H.V. Transient and harmonic eddy currents: Lift-off point of intersection. NDT E Int. 2006, 39, 57–60. [Google Scholar] [CrossRef]
  19. Wood, J. Invariant pattern recognition: A review. Pattern Recognit. 1996, 29, 1–17. [Google Scholar] [CrossRef]
  20. Bowler, N.; Huang, Y. Electrical conductivity measurement of metal plates using broadband eddy-current and four-point methods. Meas. Sci. Technol. 2005, 16, 2193–2200. [Google Scholar] [CrossRef] [Green Version]
  21. Miccoli, I.; Edler, F.; Pfnur, H.; Tegenkamp, C. The 100th anniversary of the four-point probe technique: The role of probe geometries in isotropic and anisotropic systems. J. Phys. Condens. Matter 2015, 27, 223201. [Google Scholar] [CrossRef] [PubMed]
Figure 1. Flow chart of pulsed eddy current (PEC) model.
Applsci 09 02745 g001
Figure 2. Coil sensor above a plate.
Applsci 09 02745 g002
Figure 3. Flow diagram of thrice subtraction method.
Applsci 09 02745 g003
Figure 4. Pulse excitation voltage signal.
Applsci 09 02745 g004
Figure 5. The difference in PEC signals.
Applsci 09 02745 g005
Figure 6. Partially enlarged drawing.
Applsci 09 02745 g006
Figure 7. The difference PEC signals with different frequencies. (a) lower frequency; (b) higher frequency.
Applsci 09 02745 g007
Figure 8. The difference in PEC signals with different rising times.
Applsci 09 02745 g008
Figure 9. Thrice subtraction signals. Permeability invariance (PI) is shown by the red circle at the intersection of the signals.
Applsci 09 02745 g009
Figure 10. PIs time change with thickness and conductivity.
Applsci 09 02745 g010
Figure 11. PIs amplitude change with thickness and conductivity.
Applsci 09 02745 g011
Figure 12. PI time and amplitude curves with thickness. (a) PI time curve; (b) PI amplitude curve.
Applsci 09 02745 g012
Figure 13. PI time and amplitude curves with conductivity. (a) PI time curve; (b) PI amplitude curve.
Applsci 09 02745 g013
Figure 14. Experimental setup.
Applsci 09 02745 g014
Figure 15. Sample and magnet.
Applsci 09 02745 g015
Figure 16. The difference PEC signals. (a) A3 steel; (b) 45# steel; (c) 65Mn steel; (d) nodular cast iron.
Applsci 09 02745 g016
Figure 17. Thrice subtraction signals. (a) A3 steel; (b) 45# steel; (c) 65Mn steel; (d) nodular cast iron.
Applsci 09 02745 g017
Figure 18. PIs with samples of different materials. (a) PI time curve; (b) PI amplitude curve.
Applsci 09 02745 g018
Table 1. Conductivity of experiment samples.
65Mn Steel45# SteelA3 SteelNodular Cast Iron
Conductivity
(MS/m)
4.47 3.76 3.41 1.56

