Article

Seismic Performance of Reinforced Concrete Short Columns Subjected to Freeze–Thaw Cycles

School of Civil Engineering, Xi’an University of Architecture and Technology, Xi’an 710055, China
*
Author to whom correspondence should be addressed.
Appl. Sci. 2019, 9(13), 2708; https://doi.org/10.3390/app9132708
Submission received: 2 June 2019 / Revised: 21 June 2019 / Accepted: 26 June 2019 / Published: 3 July 2019
(This article belongs to the Section Civil Engineering)

Abstract

:
Previous research shows that freeze–thaw cycles represent one of the most dangerous threats to reinforced concrete (RC) structures. However, there is almost no experimental data on the effects of freeze–thaw cycles on the seismic behavior of RC columns showing flexure-shear failure. In this study, three columns with the shear span-to-depth ratio of 2.5 were subjected to different numbers of freeze–thaw cycles (FTCs) and pseudo-static testing. The seismic performance indexes of the specimens were analyzed in terms of hysteretic behavior, skeleton curves, shear deformation, and energy dissipation. The test observations show that the failure patterns of the test columns altered from the flexure dominated to shear dominated, owing to the more severe deterioration in shear capacity induced by freeze–thaw attack than in flexure capacity. The test results also indicate that freeze–thaw cycles significantly decrease the ductility and energy dissipation of test columns, and they increase the contributions of shear deformation to the total deformation.

1. Introduction

Over the past few decades, concrete structures in cold regions have experienced severe deterioration due to freeze–thaw penetration. For example, certain concrete structures in North China have been affected by this physical procedure, including buildings, bridge piers, and off-shore platforms [1,2]. The main mechanism of freeze–thaw damage which is widely accepted is related to the 9% volume expansion of freezing water that exists in the concrete pore system, resulting in an increase of hydraulic pressure [3,4,5]. As the pressure accumulates and exceeds the concrete tensile stress, cracks initiate and lead to the degradation of concrete properties. A series of experiments [6,7,8,9,10] were conducted to investigate these degradations on the material level and concluded that in many aspects the apparent deteriorations were produced due to the freeze–thaw action, which comprised concrete compressive and tensile strength, modulus of elasticity, and the bond strength between concrete and reinforcement. In addition to tests on concrete mechanical properties, modern techniques have been used to expose the evolution of frost damage in concrete, including but not limited to X-ray computed tomography [11], ultrasonic imaging [12,13], and flatbed scanner [14]. Hence, when considering the potential consequences of earthquakes in the seismic area, it is important to quantify the seismic performance of structures subjected to freeze–thaw cycles (FTCs).
In comparison to the reality that deep insights into material properties of freeze–thaw damaged concrete have been put forward, the experimental studies on the components level are still limited. Using monotonic loading, Hayashida et al. [15] tested reinforced concrete (RC) beams using the depth and location of frost damage as variables. Their test results showed that the reduction in the stiffness and bearing capacities was significant. Yang et al. [16] conducted cyclic loading tests on RC squat shear walls with 0 to 300 FTCs. It was concluded that increasing frost damage altered the failure modes of the specimens and severely decreased their seismic performance. Recently, Qin et al. [17] studied the seismic behavior of RC beam-column joints with different freeze–thaw damage based on a simulated seismic loading test.
As the main load carrying and lateral force resistant member, RC column’s hysteretic response is highly vital to the seismic behaviors of RC structures. Therefore, the evaluation of the seismic behaviors of RC columns with freeze–thaw damage should be investigated. In an experimental program carried out by Xu et al. [18], RC columns with varying FTCs were subjected to cyclic loading tests under different axial load ratios. The columns were designed with much larger shear capacity than the flexural capacity due to the large shear span-to-depth ratio (equal to five), and they all showed typical flexure failures despite the difference in freeze–thaw damage. The identical failure modes were also reported in other experimental studies on freeze–thaw damaged columns with the same shear span ratio of five [19,20].
However, the shear capacity of the RC column was weakened, as well as its flexural capacity, owing to the strength decay in freeze–thaw damaged concrete. In addition, a large portion of the RC short columns are quietly vulnerable during an earthquake attack as observed in post-earthquake investigations [21], where their failure would cause the buildings to collapse. It is known that the shear failure of RC columns or beams is brittle in nature, and therefore it has been examined in a number of studies [22,23,24], however, the effect of FTCs on their seismic performance has not been studied yet. Therefore, this study explores the cyclic performance of the aforementioned RC columns damaged by FTCs. For the purpose of observing the decay of both shear capacity and flexure capacity, three RC columns with a shear span-to-depth ratio of 2.5, designed to fail in flexure-shear mode, were subjected to different numbers of FTCs and cyclic lateral loading in sequence. Various seismic performance indicators were analyzed, which included comprising failure pattern, hysteretic behaviors, skeleton curves, shear deformation, and energy dissipation.

2. Experimental Program
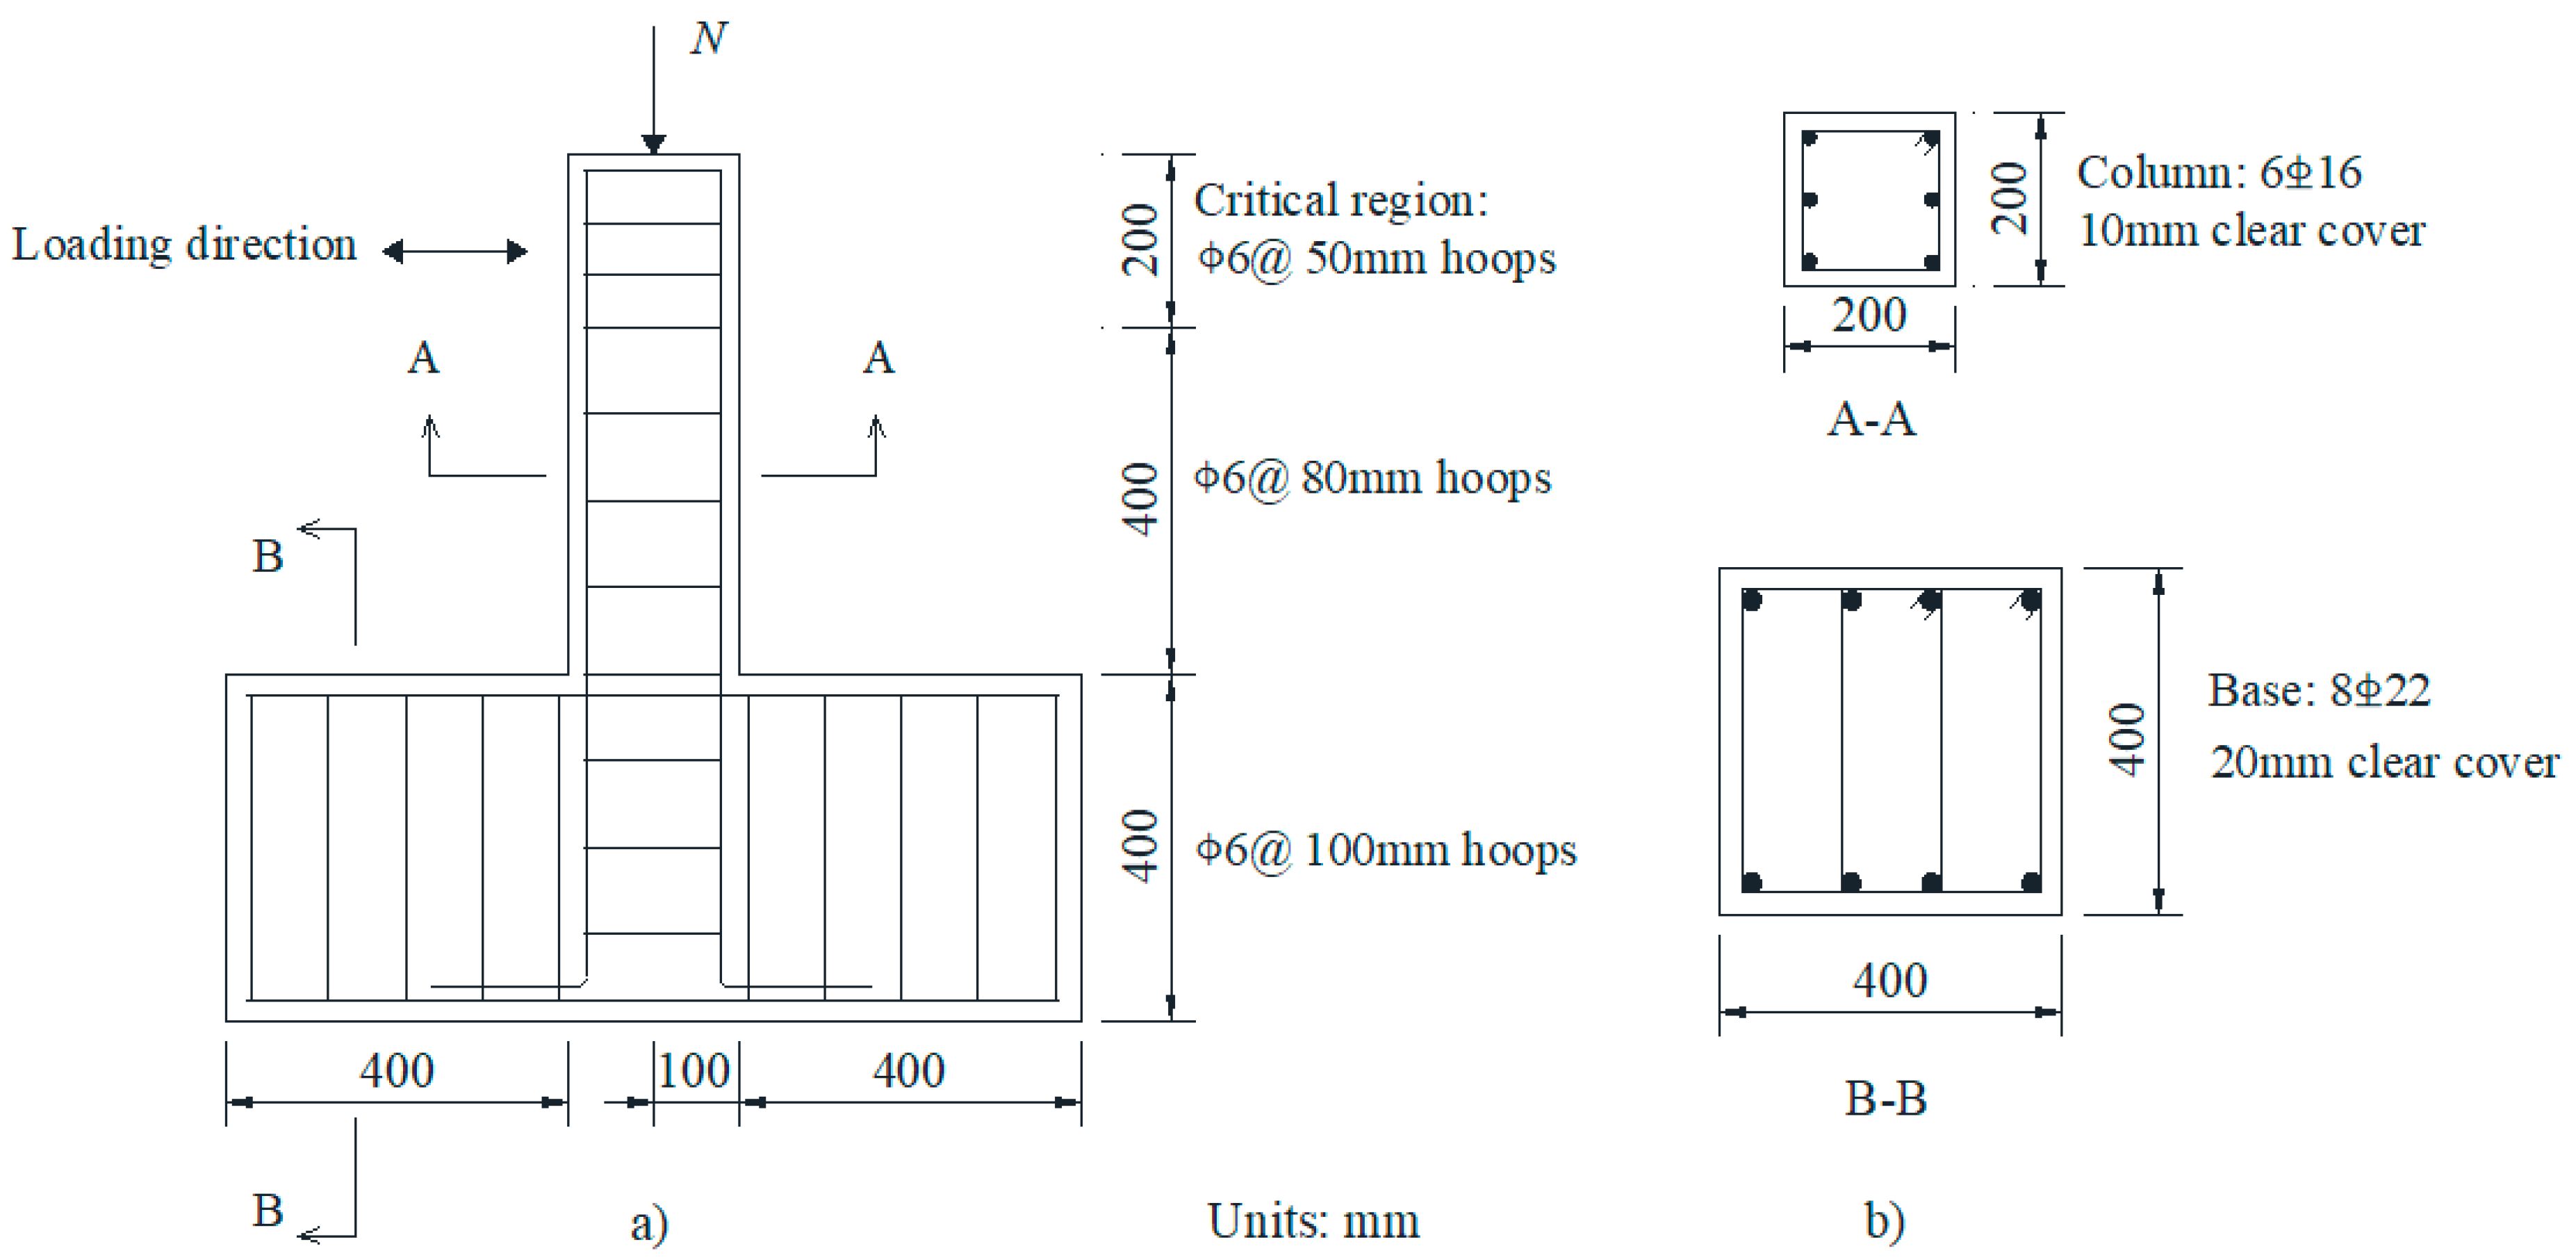
2.1. Test Specimens

Specimens with the same geometry and structural details were designed and subjected to different numbers of FTCs. The centerline of the lateral loading point was 100 mm away from the top face of the specimens, and therefore the shear span-to-depth ratio of the specimen was 2.5. Cross-section and reinforcement details of the test columns and footings are shown in Figure 1. The specification of the longitudinal bar and reinforcing hoop adopted were HRB335 and HPB300. Three 16 mm diameter longitudinal bars were used in both sides of the columns, and 6 mm diameter transverse reinforcement was uniformly spaced at 50 mm over the top 200 mm of the column to prevent crushing of the local concrete, and at 80 mm over the rest of the column. The specific design parameters are presented in Table 1. It is noted that the axial force N was kept as a constant value instead of the axial force ratio because the actual axial force ratio changed with the decrease of concrete strength initiated by the freeze–thaw attack.
The control specimen was designed to be governed by flexure shear failure according to the ratio of theoretical flexural strength Vp and nominal shear strength Vn calculated conforming to Chinese code [25], as presented in the following equations:
V p H = 1 2 α 1 f c b c ( h c ) + 1 2 ( f y A s + f y A s ) ( h 0 a s )
V n = 1.75 λ + 1 f t b h 0 + f y v A s v s h 0 + 0.07 N
where, α1 is a factor relating the width of the equivalent rectangular compressive stress block to the compressive stress of concrete; fc is the compressive strength of concrete; b is the width of column section; c is the distance from the extreme compression fiber to the neutral axis; h is the length of column section; ft and fy are the yield strength of tension reinforcement and compression reinforcement, respectively; As and As are the area of tension reinforcement and compression reinforcement, respectively; h0 is the distance from the extreme compression fiber to the centroid of longitudinal tension steel; as is the distance from the extreme compression fiber to the centroid of longitudinal compression steel; λ is the shear span ratio; ft is the tensile strength of the concrete; fyv is the yield strength of the transverse reinforcement; s is center-to-center spacing of the transverse reinforcement; Asv is the area of the transverse reinforcement; and N is the axial load. In ASCE 41-13 [26], it is pointed that the column would be vulnerable to flexure-shear failure when 1.0 ≥ Vp/Vn > 0.6. Therefore, the controlled column was designed to have a ratio around 1.0.

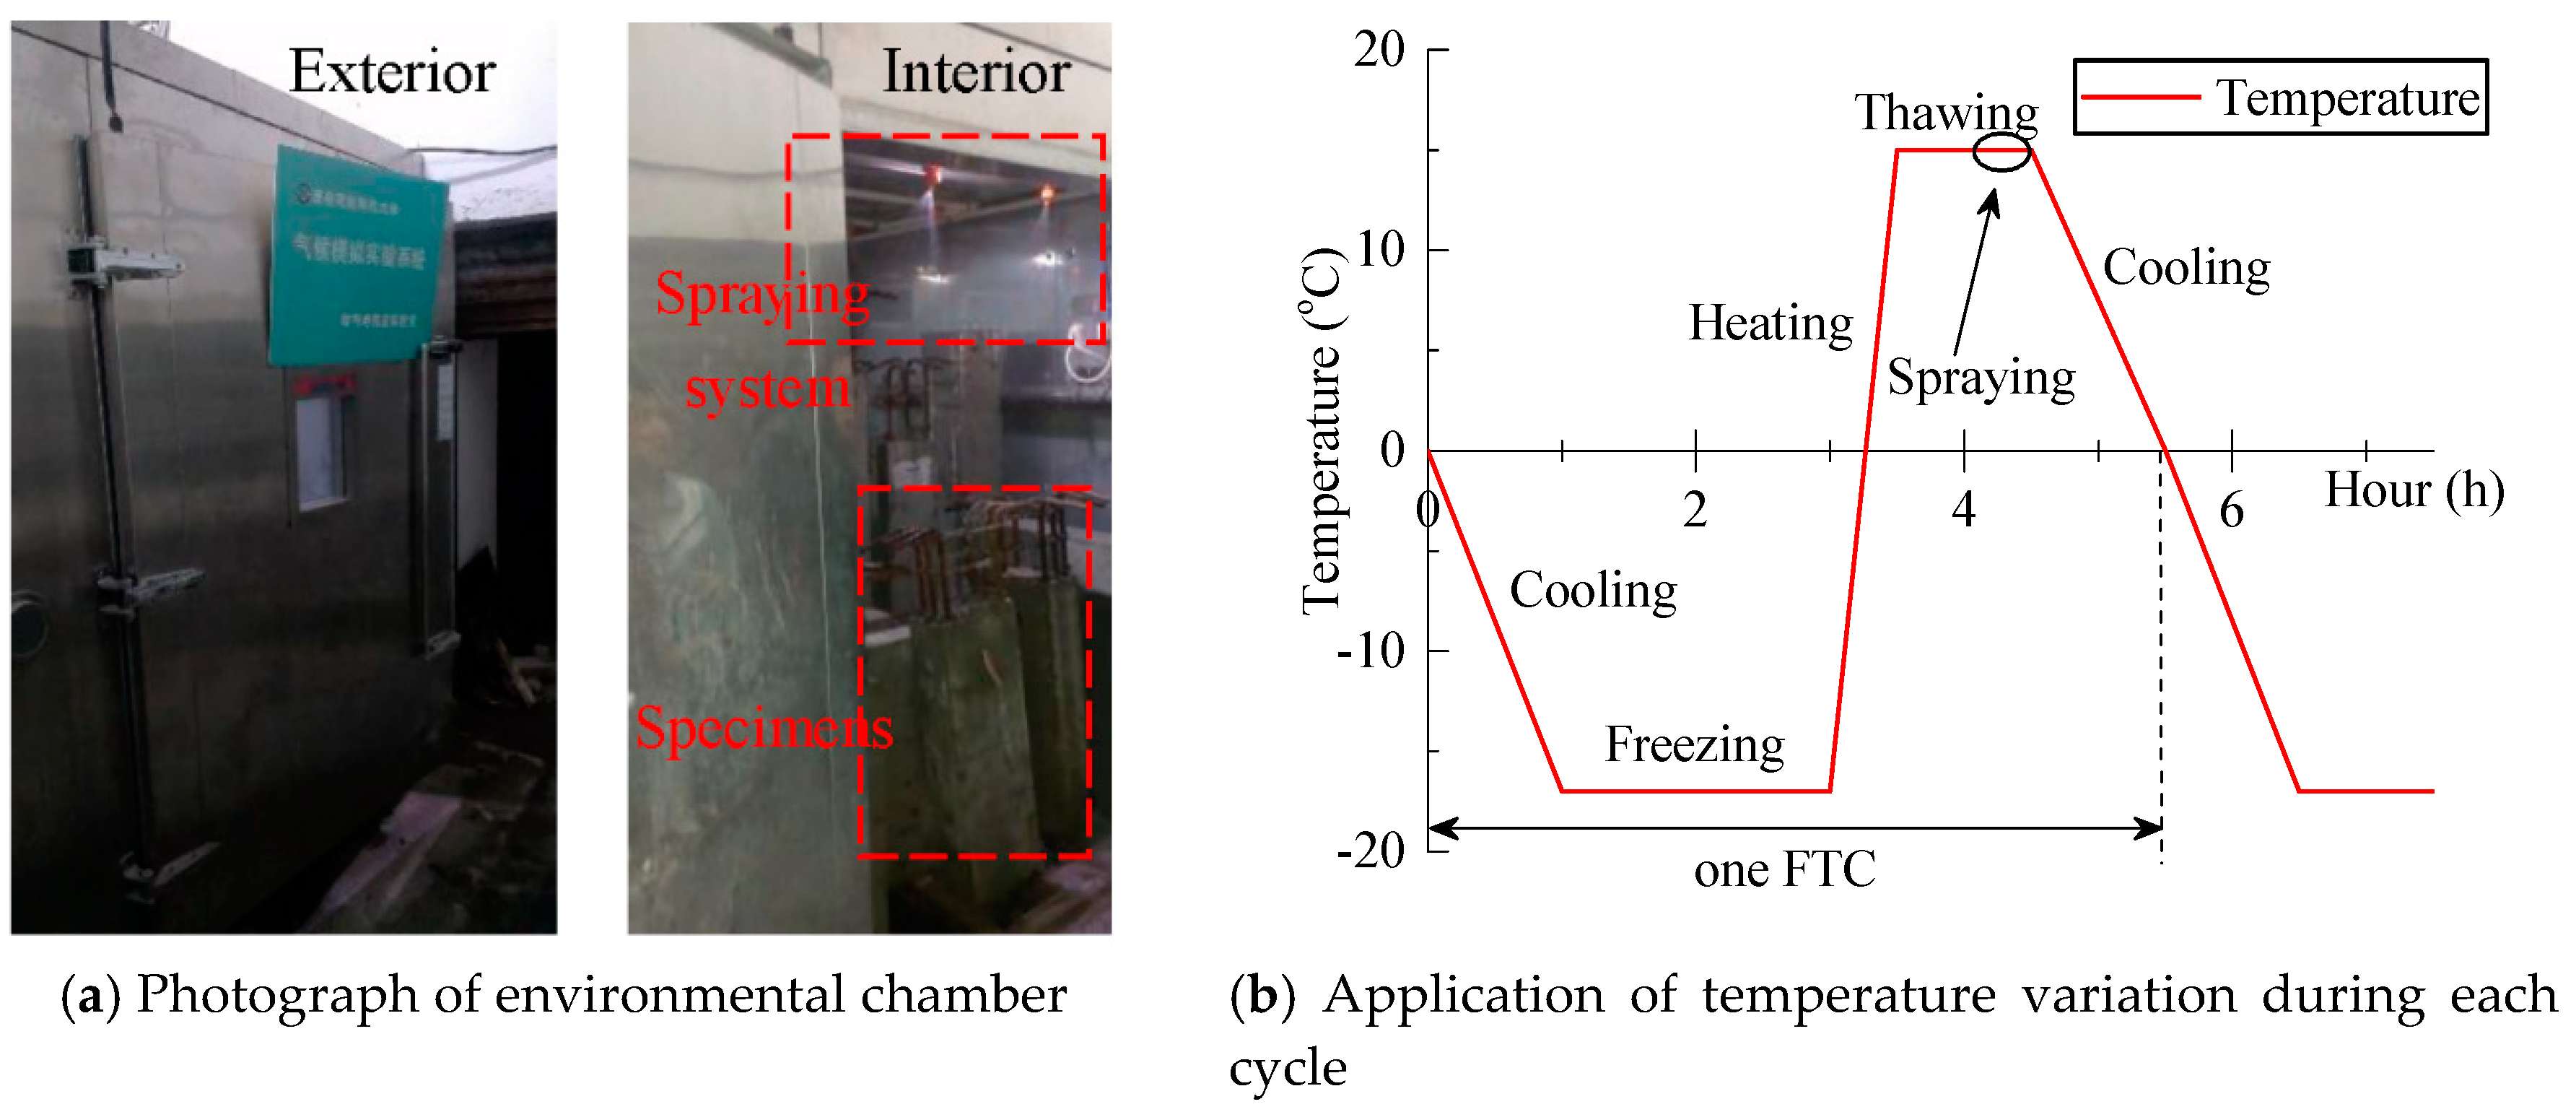
2.2. Details of FTCs

Figure 2 shows the details of the ZHT/W2300 model environmental chamber, which was used for durability testing at the component level. The freeze–thaw condition was simulated through variation in temperature and humidity cycles, with pre-set parameters in the chamber according to Chinese standards [27]. To be specific, the minimum temperature was –17 °C and the cooling phrase lasted for one hour. Then, the freezing phrase lasted for two hours and was followed by a 1.5 hour heating phase. The maximum temperature was 15 °C and it was maintained for 45 minutes. Before the next cooling stage, there was a water spraying procedure for 15 minutes. At the end of the cycle, the temperature was reduced to 0 °C in one hour. All these steps constituted one freeze–thaw cycle, as illustrated in Figure 2b. The humidity range was kept at 90%~98% RH. The specimens were separately subjected to 100 and 200 FTCs as shown in Table 1.
The tested columns, as well as the concrete cubes (with the side length of 150 mm), were cast and cured for 28 days in a natural environment and then placed in 15–20 °C water for a week before placement in the environmental chamber. The columns were cast without foundation blocks at this stage because of the limited dimensions of the environmental chamber and then recast with base anchorage blocks after the freeze–thaw exposure.

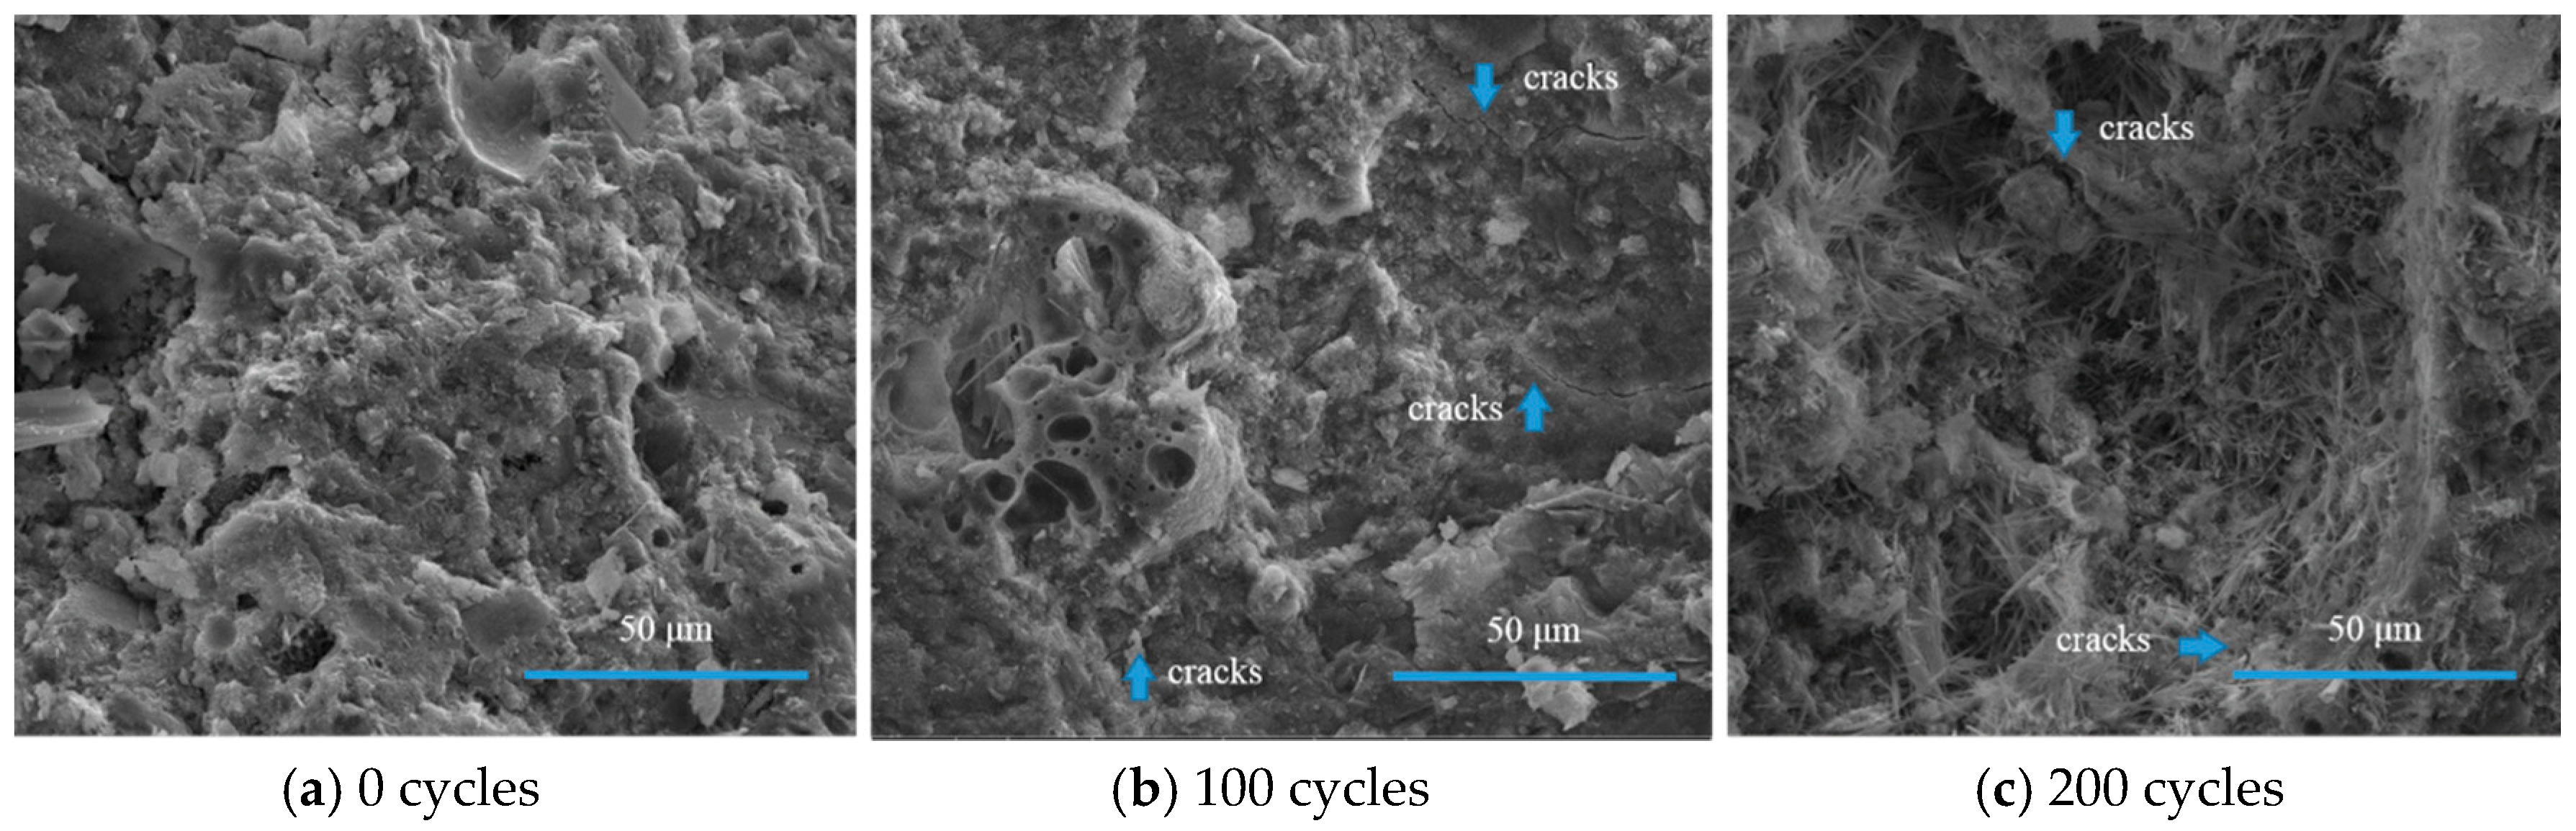
2.3. Material Properties

The mechanical properties of steel were tested. The yield strength and ultimate strength of the longitudinal bar were 366 MPa and 514 MPa, respectively. The elastic modulus of the longitudinal bar (Es) was 2.0 × 10⁵ MPa. As for the transverse bar, the corresponding yield strength, ultimate strength, and elastic modulus were 303 MPa, 470 MPa, and 2.1 × 10⁵ MPa, respectively.
Table 2 shows the detailed mixture of concrete composition for columns. The ordinary Portland cement, with a 28 day nominal compressive strength of 42.5 MPa, was used in this research. The air-entraining agent was not included. The standard compression test [28] for reference concrete cubes with a side length of 150 mm was carried out after subjecting every 50 numbers of freeze–thaw cycles. Each set has three cubes for obtaining the average strength. The mean cube concrete strength values fcu are reported in Table 2 and were converted to the cylinders strength fc by the empirical formula [25].
Since the freeze–thaw condition described in this paper is rather different from the ones described in the commonly adopted standards, including ASTM 666 [29] and RILEM TC176-IDC [30], the microstructure of concrete under varying FTCs was also investigated using a scanning electron microscope (SEM) after compressive tests. The images of the SEM tests are shown in Figure 3. We observed that the cement hydration products of undamaged concrete have high density and is tightly connected. After 100 FTCs, the pore structure was partially destroyed, and microcracks appeared mainly due to the periodic pressure induced by water freezing and thawing. Then, the cement hydration products became loose, and the C-S-H gel changed from a whole part into acicular island structures, which were intertwined to form a three-dimensional network as a result of 200 FTCs. In addition, the complete pore structure disappeared.

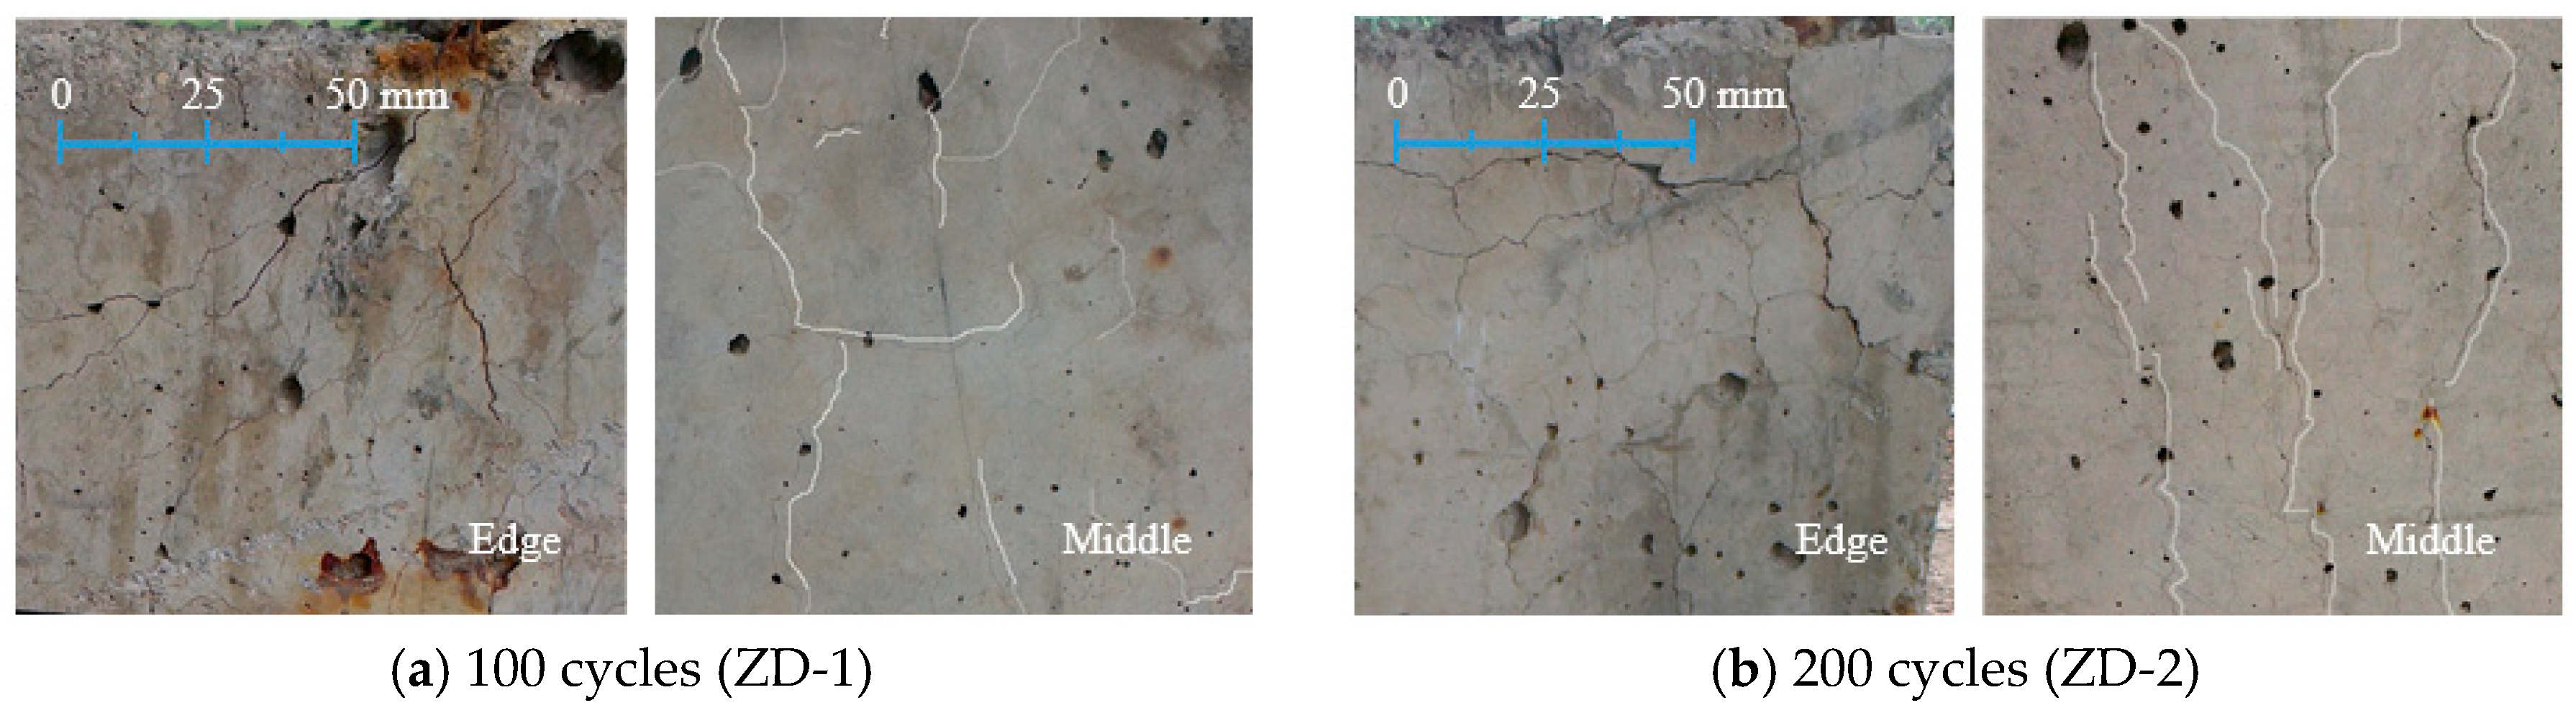
2.4. Crack Patterns of Specimens after FTCs

From an internal perspective, the damage process of concrete through a freeze–thaw attack is that the structure of its hydration product gradually becomes loose, accompanied by microcracks that develop from the cement paste. From an external perspective, cracks distribute on the surface of the concrete specimens, and spalling of concrete, known as surface scaling, happens when using saline water as a thawing agent. Since tap water was used as the thawing agent in this experiment, the phenomenon of surface scaling was not severe. Moreover, it was reported that the concrete strength was not affected by the surface scaling effect [31,32]. Figure 4 shows the surface of specimens at the edge and in the middle, separately, under different numbers of FTCs before cyclic loading. The location is marked in Figure 5 with a dashed line. We observed that as the number of FTCs increased, the specimen surface was no longer smooth, and as the number of cracks increased, their width began to widen and their length elongated. At the edge of the columns, the cracks distributed in a network, while in the middle of the bottom, the cracks mostly developed lengthwise. After undergoing 200 FTCs, the specimen exterior was so crisp that the fine aggregates were revealed at the bottom and at the top. In addition, the damage at the end of the column was often more severe than in the middle because both the column ends were subjected to freeze–thaw penetration from three dimensions, while the middle of the column was subjected from two dimensions.

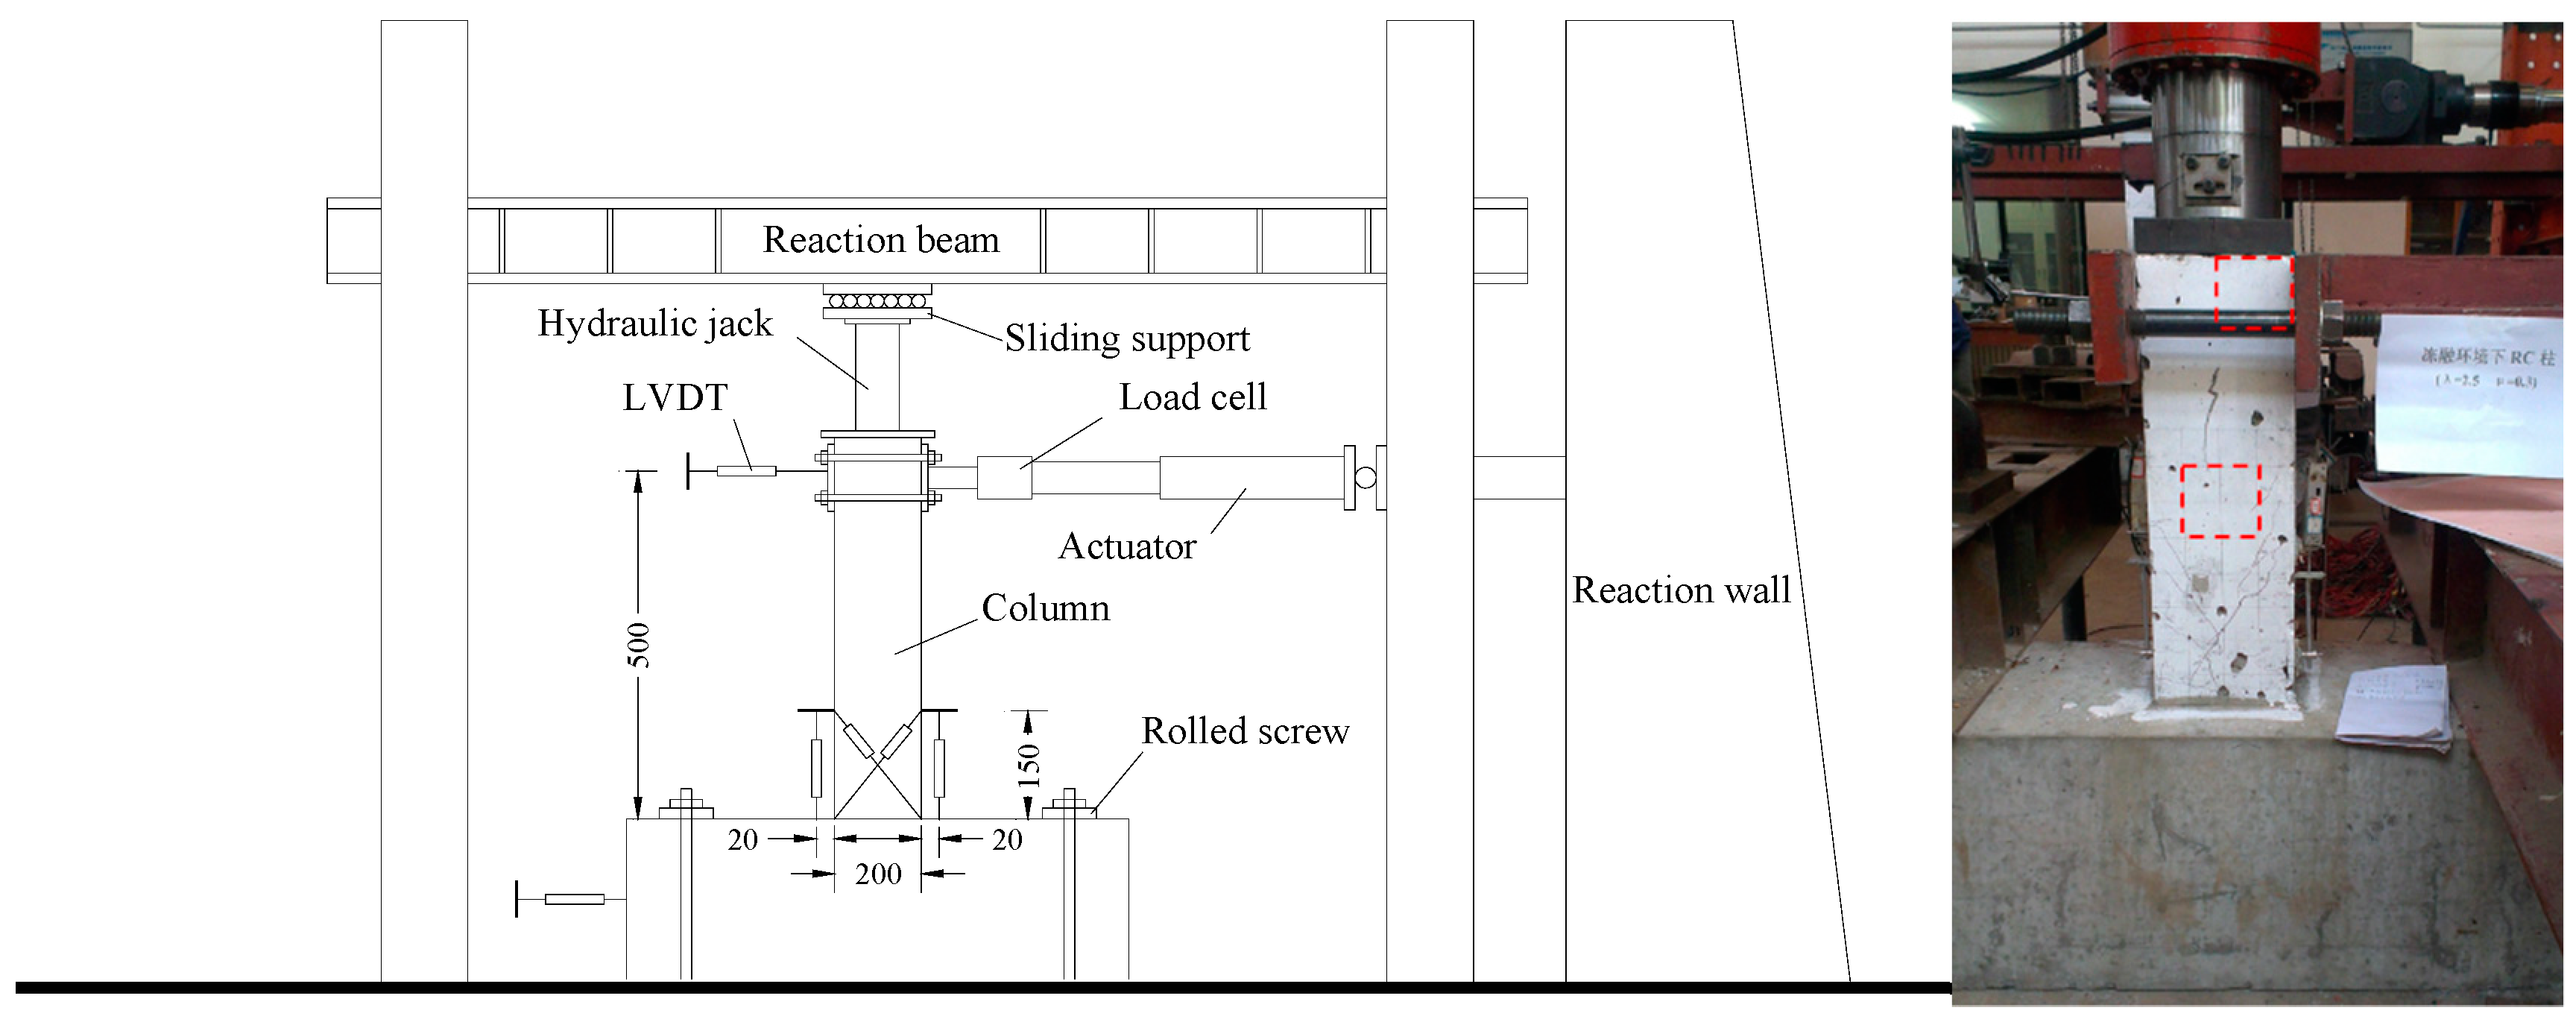
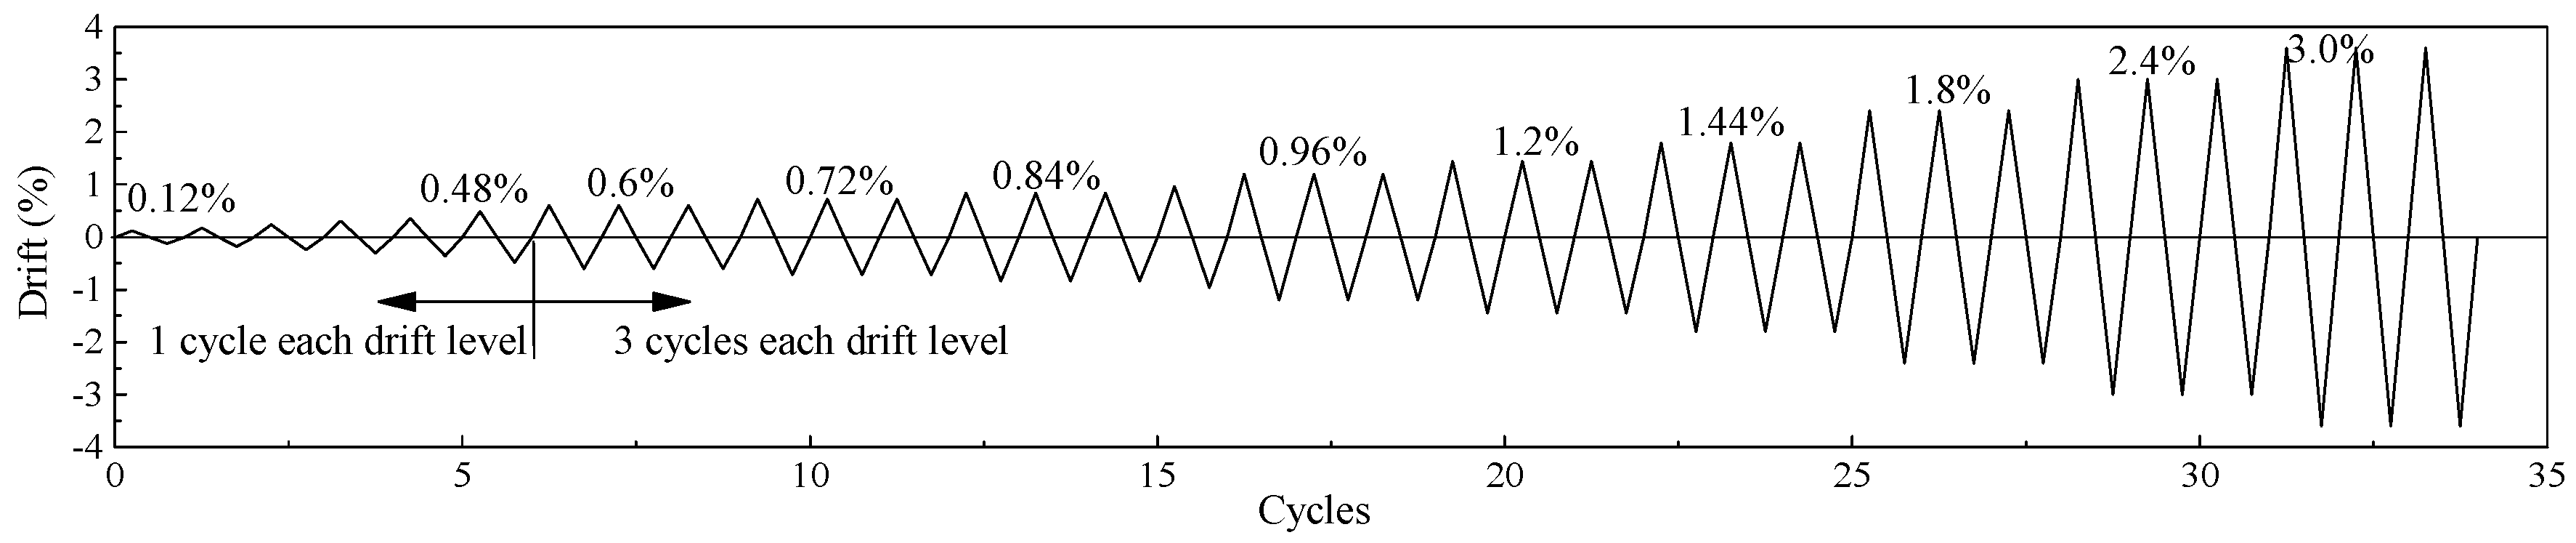
2.5. Pseudo-Static Test Setup and Loading Procedure

The cantilever test setup is shown in Figure 5. The column was mounted vertically with the bottom of the RC foundation which was restrained to the strong floor. Two linear variable displacement transducers (LVDTs) were installed separately at the loading point and at the centerline of the foundation to monitor the lateral displacement and the slip of the foundation. Two additional pairs of LVDTs were used for measuring shear displacements and rotations at the plastic region where the length was evaluated as 150 mm [33].
All columns were tested under the combined axial load and cyclic lateral loads. The axial load was applied via a hydraulic jack before the horizontal one and kept constant throughout the testing process. The horizontal cyclic action was controlled by a 500 kN MTS hydraulic actuator, which was 100 mm away from the top face of the specimen to ensure shear span ratio equal to 2.5. Since the yielding point during the loading process could be unclear if the columns showed shear behavior, the specimens were tested under the same predefined displacement control, as shown in Figure 6. The displacement was represented by the drift ratio which was defined as the lateral displacement divided by the column height. When the peak drift was smaller than 0.48%, the cyclic loads were applied once. After that, each drift level was repeated three times to evaluate the in-cycle strength and stiffness degradation.

3. Test Results and Analysis

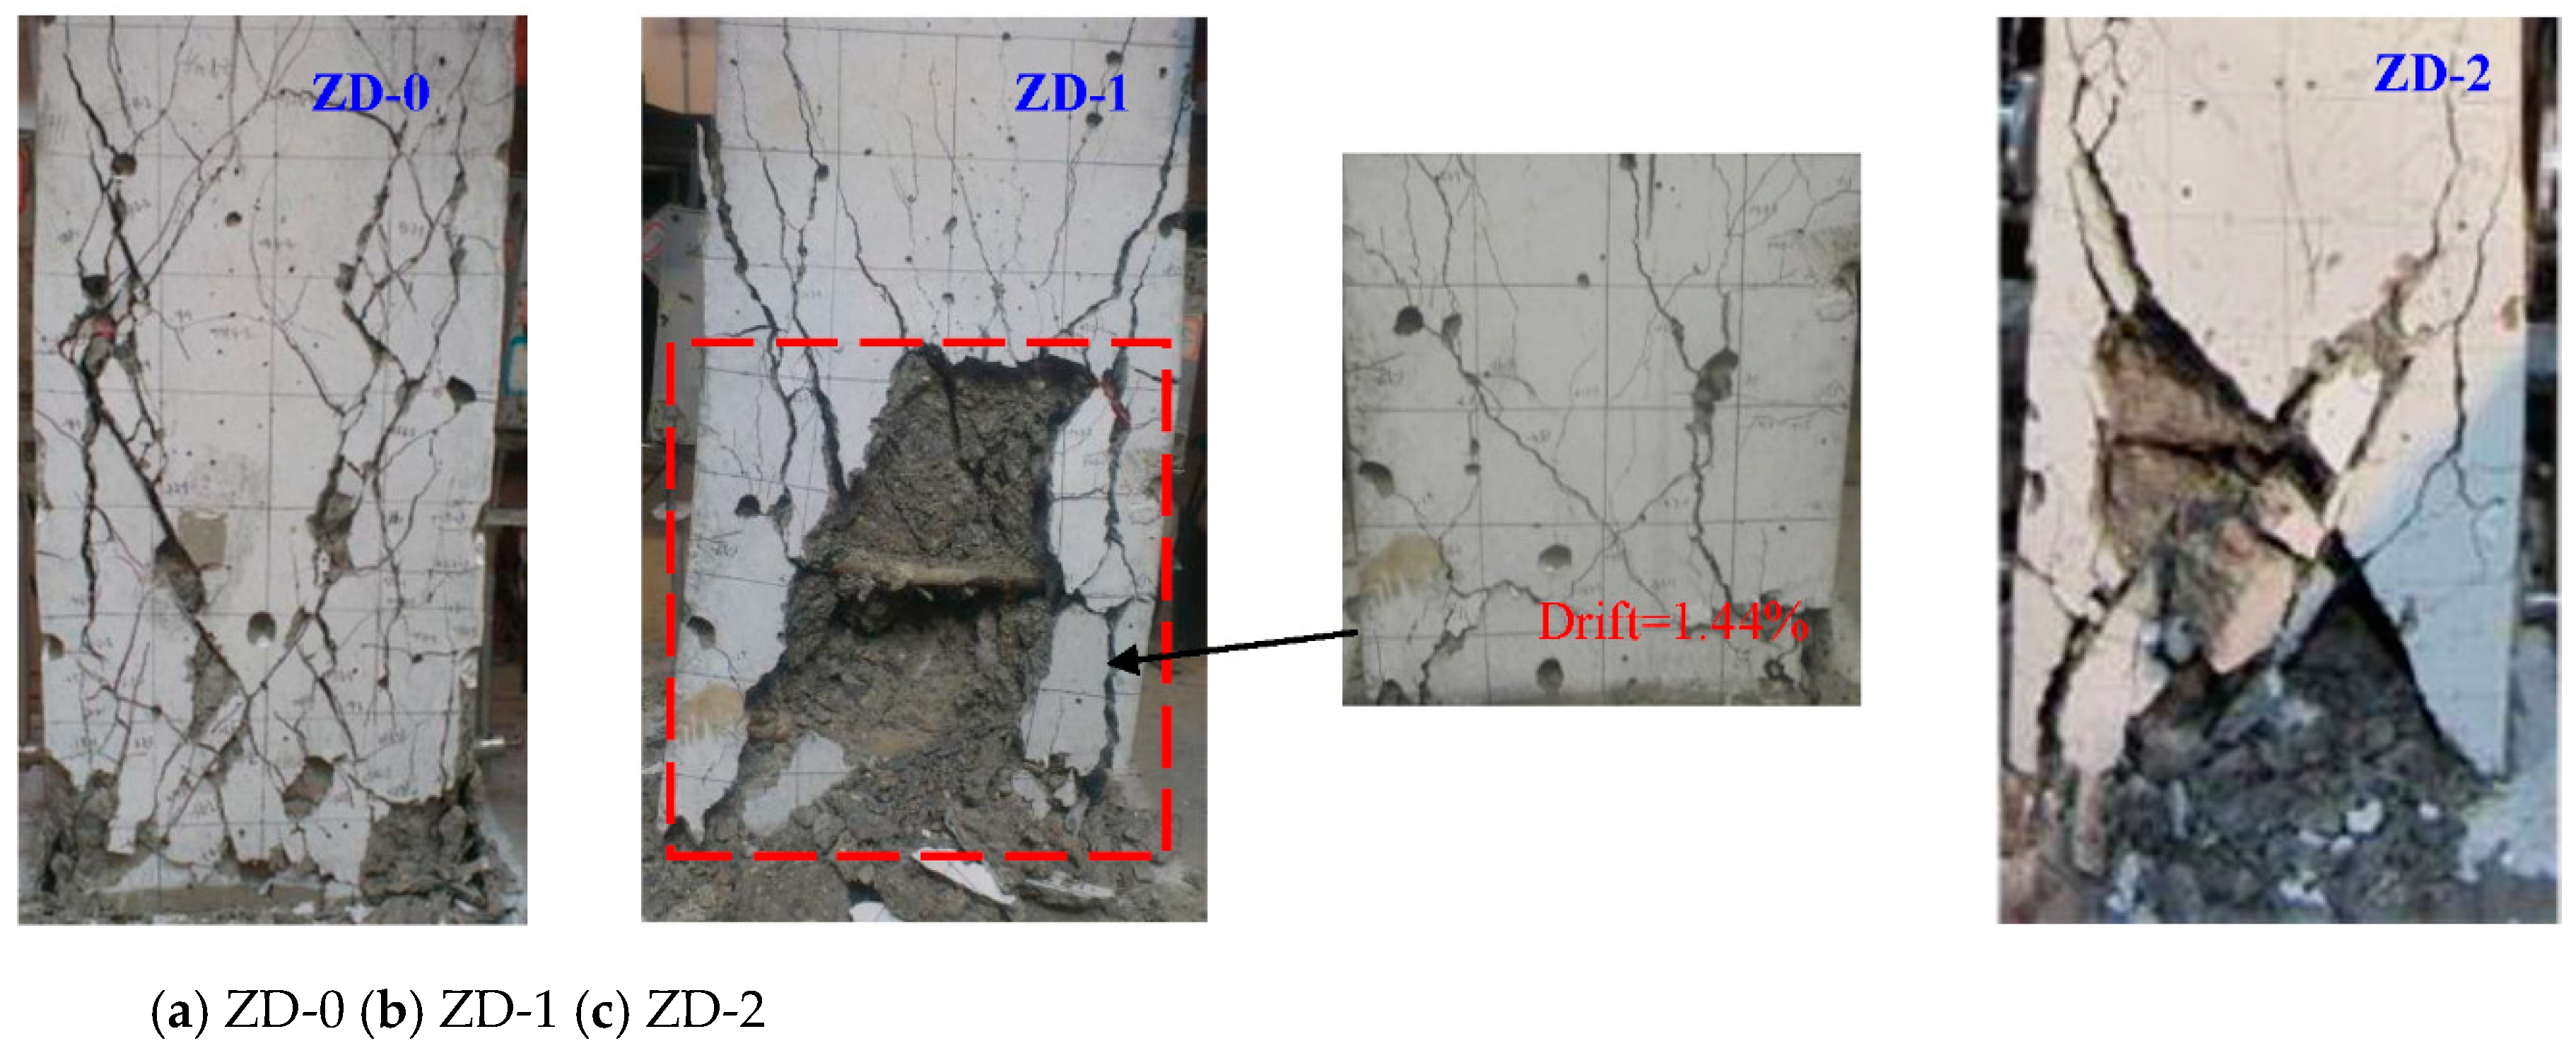
3.1. Damage Process and Failure Pattern

Figure 7 shows the observed failure pattern of the three columns at the end of each testing. Although all of the columns exhibited flexural yielding followed by shear failure, the increment of freeze–thaw damage shifted the specimen response from flexure-dominated to shear-dominated failure.
For the control specimen ZD-0, the horizontal cracks with a length of 20 mm to 50 mm began at the bottom of the column when loaded to a drift of 0.3%. As the drift level increased, the number of horizontal cracks, as well as the length of the cracks, increased. Then, the longitudinal bar yielded and shortly after that horizontal cracks developed obliquely with an angle of 60°. A few inclined cracks were concentrated and intersected each other in the column end. When the applied lateral load reached the maximum, vertical cracks appeared in the compressive zone at the bottom corner of the column, and concrete crushed slightly at the bottom corners, i.e., the column was entering the failure stage. After that, the lateral load declined gradually. Steeply inclined cracks initiated at the upper portion of the column. With the continuing reversed drift, new cracks ceased to appear while previously formed inclined cracks widened and some of them propagated along the column height. At the same time, the lateral load declined gradually. Finally, a small portion of cover concrete spalling along the diagonal compression strut and well-developed inclined cracks indicated the failure of the tested column, as shown in Figure 7. The whole damage process was characterized as a typical flexure-shear failure.
Compared with the sound specimen ZD-0, there are some differences in the damage process of the specimens subjected to FTCs. For the specimen ZD-1, both the distribution of initial cracks and the sequence of cracks’ appearance were similar to the specimen ZD-0 until the vertical cracks appeared a little earlier at a drift amplitude of 1.44%. Then, flaking of concrete cover happened in the bottom region and in the vicinity of the crossed cracks. When the test was terminated, the core concrete crushed and the spalling region was relatively large. The reason behind these changes could be related to the effect of FTCs on the concrete material. As previously shown in Figure 3, micro cracks happened in the interface of the concrete after certain numbers of FTCs, resulting in a floccule-like appearance, and consequently, the freeze–thaw damaged concrete became loose.
For the specimen ZD-2, lengthwise visible cracks were detected at the early stage of the loading due to the combination of initial flaws induced by increasing FTCs and reversed loading action. Considering the freeze–thaw process, the expanded volume of water to ice placed constant stress inside the concrete body, which caused the initiation and propagation of inner creep cracks as illustrated before. The initial horizontal cracking, located at the column end, occurred at a lower force than the other two specimens since the freeze–thaw attack led to apparent decay in concrete tensile stress. The distribution of the bending cracks was parallel to the undamaged specimen. However, two diagonal cracks formed through the entire height of the column when the imposed drift value was 0.84%. Significantly, one of the cracks widened rapidly, indicating shear failure. The maximum width of the diagonal cracks was up to 2.5 mm before the column reached the peak load. After that, the lateral resistance dropped, evidently with the continued cycling, more than the other two specimens. The phenomenon of continued spalling of the cover concrete occured at the onset of the second cycle at the applied drift of 1.44%, and covered a large portion of the specimen surface at the failure stage, which was similar to specimen ZD-1.

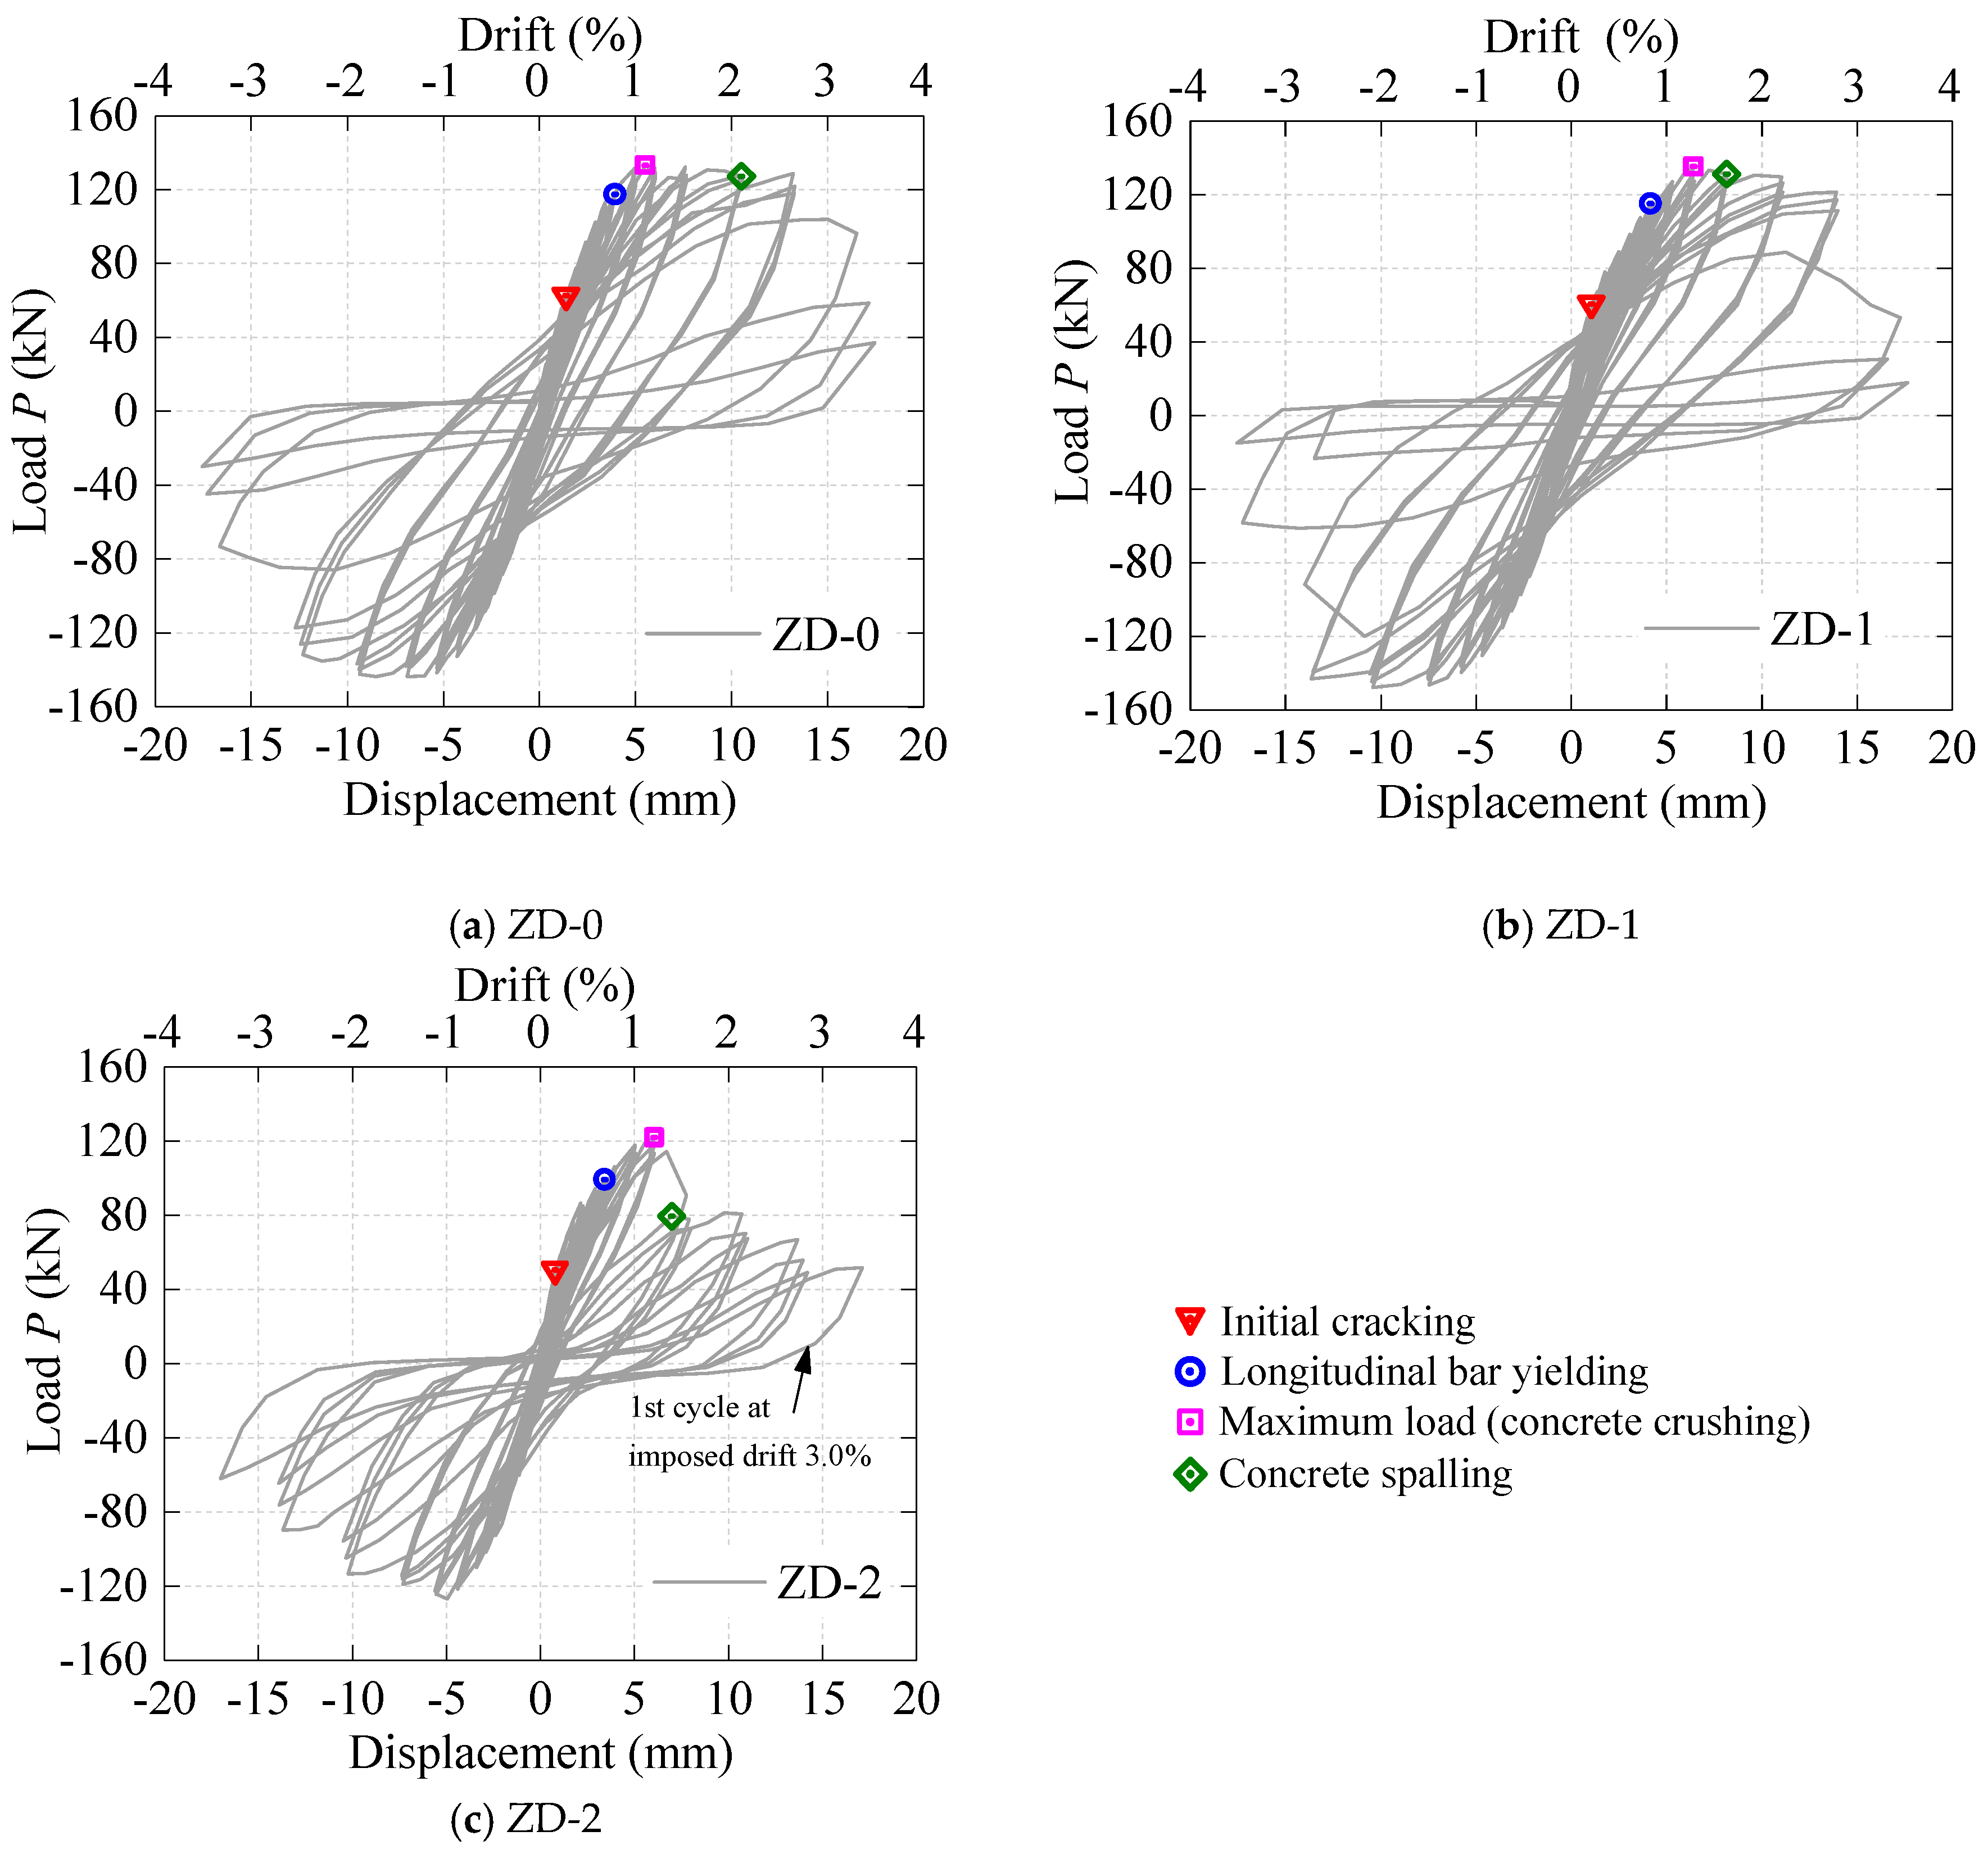
3.2. Hysteretic Behavior

The measured hysteretic loops of all specimens are shown in Figure 8. The initial cracking, longitudinal bars yielding, maximum load, and concrete spalling of each column are also indicated in Figure 8. We note that the specimen ZD-2 was not tested until the final predefined cycles due to its severe deterioration in strength.
For the case of the undamaged column, it is observed that the load-displacement relationship was almost a straight line before its yielding, and there was no stiffness degradation that appeared at this stage. Following this, both the reloading stiffness and unloading stiffness of the specimens decreased gradually. The area of hysteretic loops became larger. As soon as the peak value was achieved, with the continuous increasing of the horizontal displacement on the column top, the degradation of both the reloading and unloading stiffness became more evident. The residual deformation after unloading increased and the hysteretic loops were still shuttle like, which indicated that the specimens still owned good energy dissipation capacity. When the lateral load began to drop significantly, the hysteretic loop was no longer plump and its shape gradually changed to a lying “Z” due to the development of inclined cracks.
However, the influence of freeze–thaw action on the hysteresis loops is obvious. Among them, specimens ZD-1 and ZD-0 exhibited stable and similar hysteretic behaviors, while specimen ZD-2 presented a totally different one. The applied load dropped suddenly after reaching the maximum load for specimen ZD-2 which indicates the loss of the lateral load carrying capacity. The rate of this strength decay in the post-peak portion seems to increase as the numbers of FTCs increase. Moreover, as the FTCs increase, the hysteresis loops narrows, and the pinching effect appears at a lower displacement level and becomes more significant at the same displacement level, especially when FTCs is 200. Experiments conducted by [8,10,34] show that the bond between concrete and reinforced steel reduces quickly as frost damage rises. Consequently, this effect accompanied with concrete cracking causes a prominent pinching effect, which means that a lower energy dissipation capacity has to be attributed to freeze–thaw damaged members.

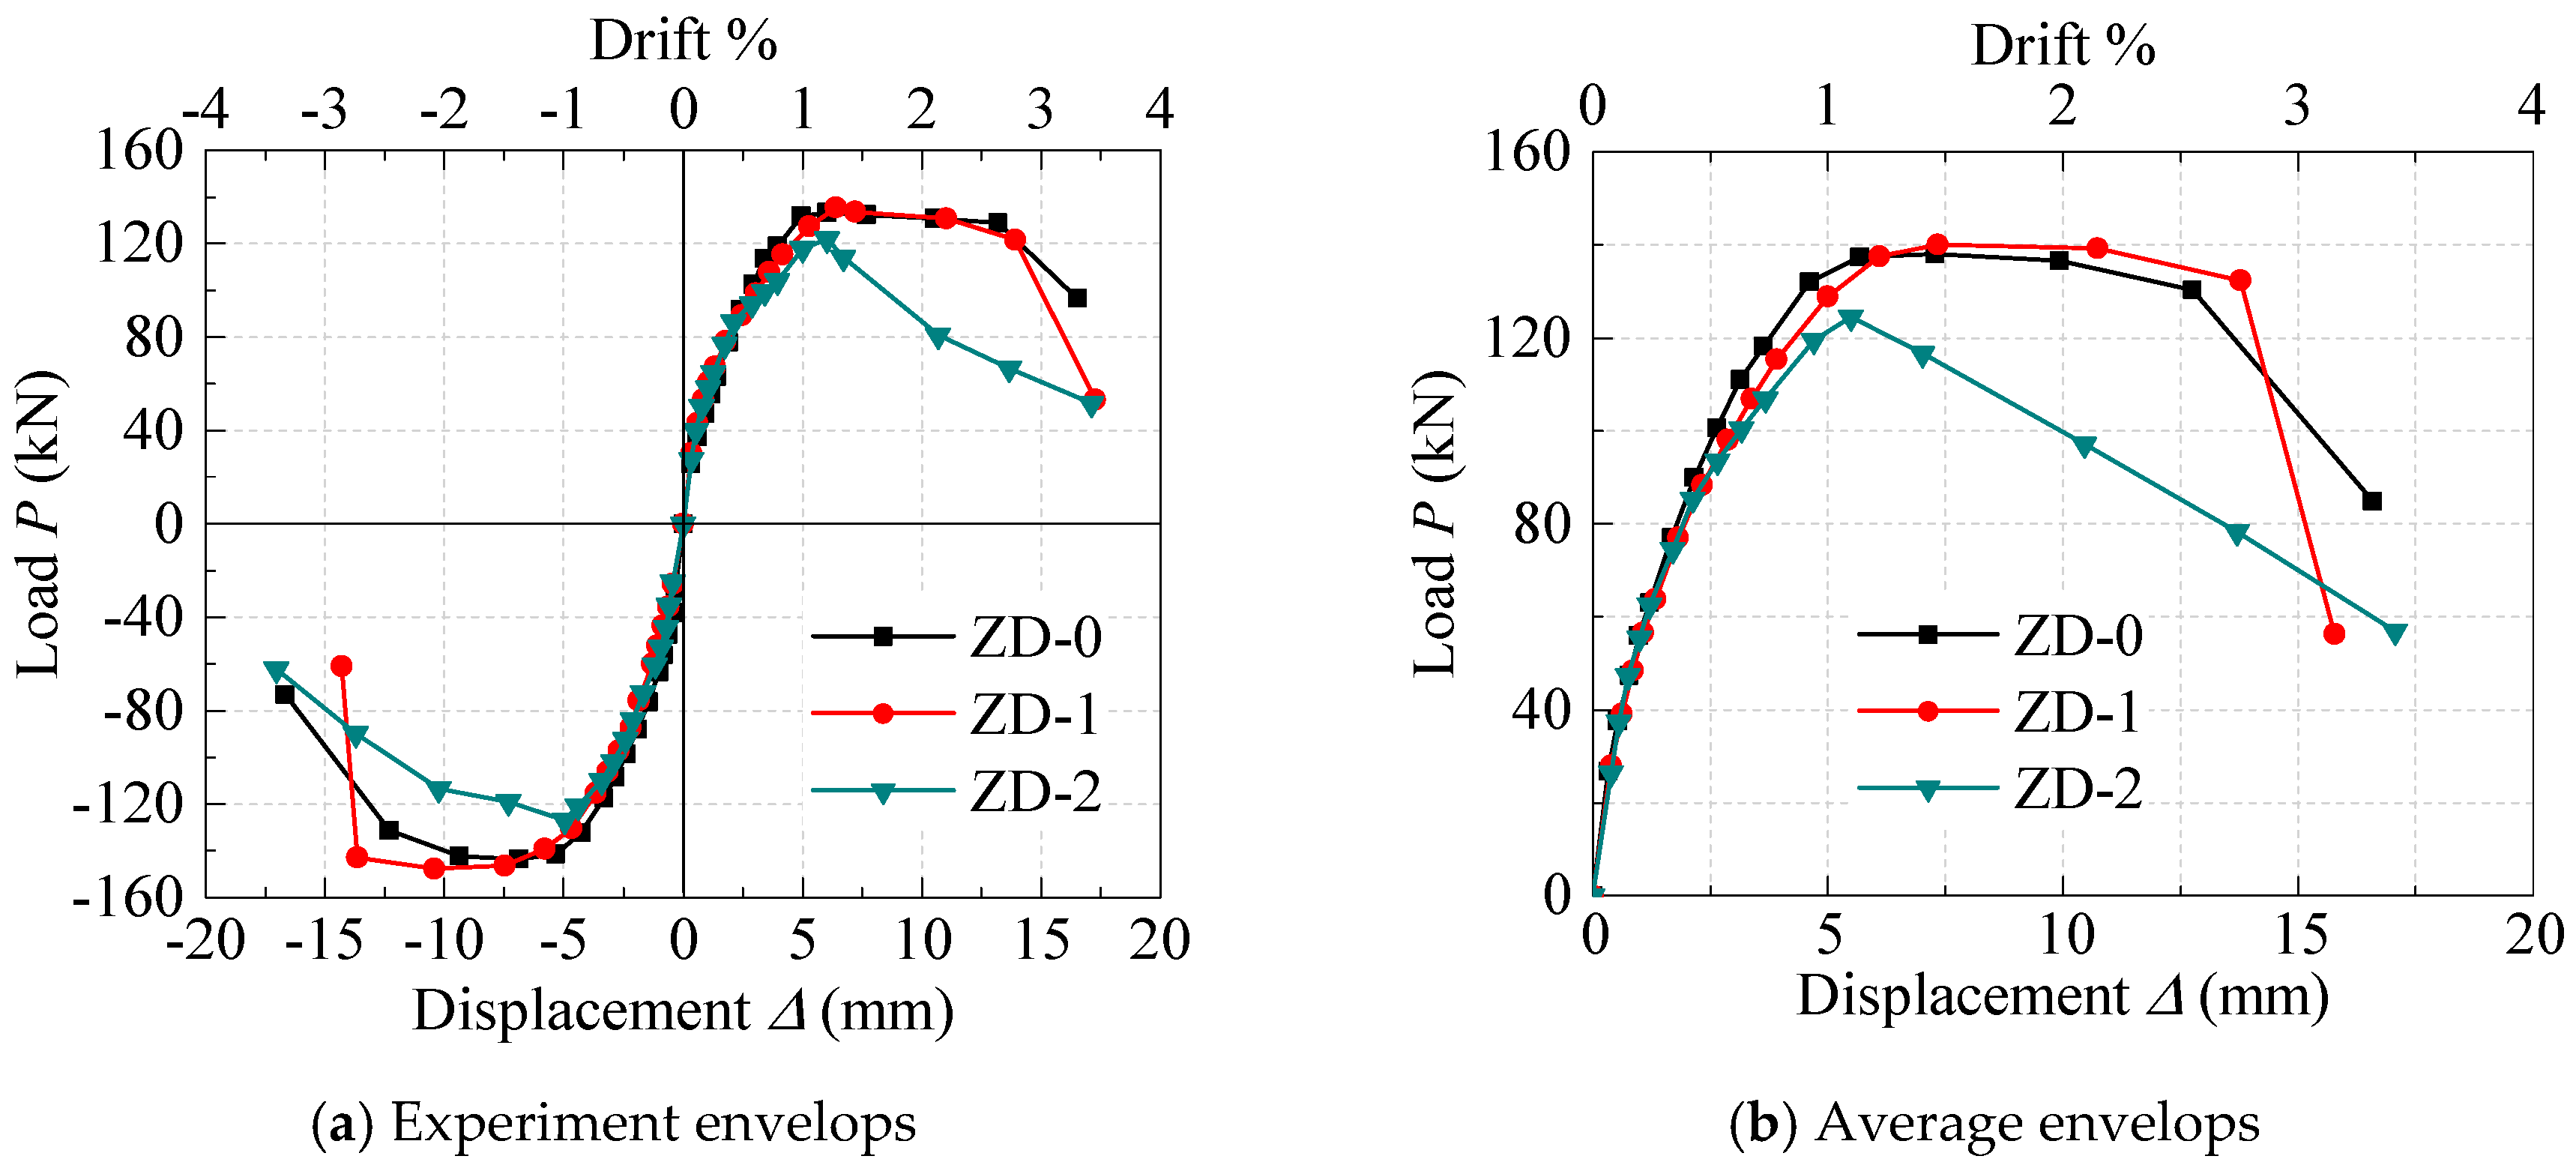
3.3. Skeleton Curves and Characteristic Values

Figure 9 presents the envelope responses of the specimens and the average responses due to the asymmetry of the hysteresis behaviors in the two loading directions. To quantify the influence of freeze–thaw damage, important characteristic values of the specimens are listed in Table 3 and defined as follows: Fy and Δy denote yield force and drift, respectively, calculated through the equivalent energy method [35]; Δu denotes ultimate drift, defined when the applied load declines more than 15% from the peak load (Fp); Δp is the corresponding drift value of Fp; μΔ denotes the displacement ductility coefficient, defined by the ratio of Δu and Δy; θp (equals ΔuΔy) denotes the plastic rotation of columns.
As shown in Figure 9, the skeleton curves were almost overlapped when the drift was less than 0.5%, which means the initial stiffness did not degrade even though the elasticity modulus of concrete decreased due to the freeze–thaw action as stated by Duan et al. [9]. This is possible because the axial load ratio (ν = N/fcAg) actually increased with the decrease of concrete strength after FTCs and constant axial force. However, the differences in the skeleton curves became more obvious in the post-peak portion as the numbers of FTCs increased. To be specific, the descending branch became steeper for the most damaged column ZD-2, indicating a more severe strength decay.
On the other hand, compared with the control specimen ZD-0, the yield load decreased and the maximum load increased slightly for the specimen with 100 FTCs, ZD-1, as presented in Table 3. All drifts at critical levels increased while the ductility reduced. There are two reasons that could explain the increment in component strength despite the freeze–thaw damage. First, considering the whole test procedure, the specimen ZD-1 was submerged in water before undergoing the freeze–thaw attack, which would help the concrete strength growth of the whole section. Secondly, the freeze–thaw damage penetrated from the component surface to the core, and therefore for a specimen subjected to FTCs, the damage degrees for inner concrete and outer concrete were not the same. Therefore, the deterioration of concrete strength would be more severe for a smaller scale of section size.
After 200 FTCs, all the characteristic values listed in Table 3 decreased as compared with the specimen ZD-0. Among them, the measured yield and peak load decreased by 11.8% and 9.8%, respectively, and corresponding drifts decreased by 4.8% and 24.5%. Apparently, this pattern did not agree with the trend exhibited when the number of FTCs was only 100. To explain this inconsistency, the bearing capacities of columns, basically determined by the comparison of flexure strength and shear strength, should be analyzed first. Since the freeze–thaw attack mainly affects the strength of concrete, the decay of shear strength would be greater than flexure strength for a column member because of the different contributions of concrete strength to the total bearing capacities. Figure 10 shows the strength of tested columns calculated using Equations (1) and (2) on the basis of tested material properties (Table 2). It is noted that a discrepancy occurs when calculating the column strength without considering the non-uniform distribution of freeze–thaw damage on the concrete strength. Figure 10 is only used for the preliminary estimation. The ratios of shear resistance of the concrete contribution to that of the tie contribution for specimens ZD-0, ZD-1, and ZD-2 were 2.58, 2.34, and 1.96, respectively. Although the column was designed with a slightly larger shear strength than flexure strength, as shown in Figure 10, the freeze–thaw action caused the shear strength to drop more rapidly, resulting in a shift from flexure failure to shear failure. Therefore, the load carrying capacities reduced when the number of FTCs was 200. This was also consistent with the observed transition in failure patterns of all the tested columns and significant decreasing ductility factor.

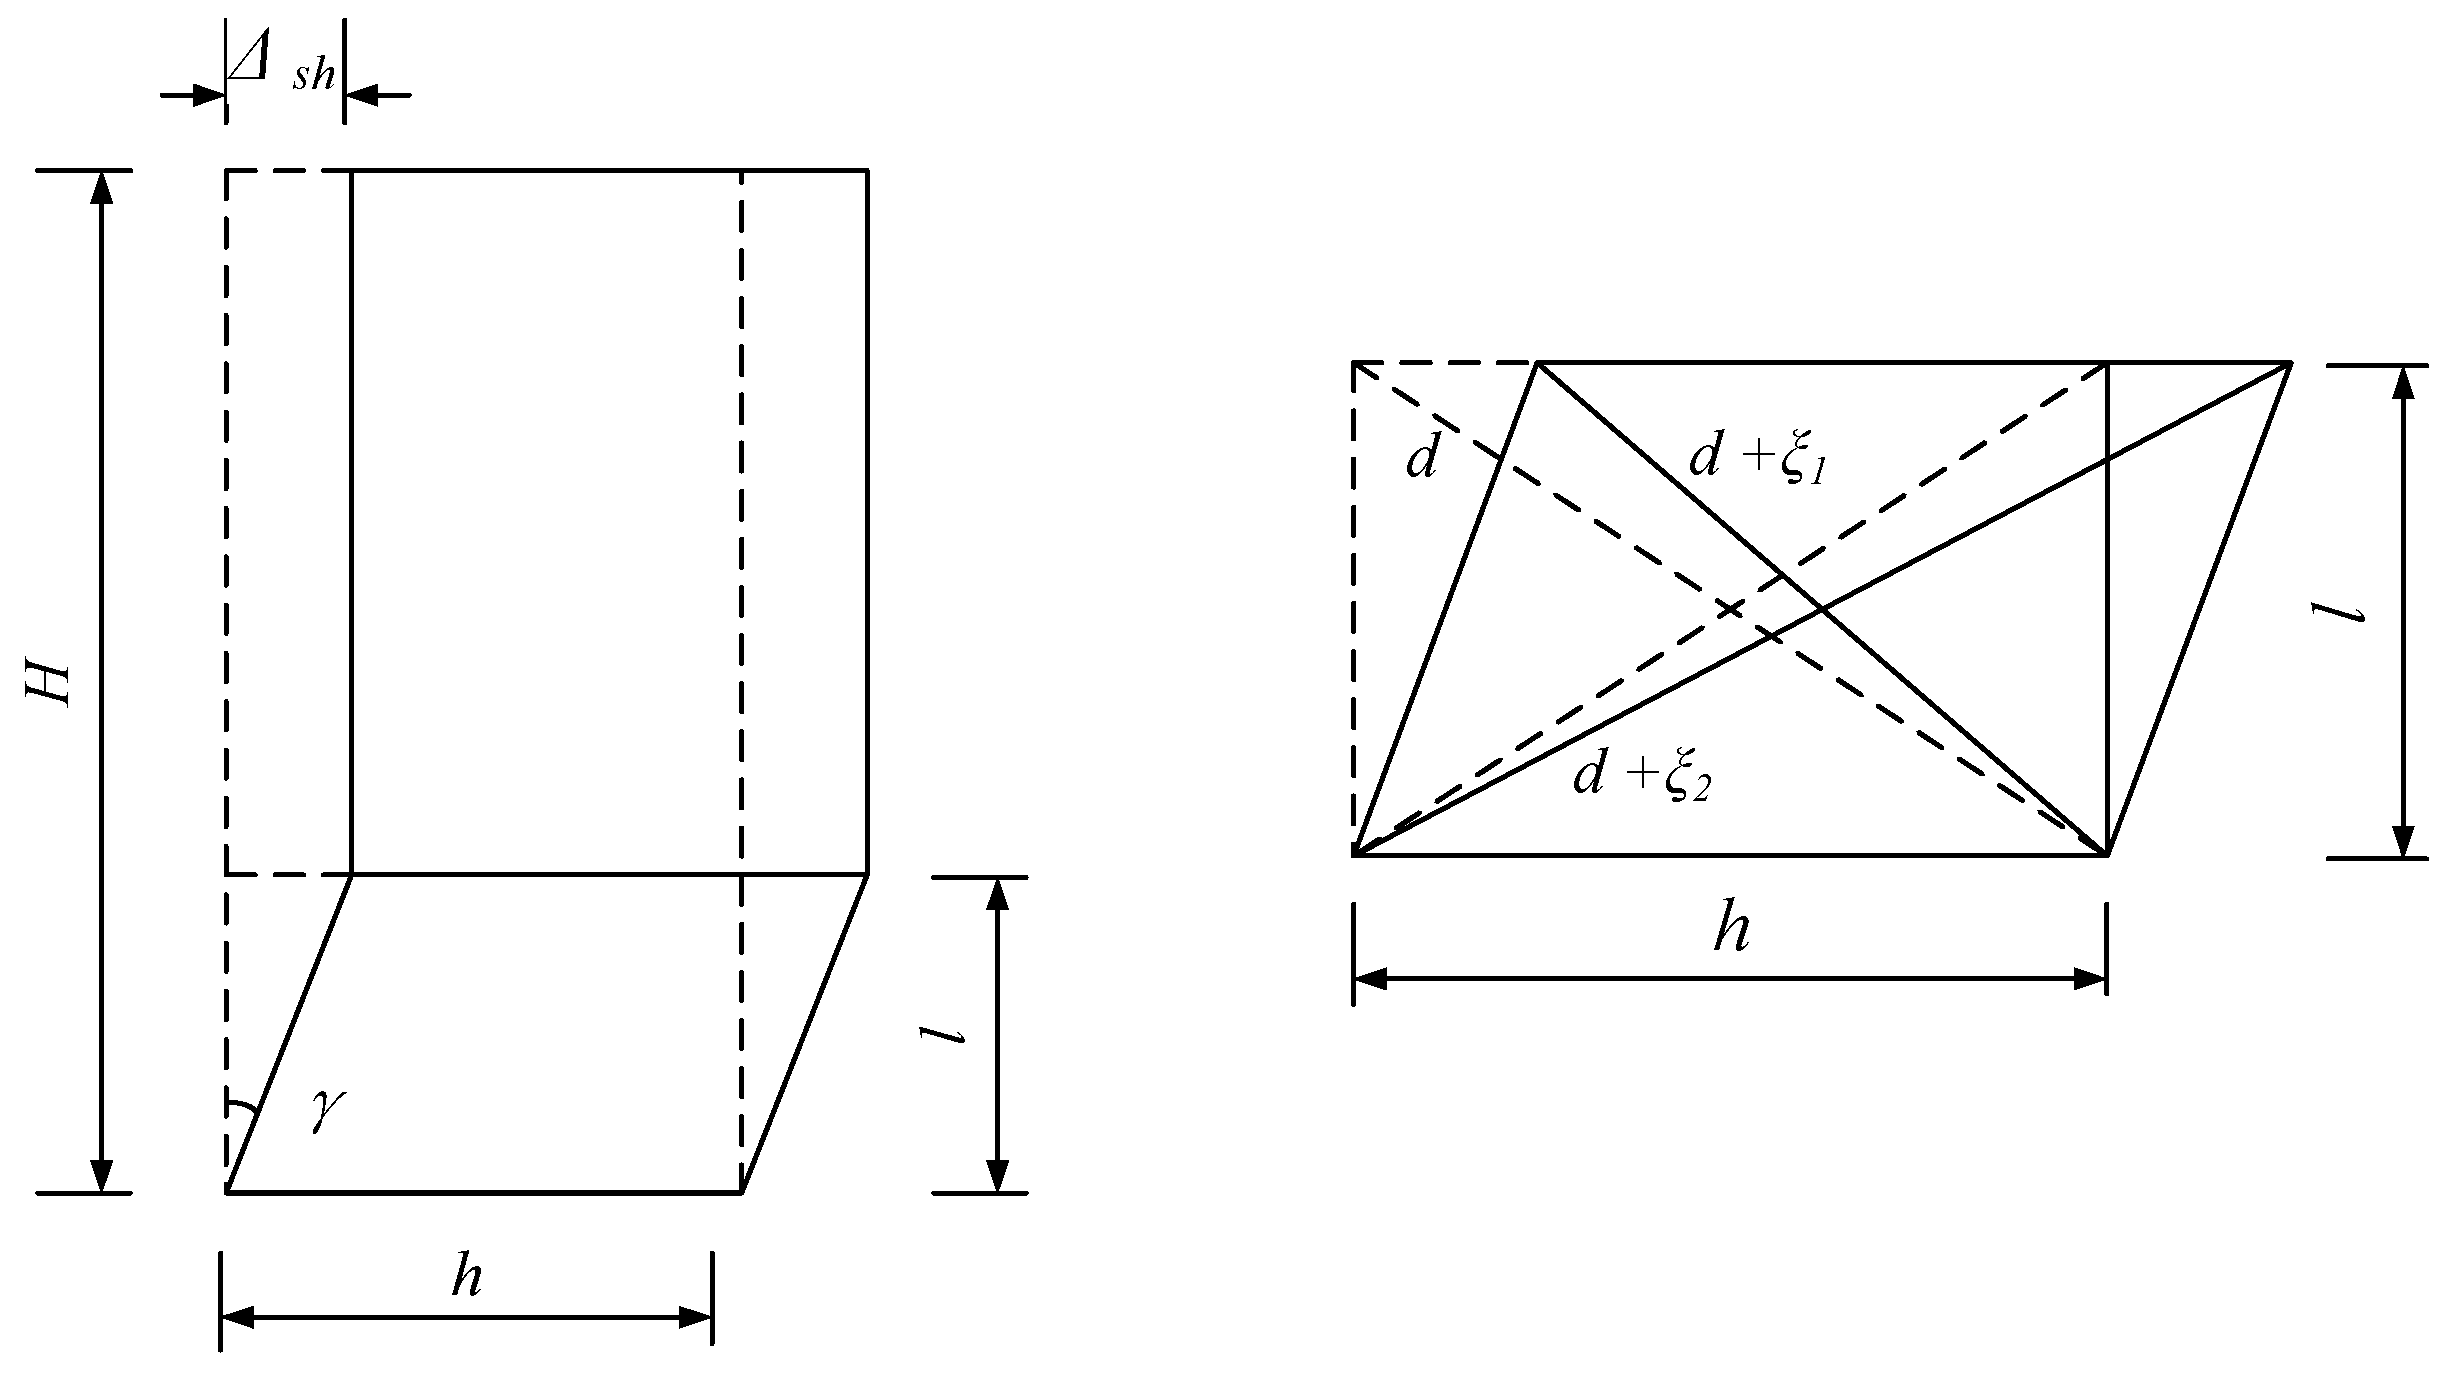
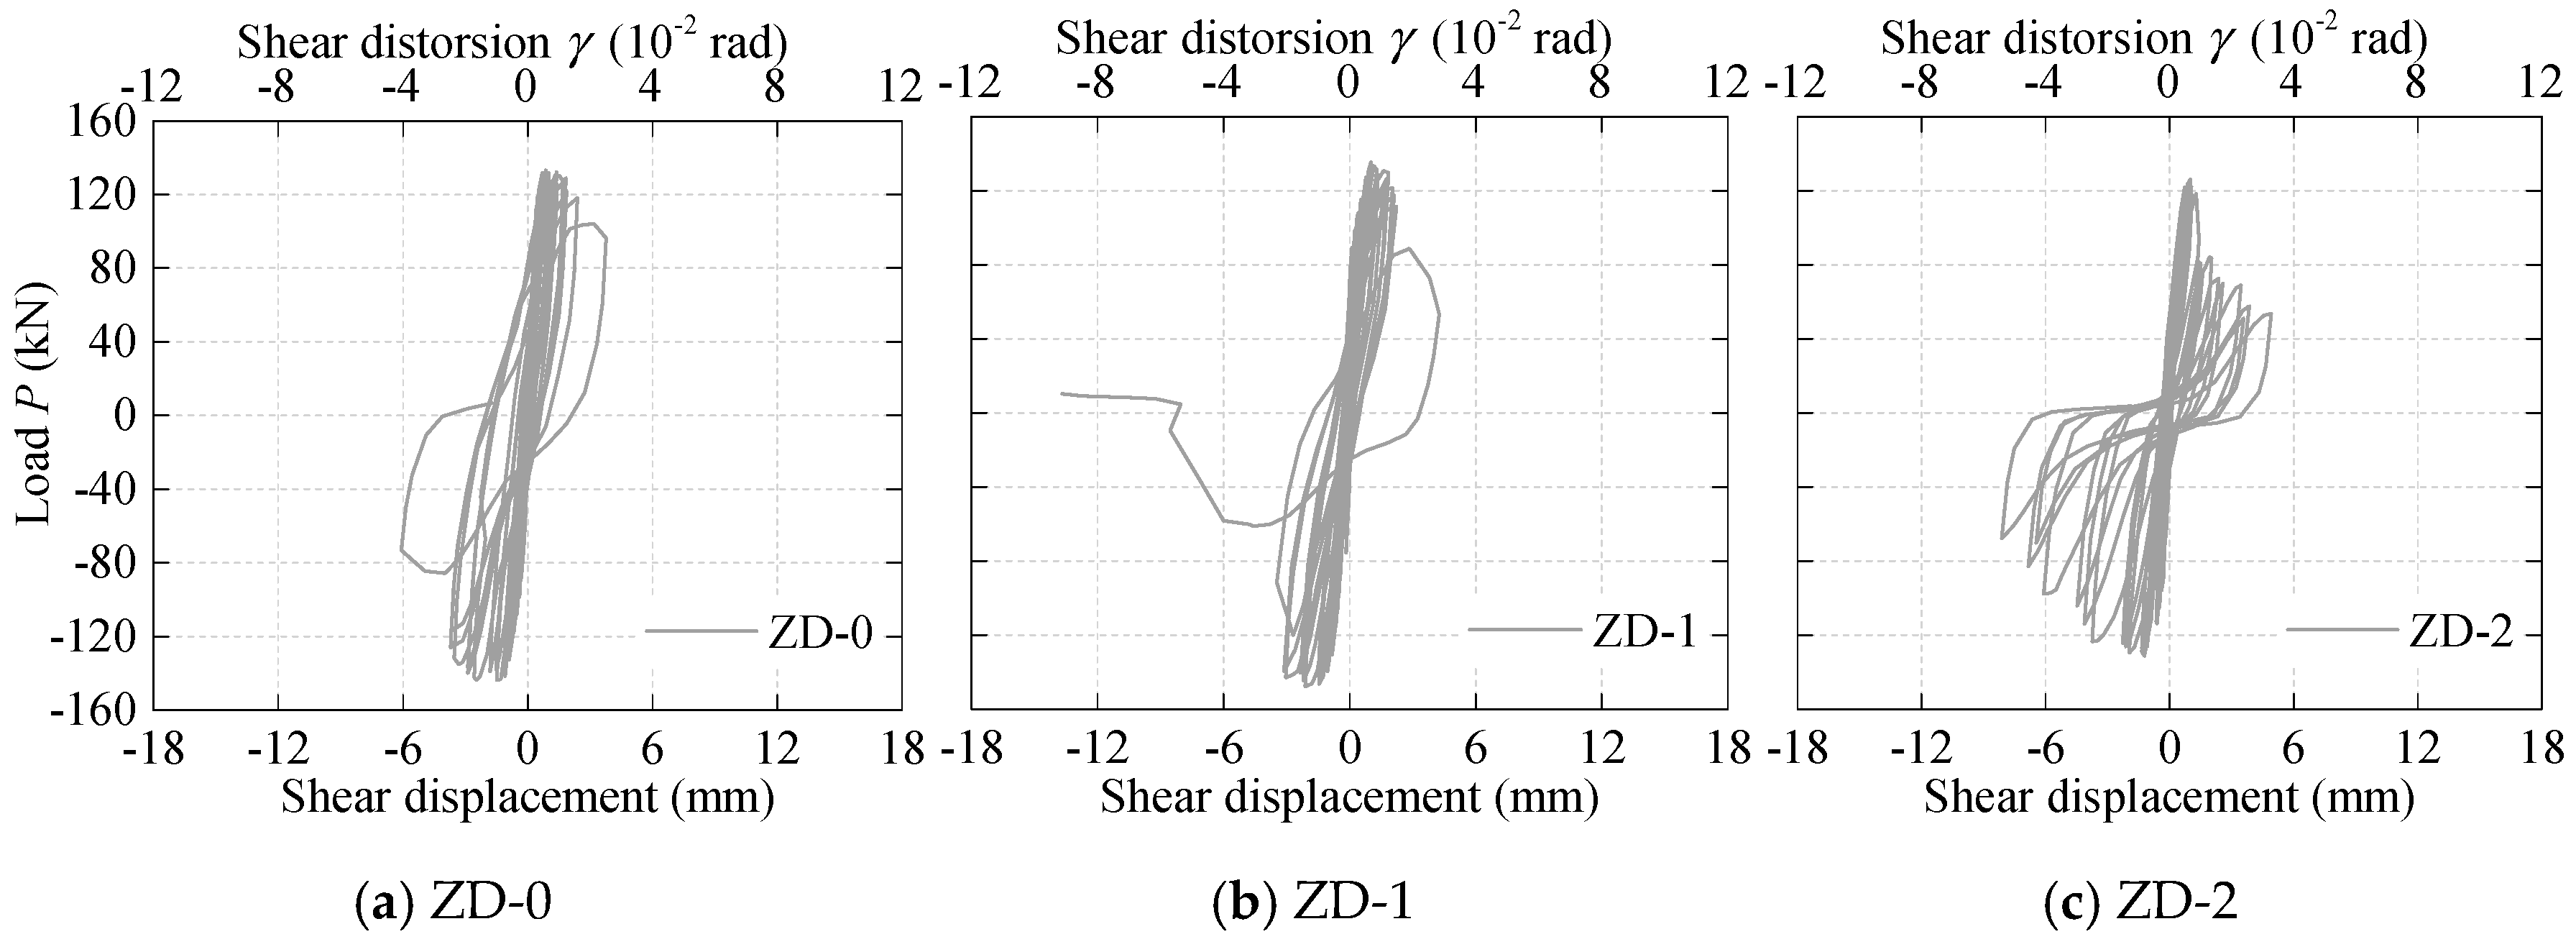
3.4. Shear Deformation

In general, the lateral deformation of the tested columns is comprised of three components, i.e., flexure, longitudinal bar slip, and shear deformation. In this experiment, the development of inclined cracks was altered with increasing FTCs, and accordingly, the shear response was focused and its contributions to the total deformation were analyzed. It is assumed that the shear deformation is mainly concentrated at the plastic hinge region as shown in Figure 11. According to the data from the instruments attached to the tested columns, the shear distortion γ at the plastic region is estimated by the following equation:
γ = Δ s h / l = 1 2 [ ( d + ξ 1 ) 2 l 2 ( d + ξ 2 ) 2 l 2 ]
where, Δsh is the shear displacement at the plastic region; ξ1 and ξ2 are the displacements measured from the diagonal LVDTs, as shown in Figure 5, respectively. Therefore, force-shear deformation responses at the plastic region were obtained and are presented in Figure 12. We note that the recording of shear displacements of specimens ZD-0 and ZD-1 terminated at the first cycle of 1.8% drift because of non-negligible measurement errors happened at the final stage.
It appears that the shear displacement history of specimen ZD-1 is close to that of specimen ZD-0 but different from specimen ZD-2. For the case of specimen ZD-2, a considerable increase of shear deformation in the post-peak portion was seen, particularly in the negative directions. This unevenly increased in two directions owing to the uneven widening of major inclined cracks in the two loading directions, which was also observed from the picture of failure patterns (see Figure 6). However, this asymmetry appears more gradually in column ZD-0 and ZD-1.
The contribution of the shear component to the total lateral displacement of all specimens was calculated at the critical levels including cracking, yielding, peak, and ultimate point, as illustrated in Figure 13. The results indicate that for all the tested columns, the shear contributions were relatively small in the elastic range, whereas this quantity increased significantly at the ultimate point, i.e., where the drift of shear strength degradation began to drop rapidly. The average growth rate was 2.3 times from the cracking to the ultimate state. Secondly, for columns with freeze–thaw damage (ZD-1 and ZD-2), the shear deformation always tended to occupy a larger proportion than that of the control column (ZD-0) at the listed critical points. Typically, for the most damaged specimen ZD-2, approximately 24% of the total deformation was due to shear at the defined ultimate displacement, while this quantity was only 17% for the undamaged specimen ZD-0. The interpretations for the large shear displacement of ZD-2 are summarized as follows: The tensile strength of concrete would also be reduced by the action of FTC as the compressive strength and even severely as quantified in several studies [10,34]. This reduction would cause the increase in length and width of the incline cracks during the cyclic tests, and decreasing in numbers, as shown in Figure 7. Therefore, the shear displacement appears to be larger.

3.5. Energy Dissipation and Damping Ratio

Dissipated energy, an important indicator for seismic performance, is calculated by integrating the areas enclosed by the hysteretic loops. Curves showing the energy dissipation of every loop and the cumulative one for columns subjected to different numbers of FTCs are provided in Figure 14a,b.
It was first observed that the difference between pristine column (ZD-0) and freeze–thawed column (ZD-1) was insignificant, and that the difference became prominent with a further increase of FTCs. When the imposed drift was larger than 2%, the rate of cumulative energy increasing of ZD-2 became slower than the other two since the loop energy dissipation began to drop at this drift level, as shown in Figure 14a. The reason for this is that the freeze–thaw attack changed the cracks evolution of the column, as highlighted earlier, which in turn led to less ductility and less area bounded by hysteretic loops. Secondly, the cumulative energy was 80.7%, 81.5% and 51.6% of the total energy at the ultimate limit state (Δu) for the three columns (ZD-0, ZD-1, and ZD-2) respectively.
In addition, equivalent viscous damping ratio ξ was also calculated using Equation (4) as the index to represent the dynamic response of the test columns.
ξ = 1 2 π S l o o p S 1 + S 2
where, Sloop is the area of the hysteresis loop, S1 and S2 are the corresponding elastic energy in two directions, respectively. The values of the equivalent viscous damping ratio at the yield load ξy, at the peak load ξp, and the ultimate load ξu are listed in Table 3. For all the tested specimens, the damping ratio increased from yielding to failure stage, which owns the progressively accumulative inelastic damage. The comparisons among them show that ξp and ξu decrease with the increasing freeze–thaw applications, while ξy was similar.

4. Conclusions

Three square-shaped short column specimens subjected to different numbers of FTCs have been tested under constant axial load and reversed lateral loads. The effect of freeze–thaw damage on the seismic performance of RC columns was investigated. The results of this research are summarized under the following conclusions.
(1) The increase in the number of FTCs finally changed the failure mode of the reinforced concrete columns tested in this experiment. The controlled column failed in the flexure dominated flexure-shear failure mode while the most freeze–thaw damaged column failed in the shear dominated column triggered by apparent shear strength degradation.
(2) Despite a slight increase of load carrying capacity observed in the column with 100 FTCs, a reduction of 9.8% of the maximum force was detected in the case of 200 FTCs.
(3) The ductility decreased, and the contribution of shear deformation to total lateral displacement increased obviously with the increasing of freeze–thaw duration, which was consistent with crack extensions and failure patterns exhibited during the loading procedure. In addition, the capacity of energy dissipation of the specimens remains almost unchanged and then decreases significantly as the number of FTCs increases.
This research lays the foundation for simulating and evaluating the seismic performance of existing structures undergoing freeze–thaw attacks. On the basis of the experimental results, there is a pernicious threat of the freeze–thaw environment to the behaviors of the components. Considering the fact that the number of specimens is small in this experiment, more column specimens should be tested to confirm and quantify the effects of FTCs on the load carrying capacities as well as deformation characteristics.

Author Contributions

Conceptualization, Y.Z. and S.Z.; specimen design and testing, Y.Z. and X.R.; data analysis, L.D and H.Z.; writing—original draft preparation, Y.Z.; writing—review and editing, Y.Z., P.P., and S.Z.

Funding

The authors are grateful for the financial support received from the National Nature Science Foundation of China (No.51678475) and the Research Fund of Shaanxi Province in China (2017ZDXM-SF-093).

Acknowledgments

The authors would like to thank the reviewers’ efforts in reading the manuscript.

Conflicts of Interest

The authors declare no conflict of interest.

References

  1. Sato, K.; Satow, K.; Yamaguchi, H.; Araki, N. A survey of frost damages on concrete structures and building in the northeastern part of China. J. Eng. Heilongjiang 1995, 3, 67–69. (In Chinese) [Google Scholar]
  2. Li, J.Y.; Xu, W.Y.; Cao, J.G.; Lin, L.; Guan, Y.S. Study on the mechanism of concrete destruction under frost action. J. Hydraul. Eng. 1999, 1, 41–49. (In Chinese) [Google Scholar]
  3. Powers, T.C. A working hypothesis for further studies of frost resistance. J. ACI 1945, 16, 245–272. [Google Scholar]
  4. Powers, T.C. The air requirement of frost-resistant concrete. Proc. Highw. Res. Board 1949, 29, 184–202. [Google Scholar]
  5. Scherer, G.W. Crystallization in pores. Cem. Concr. Res. 1999, 29, 1347–1358. [Google Scholar] [CrossRef]
  6. Shih, T.S.; Lee, G.C.; Chang, K.C. Effect of freezing cycles on bond strength of concrete. J. Struct. Eng. 1988, 114, 717–726. [Google Scholar] [CrossRef]
  7. Shang, H.S.; Song, Y.P. Experimental study of strength and deformation of plain concrete under biaxial compression after freezing and thawing cycles. Cem. Concr. Res. 2006, 36, 1857–1864. [Google Scholar] [CrossRef]
  8. Petersen, L.; Lohaus, L.; Polak, M.A. Influence of freezing-and-thawing damage on behavior of reinforcement concrete elements. ACI Mater. J. 2007, 4, 369–378. [Google Scholar]
  9. Duan, A.; Jin, W.; Qian, J. Effect of freeze–thaw cycles on the stress–strain curves of unconfined and confined concrete. Mater. Struct. 2011, 44, 1309–1324. [Google Scholar] [CrossRef]
  10. Hanjari, K.Z.; Utgenannt, P.; Lundgren, K. Experimental study of the material and bond properties of frost-damaged concrete. Cem. Concr. Res. 2011, 41, 244–254. [Google Scholar] [CrossRef] [Green Version]
  11. Suzuki, T.; Ogata, H.; Takada, R.; Aoki, M.; Ohtsu, M. Use of acoustic emission and X-ray computed tomography for damage evaluation of freeze–thawed concrete. Constr. Build. Mater. 2010, 24, 2347–2352. [Google Scholar] [CrossRef]
  12. Molero, M.; Aparicio, S.; Al-Assadi, G.; Casati, M.J.; Hernández, M.G.; Anaya, J.J. Evaluation of freeze–thaw damage in concrete by ultrasonic imaging. NDT E Int. 2012, 52, 86–94. [Google Scholar] [CrossRef]
  13. Ranz, J.; Aparicio, S.; Romero, H.; Casati, M.J.; Molero, M.; González, M.G. Monitoring of freeze–thaw cycles in concrete using embedded sensors and ultrasonic imaging. Sensors 2014, 14, 2280–2304. [Google Scholar] [CrossRef] [PubMed]
  14. Wang, Z.D.; Zeng, Q.; Wang, L.; Li, K.F.; Xu, S.L.; Yao, Y. Characterizing frost damages of concrete with flatbed scanner. Constr. Build. Mater. 2016, 102, 872–883. [Google Scholar] [CrossRef]
  15. Hayashida, H.; Sato, Y.; Ueda, T. Failure behavior of RC beams in relation to the extent and location of frost damage. In Proceedings of the 3rd International Conference on the Durability of Concrete Structures, Belfast, Northern Ireland, 17–19 September 2012; pp. 904–915. [Google Scholar]
  16. Yang, W.; Zheng, S.S.; Zhang, D.Y.; Sun, L.F.; Gan, C.L. Seismic behaviors of squat reinforced concrete shear walls under freeze-thaw cycles: A pilot experimental study. Eng. Struct. 2016, 124, 49–63. [Google Scholar] [CrossRef]
  17. Qin, Q.; Zheng, S.S.; Dong, L.G.; Hou, P.J.; Wang, F. Considering Shear Behavior of Beam-Column Connections to Assess the Seismic Performance of RC Frames Subjected to Freeze-Thaw Cycles. J. Earthq. Eng. 2019, 1–26. [Google Scholar] [CrossRef]
  18. Xu, S.H.; Li, A.B.; Ji, Z.Y.; Wang, Y. Seismic performance of reinforced concrete columns after freeze-thaw cycles. Constr. Build. Mater. 2016, 102, 861–871. [Google Scholar] [CrossRef]
  19. Qin, Q.; Zheng, S.; Li, L.; Dong, L.; Zhang, Y.; Ding, S. Experimental study and numerical simulation of seismic behavior for RC columns subjected to freeze-thaw cycles. Adv. Mater. Sci. Eng. 2017, 4, 1–13. [Google Scholar] [CrossRef]
  20. Liu, K.; Yan, J.; Zou, C. A pilot experimental study on seismic behavior of recycled aggregate concrete columns after freeze-thaw cycles. Constr. Build. Mater. 2018, 164, 497–507. [Google Scholar] [CrossRef]
  21. Sezen, H.; Elwood, K.J.; Whittaker, A.S.; Mosalam, K.M.; Wallace, J.W.; Stanton, J.F. Structural Engineering Reconnaissance of the August 17, 1999, Kocaeli (Izmit), Turkey, Earthquake. PEER Report 2000/09. 2000. Available online: peer.berkeley.edu/publications/peer_reports/reports_2000/0009.pdf (accessed on 30 December 2018).
  22. Anil, Ö. Strengthening of RC T-section beams with low strength concrete using CFRP composites subjected to cyclic load. Constr. Build. Mater. 2008, 22, 2355–2368. [Google Scholar] [CrossRef]
  23. Katakalos, K.; Manos, G.; Papakonstantinou, C. Seismic Retrofit of R/C T-Beams with Steel Fiber Polymers under Cyclic Loading Conditions. Buildings 2019, 9, 101. [Google Scholar] [CrossRef]
  24. Ma, G.; Li, H.; Hwang, H.J. Seismic behavior of low-corroded reinforced concrete short columns in an over 20-year building structure. Soil Dyn. Earthq. Eng. 2018, 106, 90–100. [Google Scholar] [CrossRef]
  25. Chinese national standard. Code for Design of Concrete Structures; GB 50010-2002; China Architecture and Building Press: Beijing, China, 2002. (In Chinese) [Google Scholar]
  26. American Society of Civil Engineering (ASCE). Seismic Evaluation and Retrofit of Existing Buildings; ASCE/SEI 41-13; ASCE: Reston, VA, USA, 2014. [Google Scholar]
  27. Chinese National Standard. Standard for Test Methods of Long-term Performance and Durability of Ordinary Concrete; GB/T50082-2009; China Architecture and Building Press: Beijing, China, 2009. (In Chinese) [Google Scholar]
  28. Chinese National Standard. Standard for Test Method of Concrete Structures; GB/T 50152-2012; China Architecture and Building Press: Beijing, China, 2012. (In Chinese) [Google Scholar]
  29. American Society for Testing and Materials (ASTM). Standard Test Method for Resistance of Concrete to Rapid Freezing and Thawing; ASTM C666/ C666M-15; ASTM International: West Conshohocken, PA, USA, 2015. [Google Scholar]
  30. Setzer, M.J.; Heine, P.; Kasparek, S.; Palecki, S.; Auberg, R.; Feldrappe, V.; Siebel, E. RILEM TC 176-IDC: Internal damage of concrete due to frost action: Final report. Mater. Struct. 2004, 37, 743–753. [Google Scholar] [CrossRef]
  31. Gudmundsson, G.; Wallevik, O. Concrete in an aggressive environment. In Proceeding of International RILEM Workshop on Frost Damage in Concrete, 28–30 June 1999. [Google Scholar]
  32. Fagerlund, G. A Service Life Model for Internal Frost Damage in Concrete; Report TVBM-3119; Lund Institute of Technology: Lund, Sweden, 2004. [Google Scholar]
  33. Paulay, T.; Priestley, M.N.J. Seismic Design of Reinforced Concrete and Masonry Buildings; John Wiley & Sons, Inc.: New York, NY, USA, 1992. [Google Scholar]
  34. Fagerlund, G.; Janz, M.; Johannesson, B. Effect of Frost Damage on the Bond Between Reinforcement and Concrete; Report TVBM-9016; Lund Institute of Technology: Lund, Sweden, 1994. [Google Scholar]
  35. Mahin, S.A.; Bertero, V.V. Problems in establishing and predicting ductility in aseismic design. In Proceedings of the International Symposium on Earthquake Structural Engineering, St. Louis, MO, USA, 19–21 August 1976; pp. 613–628. [Google Scholar]
Figure 1. Specimen dimensions and section details.
Applsci 09 02708 g001
Figure 2. Details of environmental chamber.
Applsci 09 02708 g002
Figure 3. SEM images of concrete specimens after different numbers of FTCs.
Applsci 09 02708 g003
Figure 4. Column surface after freeze–thaw applications.
Applsci 09 02708 g004
Figure 5. Test setup.
Applsci 09 02708 g005
Figure 6. Loading protocol.
Applsci 09 02708 g006
Figure 7. Failure status of specimens.
Applsci 09 02708 g007
Figure 8. Force-displacement responses.
Applsci 09 02708 g008
Figure 9. Envelops of the hysteresis loops.
Applsci 09 02708 g009
Figure 10. Theoretical strength of specimens under different numbers of FTCs.
Applsci 09 02708 g010
Figure 11. Calculation diagram of shear displacement.
Applsci 09 02708 g011
Figure 12. Measured lateral load versus shear distortion.
Applsci 09 02708 g012
Figure 13. Contribution of shear displacement components to total lateral displacement.
Applsci 09 02708 g013
Figure 14. Energy dissipation versus lateral displacement.
Applsci 09 02708 g014
Table 1. Design parameters of specimens.
SpecimenShear Span RatioConcrete Strength GradeAxial Force N (kN)ρvρlFTCs
ZD-02.5C503060.28%1.51%0
ZD-12.5C503060.28%1.51%100
ZD-22.5C503060.28%1.51%200
Note: ρv is the transverse reinforcement ratio and ρl is the longitudinal reinforcement ratio.
Table 2. Composition and strength of concrete (units: kg/m3 and MPa).
w/cWater (kg/m3)Cement (kg/m3)Sand (kg/m3)Stone (kg/m3)fcu,0 (MPa)fcu,50 (MPa)fcu,100 (MPa)fcu,150 (MPa)fcu,200 (MPa)
0.42203483688107656.754.351.4847.8543.15
Notes: fcu,i means the compressive strength of cubic concrete specimens after number i FTCs, where i = 0, 50, 100, 150, and 200.
Table 3. Force and deformation of the tested columns (units: % and kN).
SpecimenFy (kN)Δy (%)Fp(kN)Δp (%)Δu (%)θpμΔξyξpξu
ZD-0116.870.71138.011.462.772.063.910.020.060.10
ZD-1111.810.82139.971.472.832.013.400.030.050.09
ZD-2103.050.67124.451.101.791.122.650.020.040.08

