Article

Channelrhodopsin-2 Function is Modulated by Residual Hydrophobic Mismatch with the Surrounding Lipid Environment

1
Department of Chemistry and Biochemistry, Worcester Polytechnic Institute, Worcester, MA 01609, USA
2
Program in Systems Biology, University of Massachusetts Medical School, Worcester, MA 01655, USA
3
Department of Physiology and Biophysics, Weill Cornell Medical College of Cornell University, New York, NY 10065, USA
4
Schrödinger Inc., New York, NY 10036, USA
5
Institute for Computational Biomedicine, Weill Cornell Medical College, Cornell University, New York, NY 10065, USA
*
Author to whom correspondence should be addressed.
These authors contributed equally to this manuscript.
Appl. Sci. 2019, 9(13), 2674; https://doi.org/10.3390/app9132674
Submission received: 28 April 2019 / Revised: 3 June 2019 / Accepted: 26 June 2019 / Published: 30 June 2019
(This article belongs to the Special Issue The Advances and Applications of Optogenetics)

Abstract

:

Featured Application

This report highlights the importance of the biological membrane in channelrhodopsin-2 function and provides a framework for targeted engineering of ChR2 constructs for specific membrane compositions.

Abstract

Channelrhodopsin-2 (ChR2) is a light-gated ion channel that conducts cations of multiple valencies down the electrochemical gradient. This light-gated property has made ChR2 a popular tool in the field of optogenetics, allowing for the spatial and temporal control of excitable cells with light. A central aspect of protein function is the interaction with the surrounding lipid environment. To further explore these membrane-protein interactions, we demonstrate the role of residual hydrophobic mismatch (RHM) as a mechanistically important component of ChR2 function. We combined computational and functional experiments to understand how RHM between the lipid environment and ChR2 alters the structural and biophysical properties of the channel. Analysis of our results revealed significant RHM at the intracellular/lipid interface of ChR2 from a triad of residues. The resulting energy penalty is substantial and can be lowered via mutagenesis to evaluate the functional effects of this change in lipid-protein interaction energy. The experimental measurement of channel stability, conductance and selectivity resulting from the reduction of the RHM energy penalty showed changes in progressive H+ permeability, kinetics and open-state stability, suggesting how the modulation of ChR2 by the surrounding lipid membrane can play an important biological role and contribute to the design of targeted optogenetic constructs for specific cell types.

1. Introduction

The eyespot region of the green algae Chlamydomonas reinhardtii contains two photoreceptor proteins, channelrhodopsin-1 (ChR1) and channelrhodopsin-2 (ChR2), which are implicated in the first committed step of the phototactic response [1,2,3]. ChR2 is a light-activated ion channel that conducts cations of multiple valencies down the electrochemical gradient [1,2]. ChR2 is part of the microbial-rhodopsin family of membrane proteins found in archaea, algae and bacteria [4]. Its structure follows the common architecture of seven-helix transmembrane domains (TMD) that houses all-trans retinal bound through a protonated Schiff base to a completely conserved lysine residue on TM 7 (K257 in ChR2). Photoactivation of ChR2 with blue light (λmax = 470 nm) isomerizes retinal to the 13-cis isoform to begin the photocycle reaction that leads to ion conductance [2]. The functional properties of ChR2 have made it a popular tool in the field of optogenetics in which excitable cells expressing photoactivatable ion channels are controlled by light. ChR2 activation can rapidly depolarize the membrane of excitable cells and induce neuronal spiking of action potentials with high temporal and spatial resolution [5].
ChR2 photocurrents rise to an initial transient peak (Ip), which decays rapidly to a steady-state value (Iss) in a process known as inactivation [6]. Once illumination ends, Iss decays biexponentially to baseline, indicative of a two-step process [7]. Interestingly, even after long periods of recovery in the dark, ChR2 exhibits reduced peak currents on subsequent light pulses, which is referred to as desensitization [8]. There have been multiple attempts to generate a photocycle model that accurately recreates ChR2 photocurrents. Several kinetic three and four-state models have been developed to reproduce and quantify ChR2 photocurrents [9,10]. The current models consist of two closed states and two open states (Figure 1) [11,12,13]. Here, the ground state C1 rapidly transitions to an initial high conducting O1 state. Under continuous illumination conditions, O1 decays to the lower-conducting O2 state. Once the light is turned off, ion conductance ends and O2 moves to the desensitized closed state C2. During sufficient time in the dark, C2 thermally converts back to C1.
The ChR2 kinetic model is defined by the distribution of conformational states (O1, O2, C1, C2) with corresponding rates of transition and the ion conductance properties of these states. Molecular detail relating the timing of conformational changes during the photocycle to the resulting ion conductance is required for a better understanding that can lead to predictive modeling of ChR2 function. Indeed, compared to microbial-rhodopsin pumps, ChR2 undergoes much larger conformational changes in backbone structure prior to ion conductance [14,15,16]. The analysis of conformational rearrangements of the ChR2 molecule from spectroscopic measurements, spin-labeled electron paramagnetic resonance (EPR) experiments and molecular dynamic (MD) simulations has indicated activation-related movement of transmembrane segment (TM) 2 away from the bundle by over 3 Å [16,17]. This movement is also sensed by TM7 through an interhelical hydrogen-bonding network. The resulting reorientation of the gating residues E90, N258 and Y70 enables water penetration to the pore and subsequent ion conductance [15].
Given the substantial structural rearrangements of transmembrane segments (TMs) in the TMD associated with ChR2 function, it becomes important to evaluate the role and contribution of the local membrane environment in affecting channel mechanism. Such membrane-protein interactions have been shown to play central roles in the functional mechanisms of membrane proteins—from G-protein-coupled receptors (GPCRs) [18,19,20,21] to transporters [22,23,24] and channels [25,26]—but have not been addressed in the analysis of ChR2 function. Since the physical properties of membranes, such as thickness, curvature, compression modulus and specific composition have all been shown to affect the structure and function of the numerous membrane proteins studied, it seems essential to explore the role of membrane interactions of ChR2 in order to connect expected functional properties to diverse environments in various cells.
The membrane-mediated regulation of proteins has been addressed quantitatively in terms of hydrophobic mismatch [21,22,27]. However, as the TM helix bundle of membrane proteins is highly asymmetric (with TM segments of dissimilar length and orientation), the evaluation of the mismatch is a complex task. Moreover, the conformational rearrangements associated with the various states of these proteins (active, inactive, desensitized) engender dynamic interaction with the lipid environment. Consequently, the hydrophobic mismatch that occurs when the membrane spanning regions of proteins do not position hydrophobic/hydrophilic regions in alignment with their counterparts in the bilayer is dynamic in nature, following the interfaces created in the protein states by deforming the bilayer so that the thickness of the hydrophobic portion of the lipid bilayer can match the hydrophobic core of the protein. This matching prevents the exposure of nonpolar (or polar) residues to the inappropriate part of the membrane and minimizes the energetic cost. If the adaptation of the membrane does not fully compensate the hydrophobic core, a residual hydrophobic mismatch (RHM) is established [19], which incurs additional energy costs [22]. In simple channels, such as the single, helical TMs gramicidin A channel, the hydrophobic mismatch can be remedied mostly by simple membrane deformations [28]. However, in more complex channels composed of multiple TMs the membrane adaptation is challenged by the radially asymmetric hydrophobicity of the interface surface, which also changes with the functional or oligomerization state of the protein.
The recently developed computational approach—Continuum Theory-Molecular Dynamics (CTMD)—has been shown to account quantitatively for the effects of complex lipid deformations that occur with multiple TM helices [27]. Once the membrane deformation profile is established with CTMD for each conformational state of interest, the method also quantifies the solvent accessible area of unfavorably exposed residues due to RHM and calculates the resulting energy penalty [18,22]. Because the CTMD method calculates the energy components in a specific structural context that identifies the residues producing the largest energy penalty, the results predict specific changes that can be introduced by mutagenesis to reduce (or increase) the RHM and show the dependence of RHM on the composition-dependent properties of the bilayer (e.g., thickness). Thus, the methodology can serve prospectively to identify residues critical to hydrophobic mismatch in different lipid environments and on this basis predict specific mutations that would increase/decrease the compatibility between the protein and the specific bilayer, thereby guiding mutagenesis experiments and choices of preferred membrane environments for activity.
ChR2 has been successfully expressed in functionally diverse cell lines, each with unique membrane compositions [5,29,30,31]. To further explore these membrane-protein interactions, we demonstrate the role of RHM as a mechanistically important component of ChR2 function. Through a combination of MD simulations, CTMD calculations and functional measurements, we have quantified the key contributions to RHM of residues within TM1 and TM7. For several decades, hydrophobic mismatch has been proposed to modulate TM protein function. This may be the first report describing the identification of particular residues and corresponding mutations central to the role of hydrophobic mismatch that was also followed by experimental validation for a multi-TM protein. Notably, our results provide a physical premise for previously observed effects on pore diameter by the V269S ChR2 mutation reported by us [32]. Analysis of our results highlights the importance of the lipid membrane in modulating the functional properties of ChR2 during optogenetic applications.

2. Materials and Methods

The membrane-protein interactions of the ChR2 protein were quantified with the Continuum-Molecular Dynamics (CTMD) hybrid approach using a protocol described in detail previously [22,23,24,25,26,27]. The all atom MD simulations were carried out following in detail the protocols that served in our simulations of membrane proteins (e.g., see References [22,33,34,35]), employing NAMD software and the CHARMM36 force field for the protein and the membrane. ChR2 was modeled on the structure of the C1C2 chimera [13,36,37]. Alignment with the X-ray structure of ChR2 was performed using the MultiSeq package in VMD [38,39]. The model was embedded in a patch of 1-palmitoyl-2-oleoyl-sn-glycero-3-phosphocholine (POPC) lipid bilayer of dimensions ~100 Å by 100 Å. The length of each simulation of the resulting system was at least 200ns.
Quantification of the residual hydrophobic mismatch was achieved as previously described [22,27]. In brief, the surface area SAres,i of the ith residue participating in unfavorable hydrophobic-polar interactions (i.e., when the residue’s hydrophobicity does not match that of its environment) was calculated using modified residue-specific solvent accessible surface area (SASA). For hydrophobic residues, the RHM is SAmem,i, where SAmem,i = SASA calculated for the solute comprising the protein and the hydrophobic core of the lipid bilayer (C2-C2). For polar residues, the RHM is calculated as SAres,i = SAprot,i − SAmem,i, where polar residues are on the surface of the protein and within the lipid bilayer hydrophobic core and SAprot,i = SASA with the solute comprising the protein only. An exception is made for tryptophan, which is favorably located at the interface [40].
The energy penalty is directly proportional to SAres,i and the energy penalty for the Nth TM (N = 1 to 7) is given by:
Δ G r e s =   i = 1 N T M Δ G r e s , i   ~ i = 1 N T M σ r e s SA res , i
where the constant of proportionality σ r e s is taken as 0.028 kcal/(mol. Å2) and NTM is the number of membrane-exposed residues in the TM [41].
As described, neither arginine nor lysine are penalized when they are located close to the lipid headgroups [42]. In addition, serine and threonine exposed to the hydrophobic membrane interface can form hydrogen bonding with the helix backbone and are therefore not penalized [43].
SASA are computed from all-atom molecular dynamics simulations (described below), with a probe radius of 1.4 Å and using the g sas utility of the GROMACS software [44].

2.1. Membrane Deformation

Membrane deformation can be described as a function of the local bilayer thickness d(x,y) and the equation:
μ ( x , y ) = 1 2 ( d ( x , y ) d 0 )
where d0 is the bulk thickness of the bilayer away from the protein. The trajectory is centered at that protein and the time-averaged d(x,y) is computed by fitting a 2Å x 2Å rectangular grid to the phosphate beads over the course of the trajectory, followed by spatial smoothing. In this manner, the d(x,y) can then be calculated around ChR2 from the MD trajectory. More complete details of this methodology can be found in Reference [27].
For the calculation of deformation free energies using the CTMD method, the membrane is considered an elastic continuum, where the deformation energy cost is the sum of the compression-extension, splay-distortion and surface tension components [28,45]. To obtain µ(x,y) the Euler-Lagrange equation is solved with no assumption in regard to radial symmetry and with specific boundary conditions on the protein-membrane boundary taken from the MD simulation results as described previously [27]. The solution to the Euler-Lagrange equation for the ChR2 systems yields the energy cost of the membrane deformation computed using the boundary conditions from the MD simulations.

2.2. Molecular Biology, mRNA Synthesis and Oocyte Injection

The gene encoding for a truncated ChR2 (residues 1-308) with a C-terminal hemagglutinin tag was cloned into the pTLN vector between EcoRV and XbaI restriction sites [13,32,37,46]. All point mutations were created using the QuikChange site-directed mutagenesis (Agilent Genomics). Mutations were verified by full gene sequencing.
Oocytes were extracted from female Xenopus laevis frogs by partial ovariectomy. Oocytes were digested in ORI (-) buffer (90 mM NaCl, 2 mM KCl, 5 mM MOPS; pH 7.4) supplemented with 3 mg/mL collagenase type II at 17 °C with gentle shaking. After digestion, oocytes were washed with copious amounts of ORI (+) buffer (90 mM NaCl, 2 mM KCl, 2 mM CaCl2, 5 mM MOPS; pH 7.4). ChR2 mRNA was synthesized in vitro using the SP6 mMessage mMachine kit (Agilent, Santa Clara, CA, USA). The mRNA was diluted to 1 ug/uL in DEPC-treated water. A volume of 50 nL mRNA was injected into each oocyte (50 ng total). Post-injection, oocytes were stored in 5 mL of ORI (+) supplemented with 1.5 µM all-trans retinal and 1 mg/mL gentamycin at 17 °C in the dark for 3–4 days.

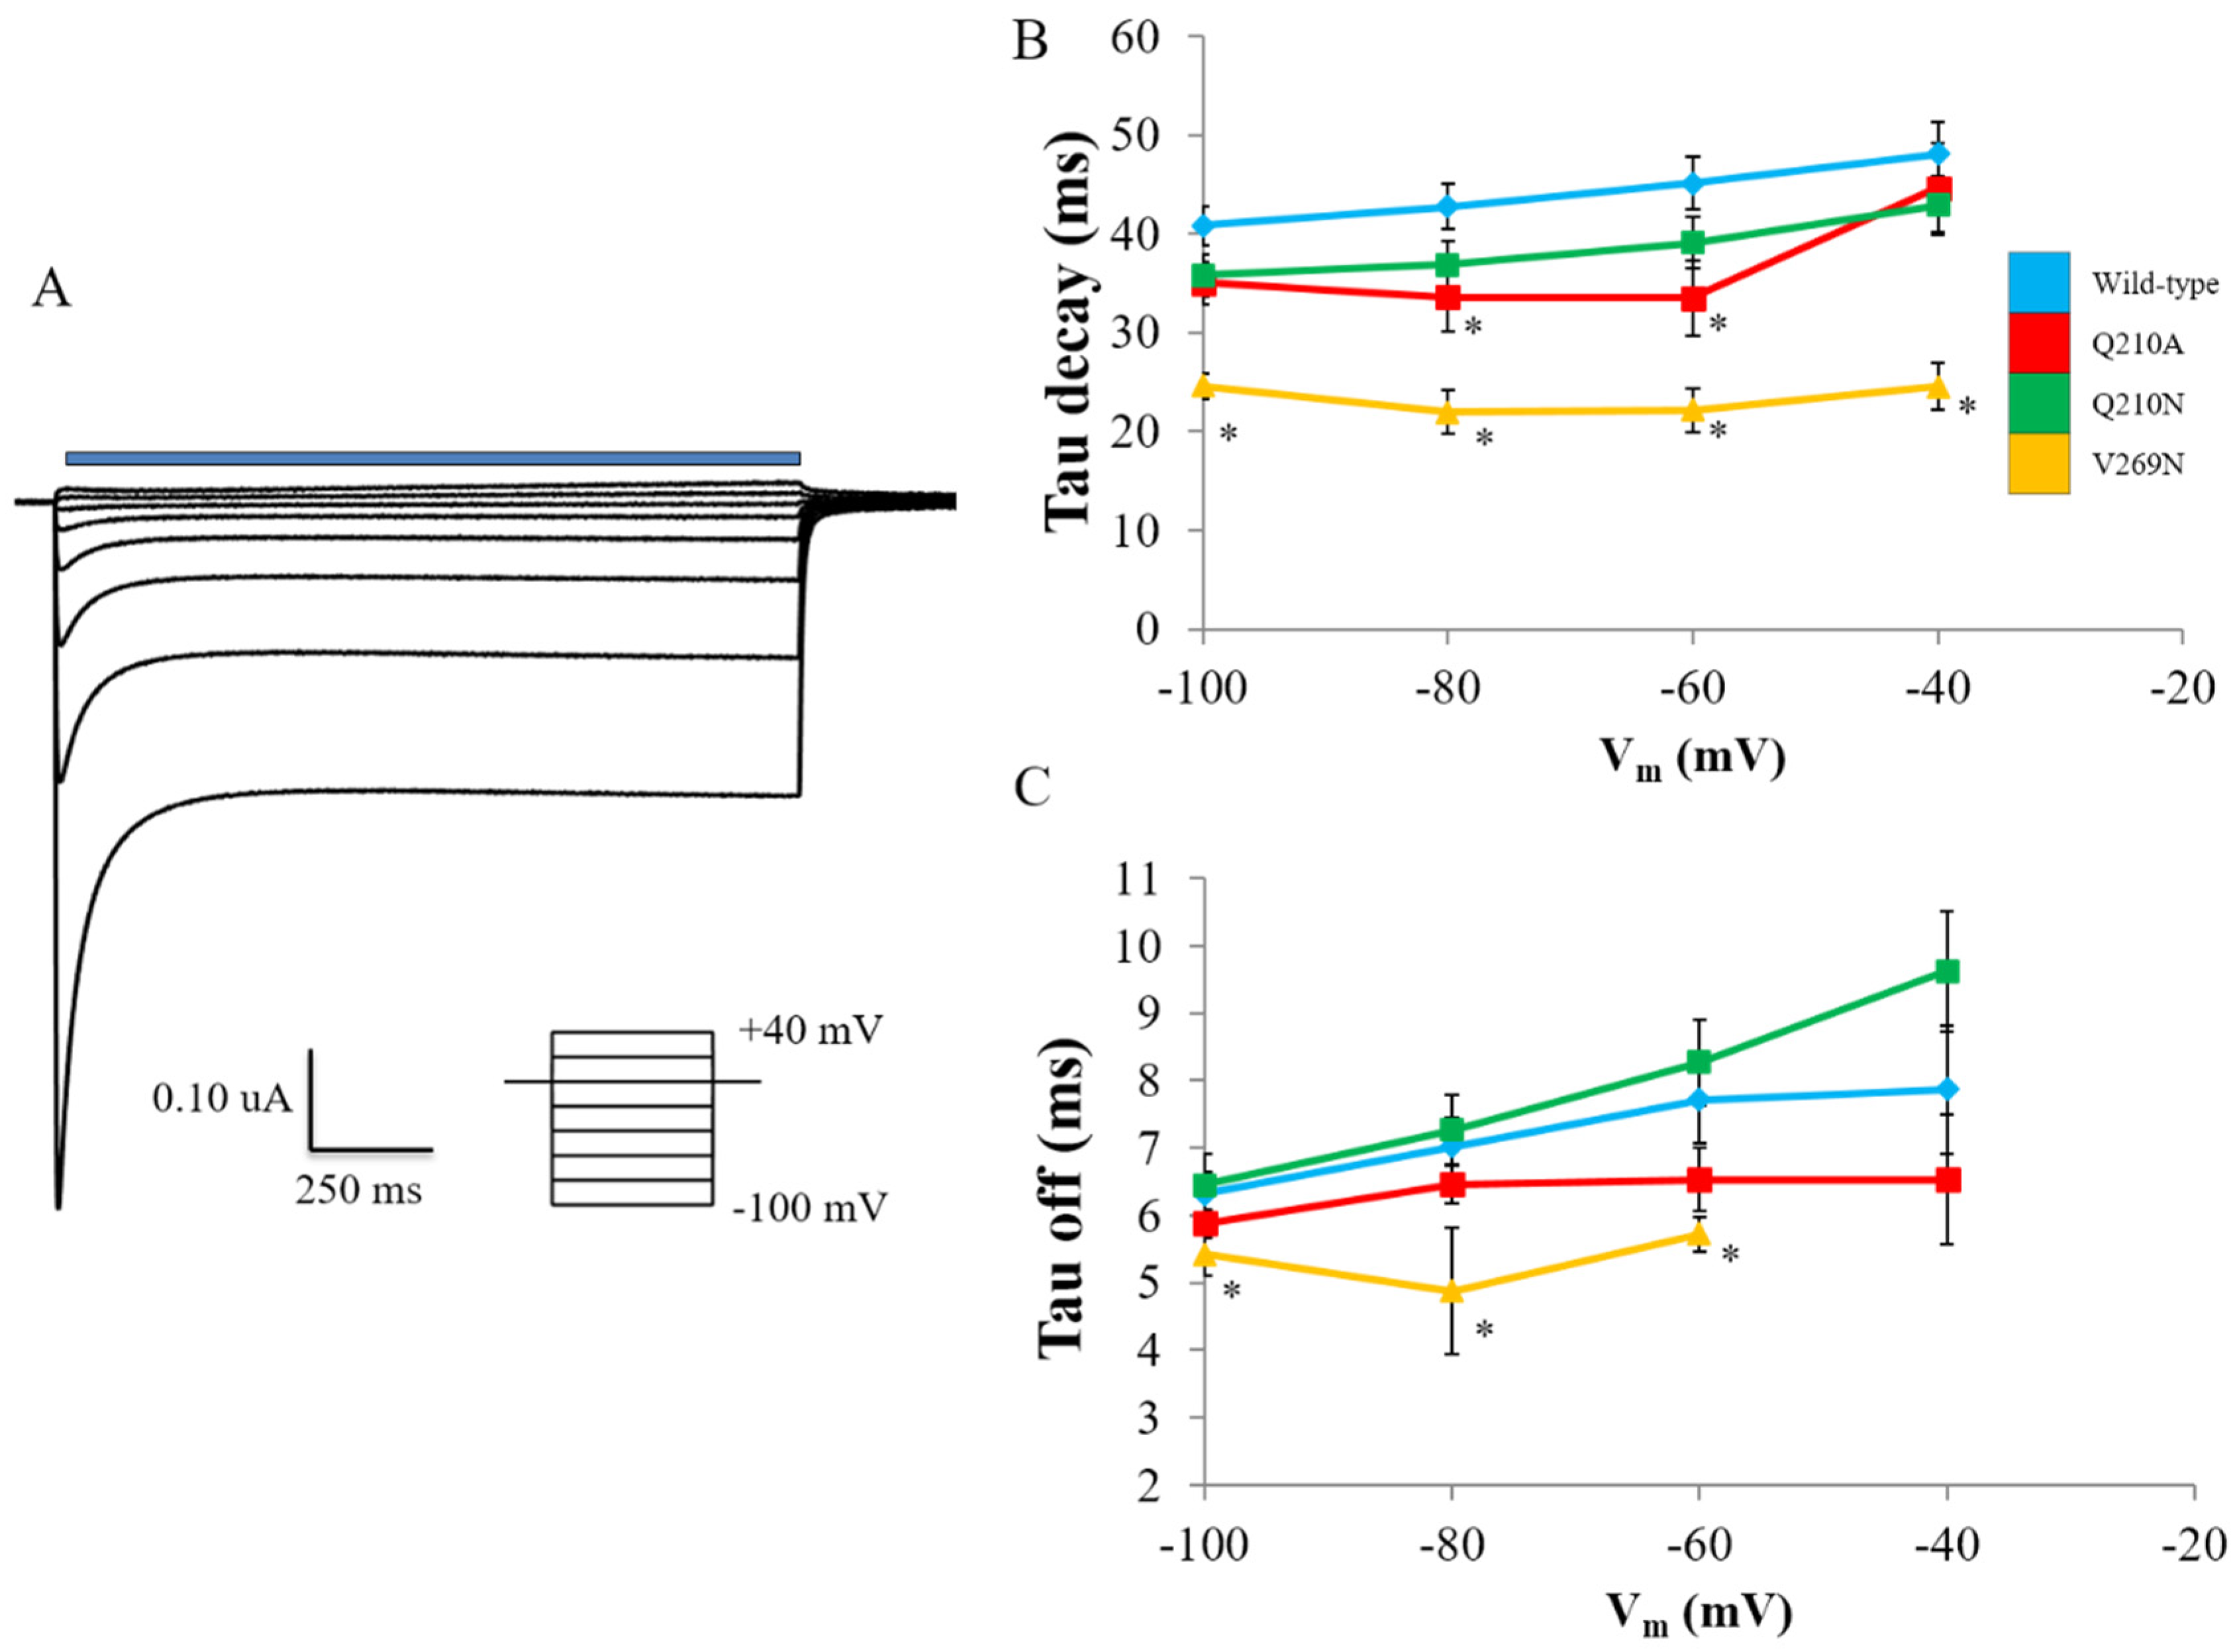
2.3. Electrophysiology

Borosilicate glass electrodes were pulled using a PC-10 puller (Narishge, Amityville, NY, USA). The microelectrodes were filled with 3 M KCl and had tip resistances between 0.5–1.5 MΩ. Voltage-clamping of oocytes was achieved through a Turbo-tec 03X amplifier connected to a 1440 A Axon Instruments digitizer (Molecular Devices, San Jose, CA, USA). Voltage protocols and current recording were controlled with Clampex software. ChR2 was activated via a 1 mm light guide connected to an Omicron LEDMOD V2 300 mW LED module with an emission wavelength of 470 nm. The membrane voltage was varied from −100 mV to +40 mV in 20 mV steps. Sodium solutions consisted of 100 mM NaCl, 2 mM MgCl2, 0.1 CaCl2, 5 mM MOPS/5 mM MES at pH 7.5 and 6.0, respectively. Reversal potentials were determined from current-voltage curves at Ip and Iss. Kinetic parameters were determined by fitting photocurrent traces with monoexponetial (Tdecay) or biexponential equations (Toff).

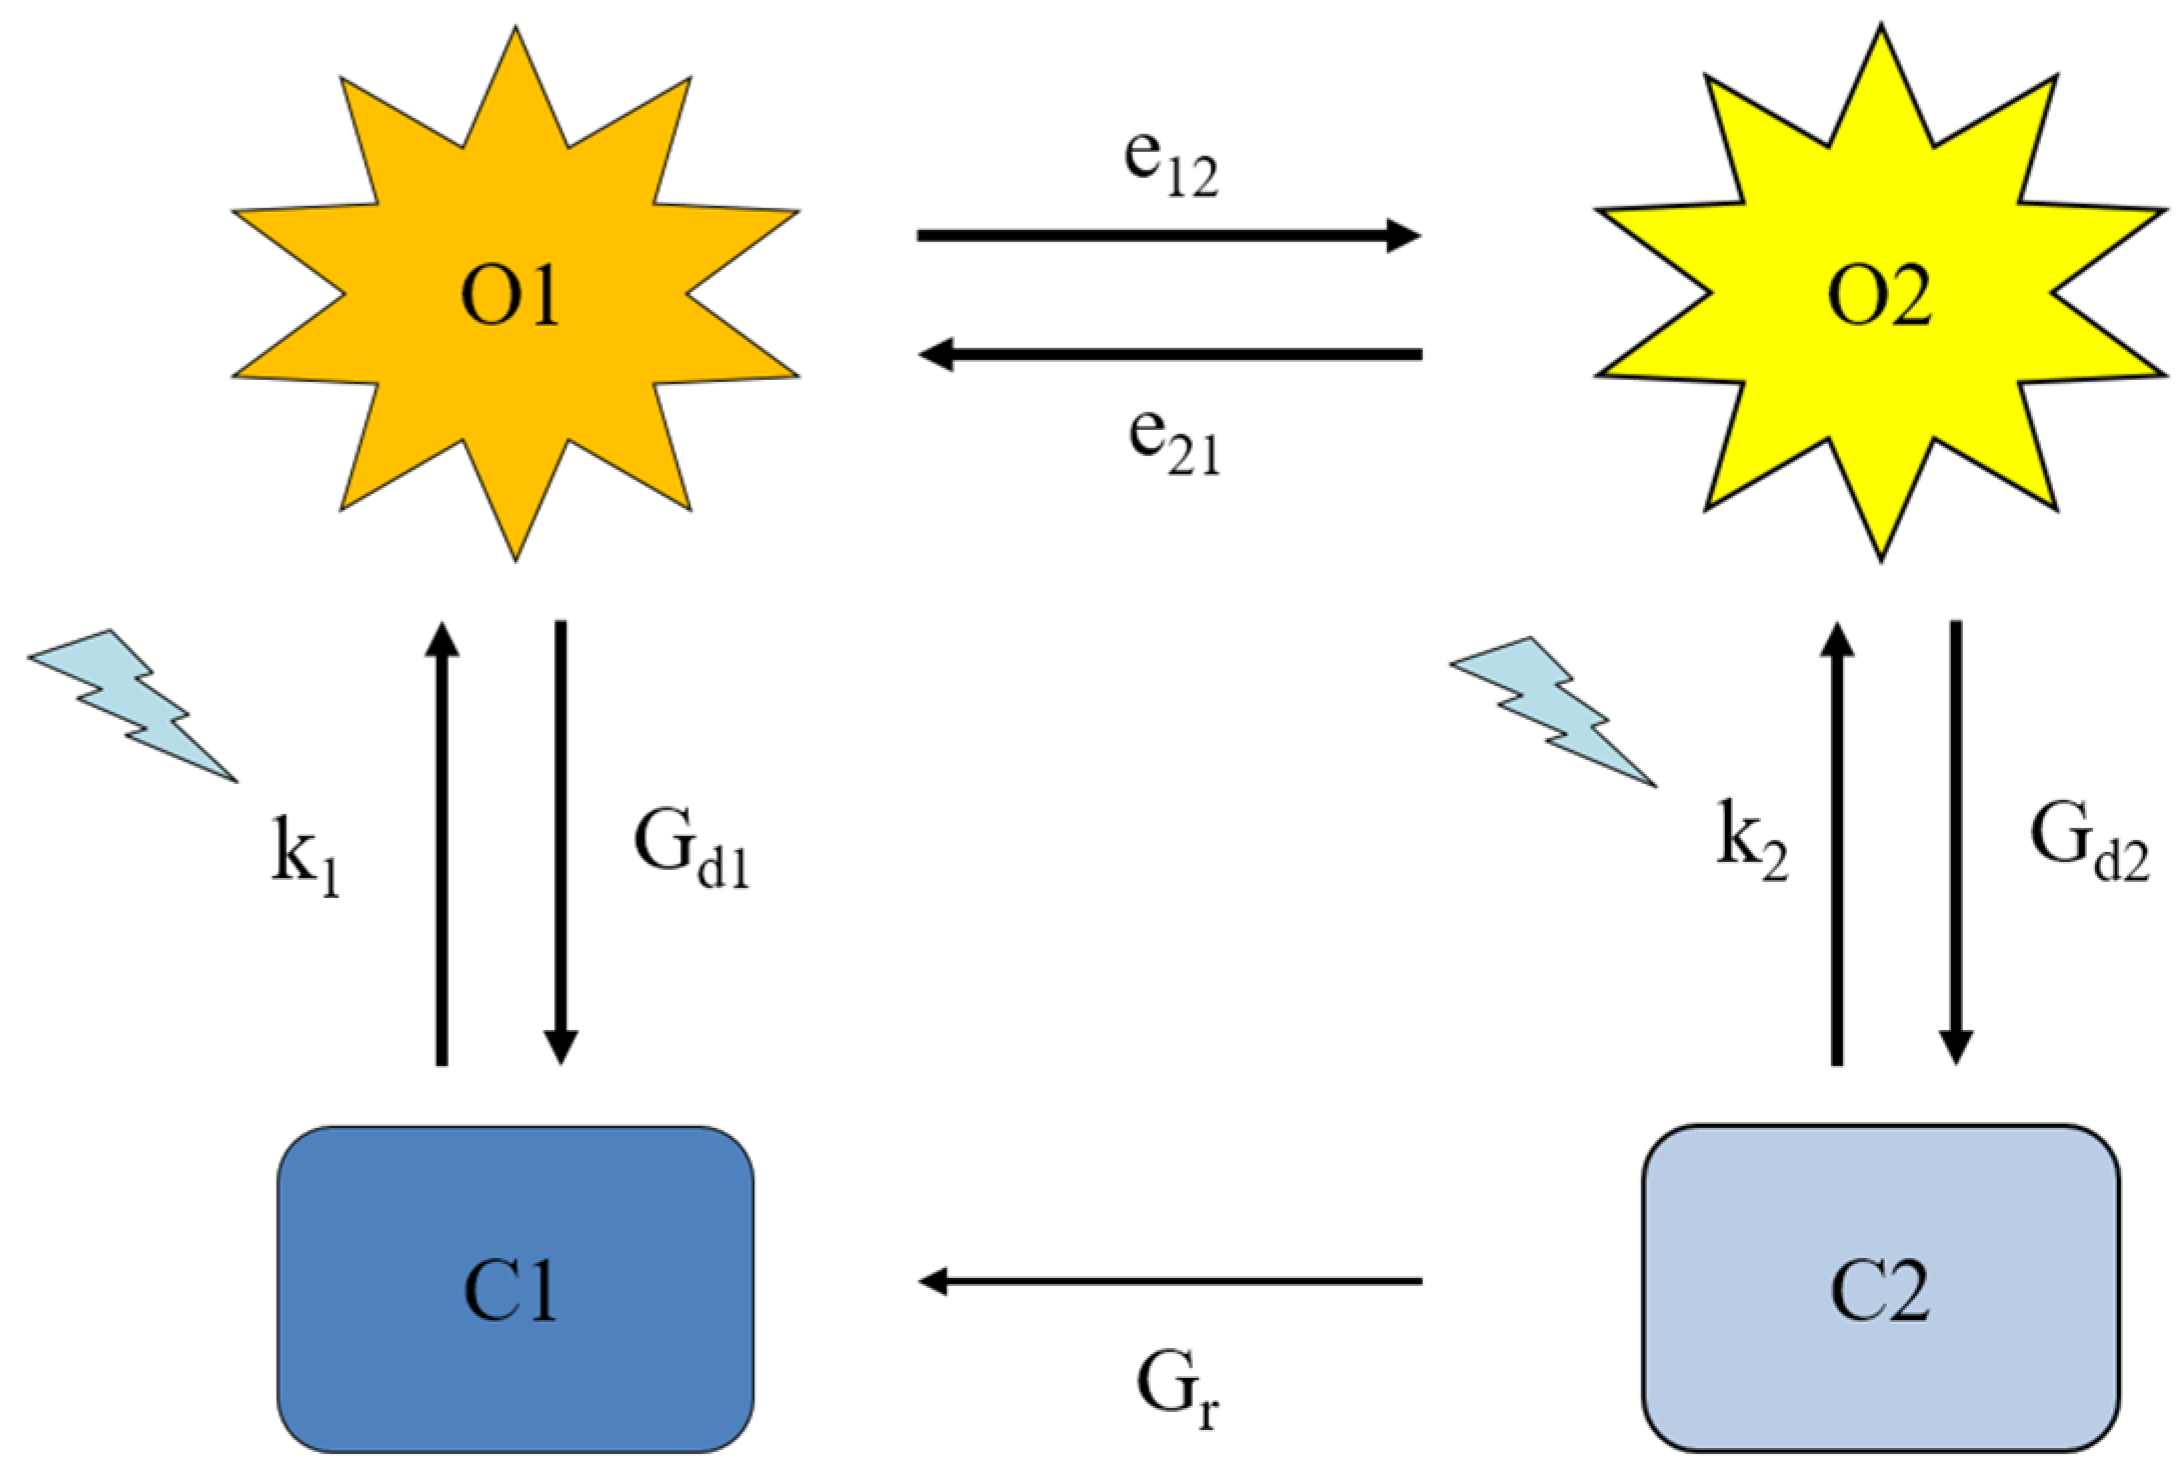
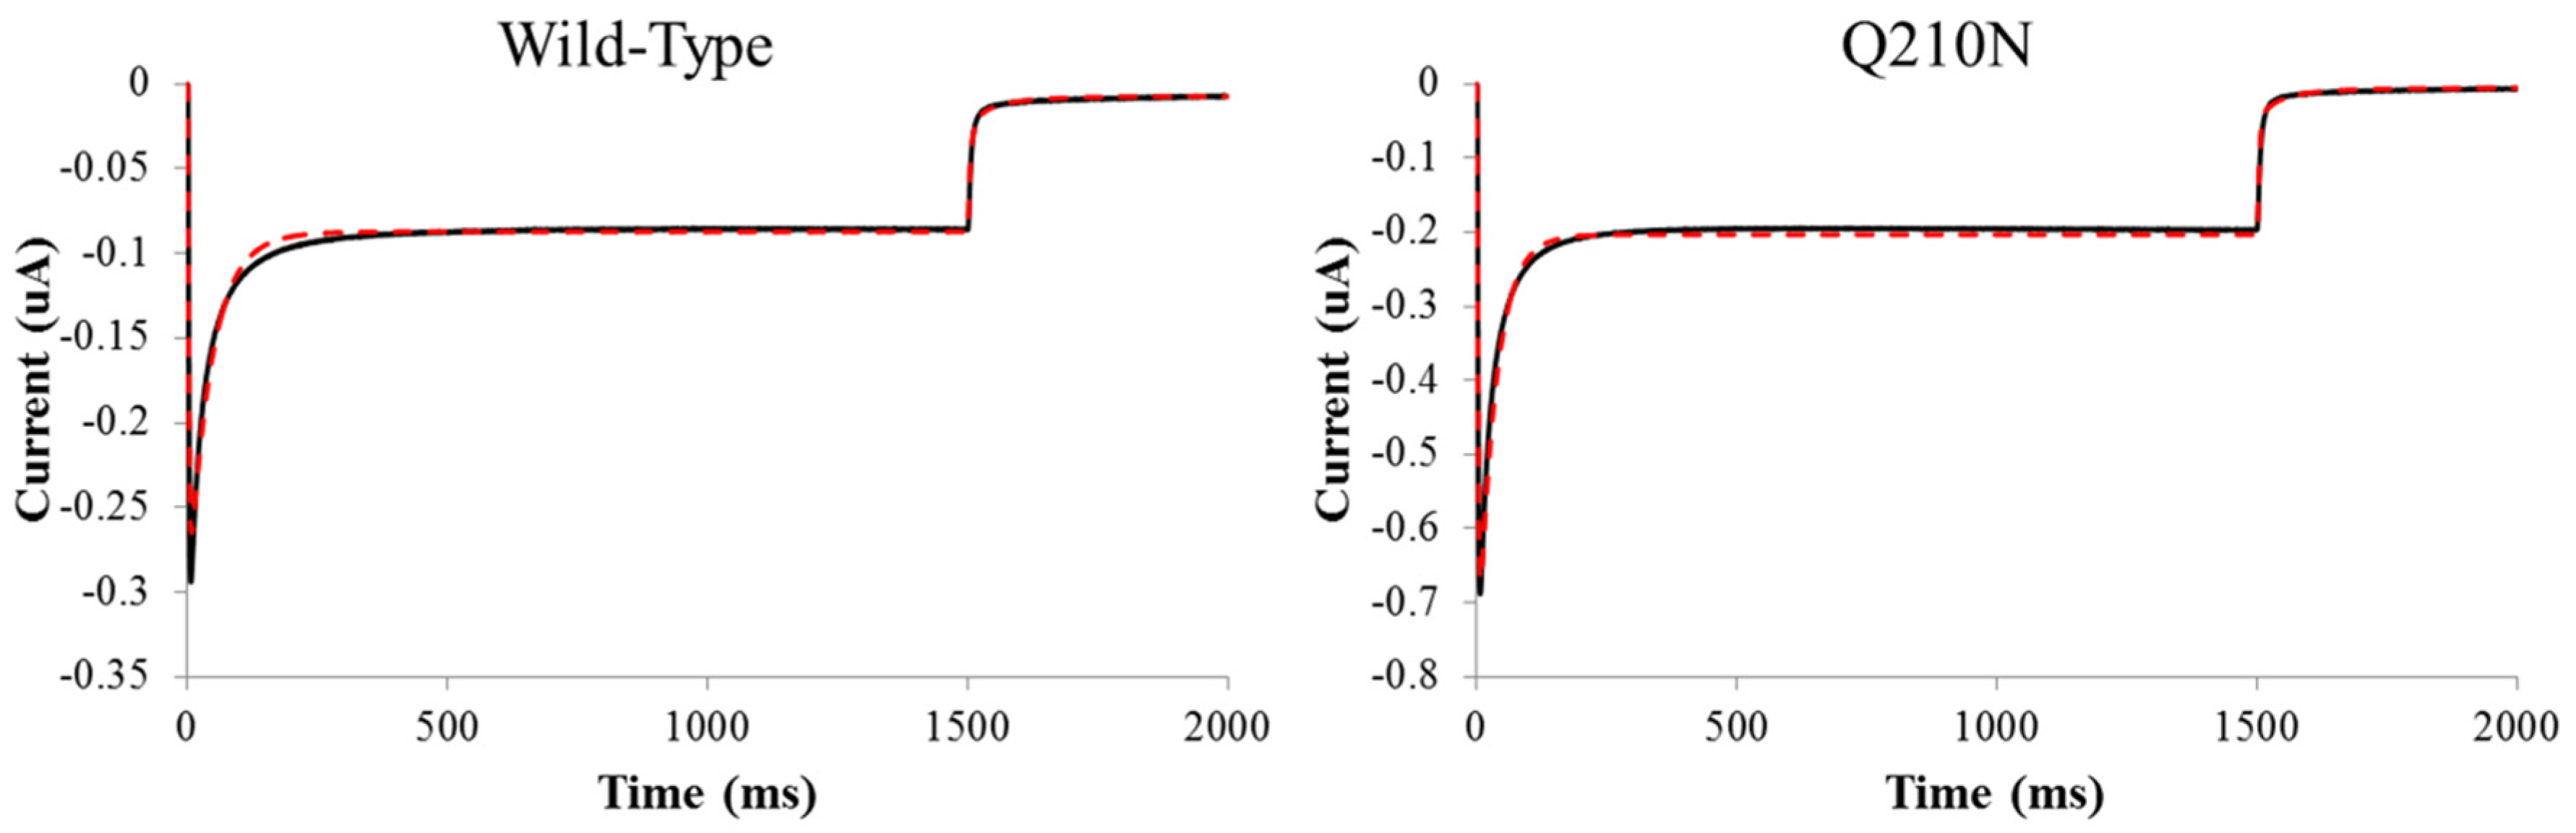
2.4. Four-state modeling of photocycle kinetics

The mathematical model describing ChR2 photocycle kinetics was developed based on previous four-state models (Figure 1) [11,12,13,45]. Transitions between the two closed (C1 and C2) and two open (O1 and O2) states can be described by the following rate equations:
d C 1 d t   =   G r   ×   O 2   +   G d 1   ×   O 1     k 1   ×   C 1
d C 2 d t   =   G d 2   ×   O 2     ( k 1   +   G r )   ×   C 2
d O 1 d t   =   k 1   ×   C 1   +   e 21   ×   O 2     ( G d 1   +   e 12 )   ×   O 1
d O 2 d t   =   k 2   ×   C 2   +   e 12   ×   O 1     ( G d 2   +   e 21 )   ×   O 2
C 1   +   C 2   +   O 1   +   O 2   =   1
where C1, C2, O1 and O2 represent the population of each state, Gr is the thermal conversion of C2 → - C1, Gd1/2 are the back reactions O1(2) → C1(2), e12 is the O1 → O2 transition and e21 is the reverse reaction. The light-assisted transitions k1/2 represents activation of C1 and C2 respectively and are described by:
k 1 / 2   =   ε 1 / 2 Fp
where ε is the quantum efficiency of retinal photon absorption in C1 or C2, F is the photon flux and p is the state-dependent activation function related to the non-instantaneous response of retinal to light described by References [47,48]:
d p d t   =   ( S 0 ( Θ )     p ) / T ChR 2
where S0(Θ) is the sigmoidal function and TChR2 is the time constant for activation. Finally, the solutions to the rate equations are used to determine the current (I) flowing through ChR2:
I   =   I max   ( O 1   +   γ O 2 )
With γ representing the conductance ratio between the O2/O1 individual conductances g2 and g1 and Imax is Vmxg1.
Photocurrent traces were imported into Mathworks MATLAB 2013. The parameters describing the photocycle (k1, k2, Gd1, Gd2, e12, e21, Imax, γ, Gr, TChR2) were optimized using the FMINCON function and used to fit experimental traces. Differential equations were solved using the built-in ode23 function. Minimization between the theoretical and experimental traces was done using a simple sum of squared error routine.

3. Results

3.1. Identification and Quantification of Residual Hydrophobic Mismatch

To quantify residual hydrophobic mismatch for ChR2 in the POPC membranes, we obtained an extended simulation trajectory from MD simulations of the ChR2 homology model based on the C1C2 structure, embedded in a POPC lipid bilayer. The ChR2 homology model aligns closely with the recently solved X-ray structure of ChR2 (Figure 2A) with a RMSD of 1.17 Å (Figure 2A) [39]. The most notable structural differences occur in the N-terminal domain and the loop between TM1 and TM2. The CTMD approach was then used as previously described [22,27] to calculate the consequences of protein-membrane interaction, including membrane deformation and the free energy cost of the RHM. The analysis revealed significant residual hydrophobic mismatch in WT ChR2 (Table 1). Although membrane deformation had alleviated some unfavorable interactions, residues located at the cytoplasmic interface of TMs 2, 6 and 7 remained exposed to either polar or hydrophobic inappropriate environments due to the local adjacency to residues with diverse properties that prevented further adaptation of the membrane (see References [22,27]) Consequently, Q73 on TM1 and Q210 on TM6 were found to face the hydrophobic interface of the membrane. This caused membrane thinning in the adjacent regions of both residues, leading to water penetration into the membrane and exposure of V269 to a polar environment (Figure 2B). Substantial RHM was also observed at N187 and V269. Notably, mutations at these positions have previously been shown to affect ChR2 function [32,49].
The energy cost of residual hydrophobic mismatch across the bilayer was calculated upon mutagenesis at V269 and Q210 (Table 1). The RHM for Q73 was not calculated because it is located in a modeled loop connecting TMs 1 and 2, which is unresolved in the C1C2 chimera template. Initially, the RHM was calculated for the entire ChR2 homology model, comprising of RHM at residues 210, 269, 270, 69 and 73. As the residues in TM1 are in a modeled loop, RHM was also calculated leaving out the residues in TM1. Both sets of calculations resulted in the same general trends. First, mutation of V269 to serine or asparagine decreased RHM. The decrease in RHM can be directly attributed to the observation that replacement of the hydrophobic residue (V) with polar residues (S or N) eliminates the RHM energy penalty when water penetrates into ChR2 at this position. Similarly, mutation of Q210 to alanine also reduced the RHM energy penalty. Interestingly, the Q210A mutation also lowered RHM at the neighboring V269, as the elimination of the polar residue likely reduced water penetration. These calculations thus added V269 to the cluster of adjacent polar and hydrophobic residues that are responsible for the large RHM penalties: Q210 (TM6), V269 and L270 (TM7), F69 and Q73 (TM1).
As controls, energy penalty calculations were done for I95L and Q210N, two mutations that should not affect RHM. Indeed, neither of these null mutations changed the energy penalty compared to WT ChR2 (without TM1 contributions, compare the calculated energy penalty value for the WT: 7 kT, to those for I95L: 6.6 kT and Q210N: 6 kT). Differences of <1 kT are within thermal energy fluctuations and cannot be considered biologically significant

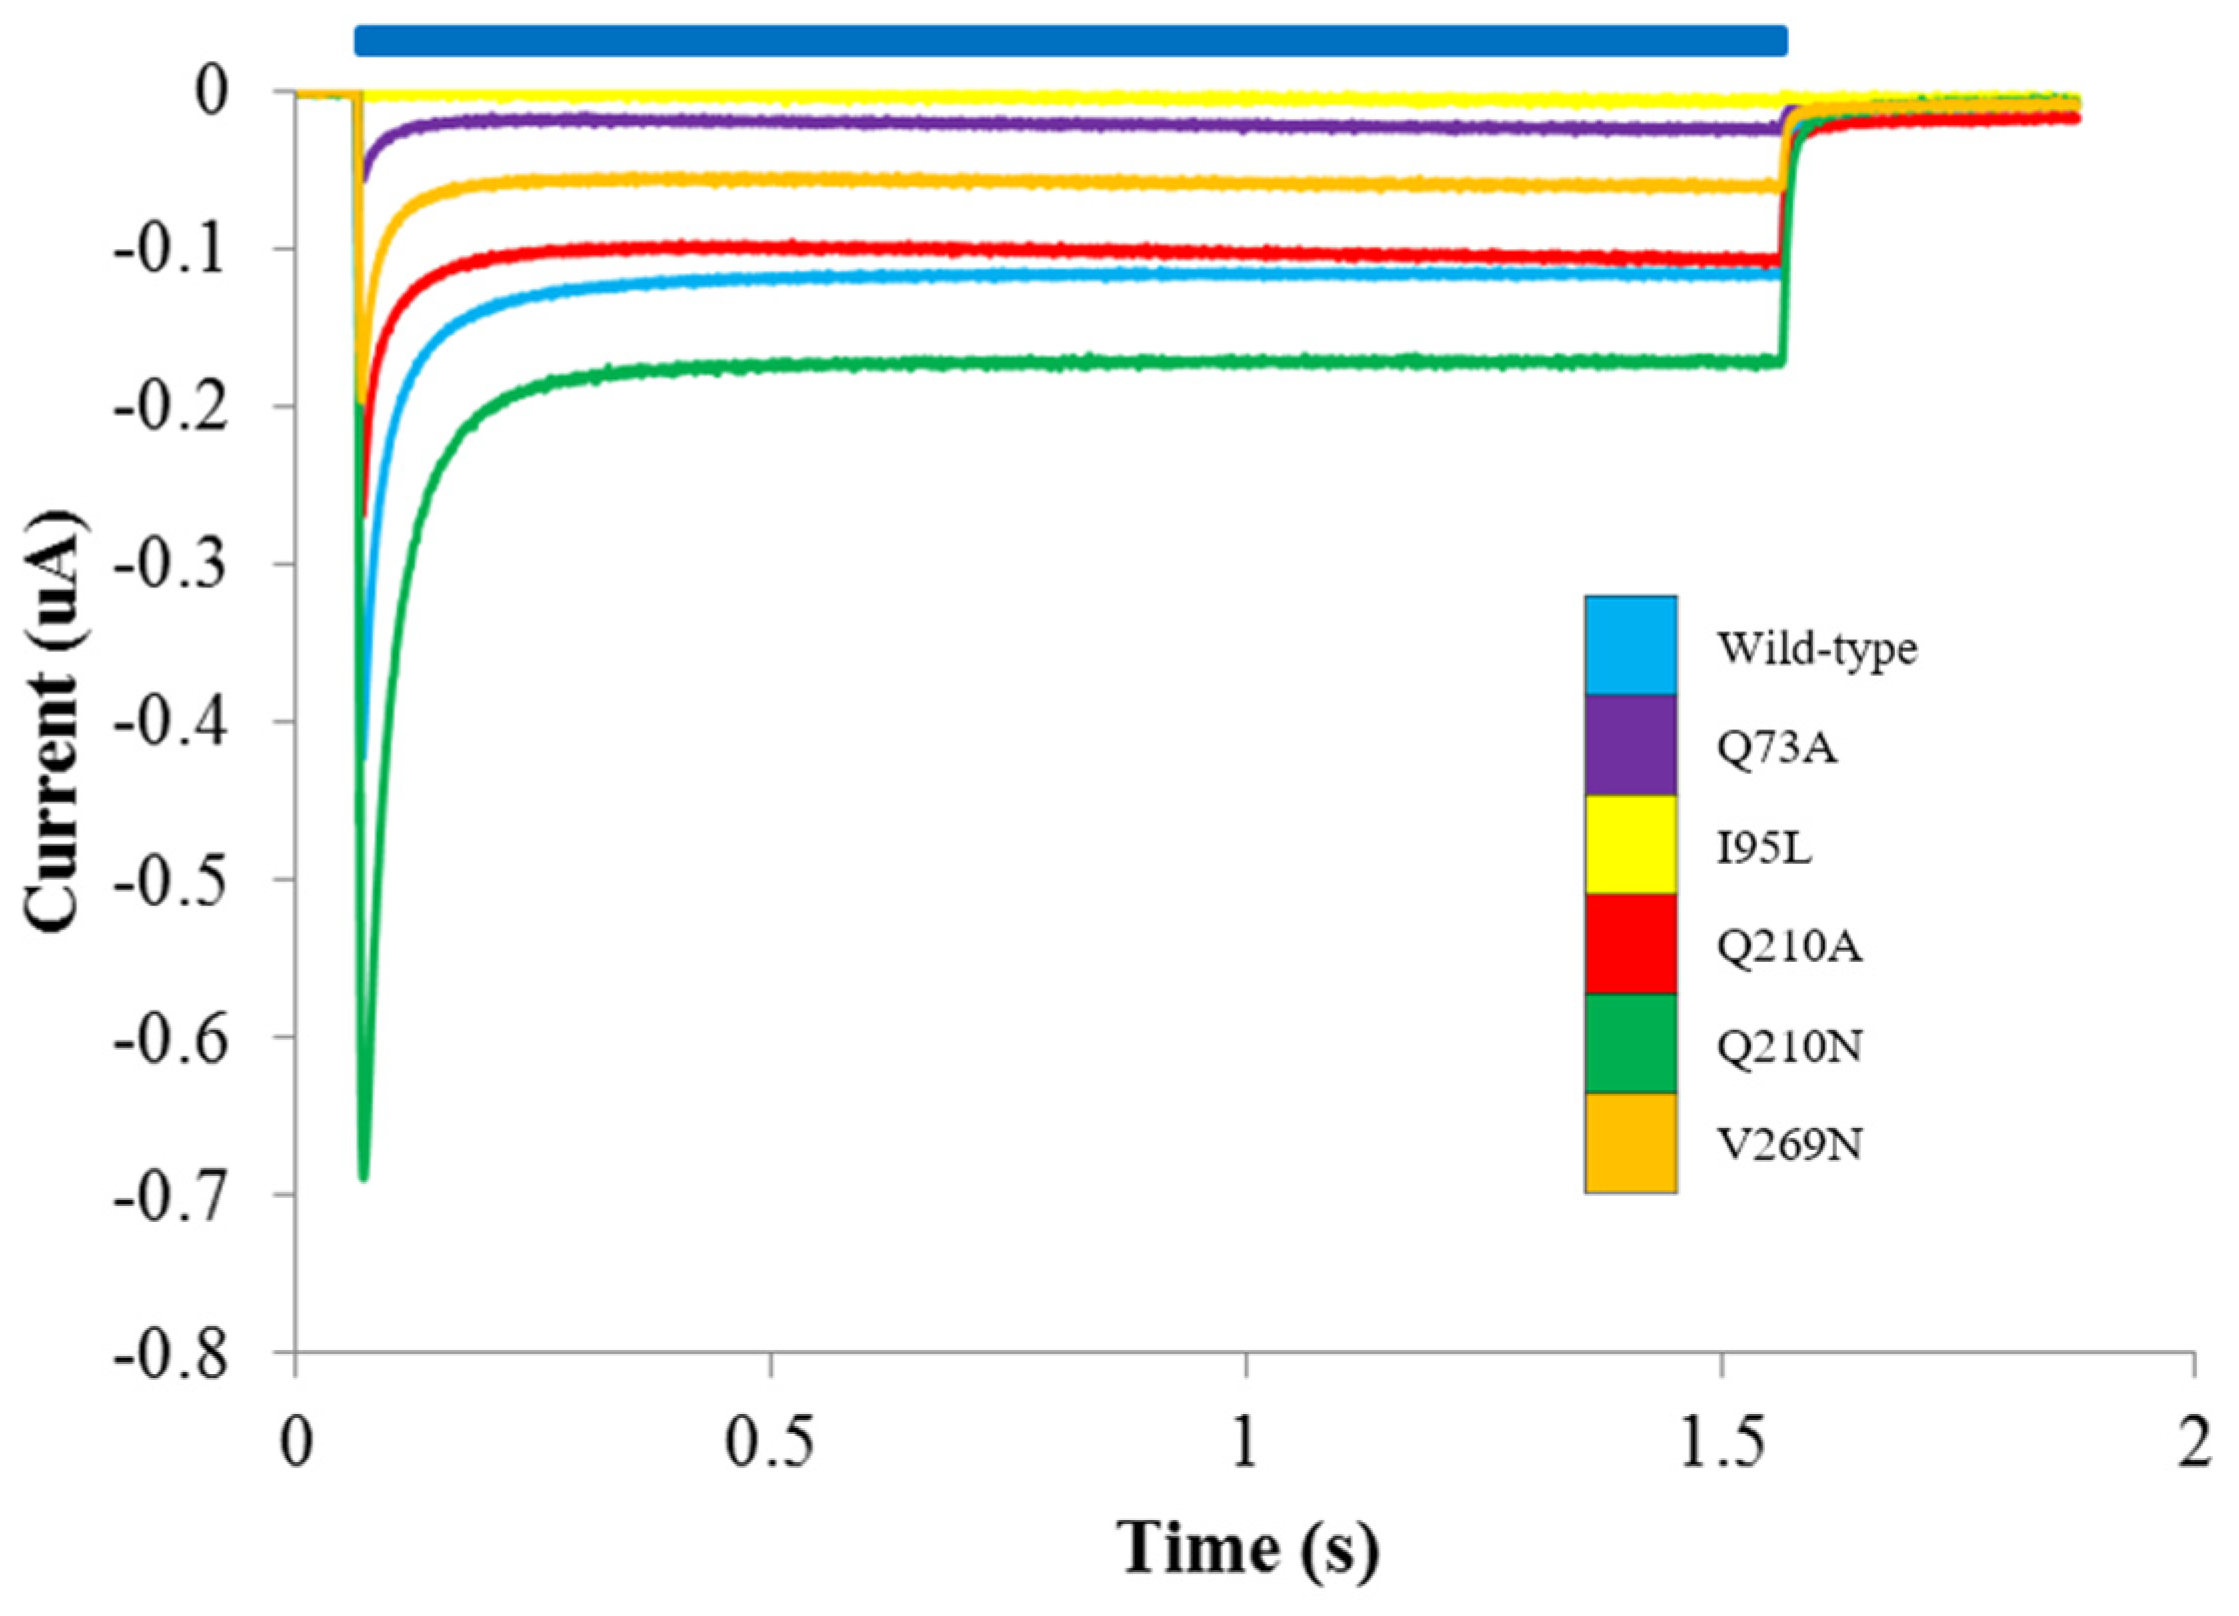
3.2. Probing the Effects of Predicted RHM Changes with Experimental Measurements of Function for ChR2 Constructs

In order to directly assess the functional effect of changes in RHM energy penalty on the functional properties of ChR2 constructs, we used two-electrode voltage clamp measurements. A trio of membrane-facing residues located at the cytoplasmic/TM interface (Q73, Q210, V269) were mutated to reduce RHM, in two cases by increasing the hydrophobic surface of the protein (Q73A and Q210A) and in once case decreasing it (V269N). Additionally, the two null mutants (Q210N and I95L) calculated to produce no change in RHM energy cost were also assayed. Functional expression of the mutants was tested in X. laevis oocytes under voltage-clamp conditions. The results show reduced photocurrent for the Q73A, Q210A and V269N constructs, while Q210N produced increased photocurrent compared to WT (Figure 3). Q73A had currents <50 nA and was not analyzed further. I95L had no observable photocurrent under our experimental conditions.
The functional effect of RHM on ChR2 selectivity was quantified by measuring reversal potentials (Erev) at Ip and Iss in Na+ solutions at pH 7.5 and 6.0 (Figure 4A) (see Materials and Methods). This allowed the determination of selectivity between Na+ and H+. Additionally, by measuring reversal potentials at the peak and steady-state currents we could monitor the progressive ion selectivity as ChR2 transitions between open states. A positive shift in Ip Erev for V269N was observed at both pH 7.5 and 6.0 compared to WT. The shift was much larger at pH 6.0 than at pH 7.5, where the current is carried mostly by protons (pH 6.0) and not a mixture of Na+ and H+ (pH 7.5). In contrast, a hyperpolarizing shift in Erev for Iss was observed for this mutant only at pH 6.0 compared to WT (V269N: 13.2 ± 1.2; WT: 24.6 ± 1.5) (Figure 4B and C; Table 2). This indicated that the permeability of H+ was increased at the beginning of ion conductance (Ip) but then decreased over time (Iss) when compared to WT. Equally, when changes in Erev were considered, V269N becomes progressively less permeable for H+ at pH 6.0. Interestingly, the control Q210A mutant had no observable effect on ion permeability. The null mutant did significantly alter the progressive ion selectivity at pH 7.5 and 6.0 but only to a small degree (Table 2). We also determined steady-state to peak current ratios that provide a measure of ChR2 inactivation during prolonged light exposure (Figure 4D). Both Q210A and V269N had significantly increased ratios (Q210A:0.37 ± 0.01; V269N: 0.33 ± 0.01; Vm = −100 mV, pH 7.5) compared to (WT: 0.29 ± 0.01), correlating to less inactivation under continuous illumination. The Q210N mutation had no effect on Iss/Ip ratios.
Apparent rate constants for decay and off kinetics were calculated. Decay kinetics were calculated by fitting ChR2 photocurrent traces from Ip to Iss with a monoexponential or biexponential equation, respectively (Figure 5A). V269N had the largest effect on decay kinetics, resulting in accelerated inactivation. Q210A and the null mutant Q210N had no significant effect on decay kinetics (Figure 5B). A similar trend was observed for off kinetics, with V269N having accelerated rates and both Q210 variants not significantly altering kinetics (Figure 5C).
Lastly, to determine whether RHM differences explain changes in the modulation of discrete transitions in the ChR2 photocycle, a four-state kinetic model was applied to fit experimental photocurrent traces. Theoretical fits were obtained by optimizing a set of nine parameters describing rates of transition and fundamental properties of the channel (Figure 6) (see Materials and Methods). The null Q210N mutant had the least effect on our parameters compared to WT (Table 3). Only the transition from O1 to O2 was slightly accelerated for this mutant. Both V269N and Q210A saw the largest change from the WT fits, having altered recovery and O2 -> O1 kinetics. Q210A also had a slower O2 to C2 rate while V269N had an accelerated O1 to O2 transition.
With the four-state model, we explored the population of states at specific time points (Table 4). The time at which each ChR2 construct reached peak current was quantified. Both Q210 variants were comparable to WT (8.0 ms), while V269N was accelerated (5.3 ms). Next, the population of O1 and O2 was evaluated at the time point that corresponded to Ip and also directly before the light was turned off at 1490 ms. Analysis of the two time points revealed similar state populations for all mutants and the WT. The largest variation occurred for O1 at Ip where the RHM mutants Q210A and V269N had higher occupancy while the null Q210N mutant was lower.

4. Discussion

The expression of channelrhodopsin-2 for purposes of optogenetic manipulation has been carried out in a variety of different cell types, including cardiac cells and neuronal cells [5,50]. Importantly, ChR2 undergoes marked conformational changes during photoactivation which are crucial for the gating mechanism and these are likely to affect the interaction with the surrounding membrane environment. Therefore, we undertook here the quantification of an important component of the interaction of ChR2 with a model membrane, employing an approach that combines computational methods that include MD simulations and CTMD analysis [22,51], with related experimental approaches using electrophysiology [32,46] and kinetic modeling [13]. We explored the contribution of the surrounding lipid environment on ChR2 function by quantifying the membrane deformation around the TM core and found that the membrane deformation does not fully eliminate the hydrophobic mismatch between the ChR2 protein and the surrounding membrane, as several residues remain exposed to unfavorable environments. The large energy penalty associated with this RHM was located at the cytoplasm-facing membrane-protein interface located between adjacent TMs 1/2 and 6/7. This is especially interesting in the context of ChR2 gating because of the large movements of TMs 2 and 7 after photoexcitation [16,17,52]. Analysis of MD simulation trajectories showed that the RHM penalty in WT ChR2 is associated with water penetration into the membrane caused by thinning of the bilayer around the polar residues Q210 and Q73. As a result, V269 becomes exposed to a more polar environment. Using experimental electrophysiological approaches, we examined the relation between predicted RHM and measured functional properties to probe the predictive value of the RHM in identifying critical residues in lipid-protein interactions. The simulations were carried out in a generic model of the membrane environment of POPC lipids to enable the evaluation of results in the context of the overwhelming majority of studies of membrane proteins and GPCRs in particular, using this model membrane. These include computational studies by us [19,53,54,55] and many others [56]. The expectation that membrane-determined effects will result from RHM for the ChR was confirmed by the computational results and the corresponding experimental probing. This opens the way for future studies to interrogate cell-specific environments and their role in the use of the ChR tool, in the way demonstrated in our other studies in which the effects of cholesterol, PIP2 and lipids with varying chain lengths and charge properties [34,35,57,58].
The effects of mutating V269 (in TM7) to asparagine illustrate the relation between a change in the mode of interaction of ChR2 with the membrane and the measured electrophysiological properties. As described, the V269N mutation reduces the hydrophobic mismatch (see Figure 2B) and a hydrophobic residue at this position is highly conserved in channelrhodopsins. The measured reversal potentials for this mutant indicate severely reduced progressive proton selectivity, lower inactivation and accelerated kinetics. Previously, we had observed a similar effect at this position with the V269S mutant as this mutation caused a reduction in channel permeability and pore size [32]. Interestingly, TM7 undergoes reorientation and movement upon photoisomerization [59] and recent MD simulations comparing all-trans retinal and 13-cis retinal bound C1C2 structures revealed outward cytoplasmic bending of TM7 [59]. This is a common movement in microbial-rhodopsins that leads to ion transport [60,61]. Previously, we had attributed the reduction in pore size and function of the V269S mutation to a water-mediated hydrogen bond network that prevents large movements of TM7. However, our experimental results here indicate the importance of lowering RHM at this position and the observed effects on channel permeability for both V269S and V269N in addition to the reduction in pore diameter observed for V269S. This suggests that lowering RHM of ground state ChR2 leads to an unfavorable positioning of TM7 in the open state which restricts the minimum pore diameter. This is further supported by analysis of our kinetic modeling of V269N, which exhibits destabilization between O1 and O2 compared to WT [V269N Rf = 5.08; WT Rf = 6.67 where Rf is the reaction coefficient (e12/e21)] and reduced maximal current.
We propose that once the pore is formed, V269N becomes exposed to an unfavorable environment or allows for further water penetration exposing proximal hydrophobic residues resulting in the loss of function. This correlates with the conformational movement of TM7 during pore formation and the influx in water prior to ion conductance [15,16,62].
Functionally similar was the effect of Q210 mutation to alanine. Our computational results showed a large reduction in the RHM energy penalty with Q210A. This large reduction is a result of positioning the hydrophobic alanine residue in a favorable environment and also a consequence of the elimination of the Q210 mismatch which decreases the water penetration to the neighboring V269, thereby further lowering the RHM. As functional correlates, we observed a reduction in photocurrent, lower inactivation and slightly accelerated decay kinetics. Although there was no change in selectivity under our experimental conditions, this is unsurprising as TM4 has not been shown to contribute to the permeation pathway. Notably, Q210 is also highly conserved among channelrhodopsins and has a clear structural impact on ChR2 function as suggested by previous serine substitution [32]. The kinetic parameters also indicated a similar destabilization of the open state preference to O2 and significantly reduced quantum efficiency of the C2 to O2 transition as in V269N. To test whether or not our results were a direct consequence of RHM, we created an expected RHM null mutant at this position (Q210N), which we expected to have limited functional impact. Indeed, we found that reversal potentials and kinetics of Q210N are similar to those of WT ChR2. While Q210N did have increased photocurrent, the permeability and kinetics remained similar to WT. Therefore, the increased photocurrent of Q210N is likely not related to RHM. Our modeling also revealed limited impact on photocycle kinetic parameters for this mutant. It remains unclear how decreasing RHM at Q210 affects structural rearrangements of TM4 as little is known about the movement of this TM. However, because mutation of Q210 to alanine also changes the environment at V269 on TM7, it is possible that there is a secondary effect sensed through TM7, which is critical for channel activation.
Our results have documented the clear and quantitatively substantiated effects of residual hydrophobic mismatch at the cytoplasmic interface in ChR2 on channel function. They show that the energy cost of positioning residues in unfavorable environments can indeed be reduced by the exchanges of polar/hydrophobic properties predicted from the computations but that the reduction of the RHM penalty in the closed state has deleterious effects on ChR2 conductance, selectivity and open state stability. This is not always the case, however and the direction of the effect of RHM reduction depends on the functional mechanism, as illustrated by results for the bacterial transporter LeuT, where removal of RHM by the K288A mutant increases transport function nearly 5-fold [63]. The opposite effect of RHM on ChR2 compared to the LeuT case is consonant with the conservation of the RHM-causing residues in the channelrhodopsins, in contrast to the uniqueness of the K288 which is not conserved among LeuT-fold transporters.
Because ChR2 is a conformationally complex channel that is partially regulated by protein-lipid interactions as demonstrated here, it is remarkable that the expression of ChR2 in excitable cells including cardiomyocytes, CA1 pyramidal cells and Drosophila motor neurons covers a variety of cell types with diverse lipid composition across species [64,65,66]. This report, covering what we believe to be the first combined analysis of residual hydrophobic mismatch using computational methods, with prospective experimental validation, shows how exposure of ChR2 residues to unfavorable environments affects channel function. Consequently, the consideration of lipid composition and the specific mutant ChR2 being used for optogenetics merit specific consideration. A more targeted approach can be taken for engineering mutants that will favorably express/function depending on the cell line used.

Author Contributions

Conceptualization, R.R., S.M., H.W. and R.E.D.; Methodology, R.R., S.M., H.W. and R.E.D.; Investigation, R.R. and S.M.; Writing—Original Draft Preparation, R.R., S.M., H.W. and R.E.D.; Funding Acquisition, H.W. and R.E.D.

Funding

This work was supported by the National Institutes of Health grants P01DA012923 and R01MH054137 (Weinstein lab) and DA026434 and the WPI Research Foundation to Robert Dempski.

Acknowledgments

We gratefully acknowledge the allocations of computational resources at (1) the Cofrin Center for Biological Information of the Institute for Computational Biomedicine at Weill Cornell Medical College, (2) the National Energy Research Scientific Computing Center (NERSC, repository m1710) supported by the Office of Science of the U.S. Department of Energy under Contract No. DE-AC02- 05CH11231 (to H.W.) and (3) NSF Teragrid allocations MCB090132 (to R.E.D).

Conflicts of Interest

The authors declare no conflict of interest. The funders had no role in the design of the study; in the collection, analyses or interpretation of data; in the writing of the manuscript or in the decision to publish the results.

References

  1. Nagel, G.; Ollig, D.; Fuhrmann, M.; Kateriya, S.; Mustl, A.M.; Bamberg, E.; Hegemann, P. Channelrhodopsin-1: A light-gated proton channel in green algae. Science 2002, 296, 2395–2398. [Google Scholar] [CrossRef] [PubMed]
  2. Nagel, G.; Szellas, T.; Huhn, W.; Kateriya, S.; Adeishvili, N.; Berthold, P.; Ollig, D.; Hegemann, P.; Bamberg, E. Channelrhodopsin-2, a directly light-gated cation-selective membrane channel. Proc. Natl. Acad. Sci. USA 2003, 100, 13940–13945. [Google Scholar] [CrossRef] [PubMed] [Green Version]
  3. Richards, R.; Dempski, R.E. From phototaxis to biomedical applications: Investigating the molecular mechanism of channelrhodopsins. In Electrophysiology of Unconventional Channels and Pores; Delcour, A.H., Ed.; Springer International Publishing: Cham, Switzerland, 2015; pp. 361–381. [Google Scholar] [CrossRef]
  4. Spudich, J.L.; Sineshchekov, O.A.; Govorunova, E.G. Mechanism divergence in microbial rhodopsins. Biochim. Biophys. Acta Bioenerg. 2014, 1837, 546–552. [Google Scholar] [CrossRef] [PubMed]
  5. Boyden, E.S.; Zhang, F.; Bamberg, E.; Nagel, G.; Deisseroth, K. Millisecond-timescale, genetically targeted optical control of neural activity. Nat. Neurosci. 2005, 8, 1263–1268. [Google Scholar] [CrossRef] [PubMed]
  6. Lin, J.Y.; Lin, M.Z.; Steinbach, P.; Tsien, R.Y. Characterization of engineered channelrhodopsin variants with improved properties and kinetics. Biophys. J. 2009, 96, 1803–1814. [Google Scholar] [CrossRef] [PubMed]
  7. Berndt, A.; Yizhar, O.; Gunaydin, L.A.; Hegemann, P.; Deisseroth, K. Bi-stable neural state switches. Nat. Neurosci. 2009, 12, 229–234. [Google Scholar] [CrossRef]
  8. Bamann, C.; Kirsch, T.; Nagel, G.; Bamberg, E. Spectral characteristics of the photocycle of channelrhodopsin-2 and its implication for channel function. J. Mol. Biol. 2008, 375, 686–694. [Google Scholar] [CrossRef]
  9. Berndt, A.; Prigge, M.; Gradmann, D.; Hegemann, P. Two open states with progressive proton selectivities in the branched channelrhodopsin-2 photocycle. Biophys. J. 2010, 98, 753–761. [Google Scholar] [CrossRef]
  10. Nikolic, K.; Degenaar, P.; Toumazou, C. Modeling and engineering aspects of channelrhodopsin2 system for neural photostimulation. In Proceedings of the Conference of the IEEE Engineering in Medicine and Biology Society, New York, NY, USA, 30 August–3 September 2006; Volume 1, pp. 1626–1629. [Google Scholar] [CrossRef]
  11. Hegemann, P.; Ehlenbeck, S.; Gradmann, D. Multiple photocycles of channelrhodopsin. Biophys. J. 2005, 89, 3911–3918. [Google Scholar] [CrossRef]
  12. Nikolic, K.; Grossman, N.; Grubb, M.S.; Burrone, J.; Toumazou, C.; Degenaar, P. Photocycles of channelrhodopsin-2. Photochem. Photobiol. 2009, 85, 400–411. [Google Scholar] [CrossRef]
  13. Richards, R.; Dempski, R.E. Adjacent channelrhodopsin-2 residues within transmembranes 2 and 7 regulate cation selectivity and distribution of the two open states. J. Biol. Chem. 2017, 292, 7314–7326. [Google Scholar] [CrossRef] [PubMed] [Green Version]
  14. Radu, I.; Bamann, C.; Nack, M.; Nagel, G.; Bamberg, E.; Heberle, J. Conformational changes of channelrhodopsin-2. J. Am. Chem. Soc. 2009, 131, 7313–7319. [Google Scholar] [CrossRef] [PubMed]
  15. Lorenz-Fonfria, V.A.; Bamann, C.; Resler, T.; Schlesinger, R.; Bamberg, E.; Heberle, J. Temporal evolution of helix hydration in a light-gated ion channel correlates with ion conductance. Proc. Natl. Acad. Sci. USA 2015, 112, E5796–E5804. [Google Scholar] [CrossRef] [PubMed] [Green Version]
  16. Sattig, T.; Rickert, C.; Bamberg, E.; Steinhoff, H.J.; Bamann, C. Light-induced movement of the transmembrane HelixB in channelrhodopsin-2. Angew. Chem. (Int. Ed.) 2013, 52, 9705–9708. [Google Scholar] [CrossRef] [PubMed]
  17. Kuhne, J.; Eisenhauer, K.; Ritter, E.; Hegemann, P.; Gerwert, K.; Bartl, F. Early formation of the ion-conducting pore in channelrhodopsin-2. Angew. Chem. (Int. Ed.) 2015, 54, 4953–4957. [Google Scholar] [CrossRef]
  18. Mondal, S.; Khelashvili, G.; Weinstein, H. Not just an oil slick: How the energetics of protein-membrane interactions impacts the function and organization of transmembrane proteins. Biophys. J. 2014, 106, 2305–2316. [Google Scholar] [CrossRef]
  19. Mondal, S.; Johnston, J.M.; Wang, H.; Khelashvili, G.; Filizola, M.; Weinstein, H. Membrane driven spatial organization of GPCRs. Sci. Rep. 2013, 3, 2909. [Google Scholar] [CrossRef]
  20. Chawla, U.; Jiang, Y.; Zheng, W.; Kuang, L.; Perera, S.M.; Pitman, M.C.; Brown, M.F.; Liang, H. A usual g-protein-coupled receptor in unusual membranes. Angew. Chem. Int. Ed. Engl. 2016, 55, 588–592. [Google Scholar] [CrossRef]
  21. Periole, X. Interplay of G protein-coupled receptors with the membrane: Insights from supra-atomic coarse grain molecular dynamics simulations. Chem. Rev. 2017, 117, 156–185. [Google Scholar] [CrossRef]
  22. Mondal, S.; Khelashvili, G.; Shi, L.; Weinstein, H. The cost of living in the membrane: A case study of hydrophobic mismatch for the multi-segment protein LeuT. Chem. Phys. Lipids 2013, 169, 27–38. [Google Scholar] [CrossRef] [Green Version]
  23. Botelho, A.V.; Huber, T.; Sakmar, T.P.; Brown, M.F. Curvature and hydrophobic forces drive oligomerization and modulate activity of rhodopsin in membranes. Biophys. J. 2006, 91, 4464–4477. [Google Scholar] [CrossRef] [PubMed]
  24. Khelashvili, G.; Weinstein, H. Functional mechanisms of neurotransmitter transporters regulated by lipid-protein interactions of their terminal loops. Biochim. Biophys. Acta 2015, 1848, 1765–1774. [Google Scholar] [CrossRef] [PubMed]
  25. De Jesus-Perez, J.J.; Cruz-Rangel, S.; Espino-Saldana, A.E.; Martinez-Torres, A.; Qu, Z.; Hartzell, H.C.; Corral-Fernandez, N.E.; Perez-Cornejo, P.; Arreola, J. Phosphatidylinositol 4,5-bisphosphate, cholesterol and fatty acids modulate the calcium-activated chloride channel TMEM16A (ANO1). Biochim. Biophys. Acta 2018, 1863, 299–312. [Google Scholar] [CrossRef] [PubMed]
  26. Peters, C.J.; Gilchrist, J.M.; Tien, J.; Bethel, N.P.; Qi, L.; Chen, T.; Wang, L.; Jan, Y.N.; Grabe, M.; Jan, L.Y. the sixth transmembrane segment is a major gating component of the tmem16a calcium-activated chloride channel. Neuron 2018, 97, 1063–1077. [Google Scholar] [CrossRef] [PubMed]
  27. Mondal, S.; Khelashvili, G.; Shan, J.; Andersen, O.S.; Weinstein, H. Quantitative modeling of membrane deformations by multihelical membrane proteins: Application to G-protein coupled receptors. Biophys. J. 2011, 101, 2092–2101. [Google Scholar] [CrossRef] [PubMed]
  28. Huang, H.W. Deformation free energy of bilayer membrane and its effect on gramicidin channel lifetime. Biophys. J. 1986, 50, 1061–1070. [Google Scholar] [CrossRef] [Green Version]
  29. Arenkiel, B.R.; Peca, J.; Davison, I.G.; Feliciano, C.; Deisseroth, K.; Augustine, G.J.; Ehlers, M.D.; Feng, G.P. In vivo light-induced activation of neural circuitry in transgenic mice expressing channelrhodopsin-2. Neuron 2007, 54, 205–218. [Google Scholar] [CrossRef]
  30. Douglass, A.D.; Kraves, S.; Deisseroth, K.; Schier, A.F.; Engert, F. Escape behavior elicited by single, Channelrhodopsin-2-evoked spikes in zebrafish somatosensory neurons. Curr. Biol. 2008, 18, 1133–1137. [Google Scholar] [CrossRef]
  31. Zhang, F.; Wang, L.-P.; Boyden, E.S.; Deisseroth, K. Channelrhodopsin-2 and optical control of excitable cells. Nat. Methods 2006, 3, 785–792. [Google Scholar] [CrossRef]
  32. Richards, R.; Dempski, R.E. Re-introduction of transmembrane serine residues reduce the minimum pore diameter of channelrhodopsin-2. PLoS ONE 2012, 7, e50018. [Google Scholar] [CrossRef]
  33. Shan, J.; Khelashvili, G.; Mondal, S.; Mehler, E.L.; Weinstein, H. Ligand-dependent conformations and dynamics of the serotonin 5-HT(2A) receptor determine its activation and membrane-driven oligomerization properties. PLoS Comput. Biol. 2012, 8, e1002473. [Google Scholar] [CrossRef]
  34. Khelashvili, G.; Doktorova, M.; Sahai, M.A.; Johner, N.; Shi, L.; Weinstein, H. Computational modeling of the N-terminus of the human dopamine transporter and its interaction with PIP2-containing membranes. Proteins 2015, 83, 952–969. [Google Scholar] [CrossRef] [PubMed]
  35. Khelashvili, G.; Stanley, N.; Sahai, M.A.; Medina, J.; LeVine, M.V.; Shi, L.; De Fabritiis, G.; Weinstein, H. Spontaneous inward opening of the dopamine transporter is triggered by PIP2-regulated dynamics of the N-terminus. ACS Chem. Neurosci. 2015, 6, 1825–1837. [Google Scholar] [CrossRef] [PubMed]
  36. Kato, H.E.; Zhang, F.; Yizhar, O.; Ramakrishnan, C.; Nishizawa, T.; Hirata, K.; Ito, J.; Aita, Y.; Tsukazaki, T.; Hayashi, S.; et al. Crystal structure of the channelrhodopsin light-gated cation channel. Nature 2012, 482, 369–374. [Google Scholar] [CrossRef] [PubMed] [Green Version]
  37. Richards, R.; Dempski, R.E. Cysteine substitution and labeling provide insight into channelrhodopsin-2 ion conductance. Biochemistry 2015, 54, 5665–5668. [Google Scholar] [CrossRef] [PubMed]
  38. Roberts, E.; Eargle, J.; Wright, D.; Luthey-Schulten, Z. MultiSeq: Unifying sequence and structure data for evolutionary analysis. BMC Bioinform. 2006, 7, 382. [Google Scholar] [CrossRef]
  39. Volkov, O.; Kovalev, K.; Polovinkin, V.; Borshchevskiy, V.; Bamann, C.; Astashkin, R.; Marin, E.; Popov, A.; Balandin, T.; Willbold, D.; et al. Structural insights into ion conduction by channelrhodopsin 2. Science 2017, 358, eaan8862. [Google Scholar] [CrossRef]
  40. Yau, W.M.; Wimley, W.C.; Gawrisch, K.; White, S.H. The preference of tryptophan for membrane interfaces. Biochemistry 1998, 37, 14713–14718. [Google Scholar] [CrossRef]
  41. Ben-Tal, N.; Ben-Shaul, A.; Nicholls, A.; Honig, B. Free-energy determinants of alpha-helix insertion into lipid bilayers. Biophys. J. 1996, 70, 1803–1812. [Google Scholar] [CrossRef] [Green Version]
  42. Sankararamakrishnan, R.; Weinstein, H. Positioning and stabilization of dynorphin peptides in membrane bilayers: The mechanistic role of aromatic and basic residues revealed from comparative MD simulations. J. Phys. Chem. B 2002, 106, 209–218. [Google Scholar] [CrossRef]
  43. Gray, T.M.; Matthews, B.W. Intrahelical hydrogen bonding of serine, threonine and cysteine residues within alpha-helices and its relevance to membrane-bound proteins. J. Mol. Biol. 1984, 175, 75–81. [Google Scholar] [CrossRef]
  44. Eisenhaber, F.; Lijnzaad, P.; Argos, P.; Sander, C.; Scharf, M. The double cubic lattice method—Efficient approaches to numerical-integration of surface-area and volume and to dot surface contouring of molecular assemblies. J. Comput. Chem. 1995, 16, 273–284. [Google Scholar] [CrossRef]
  45. Nielsen, C.; Goulian, M.; Andersen, O.S. Energetics of inclusion-induced bilayer deformations. Biophys. J. 1998, 74, 1966–1983. [Google Scholar] [CrossRef]
  46. Gaiko, O.; Dempski, R.E. Transmembrane domain three contributes to the ion conductance pathway of channelrhodopsin-2. Biophys. J. 2013, 104, 1230–1237. [Google Scholar] [CrossRef] [PubMed]
  47. Talathi, S.S.; Carney, P.R.; Khargonekar, P.P. Control of neural synchrony using channelrhodopsin-2: A computational study. J. Comput. Biol. 2011, 31, 87–103. [Google Scholar] [CrossRef] [PubMed]
  48. Williams, J.C.; Xu, J.; Lu, Z.; Klimas, A.; Chen, X.; Ambrosi, C.M.; Cohen, I.S.; Entcheva, E. Computational optogenetics: Empirically-derived voltage- and light-sensitive channelrhodopsin-2 model. PLoS Comput. Biol. 2013, 9, e1003220. [Google Scholar] [CrossRef]
  49. Wang, J.; Hasan, M.T.; Seung, H.S. Laser-evoked synaptic transmission in cultured hippocampal neurons expressing channelrhodopsin-2 delivered by adeno-associated virus. J. Neurosci. Methods 2009, 183, 165–175. [Google Scholar] [CrossRef] [Green Version]
  50. Bruegmann, T.; Malan, D.; Hesse, M.; Beiert, T.; Fuegemann, C.J.; Fleischmann, B.K.; Sasse, P. Optogenetic control of heart muscle in vitro and in vivo. Nat. Methods 2010, 7, 897–900. [Google Scholar] [CrossRef]
  51. Khelashvili, G.; Mondal, S.; Andersen, O.S.; Weinstein, H. Cholesterol modulates the membrane effects and spatial organization of membrane-penetrating ligands for G-protein coupled receptors. J. Phys. Chem. B 2010, 114, 12046–12057. [Google Scholar] [CrossRef]
  52. Krause, N.; Engelhard, C.; Heberle, J.; Schlesinger, R.; Bittl, R. Structural differences between the closed and open states of channelrhodopsin-2 as observed by EPR spectroscopy. FEBS Lett. 2013, 587, 3309–3313. [Google Scholar] [CrossRef] [Green Version]
  53. Arango-Lievano, M.; Sensoy, O.; Borie, A.; Corbani, M.; Guillon, G.; Sokoloff, P.; Weinstein, H.; Jeanneteau, F. A GIPC1-palmitate switch modulates dopamine drd3 receptor trafficking and signaling. Mol. Cell. Biol. 2016, 36, 1019–1031. [Google Scholar] [CrossRef] [PubMed]
  54. Sensoy, O.; Weinstein, H. A mechanistic role of Helix 8 in GPCRs: Computational modeling of the dopamine D2 receptor interaction with the GIPC1-PDZ-domain. Biochim. Biophys. Acta 2015, 1848, 976–983. [Google Scholar] [CrossRef] [PubMed]
  55. Perez-Aguilar, J.M.; Shan, J.; LeVine, M.V.; Khelashvili, G.; Weinstein, H. A functional selectivity mechanism at the serotonin-2A GPCR involves ligand-dependent conformations of intracellular loop 2. J. Am. Chem. Soc. 2014, 136, 16044–16054. [Google Scholar] [CrossRef] [PubMed]
  56. Kaczor, A.A.; Rutkowska, E.; Bartuzi, D.; Targowska-Duda, K.M.; Matosiuk, D.; Selent, J. Computational methods for studying G protein-coupled receptors (GPCRs). Methods Cell Biol. 2016, 132, 359–399. [Google Scholar] [CrossRef] [PubMed]
  57. LeVine, M.V.; Khelashvili, G.; Shi, L.; Quick, M.; Javitch, J.A.; Weinstein, H. Role of annular lipids in the functional properties of leucine transporter LeuT proteomicelles. Biochemistry 2016, 55, 850–859. [Google Scholar] [CrossRef] [PubMed]
  58. Razavi, A.M.; Khelashvili, G.; Weinstein, H. How structural elements evolving from bacterial to human SLC6 transporters enabled new functional properties. BMC Biol. 2018, 16, 31. [Google Scholar] [CrossRef] [PubMed]
  59. Takemoto, M.; Kato, H.E.; Koyama, M.; Ito, J.; Kamiya, M.; Hayashi, S.; Maturana, A.D.; Deisseroth, K.; Ishitani, R.; Nureki, O. Molecular dynamics of channelrhodopsin at the early stages of channel opening. PLoS ONE 2015, 10, e0131094. [Google Scholar] [CrossRef]
  60. Nakanishi, T.; Kanada, S.; Murakami, M.; Ihara, K.; Kouyama, T. Large deformation of helix F during the photoreaction cycle of pharaonis halorhodopsin in complex with azide. Biophys. J. 2013, 104, 377–385. [Google Scholar] [CrossRef]
  61. Radzwill, N.; Gerwert, K.; Steinhoff, H.J. Time-resolved detection of transient movement of helices F and G in doubly spin-labeled bacteriorhodopsin. Biophys. J. 2001, 80, 2856–2866. [Google Scholar] [CrossRef]
  62. Muller, M.; Bamann, C.; Bamberg, E.; Kuhlbrandt, W. Light-induced helix movements in channelrhodopsin-2. J. Mol. Biol. 2015, 427, 341–349. [Google Scholar] [CrossRef]
  63. Piscitelli, C.L.; Krishnamurthy, H.; Gouaux, E. Neurotransmitter/sodium symporter orthologue LeuT has a single high–affinity substrate site. Nature 2010, 468, 1129–1132. [Google Scholar] [CrossRef] [PubMed]
  64. Hamazaki, K.; Kim, H.-Y. Differential modification of the phospholipid profile by transient ischemia in rat hippocampal CA1 and CA3 regions. ProstaglandinsLeukot. Essent. Fat. Acids 2013, 88, 299–306. [Google Scholar] [CrossRef] [PubMed] [Green Version]
  65. Jones, H.E.; Harwood, J.L.; Bowen, I.D.; Griffiths, G. Lipid composition of subcellular membranes from larvae and prepupae of Drosophila melanogaster. Lipids 1992, 27, 984–987. [Google Scholar] [CrossRef] [PubMed]
  66. Norton, W.T.; Abe, T.; Poduslo, S.E.; DeVries, G.H. The lipid composition of isolated brain cells and axons. J. Neurosci. Res. 1975, 1, 57–75. [Google Scholar] [CrossRef] [PubMed]
Figure 1. Channelrhodopsin-2 (ChR2) four-state model. Four-state kinetic model of ChR2 with two conducting (O1 and O2) and two non-conducting (C1 and C2) states. Each transition is represented by the corresponding rate parameter used in the kinetic model. The blue arrows represent light-assisted transitions.
Applsci 09 02674 g001
Figure 2. Homology model comparison and structural context of hydrophobic mismatch. (A) Structural alignment of the ChR2 homology model (lime) used for the calculations and the ChR2 X-ray structure (blue). (B) The averaged membrane deformation around ChR2 is shown on a snapshot of the protein, with the residues where residual hydrophobic mismatch (RHM) occurs highlighted. The membrane deformations are shown in terms of the time averaged phosphate surface around the centered protein and water penetration. RMSD: Root mean square deviation
Applsci 09 02674 g002
Figure 3. Representative photocurrent traces for RHM ChR2 mutants. Photocurrents were recorded in Na+ solution at pH 7.5 at Vm = −100 mV. Blue bar indicates illumination with blue light. WT—blue; Q73A—purple; I95L—yellow; Q210A—red; Q210N—green; V269N—orange.
Applsci 09 02674 g003
Figure 4. Biophysical characterization of RHM-affecting mutants. (A) Representative steady-state current-voltage relationship of select mutants in Na+ 6.0 solution. (B) Absolute reversal potentials determined at Ip and Iss in Na+ solutions at either pH 6.0 or 7.5. (C) Differences in Erev determined as noted. (D) Steady-state to peak current ratios, which are a measure of ChR2 inactivation. Values are reported as the average ± SEM (n = 7–15). Statistically significant values are denoted with * (p < 0.05). WT—blue; Q210A—red; Q210N—green; V269N—orange.
Applsci 09 02674 g004
Figure 5. Kinetic properties of RHM-affecting mutants. (A) Summary of exponential fitting of apparent rate constants. (B) Decay rate comparison of RHM-affecting and null ChR2 mutants. (C) Off rate comparison of RHM-affecting and null ChR2 mutants. Error bars represent the SEM (n = 7–15). Statistically significant differences are denoted by * (p < 0.05). WT—blue; Q210A—red; Q210N—green; V269N—orange.
Applsci 09 02674 g005
Figure 6. Four-state photocycle theoretical fits. Theoretical fits were obtained by parameter optimization and objective function minimization as described in the Materials and Methods. Solid black line is the experimental average while the dashed red line is the average theoretical fit.
Applsci 09 02674 g006
Table 1. Percent change of residual hydrophobic mismatch for channelrhodopsin-2 when compared to wild type protein, calculated with respect to the RHM of the entire protein. The average energy cost of RHM for WT channelrhodopsin-2 and select mutant constructs embedded in a POPC bilayer was calculated for the entire ChR2 homology model across the bilayer (top row) and leaving out TM1 residues modeled as being in a loop (bottom row). The relative rank of differences among the constructs is unchanged under the two conditions. These differences in RHM among constructs are consistent with the pattern of experimentally observed differences in the function of the constructs.
WT (kT)V259S (kT) (% RHM Decrease)V269N (kT) (% RHM Decrease)Q210A (kT) (% RHM Decrease)
12.17.7 (36%)5.8 (52%)3.1 (74%)
73.7 (47%)3 (56%)2.3 (67%)
Table 2. Summary of reversal potentials. The superscript denoted the pH of the solution used. Values are reported at the average ± SEM (n = 7–15). Statistically significant values are denoted with * (p < 0.05).
ConstructIp7.5Iss7.5Ip6.0Iss6.0Iss-Ip 7.5Iss-Ip 6.0Iss6.0 – Iss7.5Ip6.0 – Ip7.5
WT4.30 ± 1.9−9.84 ± 0.852.5 ± 2.724.6 ± 1.5−14.1 ± 2.1−27.8 ± 3.134.5 ± 1.748.2 ± 3.3
Q210A9.39 ± 0.8−6.20 ± 1.554.2 ± 2.620.1 ± 1.8−15.6 ± 1.8−34.1 ± 3.226.3 ± 2.444.8 ± 2.7
V269N10.6 ± 0.4−7.58 ± 0.775.0 ± 4.6 *13.2 ± 1.2 *−18.2 ± 0.8−61.8 ± 4.8 *20.7 ± 1.4 *64.4 4.7 *
Q210N−1.55 ± 2.2−8.5 ± 1.645.3 ± 1.228.2 ± 1.3−6.9 ± 2.7 *−17.0 ± 1.8 *36.7 ± 2.146.9 ± 2.5
Table 3. Summary of parameter optimization for the four-state photocycle model. Values are the average of parameters obtained from each cell ± SEM (n = 3–7). Statistically significant values are denoted with * (p < 0.05).
Constructk1k2Gd1 (ms−1)Gd2 (ms−1)e12 (ms−1)e21 (ms−1)ImaxγGr (ms−1)TChR2 (ms)
WT0.26 ± 0.010.081 ± 0.010.24 ± 0.030.015 ± 0.0050.038 ± 0.0040.0057 ± 0.00040.57 ± 0.060.036 ± 0.0070.0071 ± 0.0010.73 ± 0.08
Q210A0.30 ± 0.0010.028 ± 0.0070.16 ± 0.040.0055 ± 0.001 *0.036 ± 0.0030.010 ± 0.001 *0.45 ± 0.080.050 ± 0.010.0093 ± 0.002 *0.61 ± 0.03
V269N0.30 ± 0.0020.037 ± 0.020.13 ± 0.050.006 ± 0.0030.061 ± 0.009 *0.012 ± 0.001 *0.25 ± 0.050.035 ± 0.0050.030 ± 0.01 *0.63 ± 0.2
Q210N0.30 ± 0.030.058 ± 0.010.34 ± 0.030.013 ± 0.0050.052 ± 0.002 *0.0067 ± 0.00061.7 ± 0.20.020 ± 0.0040.0074 ± 0.0011.45 ± 0.05
Table 4. State population comparison. The population of O1 and O2 were determined at specific time points as described in the text. Values are shown as a fraction of the maximum occupancy, i.e., O1 + O2 + C1 + C2 = 1.
State PopulationWTQ210AV269NQ210N
Time to Peak (ms)8.07.75.37.3
O1 Peak0.460.550.520.38
O2 Peak0.090.100.110.09
O1 Stat0.130.190.160.10
O2 Stat0.650.610.670.65

