1. Introduction
Breast cancer has become a common cancer that affects females worldwide, which is a significant public health issue, with incidence and mortality rates increasing rapidly since the 1980s [
1]. The incidence and modality of breast cancer is 24.2% and 15%, respectively, according to the estimated age-standardized mortality rates (World) in 2018. Furthermore, breast cancer has been the top cancer among females in all ages [
2]. However, breast cancer survival has improved since the mid-1970s. The decline in cancer mortality over the past two decades is primarily the result of advances in early detection and treatment, which is reflected in considerable decreases for the breast cancer [
3]. Specifically, the death rate dropped 39% from 1989 to 2015 for female breast cancer. Therefore, to reduce the mortality and incidence rate, early screening for breast cancer is critical [
4,
5]. Ultrasonography is an essential method for medical imaging. Compared with other imaging techniques, ultrasound is inexpensive, harmless, and enables easy real-time imaging for medical diagnosis [
6]. Ultrasound computer tomography (USCT) is an emerging imaging method and a good prospect in the detection of breast cancer [
7]. This approach has several advantages for breast cancer screening compared with classical ultrasonography [
8]. Ultrasound tomography not only overcomes the reliance on the operator’s experience but also has potential clinical benefits, such as comfort, safety, and 3D imaging [
9]. The transducer is the key component of the USCT system. With the development of the micro-electro-mechanical system (MEMS), the piezoelectric micromachined ultrasonic transducer (PMUT) has become a potential alternative to classical piezoelectric transducers. The potential benefits of the PMUT are its miniaturized size, excellent consistency, and good performance [
10].
Ultrasound produces multi-perspective images with high resolution, allowing the assessment of the morphology, orientation, internal structure, and margins of lesions in both dense glandular structures and predominantly fatty breast tissue [
11]. The surrounding tissue, shape, size, number, stiffness, margin contour, and boundary of a lesion are significant factors to consider for its classification [
12]. Generally, breast cancer tissue is harder than the adjacent normal breast tissue. This property serves as the basis for some examinations, such as elastography [
13]. However, elastography images cannot distinguish between lesions and surrounding tissue when their elasticity properties are the same, and the quality of the elastography image is limited by the depth of a lesion [
14]. In our previous work, a breast ultrasound imaging system with the cylindrical motion of the PMUT linear array was developed. Pulse-echo tomography was used to detect the size, location, and contour of a breast mass. Ultrasound energy decreases during the transmission of ultrasonic waves in the body [
15], and the degree of ultrasound attenuation depends on the type of the tissue and ultrasound wave [
16]. The attenuation coefficients vary among different tissues, and the attenuation is affected by the frequency. The higher the frequency, the greater the attenuation [
17]. Ultrasound attenuation occurs during the forward propagation of the body and the return of sound waves. Therefore, the pulse-echo intensity of deep tissue is significantly lower than its initial intensity [
18]. The breast is made up of breast glands and other soft tissues without bones, which would cause extensive attenuation and scatter the transmitted signal energy [
19].
In order to accurately detect breast masses and obtain more detailed internal characteristic information, the time gain compensation (TGC) technique is frequently used to compensate for ultrasound attenuation [
20]. The TGC technique is generally realized by using a hardware circuit, and it needs artificial adjustment of parameters and an operator’s intervention [
21]. The attenuation coefficients of different tissues can be assessed automatically, and adaptive TGC can be achieved by means of software. Thus, it will have an important impact on further improving the quality of the breast ultrasound images [
22]. The key of this algorithm is the automatic estimation of the attenuation coefficient. The methods of extracting the attenuation coefficient mainly include time domain and frequency domain approaches [
23,
24]. Because the time domain method cannot remove the effect of ultrasonic diffusion on the attenuation coefficient evaluation and the calculation is complex [
25,
26,
27], the frequency domain method is used to obtain local attenuation information. In this study, an improved ultrasound tomography algorithm based on a system with cylindrical motions of the PMUT linear array was designed. Spectral cross-correlation was adopted to evaluate the attenuation coefficients. According to the acquired attenuation coefficients, TGC compensates for the pulse-echo signal. The algorithm was validated by simulation and experiment.
2. Principles and Algorithms
R(
f,
z) represents the intensity of the backscattered radio frequency (RF) signal that is obtained by the PMUT. It can be represented by Equation (1) in the frequency domain:
where
f is the wave frequency,
z denotes the depth of the ROI from the transducer,
G(
f) is the transmit pulse,
A(
f,
z) is the attenuation, and
B(
f) is the backscattering. It is generally accepted that
G(
f) can be modeled using a Gaussian function, and the Gaussian-shaped envelope is denoted by Equation (2) in the frequency domain:
where
fc denotes the center frequency and
σ2 represents the variance of the transmit pulse.
A(
f,
z) denotes the accumulated attenuation of the ultrasound in soft tissue. In a medium with a uniform attenuation property, the cumulative attenuation can be expressed as:
where
is the coefficient of attenuation expressed in Np/cm.
is commonly assumed to be linearly proportional to the frequency
f and can be therefore written as
[
16]. Equation (3) can then be expressed as Equation (4):
where
βN denotes the attenuation coefficient in Np/MHz/cm.
B(
f) in Equation (1) represents the backscattered echo signals, and it is modeled as a random process as a result of the abundant random scattering in soft tissue.
B(
f) is given by an exponential form that is expanded by the Taylor series, as denoted by Equation (5).
B(
f) is then used to derive a close-form expression for the spectral shift in the frequency domain [
17]:
Higher-order terms in the Taylor series expansion are ignored in Equation (5). For human tissue, the typical values of
n range from 1 to 2.
S(
fo) denotes the cross-correlation function between two power spectra at different depths and it can be expressed as Equation (6):
where
z1 and
z2 (
z1 <
z2) denote two different depths relative to the PMUT, and
fo represents the spectral shift. Since
z1 and
z2 are close, we can assume that the attenuation coefficients at depths
z1 and
z2 are similar. The cross-correlation algorithm is adopted, and the spectral shift between the two power spectra is given by Equation (7):
We can assume that the variance of the Gaussian emission pulse remains constant along the depth, and the relationship between the downshift slope of the center frequency (versus depth) and the attenuation coefficient (expressed in dB/MHz/cm) is given by Equation (8):
where
z denotes the depth from the PMUT and
σ2 represents the variance of the transmit pulse.
fc(
z) represents the center frequency of the power spectrum at depth
z. The method description and precise derivation can be found in the work of Kim and Varghese [
11,
17,
21].
The amplitude of ultrasonic waves in biological tissues decreases exponentially, as described by Equation (9) [
18]:
where
uo is the amplitude of impulse voltage corresponding to the initial sound pressure
p0, and
u is the voltage value at
z under the sound pressure
p. Equation (10) is further used for attenuation compensation, and the value of
β is calculated by Equation (8).
where
k is the compensation coefficient.
Equation (11) shows that the original pulse-echo signal changes exponentially with the distance. If the echo signal is amplified with the compensation coefficient k, it can compensate for the attenuation. The above formulas can be used to realize adaptive TGC for pulse-echo signals. The process of breast ultrasound image reconstruction algorithm based on adaptive TGC is as follows.
Algorithm: Breast ultrasound image reconstruction
1. The slice data (RF data) was acquired from experiments or simulations by using ultrasound transmitting/receiving circuits. Then, we loaded pulse-echo signal data and stored it as a matrix by using MATLAB software. The matrix name was sig.
2. The data were normalized by dividing values by the maximum value of the matrix, and the noise signal was filtered with the Butterworth bandpass filter. The central frequency of the filter was 3 MHz, and the upper cut-off frequency and lower cut-off frequency were 2.8 and 3.2 MHz, respectively. The name of the filtered data matrix was f-sig.
3. Adaptive TGC:
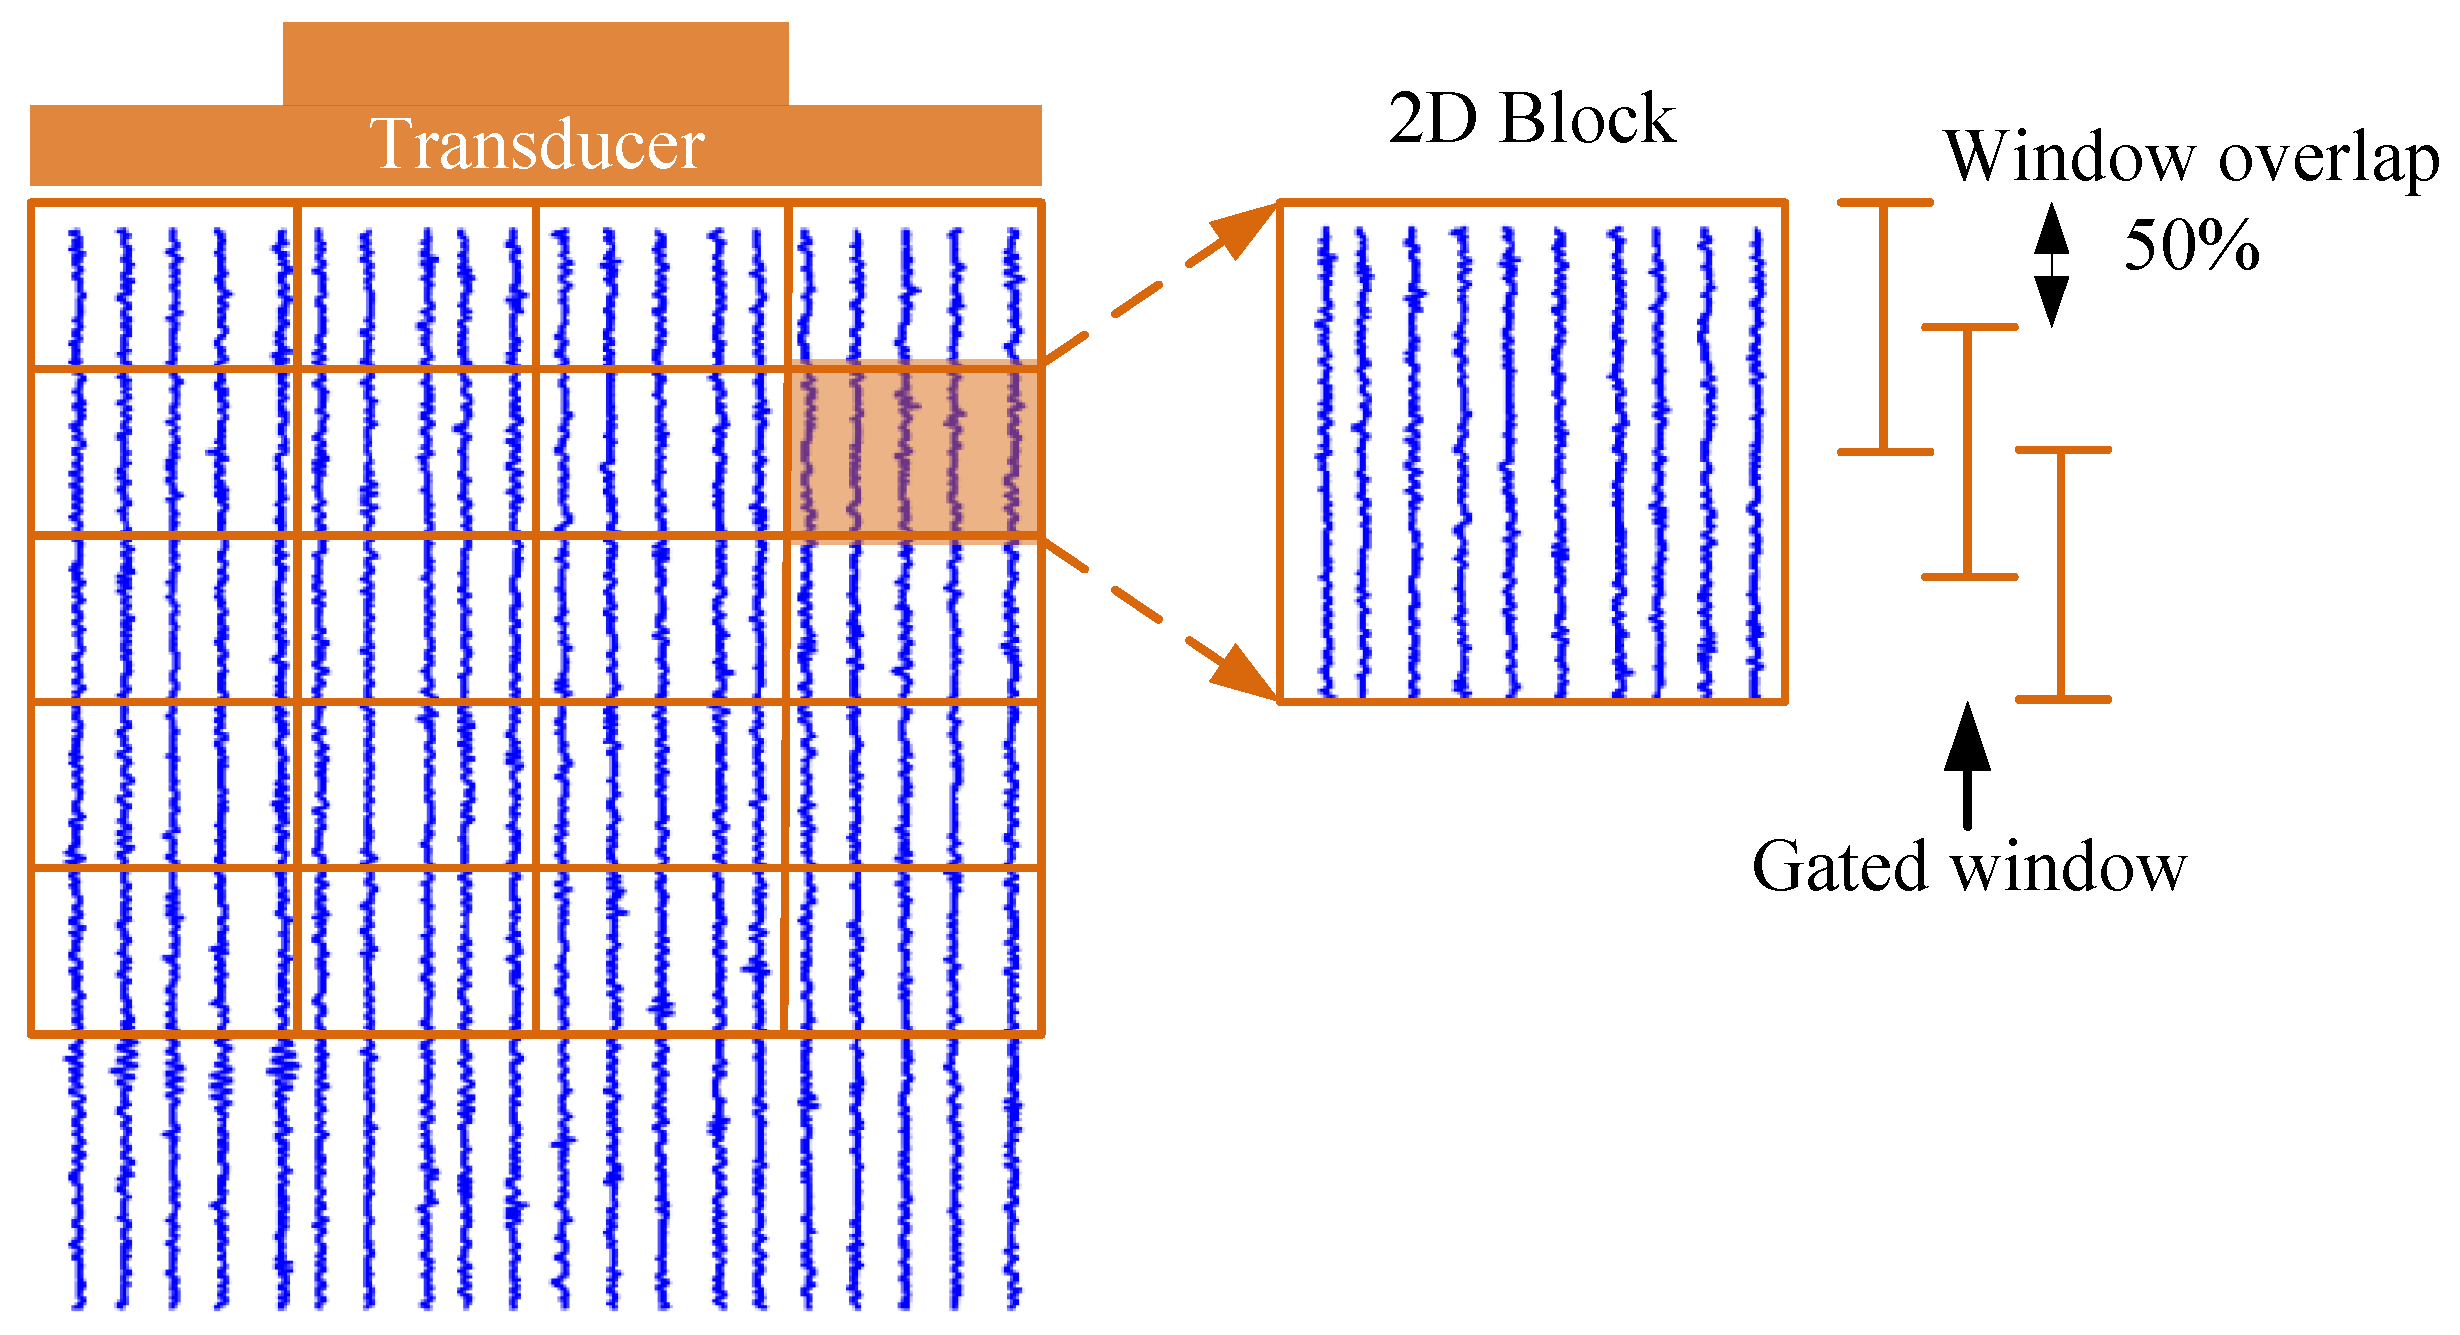
The whole RF dataset was divided into smaller 2D blocks to obtain a consistent power spectrum, and the 2D block diagram is shown in
Figure 1. Each 2D block contained ten A-scan lines in the lateral direction, and each 2D block was divided into a gated window with a 50% window overlap in the depth direction. A Hamming window was utilized to minimize spectral leakage artifacts. The size of the 2D block was 2 × 2 mm. The blocks overlapped along the axial and lateral directions with an overlap rate of 50%. Thirty Fourier spectra within the 2D block were averaged to acquire the 2D block power spectrum. The attenuation coefficient
β was estimated from ten A-scan lines by averaging the attenuation value of blocks in depth. Then,
k was obtained according to Equation (11), and each
k applied to the corresponding ten A-scan lines.
After estimating the 2D block power spectra, the center frequency fc of each 2D block power spectrum was extracted. The different fc values were stored as a matrix. The center frequency downshift between two consecutive power spectra was obtained. The slope of the attenuation between two consecutive power spectra was estimated by calculating the slope of the linear regression of the frequency shift estimates as a function of depth. Then, we estimated the variance σ using the full-width half maximum (FWHM) of the 2D power spectrum. FWHM refers to the full width of the absorption band when the absorption band is half the maximum height, that is, when the power spectrum width when the peak value drops by −6 dB. The slope of the attenuation and the variance σ were put into Equation (7) to obtain the attenuation coefficient β.
After estimating the attenuation coefficient β, k in Equation (11) was calculated. The pulse-echo signals stored in the f-sig matrix were compensated for by multiplying by k.
4. Envelope detection was performed on the signals with the Hilbert transform. Then, logarithmic compression to a 60 dB dynamic range was used.
5. The coordinate transformation using the center of the image as a reference point was used to form the image matrix image-data. Then, the image-data were processed using a morphological algorithm to reconstruct the breast slice image.
To facilitate the understanding of the process of reconstruction,
Figure 2 presents the steps in a flowchart.
3. Ultrasound Simulation Procedure
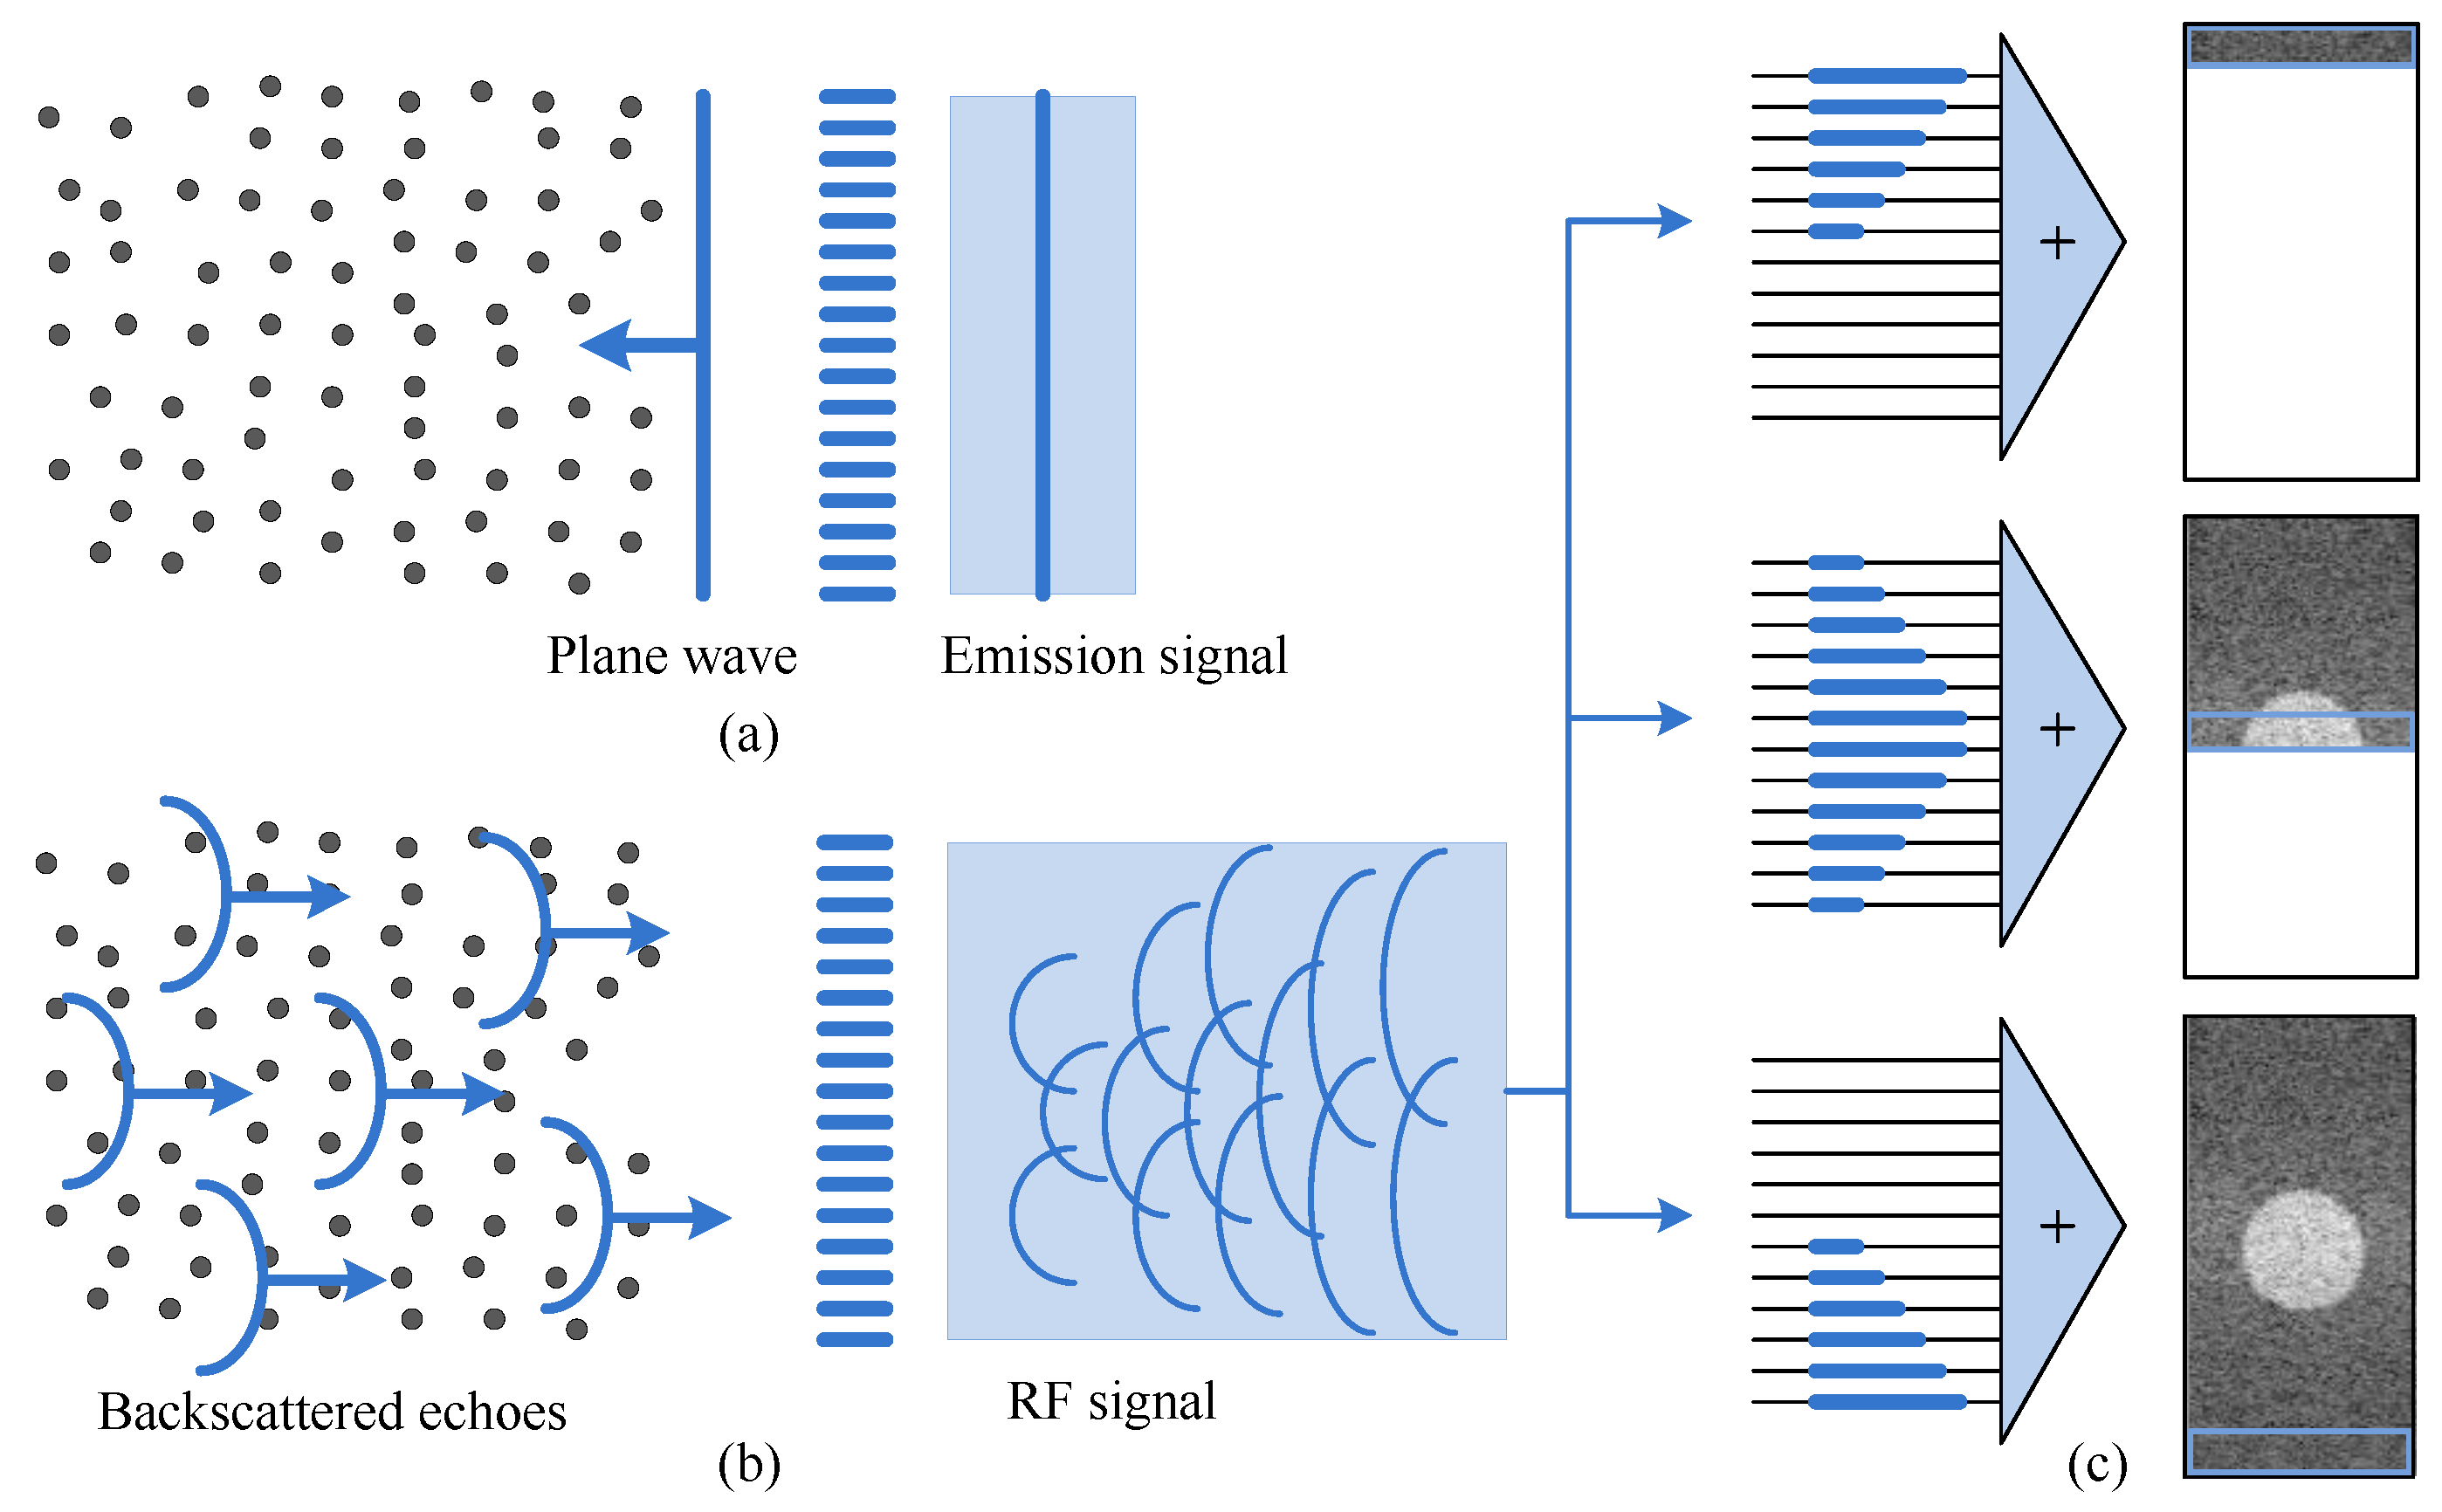
In this study, Field II was used to set the ultrasound transducer and sound field parameters [
19,
20]. A 1 × 128 linear array was used as the transmitting source. A Gaussian pulse with a center frequency of 5 MHz and a bandwidth of 80% was used as the incident pulse. The schematic of the single transmit plane wave method is shown in
Figure 3.
The excitation circuit of the array element was excited simultaneously, and the pulse was transmitted to the target in the form of a wave front. All array elements were transmitted and received together, and then the target was imaged with the received data.
Figure 3a indicates that the emission signal is a plane wave.
Figure 3b shows the RF signals received by the transducer, and
Figure 3c shows that the beamforming procedure is used for imaging. In the experiment, the simulation region of interest was set at 40 mm (width), 10 mm (thickness), and 90 mm (height) to obtain the original RF signal and perform algorithm verification analysis. In the simulation, the scattering was set within a depth of 0–90 mm. We set the scattering density to 5/mm
3. The scattering intensity in the background area was set at 1, the circular strong scattering area was set at an imaging depth of 45 mm, and the area radius was 20 mm. The scattering intensity followed the standard normal distribution within the range of [−10,10], and the attenuation coefficient of the imaging area was set to 0.6 dB/(MHz·cm). The attenuation mass phantom was established as shown in
Figure 4, which shows that the echo signal decreased gradually with the increase in depth because of the attenuation and strong scattering effect. Therefore, it was necessary to compensate for the attenuation of the echo signal.
Here, the procedure for attenuation coefficient estimation is presented. Simulated RF data with a certain attenuation coefficient were generated using a sampling frequency of 100 MHz.
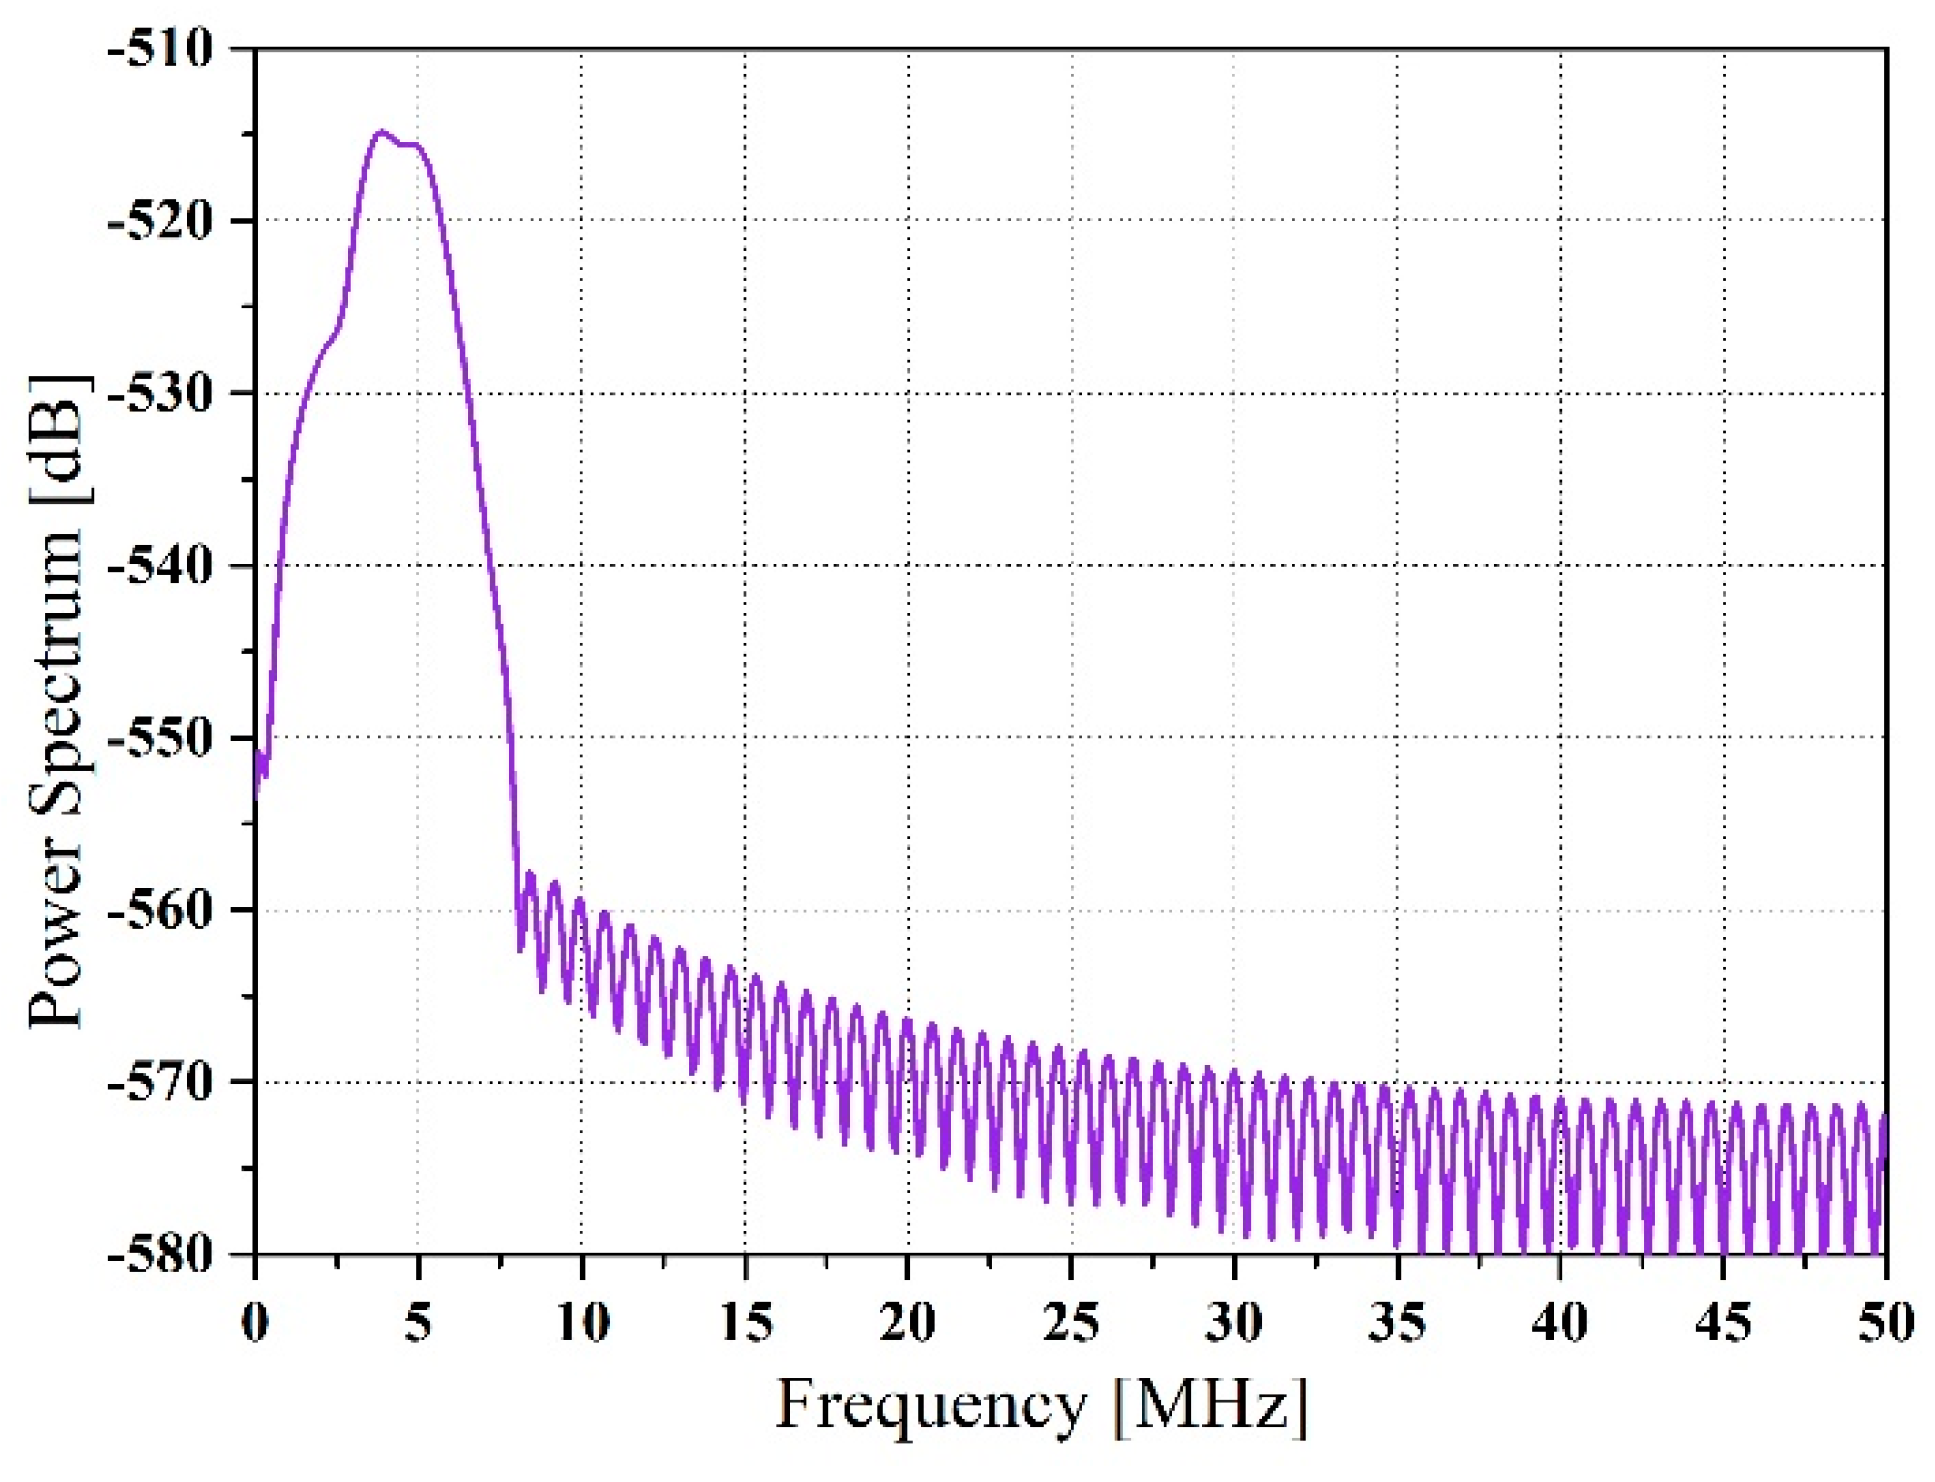
Figure 5 shows a block power spectrum.
The slope of the attenuation coefficients was acquired along the depth direction with a 50% overlap of the blocks. Frequency smoothing was utilized to decrease spectral noise artifacts, where a moving average window was applied to average the adjacent frequency estimates. The center frequency of each power spectrum was extracted, which changed along the depth, as shown in
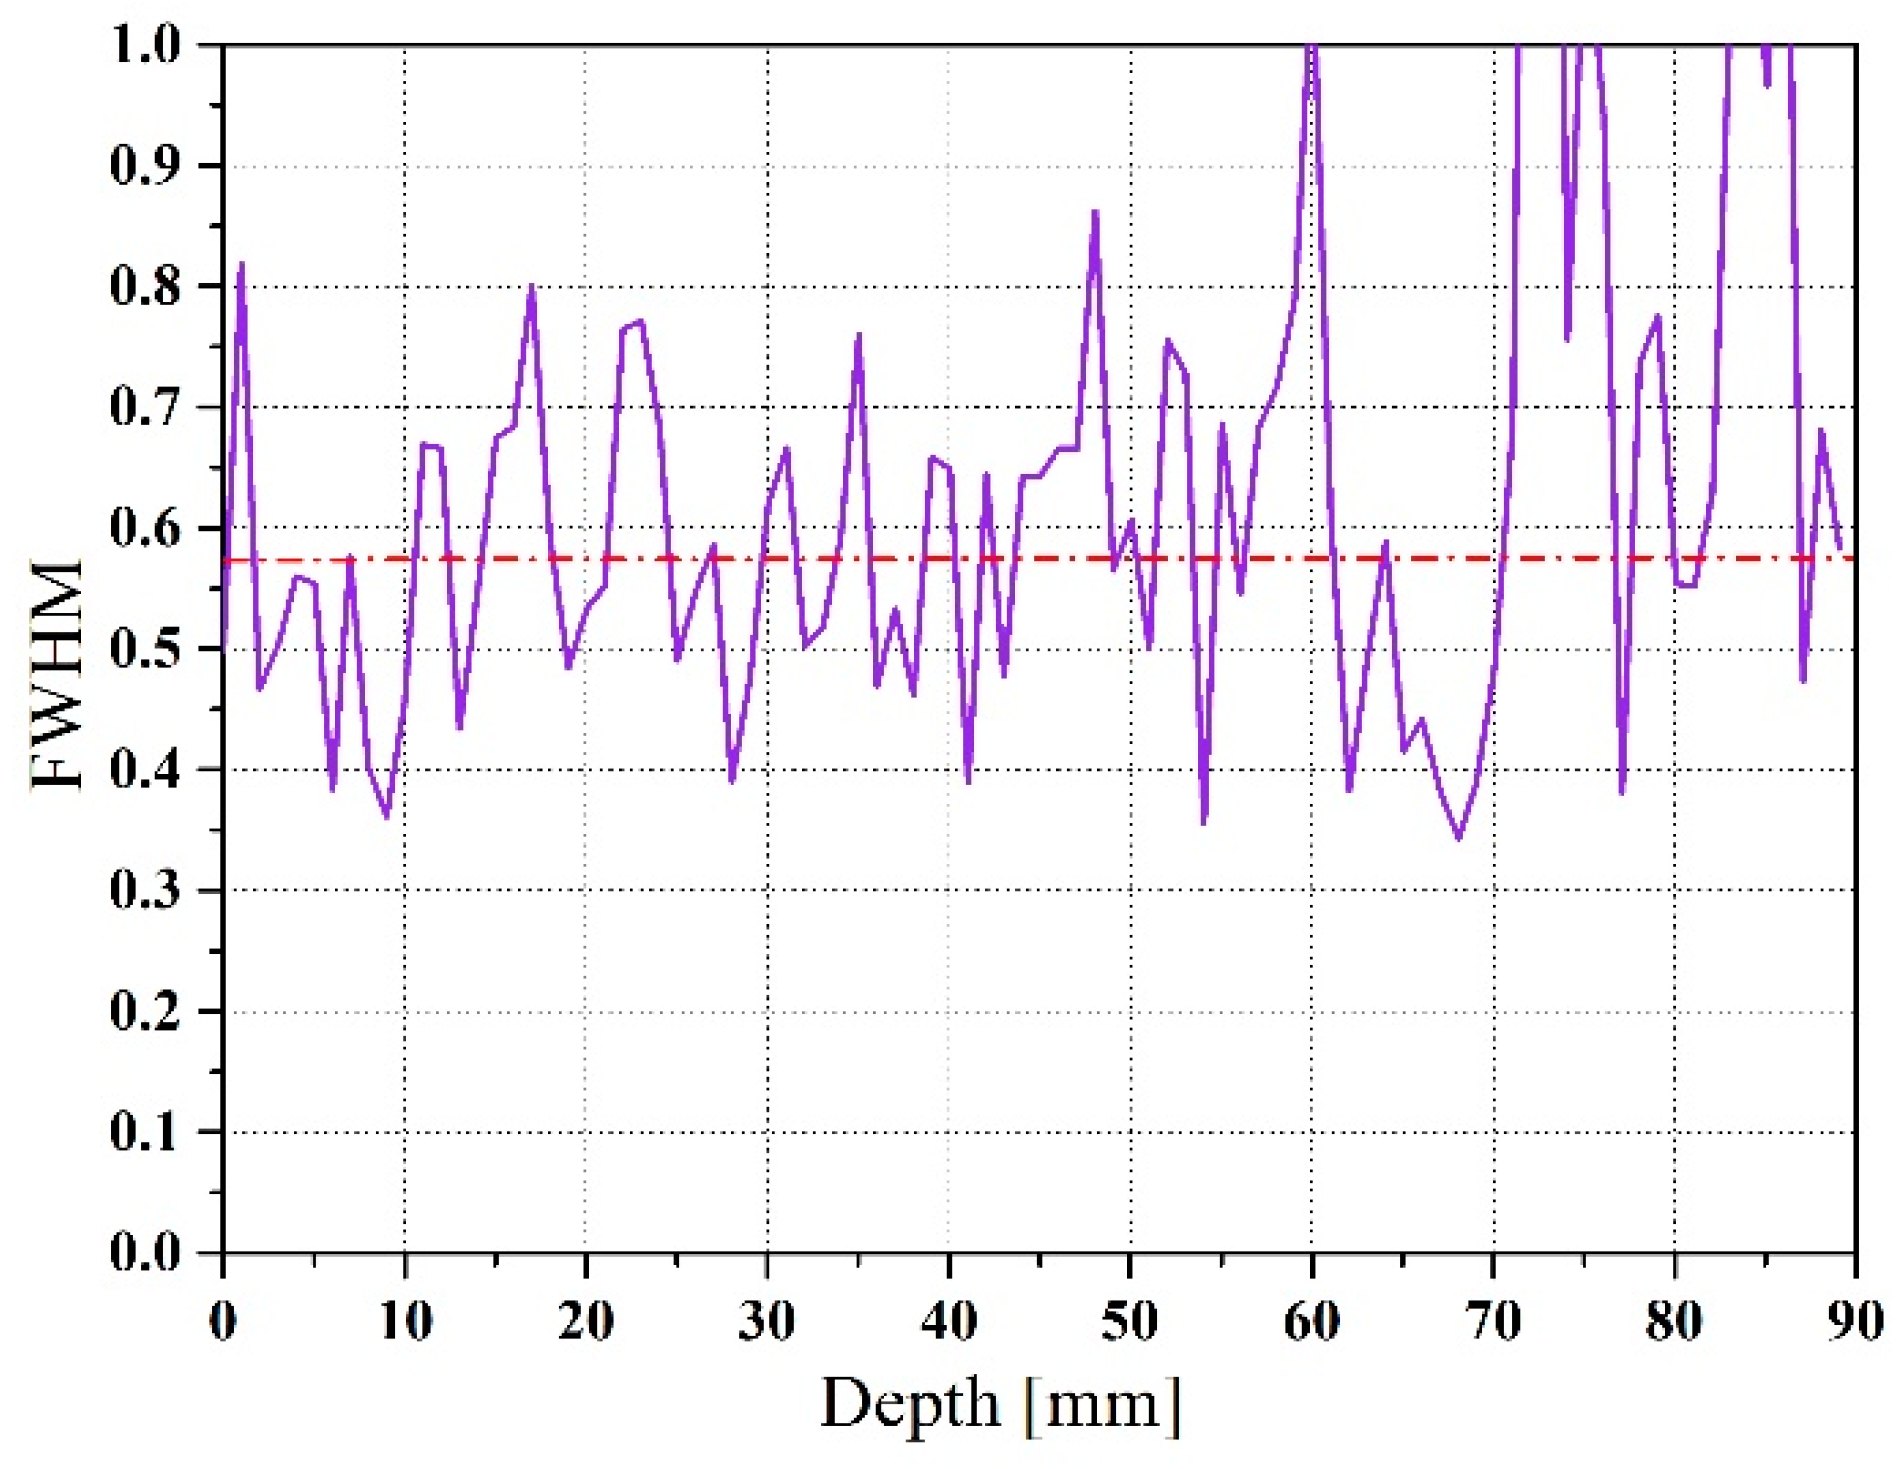
Figure 6.
We assumed that the transmit pulse was generally Gaussian-shaped at the center frequency. Hence, the FWHM was calculated using the block power spectrum. The obtained FWHM was changed into a variance to compute the estimated attenuation coefficient because the relationship between the variance of the Gaussian distribution and the FWHM was known. The estimated FWHM is shown in
Figure 7.
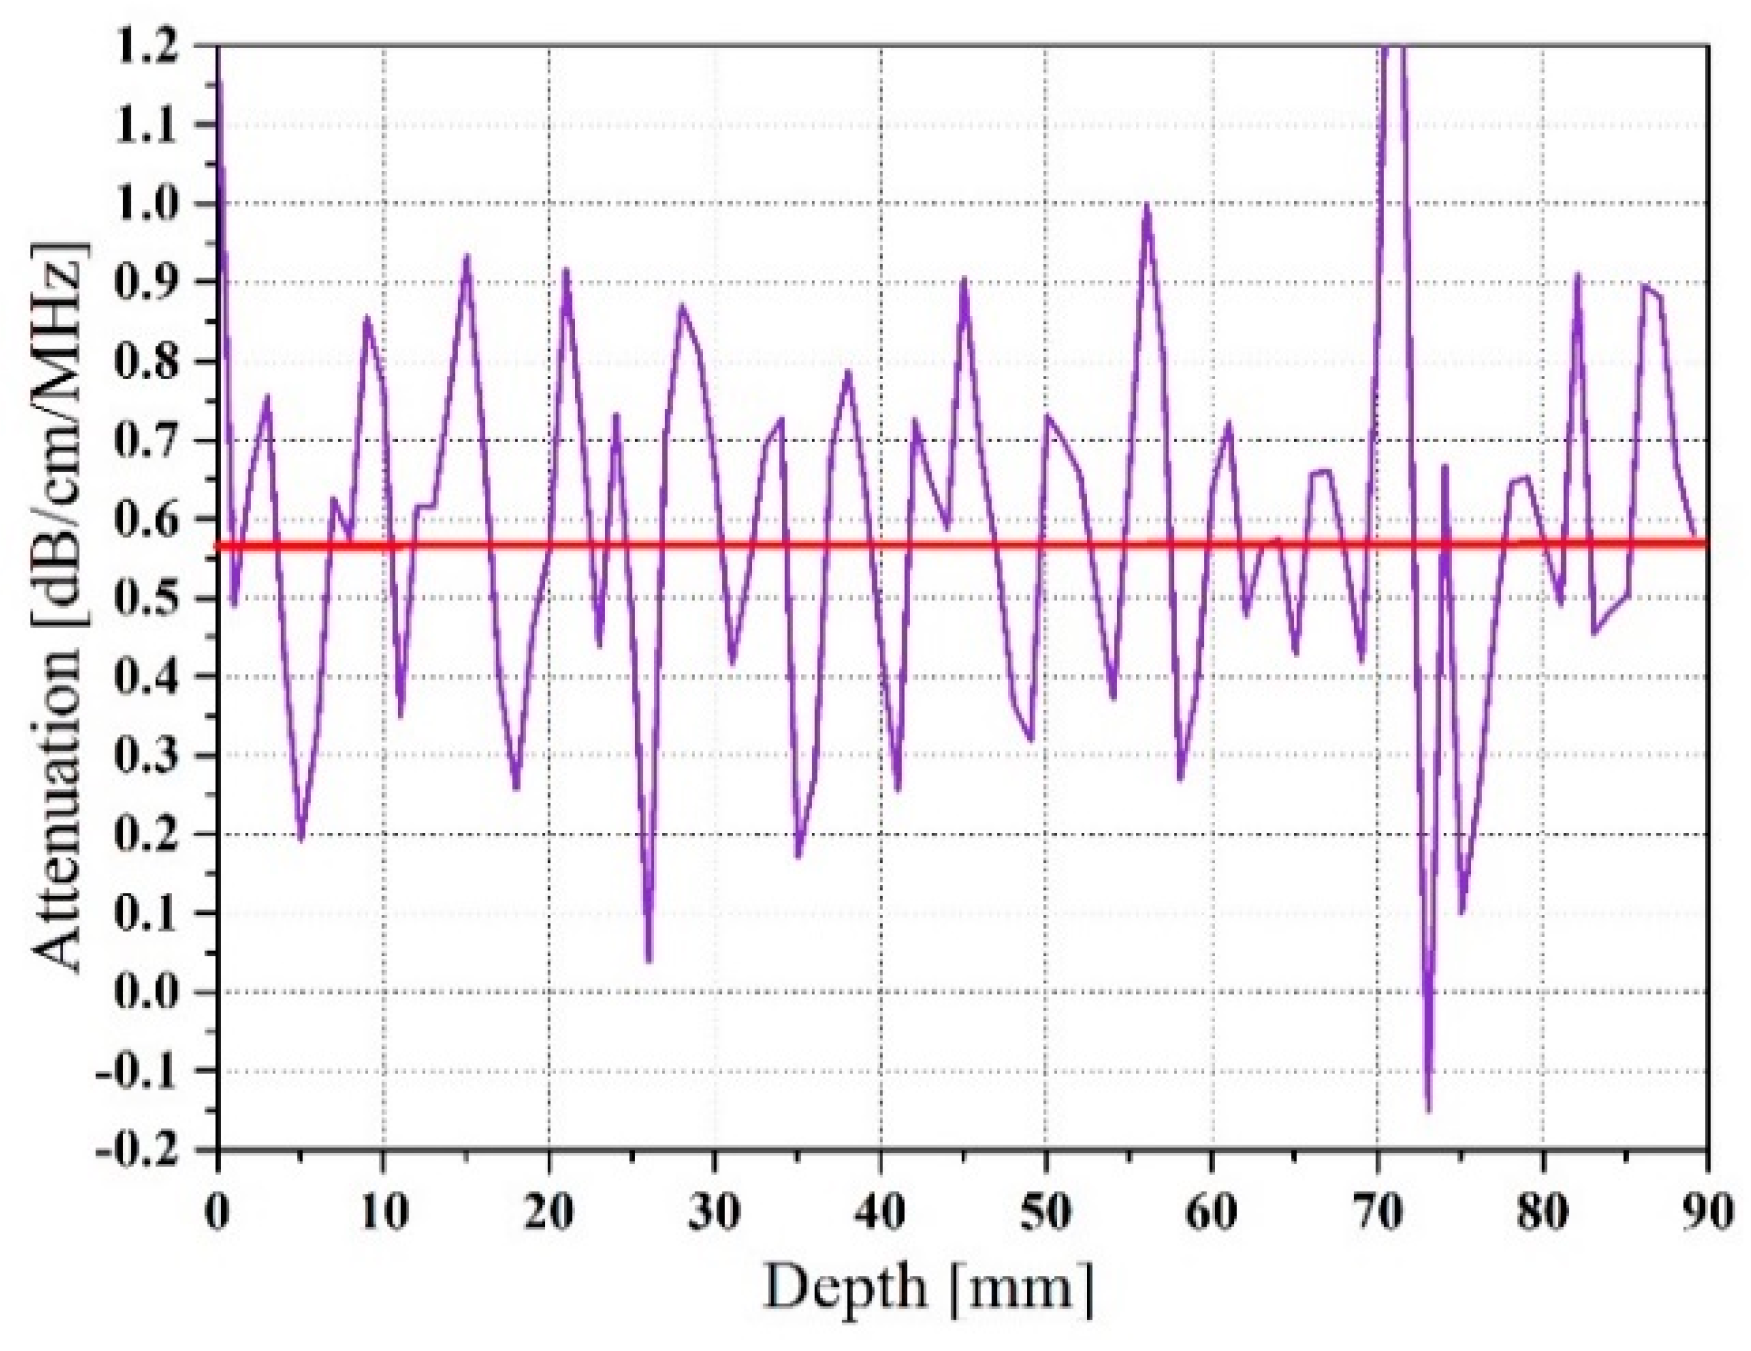
The spectral cross-correlation algorithm was applied to calculate the spectral shift between two consecutive power spectra. The spectral shift was equivalent to the center frequency downshift acquired from two adjacent estimates. The final estimated attenuation coefficient was calculated using Equation (8), as shown in
Figure 8. The attenuation coefficient is 0.57, while the theoretical value is 0.6. The standard deviation is 0.23, which is almost 50% of attenuation coefficient.
Adaptive TGC was applied to the original image using the average attenuation coefficient obtained from the evaluation. The compensated image with adaptive TGC is shown in
Figure 9. Simulation results indicate that the algorithm was able to compensate the image and display more internal information.
Figure 10 illustrates the quantitative analysis before and after the simulation, and it can be seen from the results that the image quality is improved.
4. Results
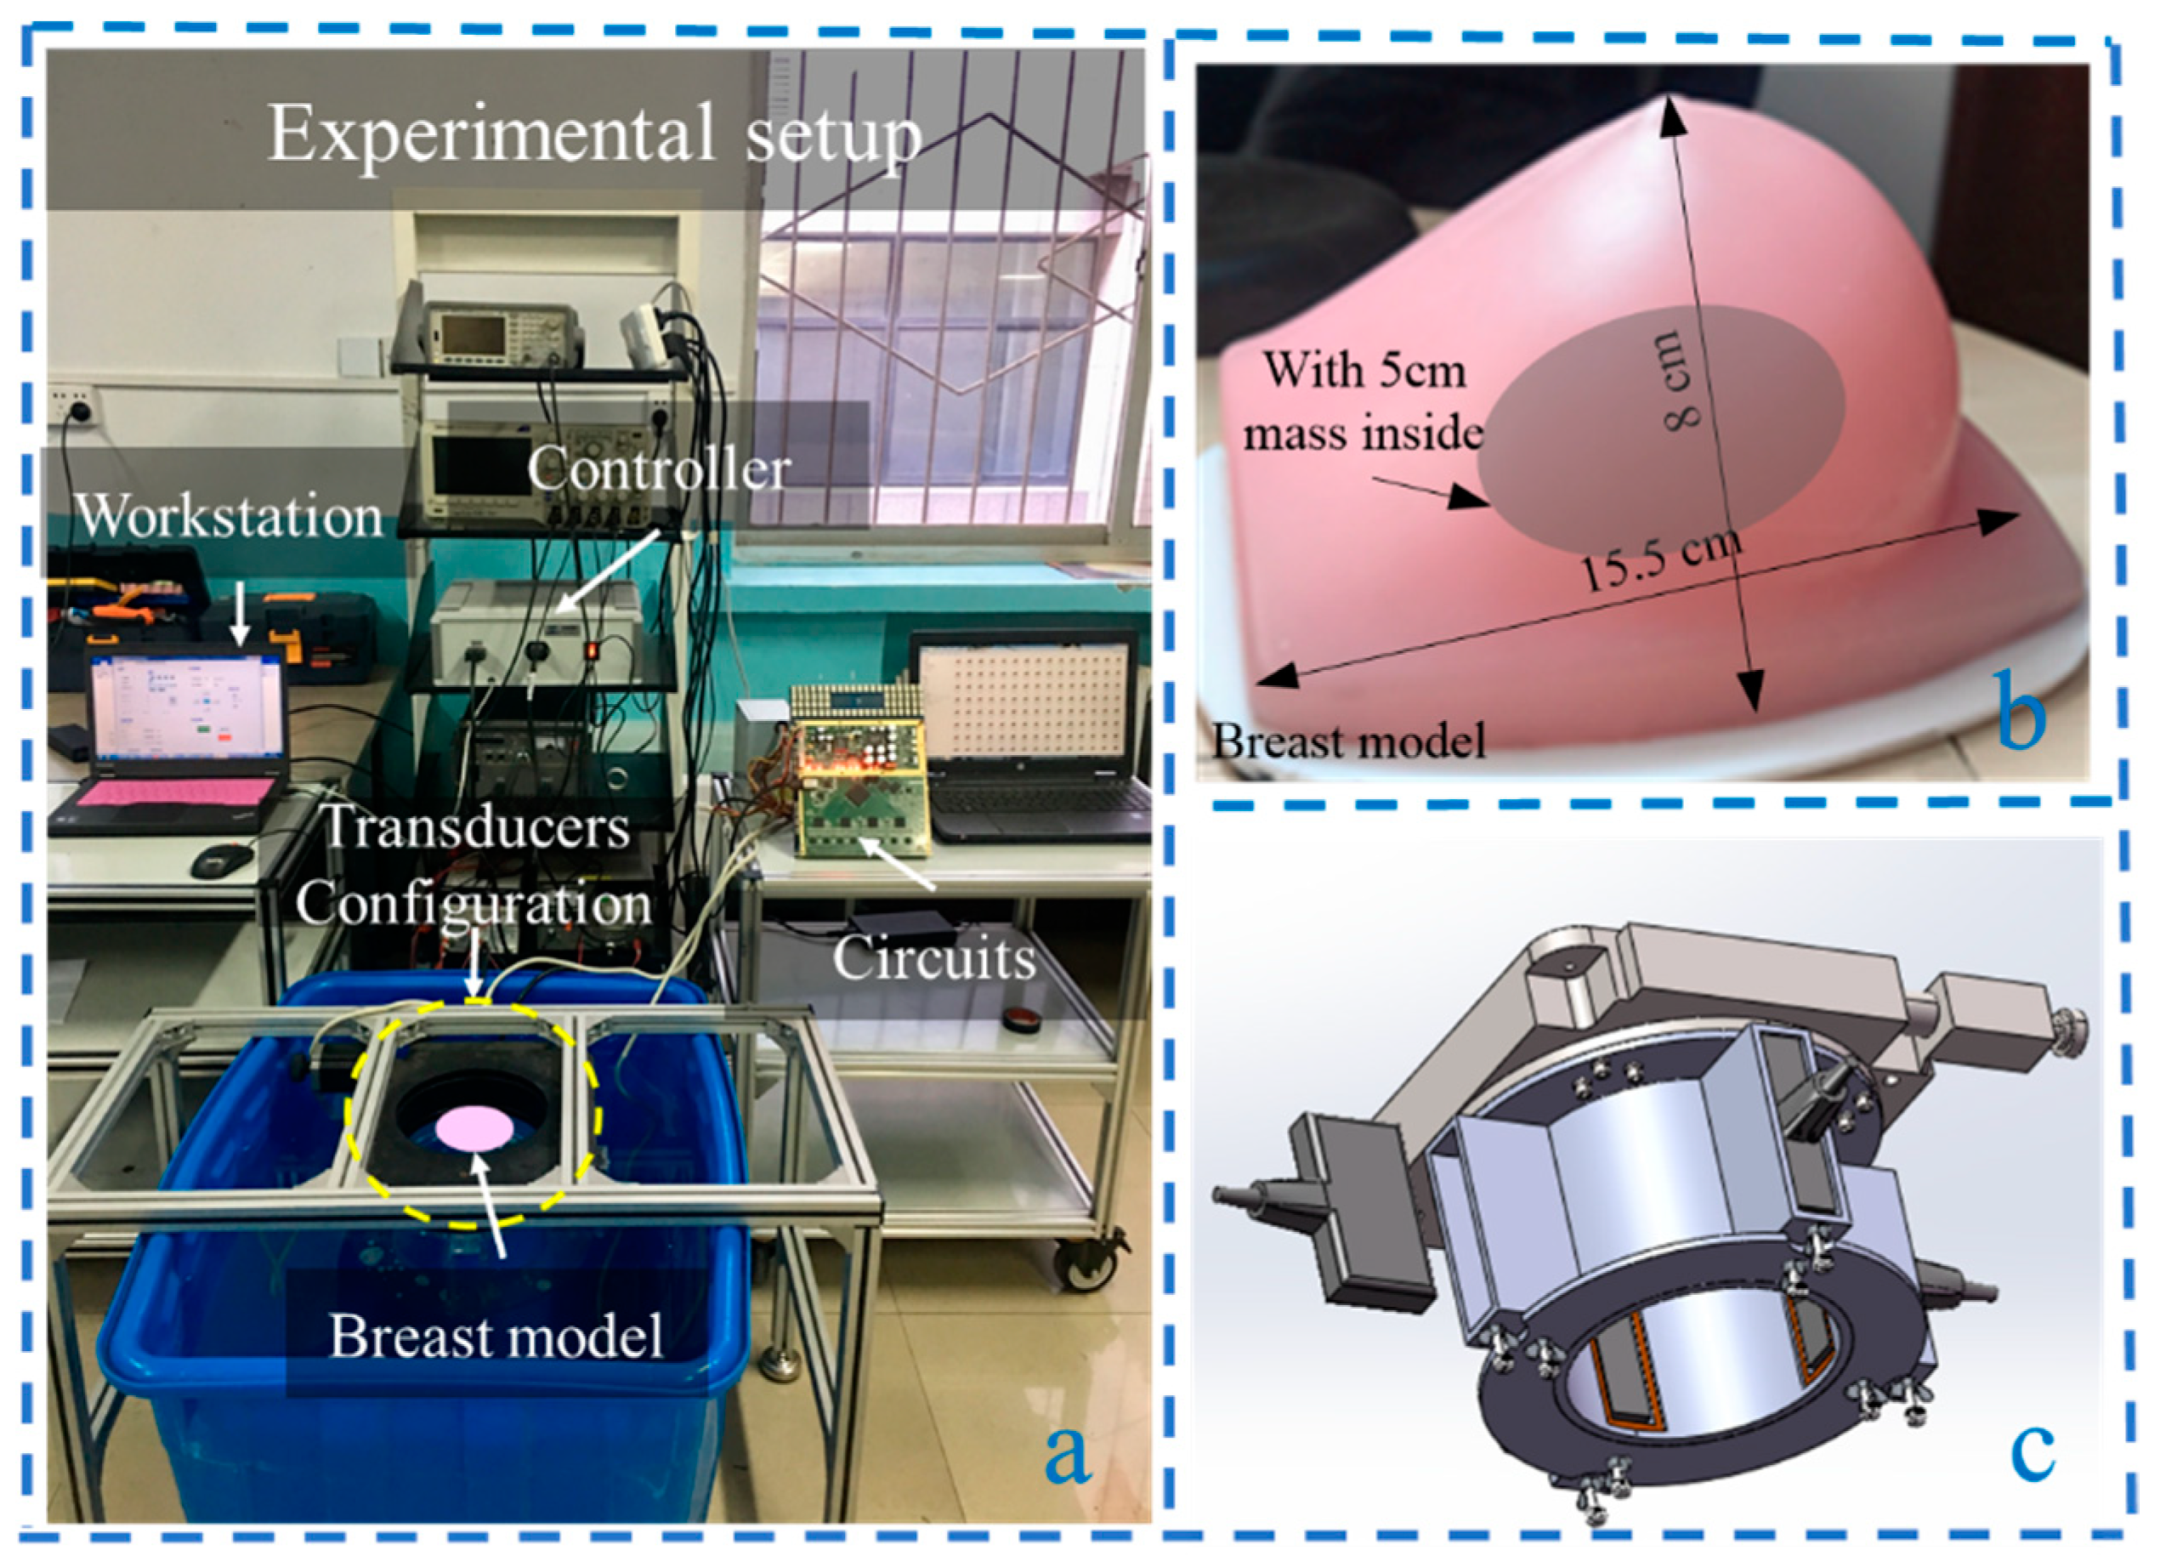
The experimental platform was set up as shown in
Figure 11a. It consisted of a workstation, the breast model (
Figure 11b), transducer configuration (
Figure 11c), ultrasound transmitting/receiving circuits, water tank, and a rotary table controller [
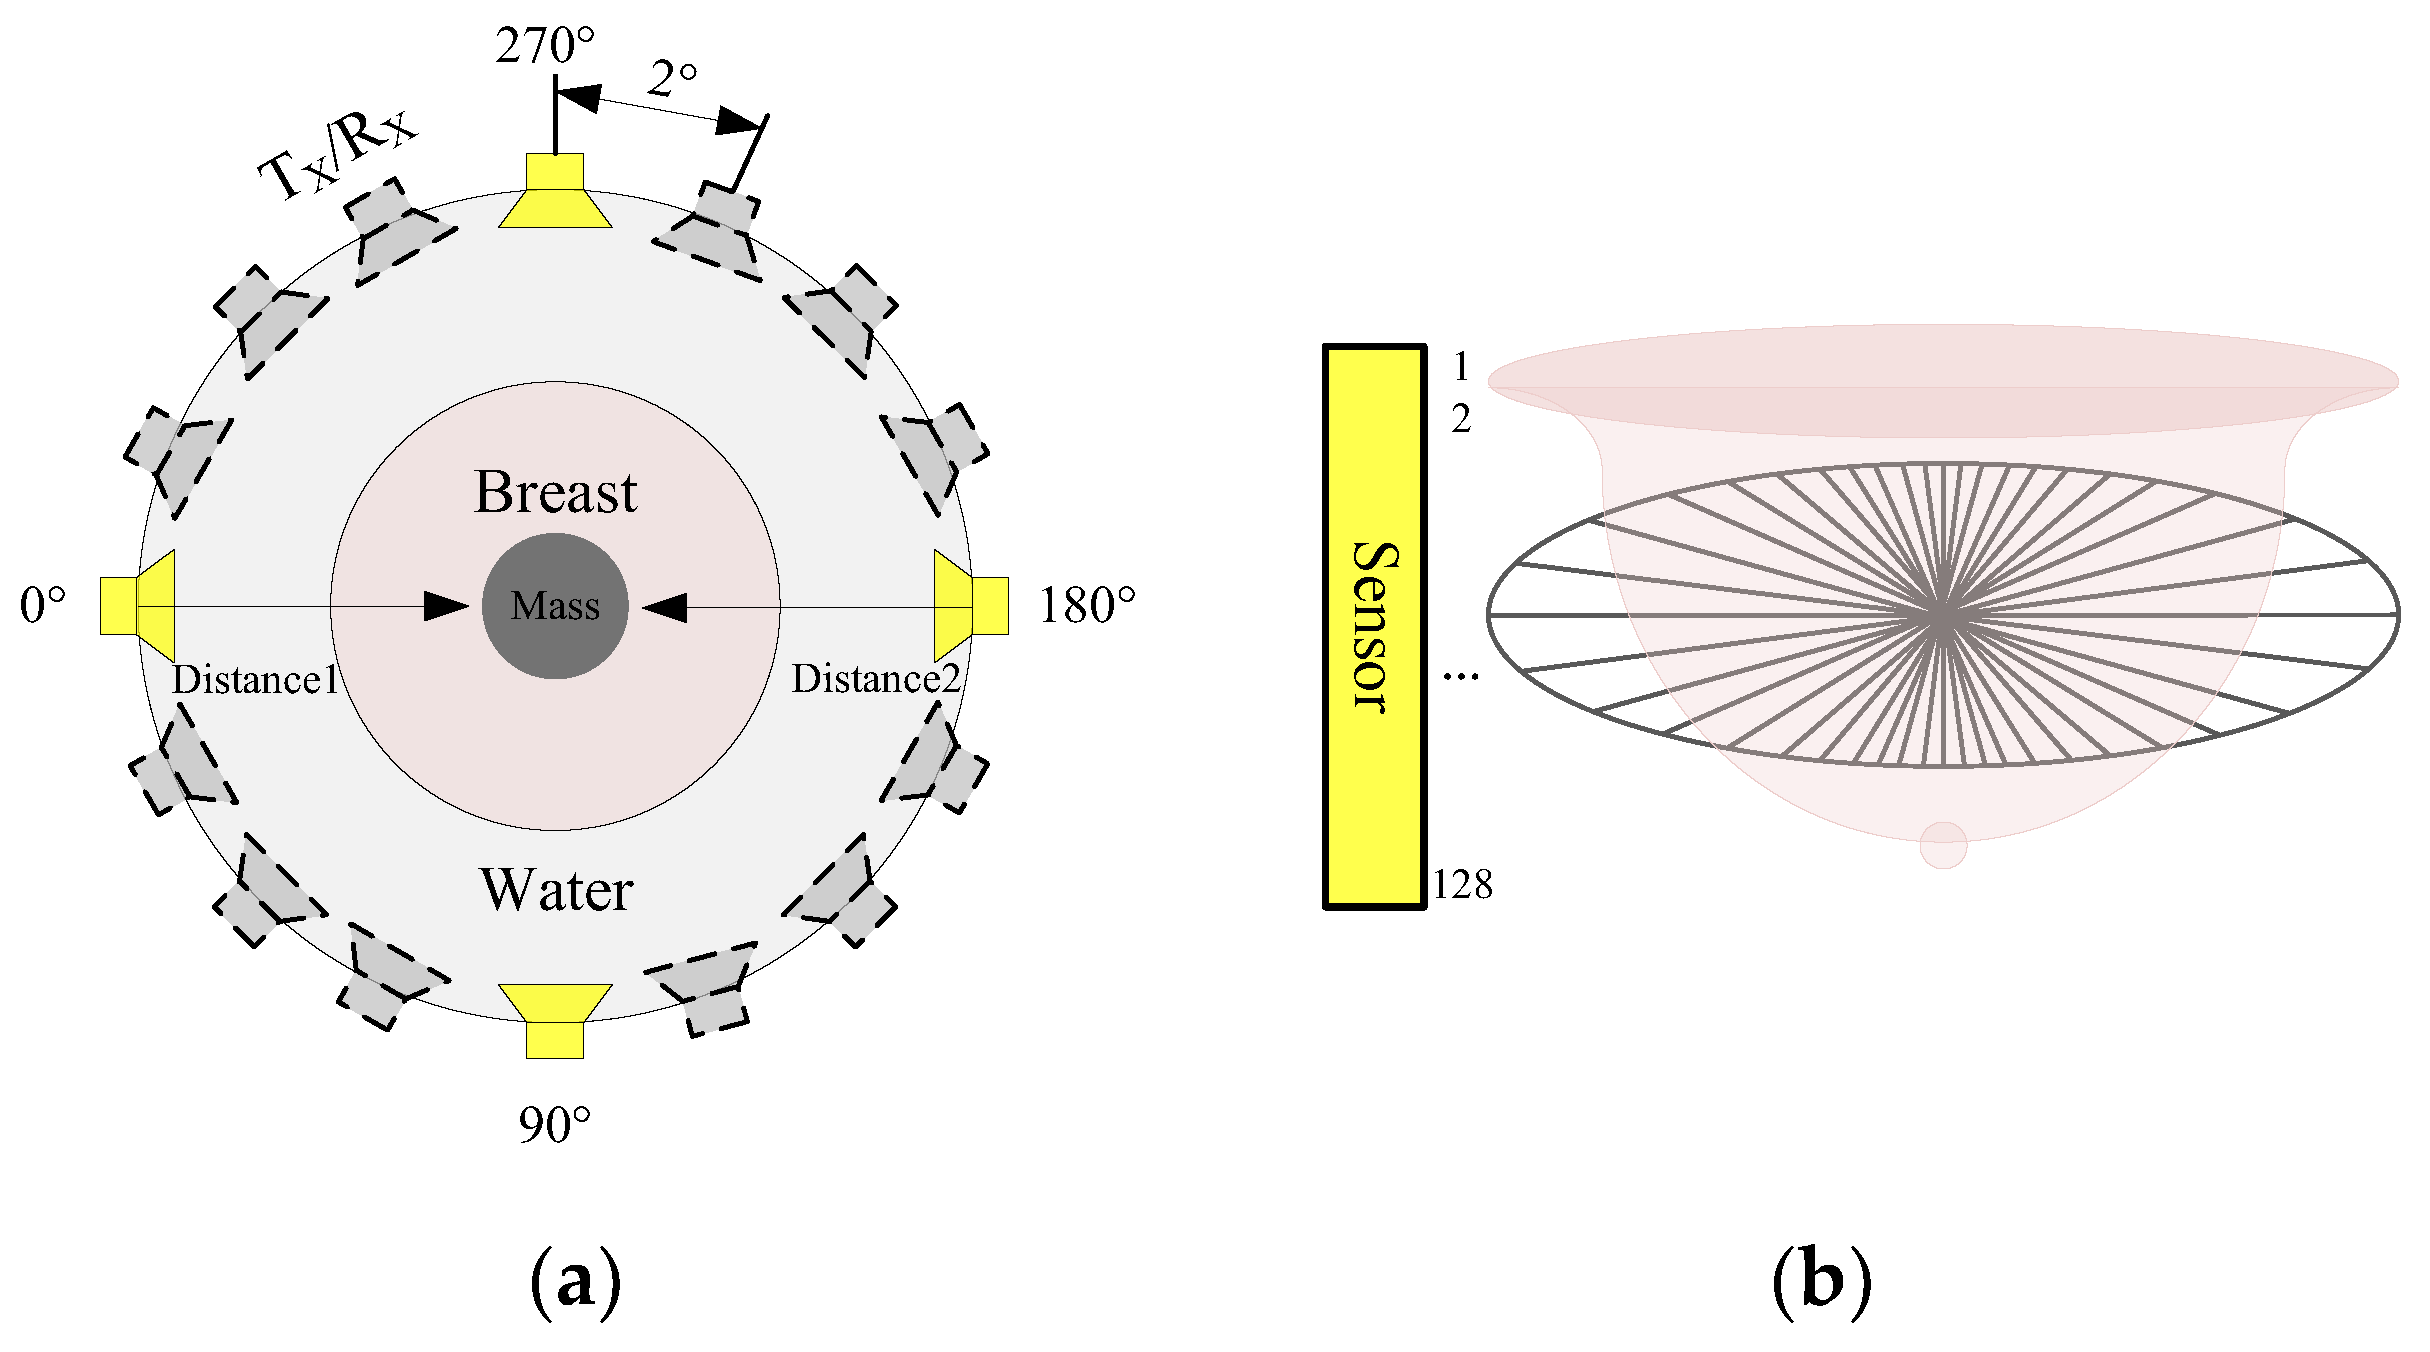
22]. A key component of this system was the transducer configuration, which consisted of four vertical ultrasonic transducers in a cross shape surrounding the breast model to achieve non-invasive detection. By controlling the electric rotary table controller through a PC workstation, the electric rotary table induces the PMUT to perform cylindrical scanning. A 64-channel ultrasonic transmitting/receiving acquisition circuit with a sampling frequency of 40 MHz was employed to control the linear array. The breast volume data were obtained by performing cylindrical scanning with a constant interval. Besides, the rotation interval angle is adjustable. A 1 × 128 PMUT linear array was utilized, with a center frequency of 3.5 MHz, consistency of ±1 dB at 3.5 MHz, and a bandwidth of 86.7%. The breast model was customized (Shenzhen Well Come Technology co. LTD, China), and its overall dimensions were 15.5 × 13.5 × 8 cm. The breast phantom was made from a proprietary gel with a physical consistency similar to that of human tissue. The gel was surrounded by an elastic skin-like membrane and is suitable for ultrasound imaging research. The size of the embedded mass in the center was 5 cm, made of urethane rubber and colored for easy visualization. The attenuation coefficient was 0.6 dB/(MHz·cm), and the speed of sound used was 1520 m/s. The operating working range was from 2 to 4 MHz. The experiments were carried out in the water tank with a constant temperature of 32 °C.
The ultrasound tomography test method and reconstruction slice scheme are shown in
Figure 12. The four PMUT linear arrays were placed 90° cross vertically at 0°, 90°, 180°, and 270°. An electric rotary table controller was regulated by the workstation to drive the ultrasonic transducer to perform cylindrical scanning with a constant interval. Then, 128 horizontal slices were achieved by rotating the Nth element through a full circle. The circular scanning test diagram of one slice is shown in
Figure 12a. In the experiment, the rotation interval was set to 2°. Each slice consisted of 180 A-scan lines (RF line). A single line of the tomographic image was created from RF data received by a single element, and the image was reconstructed using the proposed tomography algorithm. A breast ultrasound horizontal slice map is shown in
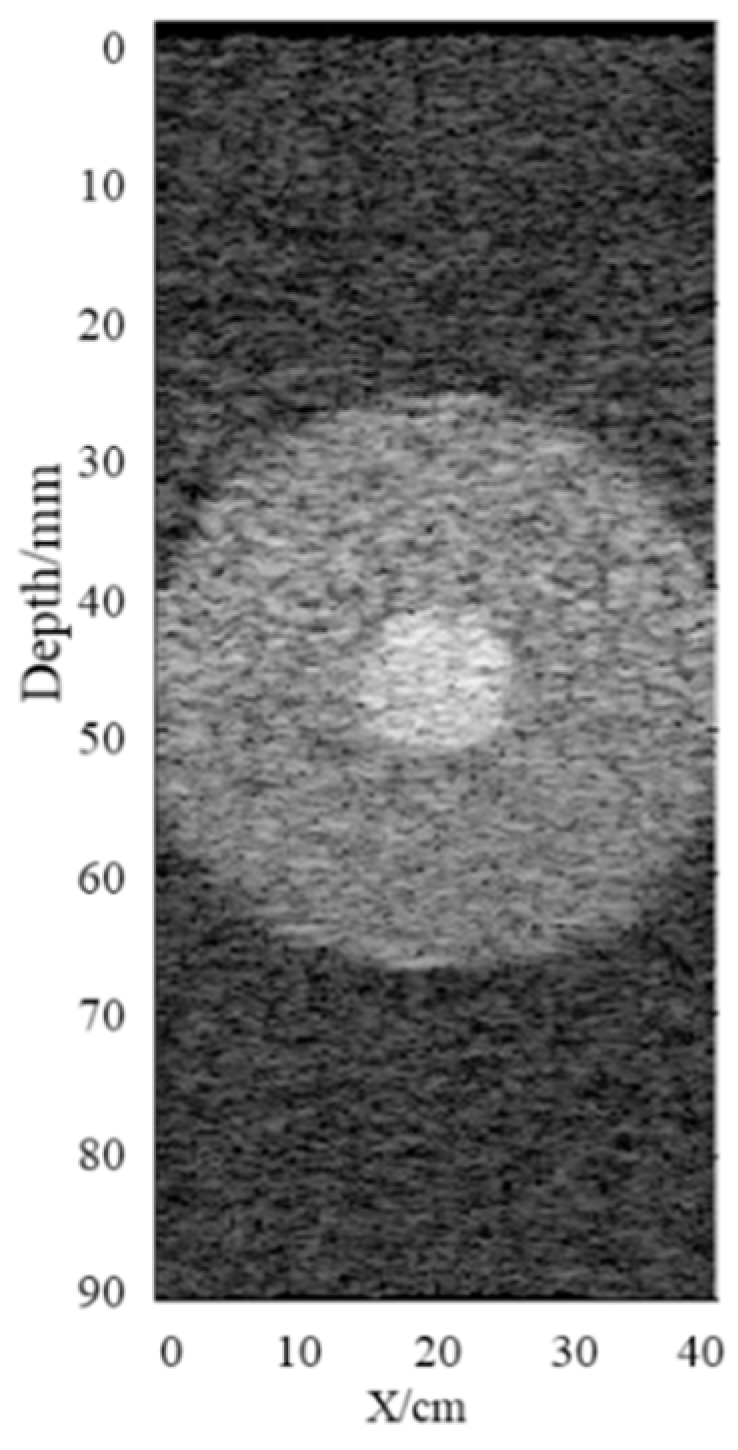
Figure 12b.
The breast horizontal ultrasound tomography images without TGC and with adaptive TGC were realized as shown in
Figure 13, respectively. In the center of the breast model was a mass of approximately 5 cm. The incomplete contour was detected, and the experimental results were consistent with theoretical values. On the other hand, the border of the phantom was not complete. The main reason was the asymmetric shape of the breast model. The tilted side (right side) was not easily detected because the incident angle was relatively large. When dynamic focusing technology is used, the whole border of the phantom will be clearly visible. A slice without TGC compensation is shown in
Figure 13a, and a slice with adaptive TGC is shown in
Figure 13b. By contrast analysis, the improved algorithm with adaptive TGC detected the internal mass clearly; thus, the compensation for ultrasound attenuation was effective.
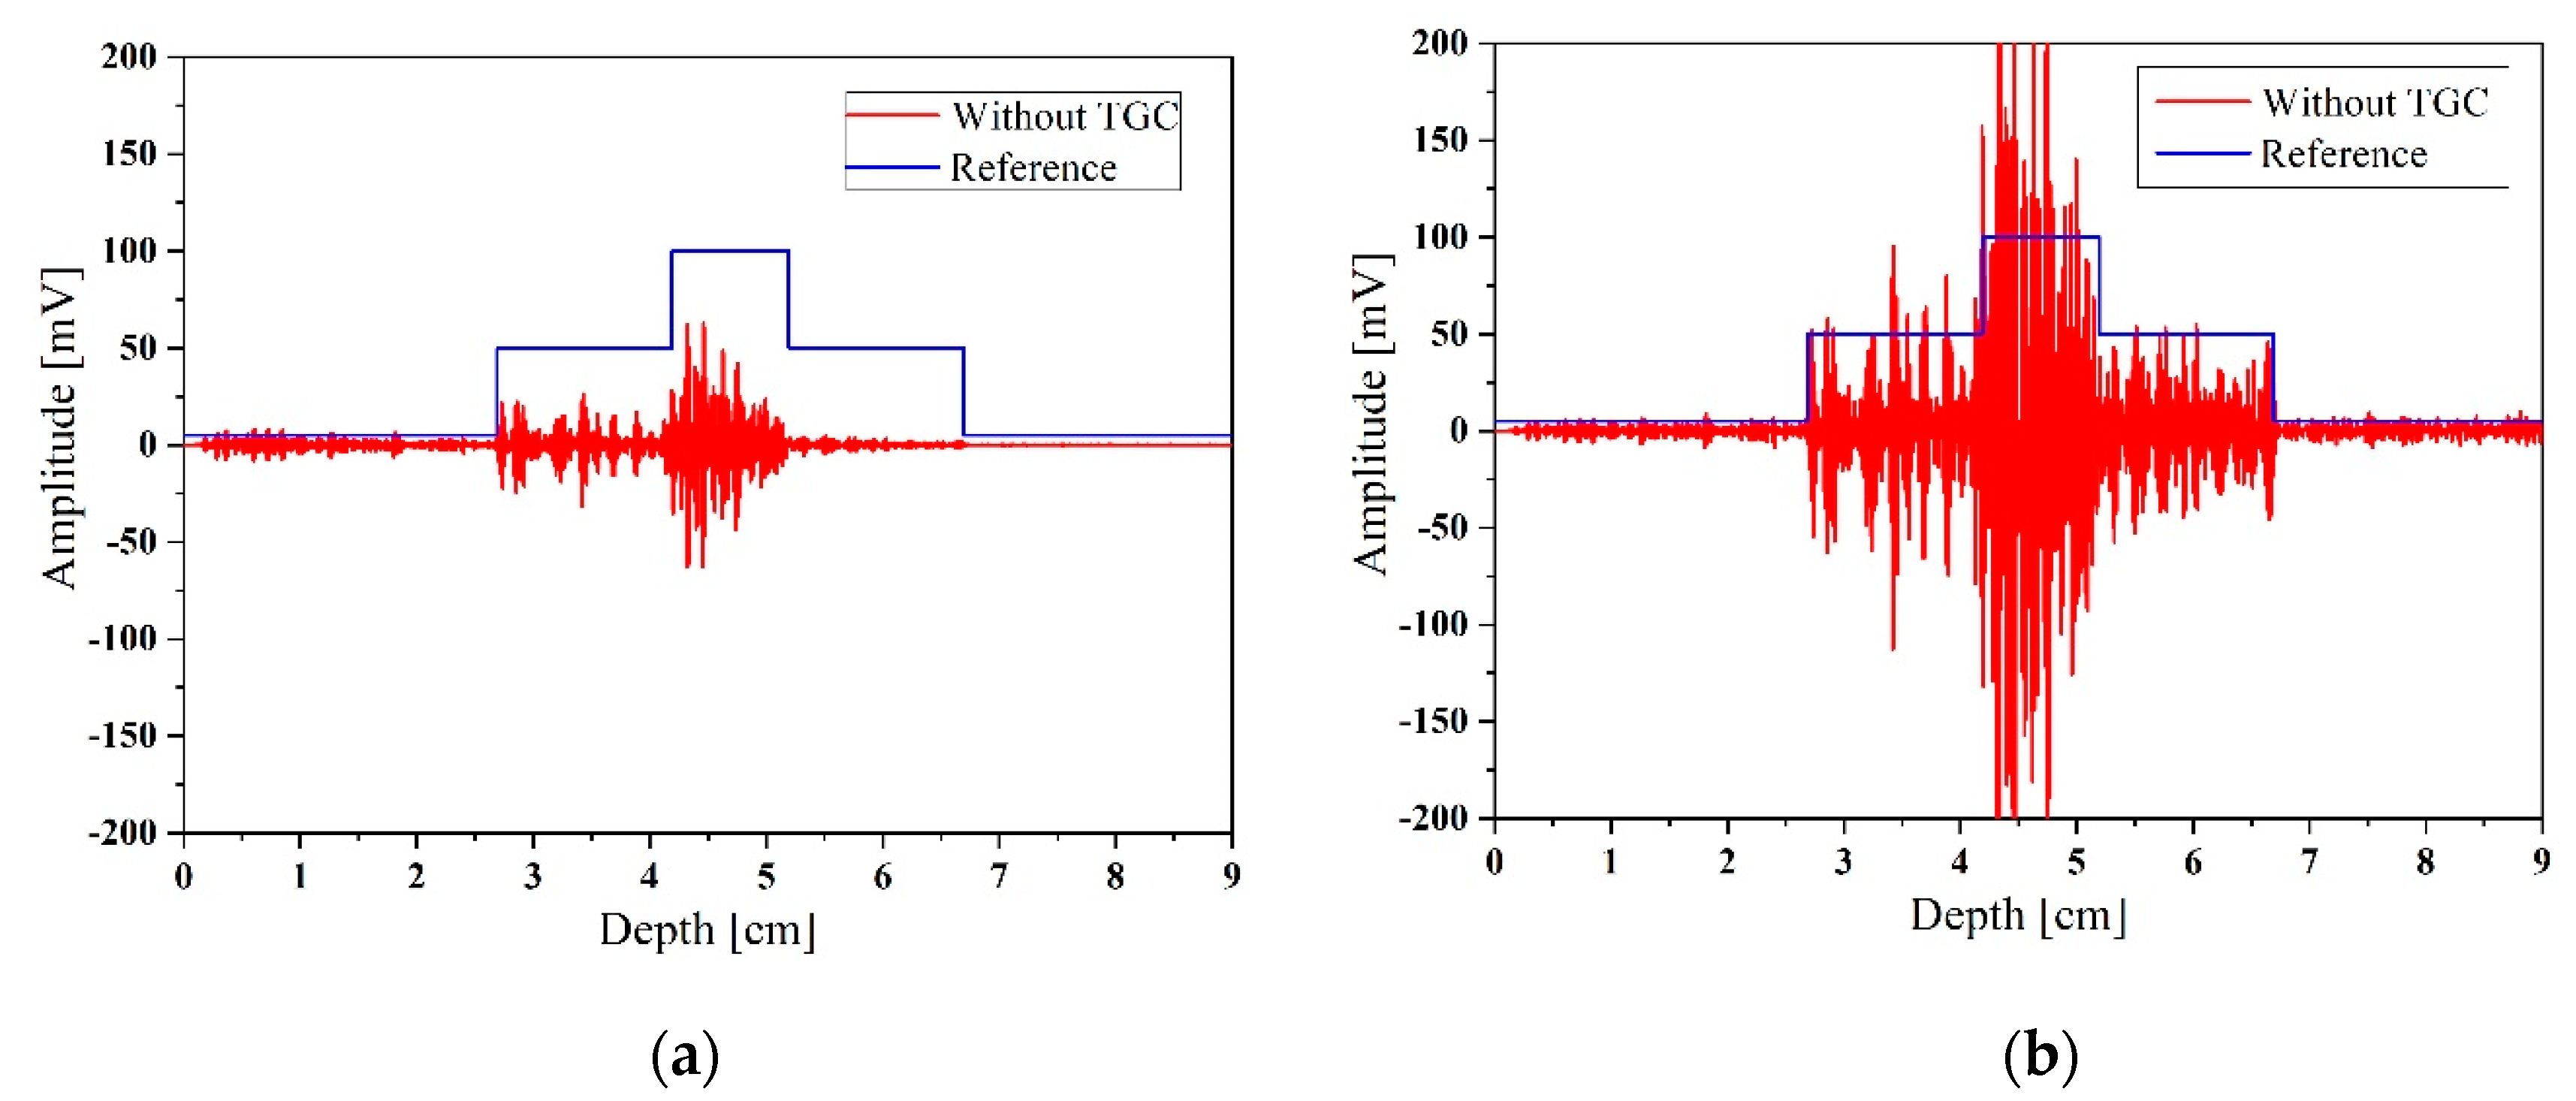
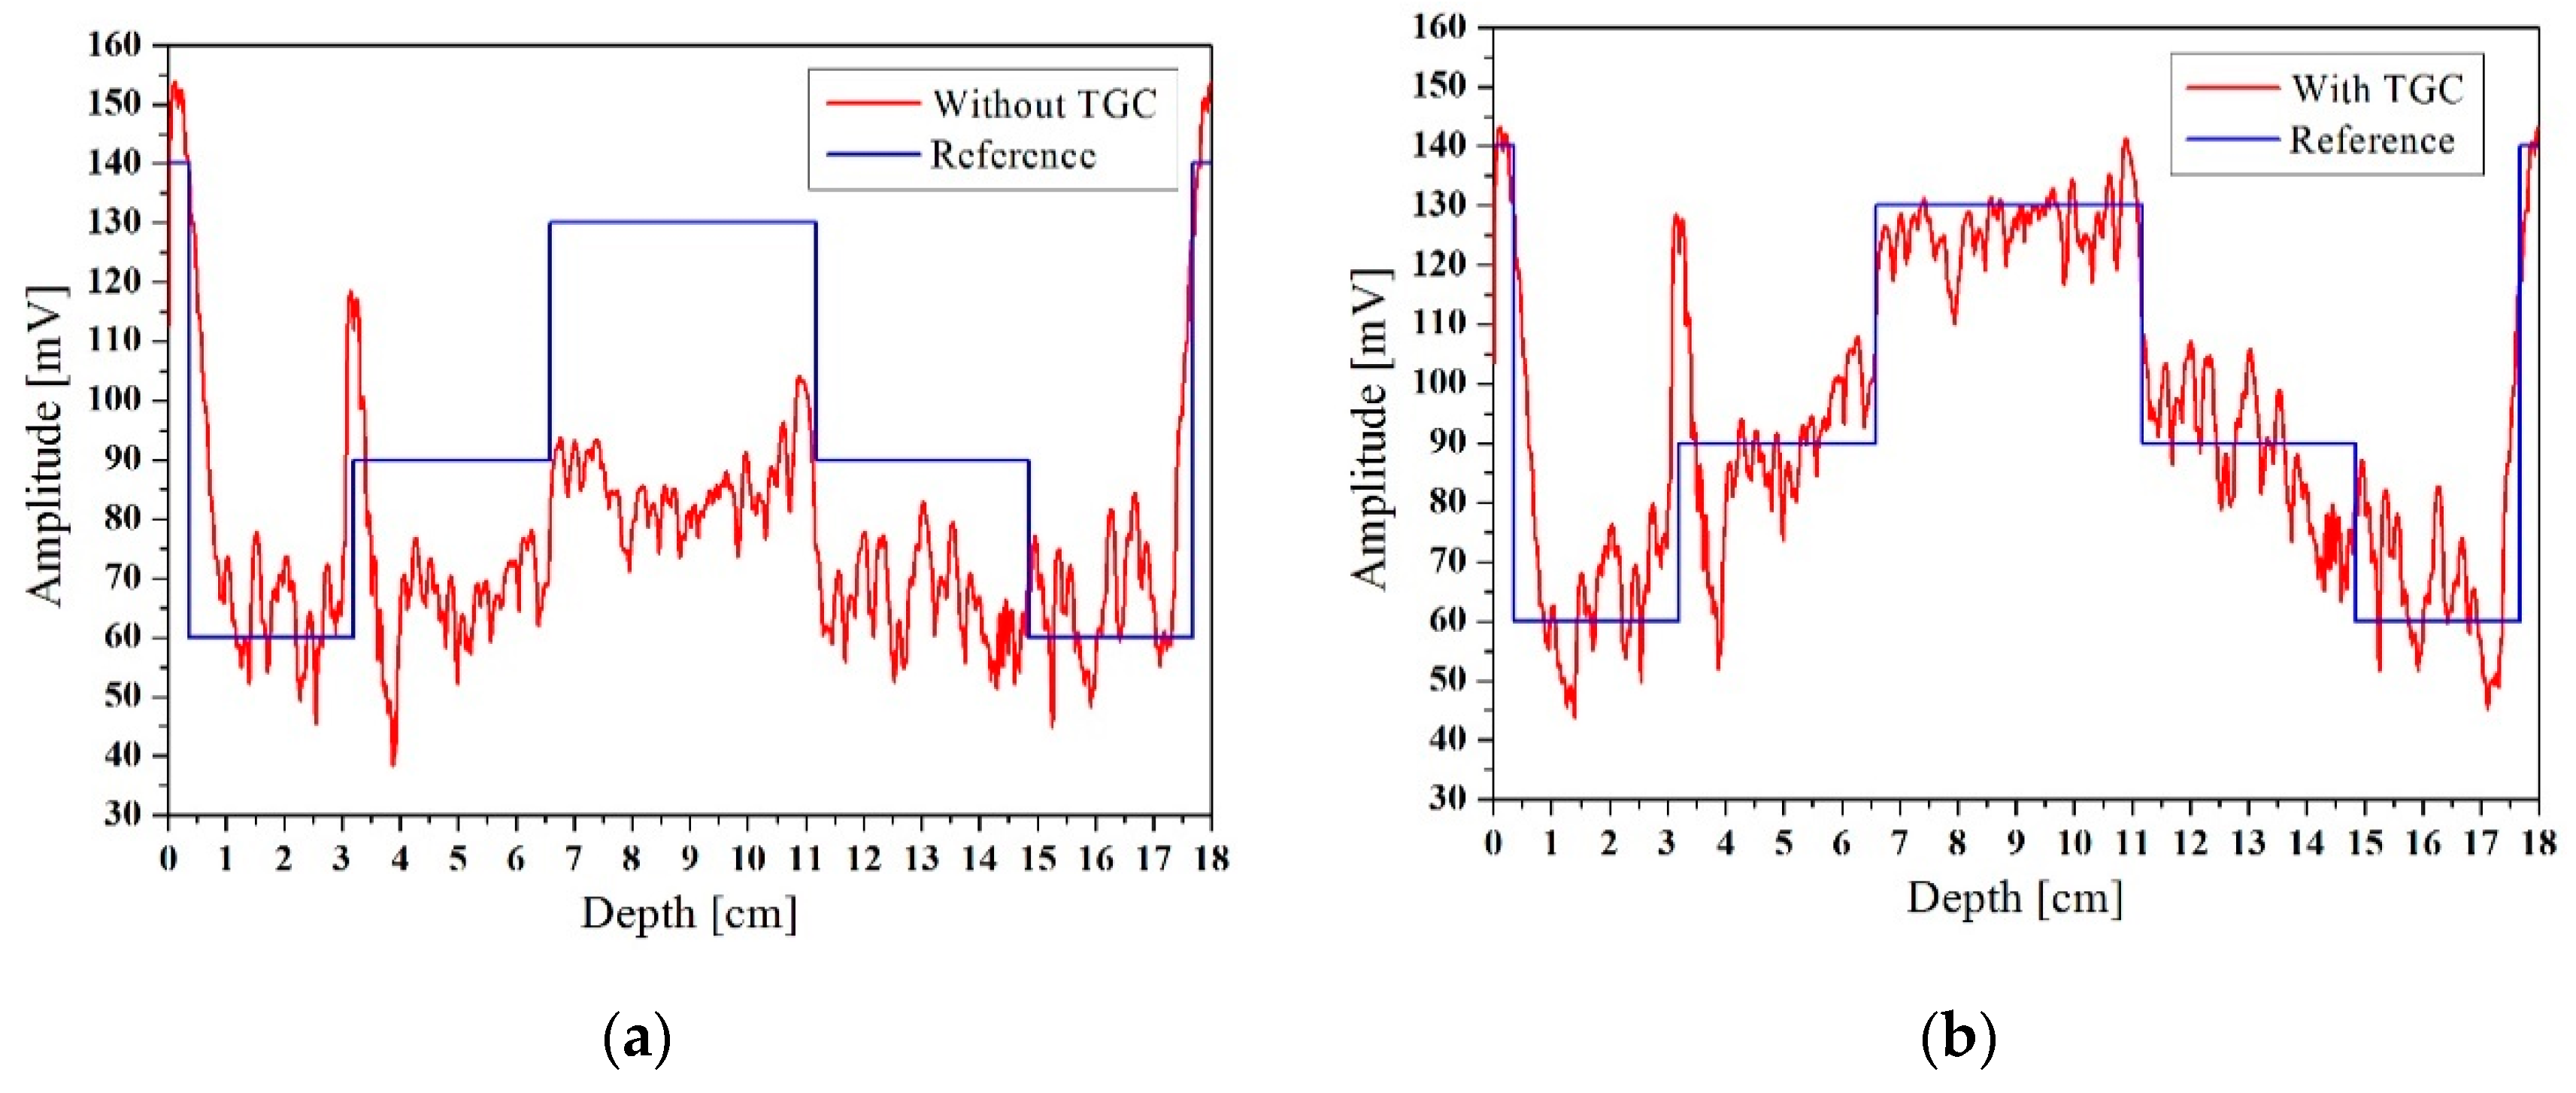
To further illustrate the effectiveness of the improved algorithm, we plotted the cross-section of the horizontal ultrasound tomography image at y = 9 cm, as shown in
Figure 14. The y = 9 cm position is represented by a dotted line in
Figure 13. Since the breast model was customized, the diameter and location of the mass in the breast model were approximately known, and the reference value was calculated. The signal that was compensated using TGC was segmented, with the segmentation criterion being the mutation position of the signal. The average amplitude of each signal segment was taken as the reference value, as shown in
Figure 14. The profiles of the image without TGC and the reference value are shown in
Figure 14a, and the profiles with TGC and reference value are shown in
Figure 14b. The peak signal to noise ratio (PSNR) and root-mean-square error (RMSE) run for the profiles are shown in
Table 1. Comparative analysis showed that the profile with adaptive TGC was closer to the reference value. This clearly illustrated that the algorithm with adaptive TGC could better capture the internal mass and thus better reconstruct the image.
5. Discussions and Conclusions
An improved breast ultrasound tomography algorithm based on adaptive TGC for a specific system with cylindrical motion of a PMUT linear array was realized. In order to verify the effectiveness of the algorithm, Field II was used for simulation analysis; the known attenuation coefficient of the phantom was evaluated automatically, and the attenuated image was compensated. Furthermore, the breast model was analyzed using the experimental platform. Circular scanning was performed to acquire a horizontal slice data, and the presented algorithm processed the data and obtained the reconstructed image. Through comparative analysis of the horizontal ultrasound tomography images and the quantitative results, it was inferred that the algorithm compensated for the attenuation of the ultrasonic signal and improved the ability to detect the mass in the model.
The main components of the experimental setup are installed in a test bed, and the examinee lies prone on it; then, the breast tomography image can be obtained automatically by using the improved algorithm. In the clinical application, the non-invasive ultrasound detection does not rely on the operator’s experience and gives patients a certain degree of comfort and safety [
29,
30]. Besides, the surrounding tissue, shape, size, number, margin contour, and lesion boundary can be detected intuitively by using this setup. Ultrasound elastography provides additional information on breast lesions on the basis of duplex sonography. Elastography imaging is a qualitative and quantitative technique that involves tissue stiffness or hardness rather than anatomy [
31,
32]. A combination of our algorithm and elastography is a promising approach to achieve effective, accurate, and comprehensive detection of pathological tissue information [
33]. Besides, the adaptive TGC technology realized by software can reduce the complexity of hardware and effectively compensate the attenuation signal, which lays a foundation for real-time diagnosis and is beneficial to the development of portable medical equipment [
34]. The process and its output are conducive to the accurate classification of the state of the mass and the differentiation between benign and malignant tissues in clinical applications, improving specificity and reducing biopsy rates.

 and
and 


