Article

Analysis for the Vibration Mechanism of the Spillway Guide Wall Considering the Associated-Forced Coupled Vibration

1
State Key Laboratory of Hydraulic Engineering Simulation and Safety, Tianjin University, Tianjin 300072, China
2
Postdoctoral workstation, Yellow River Engineering Consulting Co., Ltd., Zhengzhou 450003, China
3
Postdoctoral Research Station of Water Conservancy Engineering, Hohai University, Nanjing 210098, China
*
Authors to whom correspondence should be addressed.
Appl. Sci. 2019, 9(12), 2572; https://doi.org/10.3390/app9122572
Submission received: 16 March 2019 / Revised: 31 May 2019 / Accepted: 22 June 2019 / Published: 25 June 2019
(This article belongs to the Section Acoustics and Vibrations)

Abstract

:

Featured Application

The flow-induced vibration of a hydraulic structure is a threat to the safety of hydraulic engineering projects. Therefore, a new vibration mechanism is presented, which can be applied to control hydraulic structural vibration in structural design and maintenance.

Abstract

During the flood discharge in large-scale hydraulic engineering projects, intense flow-induced vibrations may occur in hydraulic gates, gate piers, spillway guide walls, etc. Furthermore, the vibration mechanism is complicated. For the spillway guide wall, existing studies on the vibration mechanism usually focus on the vibrations caused by flow excitations, without considering the influence of dam vibration. According to prototype tests, the vibrations of the spillway guide wall and the dam show synchronization. Thus, this paper presents a new vibration mechanism of associated-forced coupled vibration (AFCV) for the spillway guide wall to investigate the dynamic responses and reveal coupled vibrational properties and vibrational correlations. Different from conventional flow-induced vibration theory, this paper considers the spillway guide wall as a lightweight accessory structure connected to a large-scale primary structure. A corresponding simplified theoretical model for the AFCV system is established, with theoretical derivations given. Then, several vibrational signals measured in different structures in prototype tests are handled by the cross-wavelet transform (XWS) to reveal the vibrational correlation between the spillway guide wall and the dam. Afterwards, mutual analyses of numeral simulation, theoretical derivation, and prototype data are employed to clarify the vibration mechanism of a spillway guide wall. The proposed mechanism can give more reasonable and accurate results regarding the dynamic response and amplitude coefficient of the guide wall. Moreover, by changing the parameters in the theoretical model through practical measures, the proposed vibration mechanism can provide benefits to vibration control and structural design.

1. Introduction

In recent years, comprehensive hydraulic engineering projects with high dams and large reservoirs have been rapidly developing, especially in China, such as Three Gorges, Jinping, and Xiluodu. Simultaneously, flow-induced vibrations (FIV) of hydraulic structures, which frequently occur in these projects, have posed a significant threat to engineering safety [1]. To investigate the mechanism of the FIV, researchers have proposed several types of source and mechanism of the FIV. Blevins [2] classified the cause of the FIV as stable and unstable flow; according to the vibrational characteristics, Weaver [3] characterized the FIV as dynamic responses, self-controlled and self-excited vibrations, then demonstrated that changes in the structural geometry can eliminate the FIV; Naudascher [1] categorized the sources of FIV excitation as extraneously-induced excitations, instability-induced excitations, and movement-induced excitations, then proposed that all the three types of excitation are simultaneously presented.
Summarized from several current studies regarding the FIV of hydraulic structures, conclusions can be made that the FIV mechanism can be quite different for hydraulic structures with different scales and weights [4,5]. For heavyweight structures, e.g., dams, spillways, plunge pool slabs, the effect of flow can be regarded as a simple load, and the vibrational response can be solved by regular dynamic equations. However, for lightweight structures, e.g., spillway guide walls, hydraulic gates, gate piers, the effect of flow cannot be simplified as a simple load, but an effect of the fluid–structure interaction (FSI), which can be equivalent to an added mass on the structure [6]. In other words, the structural vibration may absorb energy from the water. As a result, the vibration mechanism of lightweight structures is much more complicated than that of heavyweight structures.
To give more definite illustrations for the vibration of lightweight structures, some new kinds of vibration mechanisms under FSI have been carried out to clarify some of the FIV phenomena in practice, with diverse theoretical models proposed. Kolkman and Vrijer [7] introduced a theory of self-exciting vertical vibration and demonstrated that self-excitation occurs in gates when suction forces are generated in the gate opening. Thang and Nauduscher [8] claimed that the self-excitation of hydraulic gate vibration derives from the vortices, i.e., vortex-excited vibration, which can be attributed to the interaction between the elastic gate and the unstable shear layer underneath the gate. Meanwhile, under certain defined conditions, another type of vibration called galloping may occur [9], which is a phenomenon of self-excited large-amplitude oscillation and the energy of amplified vibration is absorbed from the fluid. Another new kind of vibration called beat vibration is detected on both the gate [10] and the guide wall [11], where the amplitude appears as a periodic change. Furthermore, by analyzing prototype tests, Liang et al. [12] believe that the crest orifice gate vibration is induced and amplified by the mid-level orifice gate vibration when the natural frequency of the crest orifice gate is close to the frequency of flow excitation acting on the mid-level orifice.
In hydraulic engineering projects with overflow gravity dams, e.g., Three Gorges, Xiangjiaba, spillway guide walls are built to separate the flow and stabilize the flow pattern. For the larger scale compared to other lightweight hydraulic structures (hydraulic gates and gate piers), the FIV damage of spillway guide walls can be more severe and harder to repair. There are many instances of damage reported, such as Texarkana, Trinity, Wan’an, and Wujiangdu [13]. It is concluded that the most common failure mode of the guide wall is fatigue crack. The guide wall structure is subject to various flow fluctuations for a long period, and the pressures between two sides of the guide wall are usually different. As a consequence of this kind of flow condition, the vibration may lead to guide wall cracking near the base and eventual failure and removal of the wall.
Regarding the safety of the guide wall, several studies on the guide wall stability have been proposed with different topics. Regarding the flow pattern, the computational fluid dynamic (CFD) tool is widely applied [14] to assess the geometry of the guide wall to guarantee the stability of the flow. Physical models are also employed in flow pattern optimization [15]. With regard to fluctuating pressure and vibrational characteristics, conventional research techniques include theoretical derivation [16], model tests [13], prototype tests [17], and numerical simulation [18]. There have also been various damage diagnosis algorithms presented for the guide wall [19,20]. The above studies are focused on structural optimizations and excitations; however, for the vibration mechanism and dynamic response of the guide wall, conventional research methods are inadequate.
As mentioned above, the two main methods for the FIV mechanism are model tests and prototype tests. Both of the methods will produce a large number of vibration signals, which contain complex signal components, resulting in the necessity of signal processing. Conventional vibration analyses usually employ the Fourier Transform (FT) to obtain the vibrational characteristics [21]. Another common signal processing method is Empirical Mode Decomposition (EMD), and its various modifications are widely applied in the analysis of vibrations [22]. In recent years, the wavelet transform (WT) technique and its modifications have become widely utilized in signal processing. Extended from WT, the cross-wavelet transform (XWT) is a new method to evaluate the relationship between two signals. This method is more common in meteorological [23], hydrological [24] and medical [25] fields, and is demonstrated to be an efficient method of analyzing the vibrational correlation between two structures [26].
In conclusion, the studies on the FIV of spillway guide walls are inadequate, as the conventional methods usually focus on the vibrations caused by flow excitations, but the influence of dam vibration is always ignored, leading to the inaccuracy and irrationality of vibration analyses. In this paper, according to prototype tests and structural characteristics of a typical guide wall, a new perspective of associated-forced coupled vibration (AFCV) is proposed. Considering the lightweight characteristic of the guide wall, it can be deemed to be an accessory structure installed in the large-scale primary structure, constituting the associated vibration (AV) system. Then, considering the connection between the guide wall and the foundation, the AV system was modified to be an AFCV system, with the establishment of a two-degrees-of-freedom theoretical model. The proposed theoretical model is subsequently verified based on prototype tests. By employing the signal processing method XWT and numerical simulation, the vibration mechanism can be clarified in detail utilizing the theoretical model, and simultaneously demonstrates the reasonability and correctness of the theoretical model. In practice, this investigation aims at contributing to the design, monitoring, and maintenance of spillway guide walls, and is beneficial to the vibrational control of similar lightweight hydraulic structures.

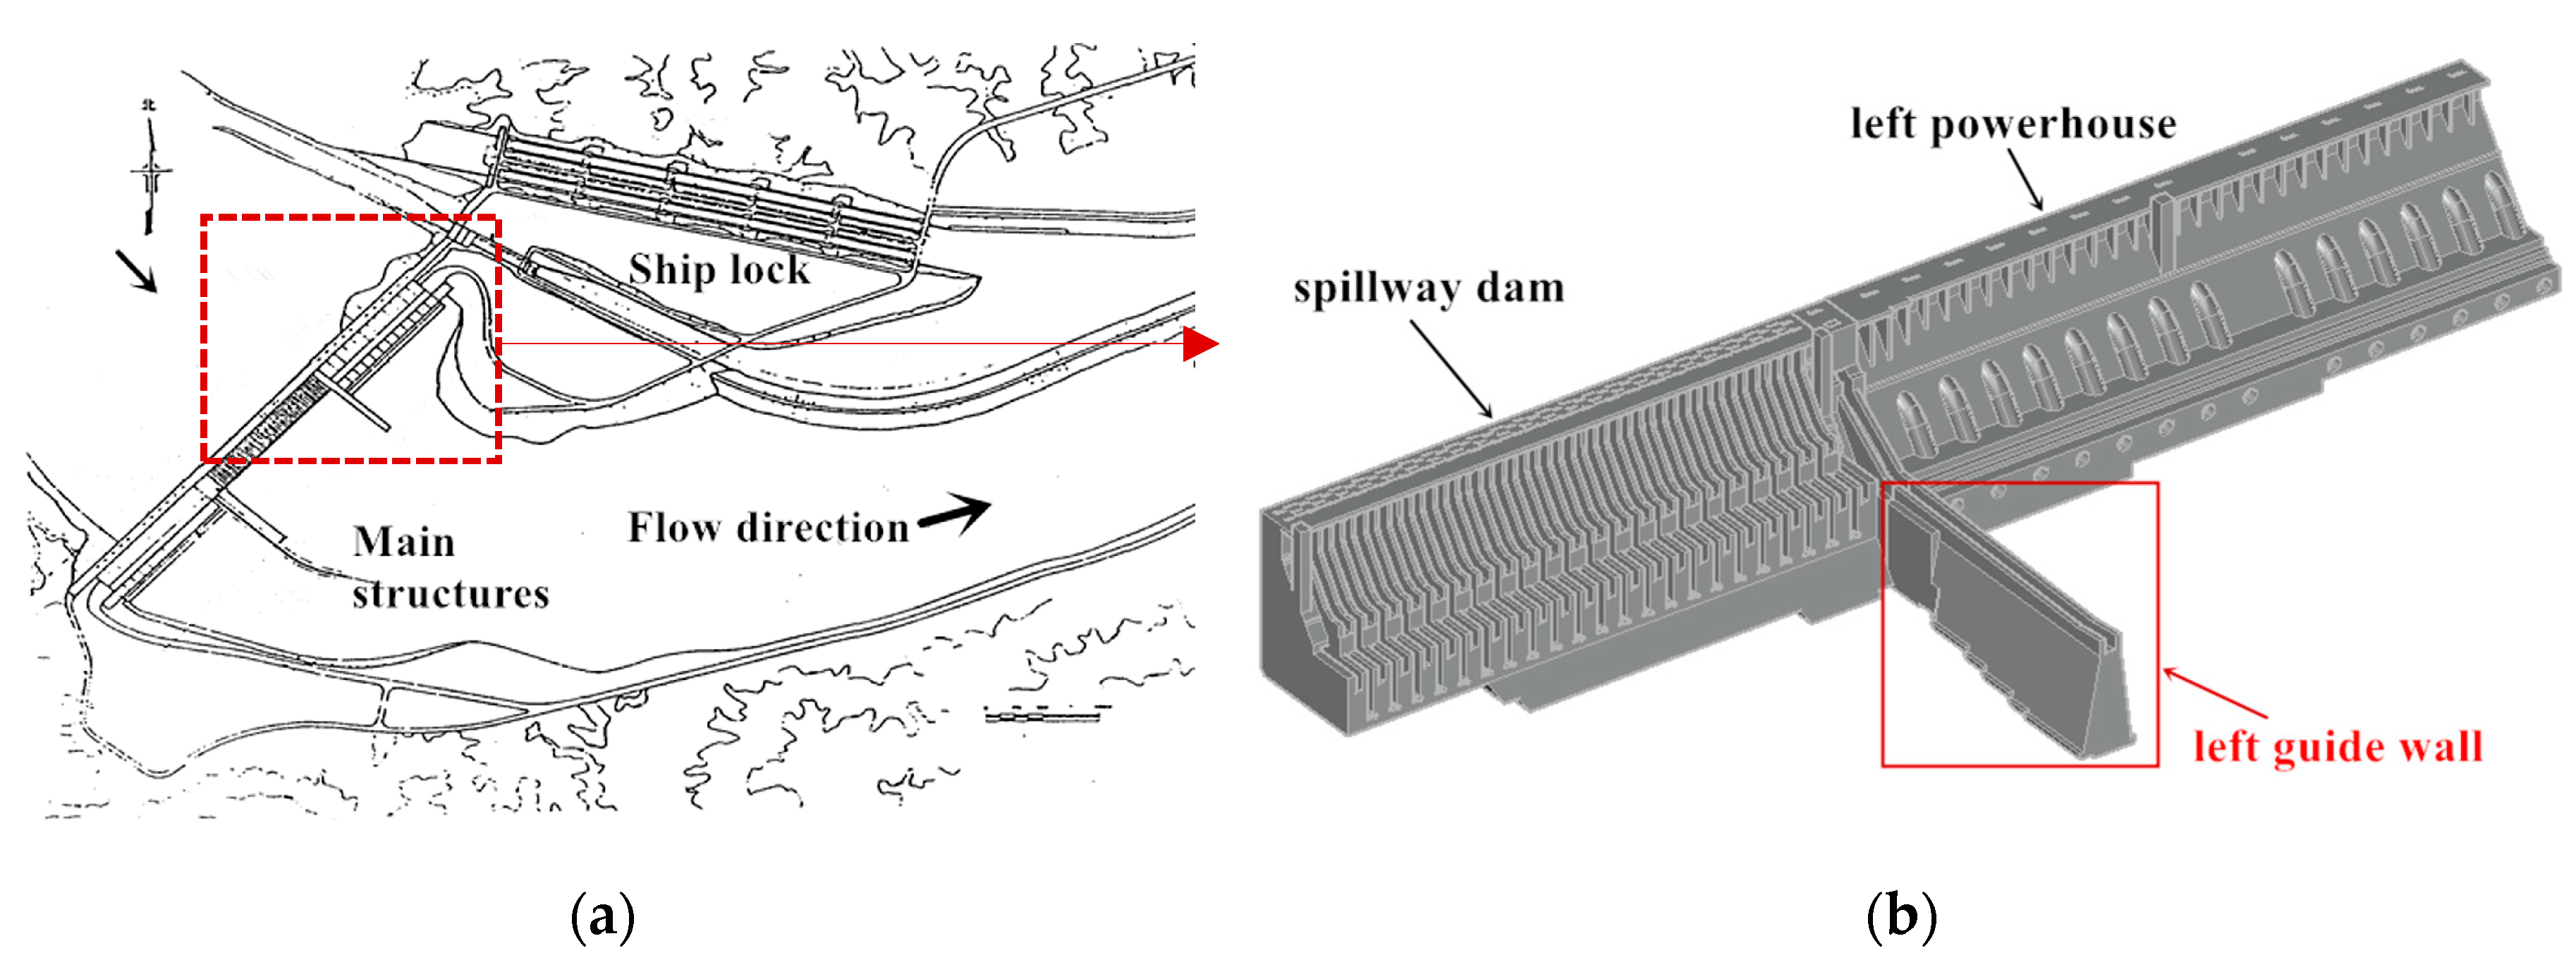
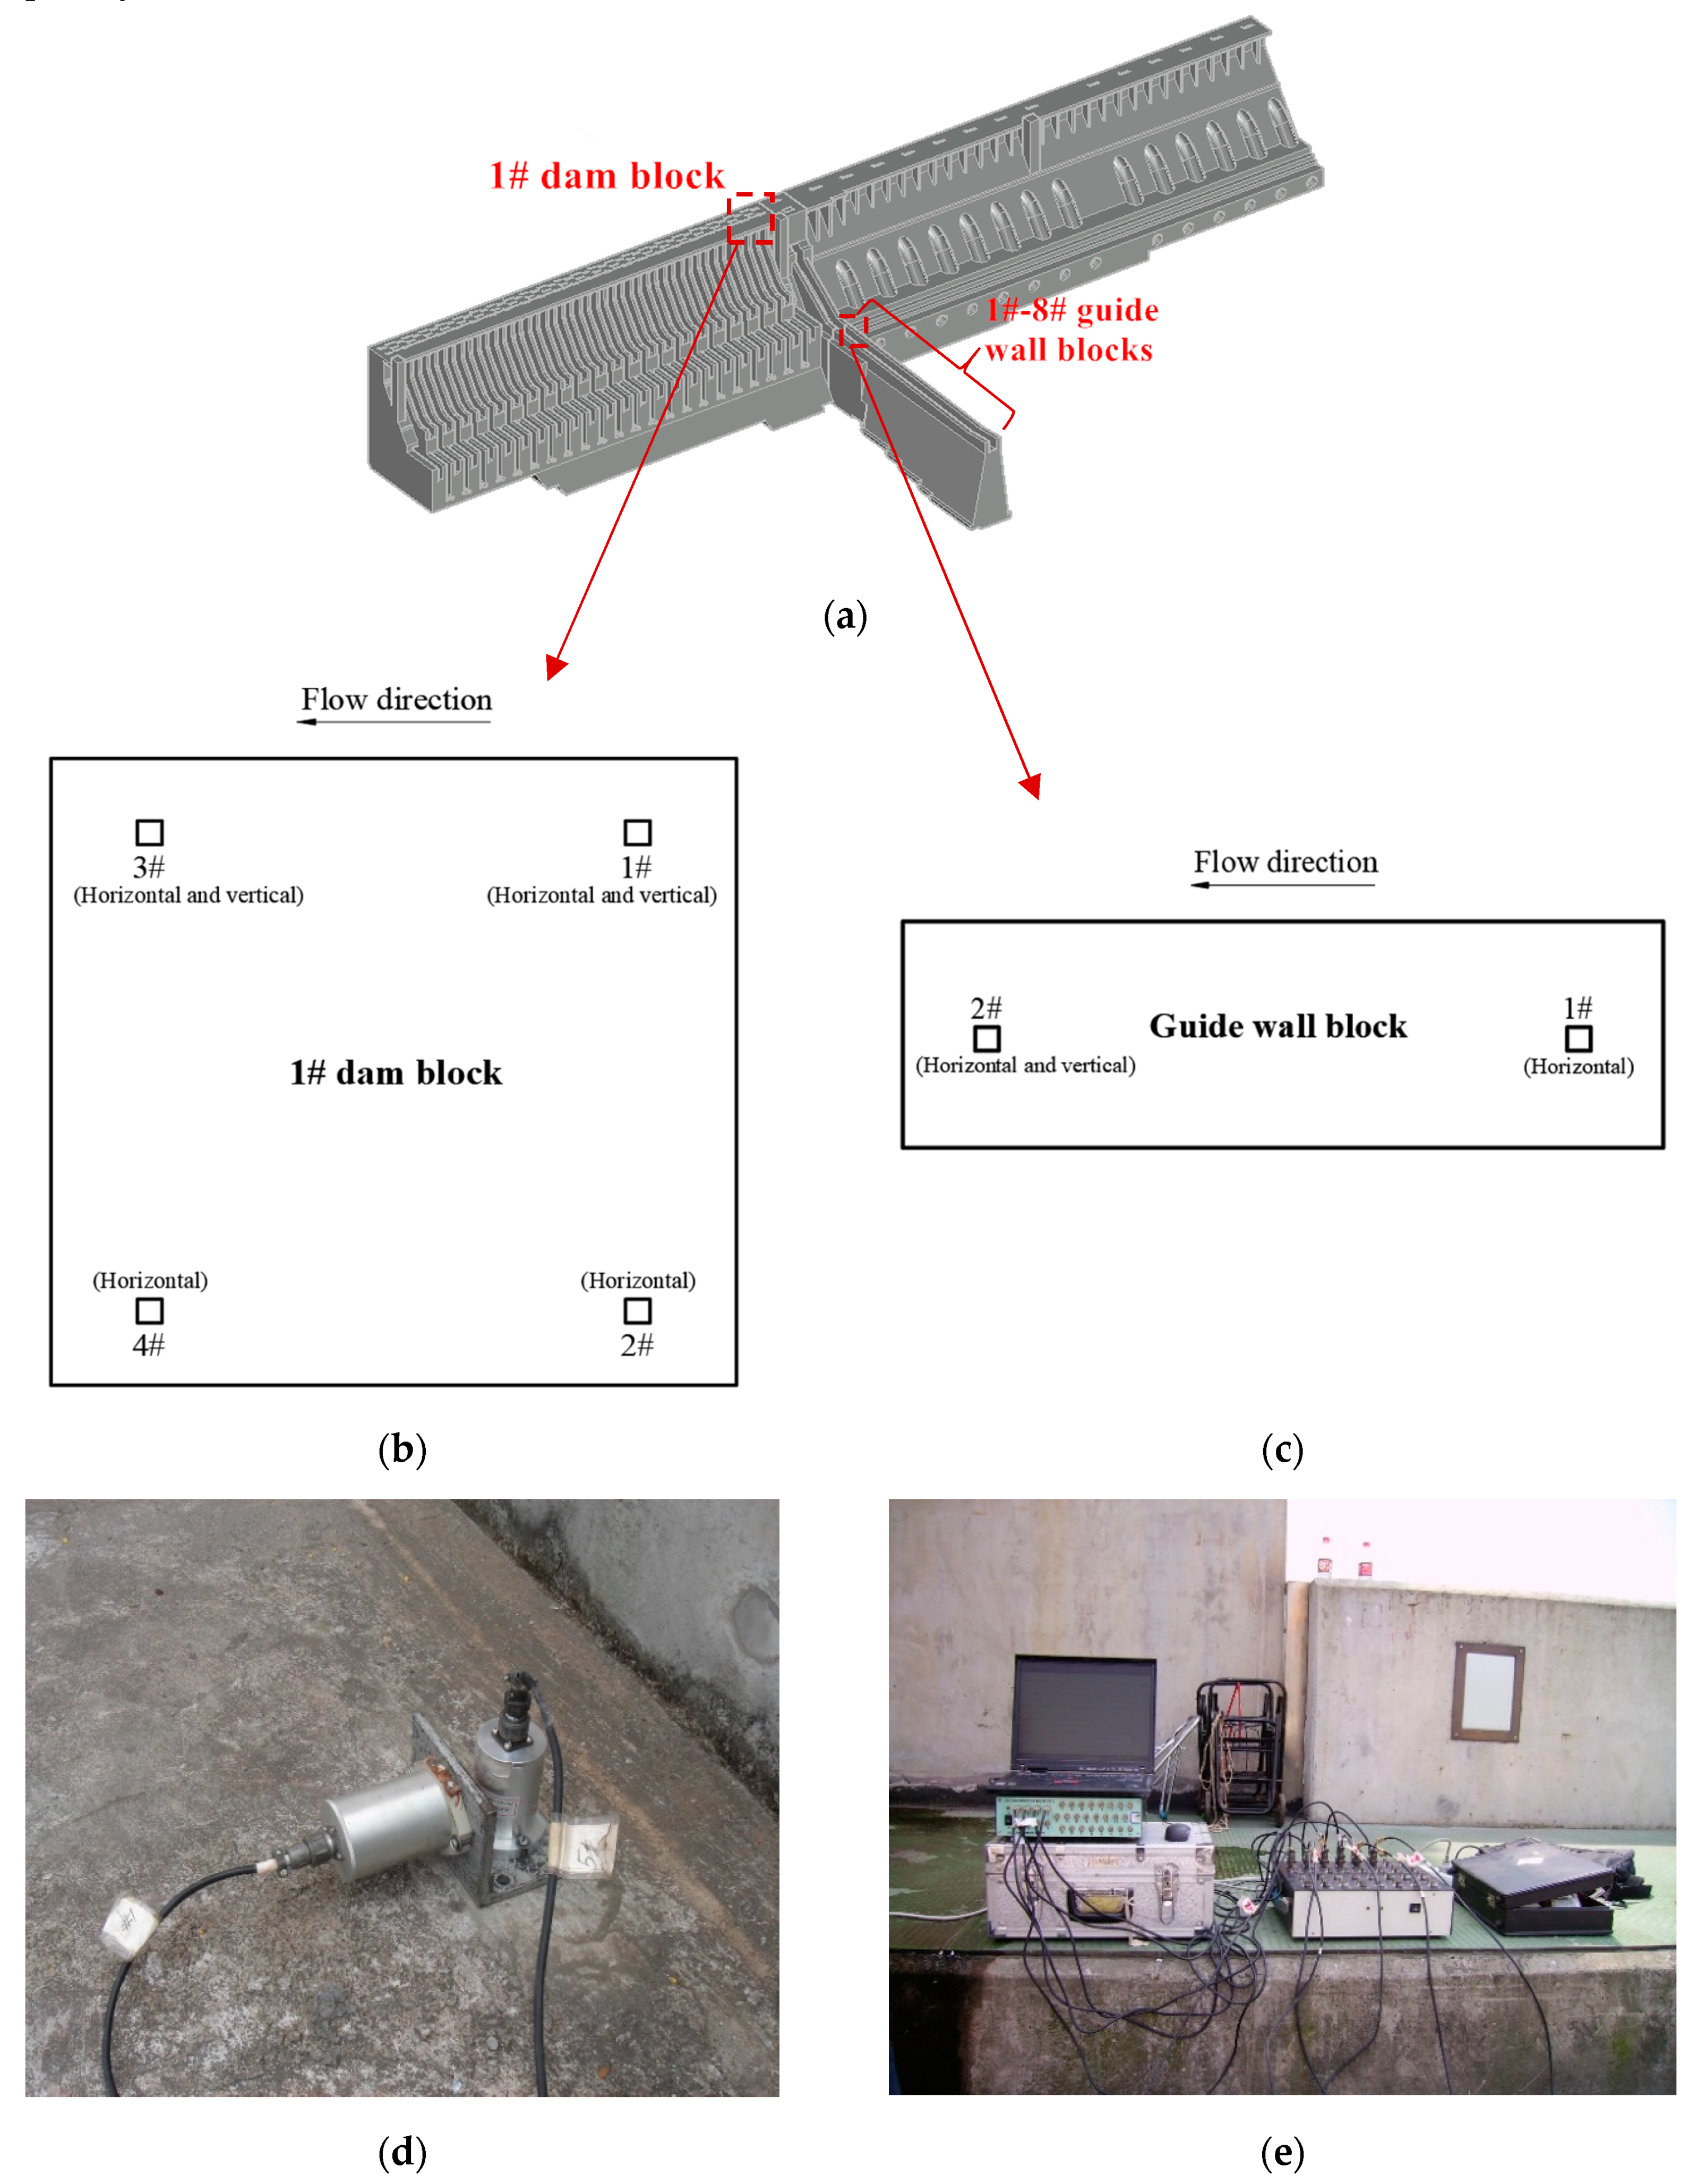
2. Prototype Tests for the Spillway Guide Wall Vibration

Three Gorges Hydropower Station (TGHS) is currently the largest hydropower station in the world, during the flood discharge, its structural safety is of utmost concern. The left spillway guide wall of TGHS is located between the left powerhouse and the spillway dam, as shown in Figure 1. During the flood discharge, the action area of fluctuation is large, and the action point is high, making the FIV a severe threat to the guide wall. To investigate the vibrational characteristics and mechanism of this guide wall, prototype tests of structural displacement were implemented.
In the tests, several displacement sensors were installed on 1# spillway dam block and eight guide wall blocks (1#–8#). There are four measuring points on the dam block: 1# and 2# measuring points were located at the upstream side, 3# and 4# measuring points were located at the downstream side. Horizontal displacement sensors were arranged for each of the measuring points, and two vertical displacement sensors were arranged for 1# and 3# measuring points. Similarly, on each guide wall block, the upstream measuring point 1# had one horizontal displacement sensor, and the downstream measuring point 2# had one horizontal displacement sensor and one vertical displacement sensor. All of the measuring points were tested simultaneously under the same working condition (listed in the Appendix A). The layout of the measuring points is illustrated in Figure 2. For the low dominant frequency of the vibration on the dam and the guide wall, the sampling frequency is 50 Hz.
The signals of typical measuring points for vibration displacements on the 1# dam block and each of the guide wall blocks is processed by the Fourier Transform (FT). The FT spectrums of horizontal and vertical displacements of the 1# dam block and typical guide wall blocks are respectively shown and compared in Figure 3 and Figure 4. For a better presentation and comparison of dominant frequencies, the power spectral densities (PSD) are normalized to 0–1 in the figures.
From the FT spectrums, it can be observed that there are several similar dominant frequencies of horizontal displacements between the 1# dam block and the guide wall blocks in a broad range of 0–15 Hz. However, for vertical displacements, similar dominant frequencies are concentrated in a narrow range of 0–5 Hz, which is the range of the dominant frequency of flow excitation [5,27]. For further investigation of this phenomenon, the dominant frequencies of horizontal displacements on the 1# dam block and guide wall blocks are listed in Table 1.
As shown in Table 1, apart from the dominant frequencies of flow fluctuations (less than 5 Hz), some of the dominant frequencies of the horizontal displacements of guide wall blocks tend to match that of 1# dam block in an approximate range: the range of 5.58–5.81 tends to match 6.04; 7.14–7.22 tends to match 7.11; 16.26 tends to match 16.27. The vibrational components with frequencies higher than 5 Hz are considered to represent the structural resonances of certain modes under flow excitations because the fundamental frequencies of structures are usually higher than 5 Hz, which will be analyzed in detail in Section 4.2. It can be inferred that the horizontal vibrational characteristics of the dam block and the guide wall blocks are relevant to some extent, which can postulate that the vibration propagated from the dam may participate in the guide wall vibration for certain defined frequencies. To verify the postulation and judge the vibrational relationship between 1# dam block and guide wall blocks, the theoretical analyses of the guide wall must be proposed.

3. Theoretical Analyses

3.1. The Guide Wall Vibration under FSI

It is noted that the guide wall is a hydraulic structure that is partially submerged in water, as shown in Figure 5. For such structures, the vibration is nonlinear and under the effect of the fluid–structure interaction (FSI) [27,28], which means the structural loads and responses are mutually influential. To investigate the effect of FSI, the coupled equations of motion (EOM) of FSI are discussed below.
Suppose that the fluid around the guide wall is homogenous, incompressible, non-viscous and irrotational. Therefore, the hydrodynamic pressure and velocity potential of the fluid satisfy the following relationships:
2 p = 0
2 ϕ = 0
where p denotes the hydrodynamic pressure field; ϕ denotes the velocity potential; is the del operator. Employing the Galerkin method to discretize Equation (1), the discrete fluid motion equation can be deduced as follows [29,30]:
H p + A p ˙ + E p ¨ + ρ B r ¨ + q 0 = 0
where ρ denotes the fluid density; r denotes the displacement vector; q 0 denotes the input excitation vector; and
H = Ω N N T d Ω A = 1 C w S r N N T d S r E = 1 C w 2 Ω N N T d Ω + 1 g S f N N T d S f B = ( S l N N s T d S l ) Λ
where N and N s denote the shape functions of the fluid and fluid–structure interface, respectively; S r , S f , and S l denote the areas of infinite boundary, free surface, and the fluid–structure interface, respectively; Ω denotes the volume of the fluid; C w denotes the compression wave velocity; g denotes the gravity acceleration; Λ denotes the coordinate transformation matrix; the superscript T denotes the transpose of the corresponding matrix. It is noted that the matrix H represents the “stiffness” of the fluid, and the matrix B represents the coupled characteristics on the fluid-structure interface.
The EOM of a structure in the fluid is given as the following:
M s x ¨ + C x ˙ + K x + f p + f 0 = 0
where x is the displacement vector; M s , C , and K denote the mass, stiffness and damping matrices of the structure, respectively; f p denotes the hydrodynamic nodal forces on the fluid–structure interface; f 0 denotes the external excitation apart from f p . Gathering the contributions of each fluid element, f p can be obtained as the following:
f p = B T p
and Equation (5) can be rewritten as follows:
M s x ¨ + C x ˙ + K x B T p + f 0 = 0
It is noted that the dynamic behavior of a fluid-structure system considering FSI can be obtained as the combination of Equations (3) and (7). The combined EOM is given as follows:
[ M s 0 ρ B E ] [ x ¨ p ¨ ] + [ C 0 0 A ] [ x ˙ p ˙ ] + [ K B T 0 H ] [ x p ] = [ f 0 q 0 ]
As an arbitrary load can be Fourier transformed into the sum of harmonic excitations with different frequencies, the input excitation q 0 can be considered as a harmonic force,
q 0 = Q 0 e i ω t
Matching the form of the input excitation, the solution of Equation (7) can be expressed as follows:
{ x = x 0 e i ω t p = p 0 e i ω t
As mentioned above, the fluid is considered to be incompressible ( C w ), which means A 0 ; the effect of the free surface is usually neglected, so E 0 . Moreover, the external excitation f 0 is equal to zero in this case as the excitation is flow excitation only. Substituting into Equation (8), the equation can be obtained as follows:
[ ω 2 M s + i ω C + K B T ρ ω 2 B H ] [ x 0 p 0 ] = [ 0 Q 0 ]
The displacement x 0 can be obtained as follows:
[ ω 2 ( M s + ρ B T H 1 B ) i ω C K ] x 0 = B T H 1 Q 0
Equation (12) can be rewritten as follows:
( M s + M a ) x ¨ + C x ˙ + K x = P
where
M a = ρ B T H 1 B P = B T H 1 q
Equation (13) is a common form of EOM. It is noted that P is a coupled input excitation. In practical prototype tests, the value of P can be measured as the fluctuation pressure acting on the fluid–structure interface, which is an actual value that can take all the coupled characteristics into consideration. Therefore, the effect of FSI can be concluded as M a , which is defined as the added mass in existing studies.
The value of added mass is difficult to calculate. In existing studies, several models have been established to calculate the approximate value of the added mass. For large hydraulic structures such as dams, the most classic method is the Westergaard method [31,32]. The added mass can be calculated as follows:
M a = 7 8 ρ h z
where ρ denotes the water density; h denotes the depth of water above the base; z denotes the distance from the surface.
Concluded from practical hydraulic projects [5], the value in Equation (15) is larger than reality. In the engineering field, the added mass is usually considered as follows:
M a = 0.5 ρ h z
With an added mass, the effect of FSI can be taken into consideration, and a more simplified theoretical model of the guide wall can be established.

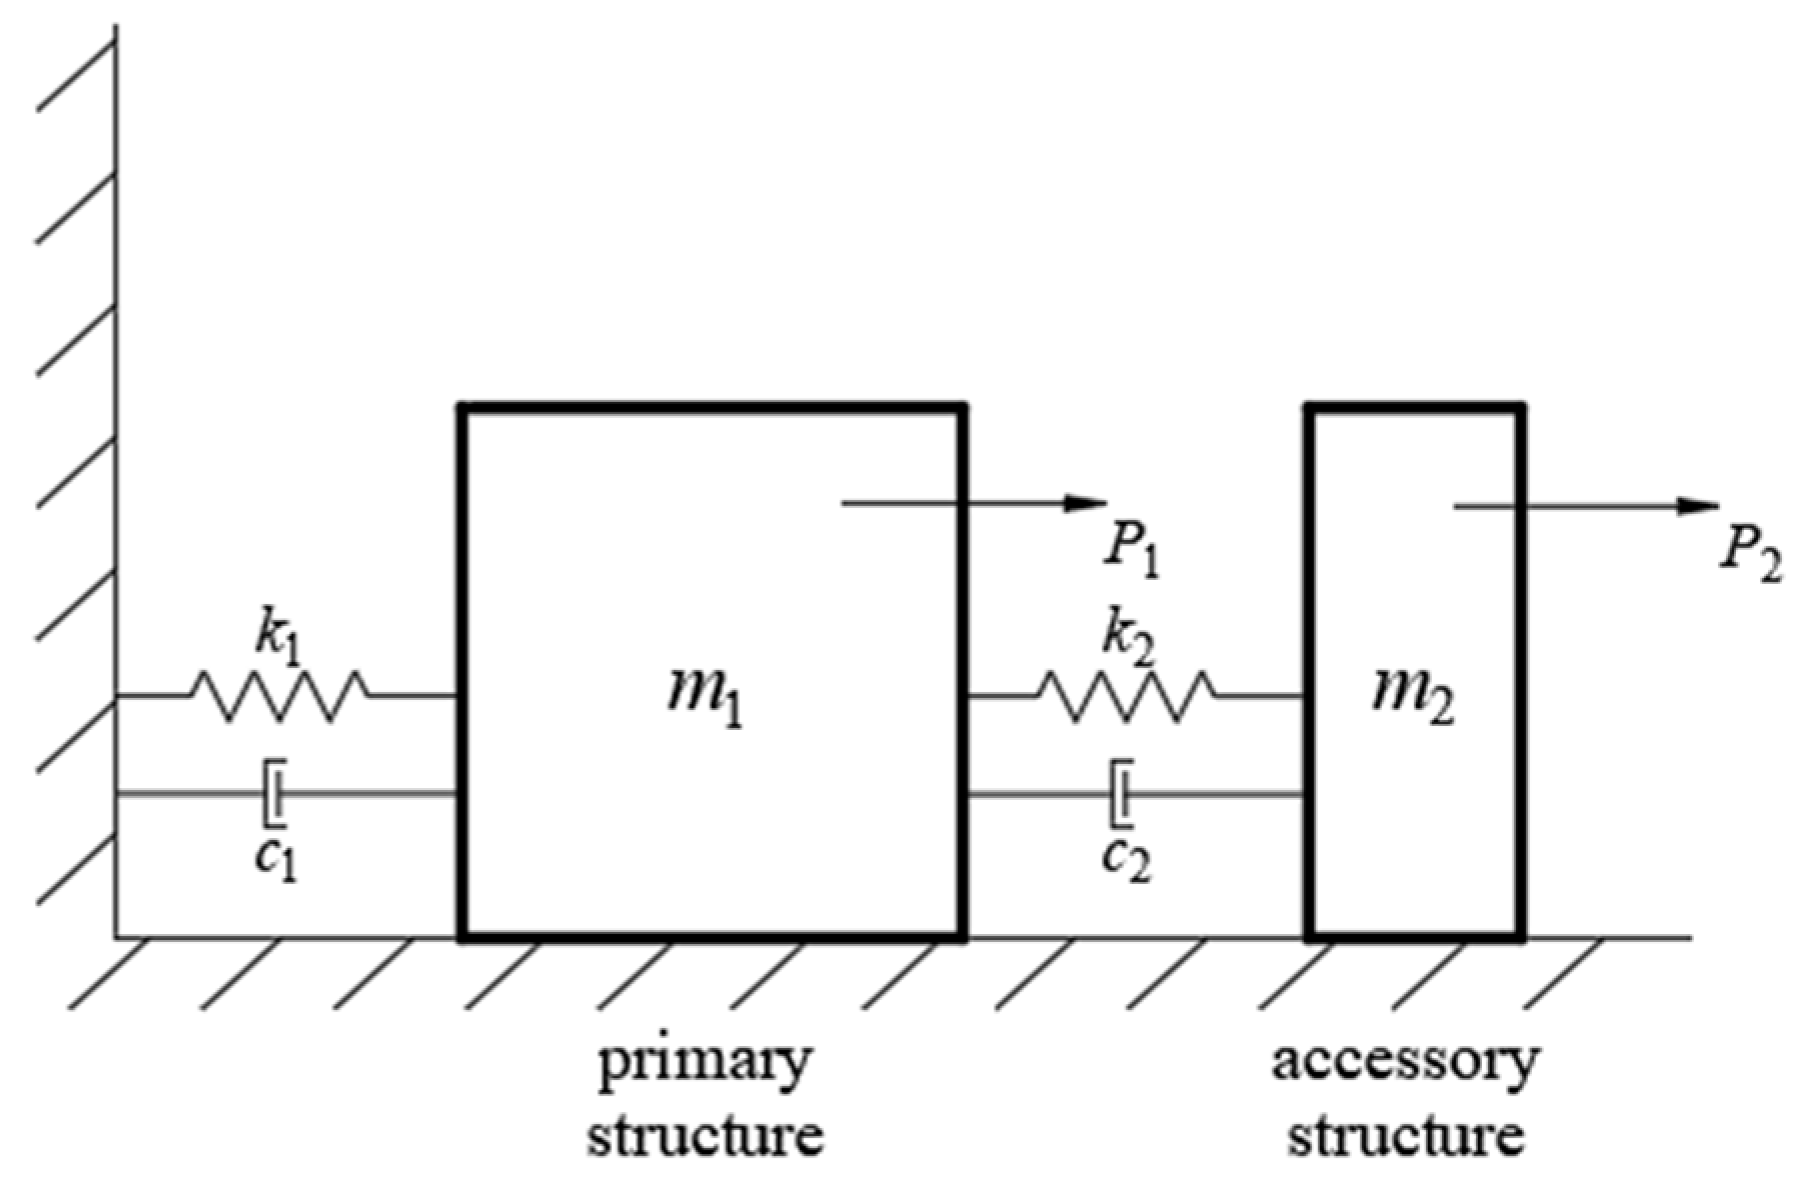
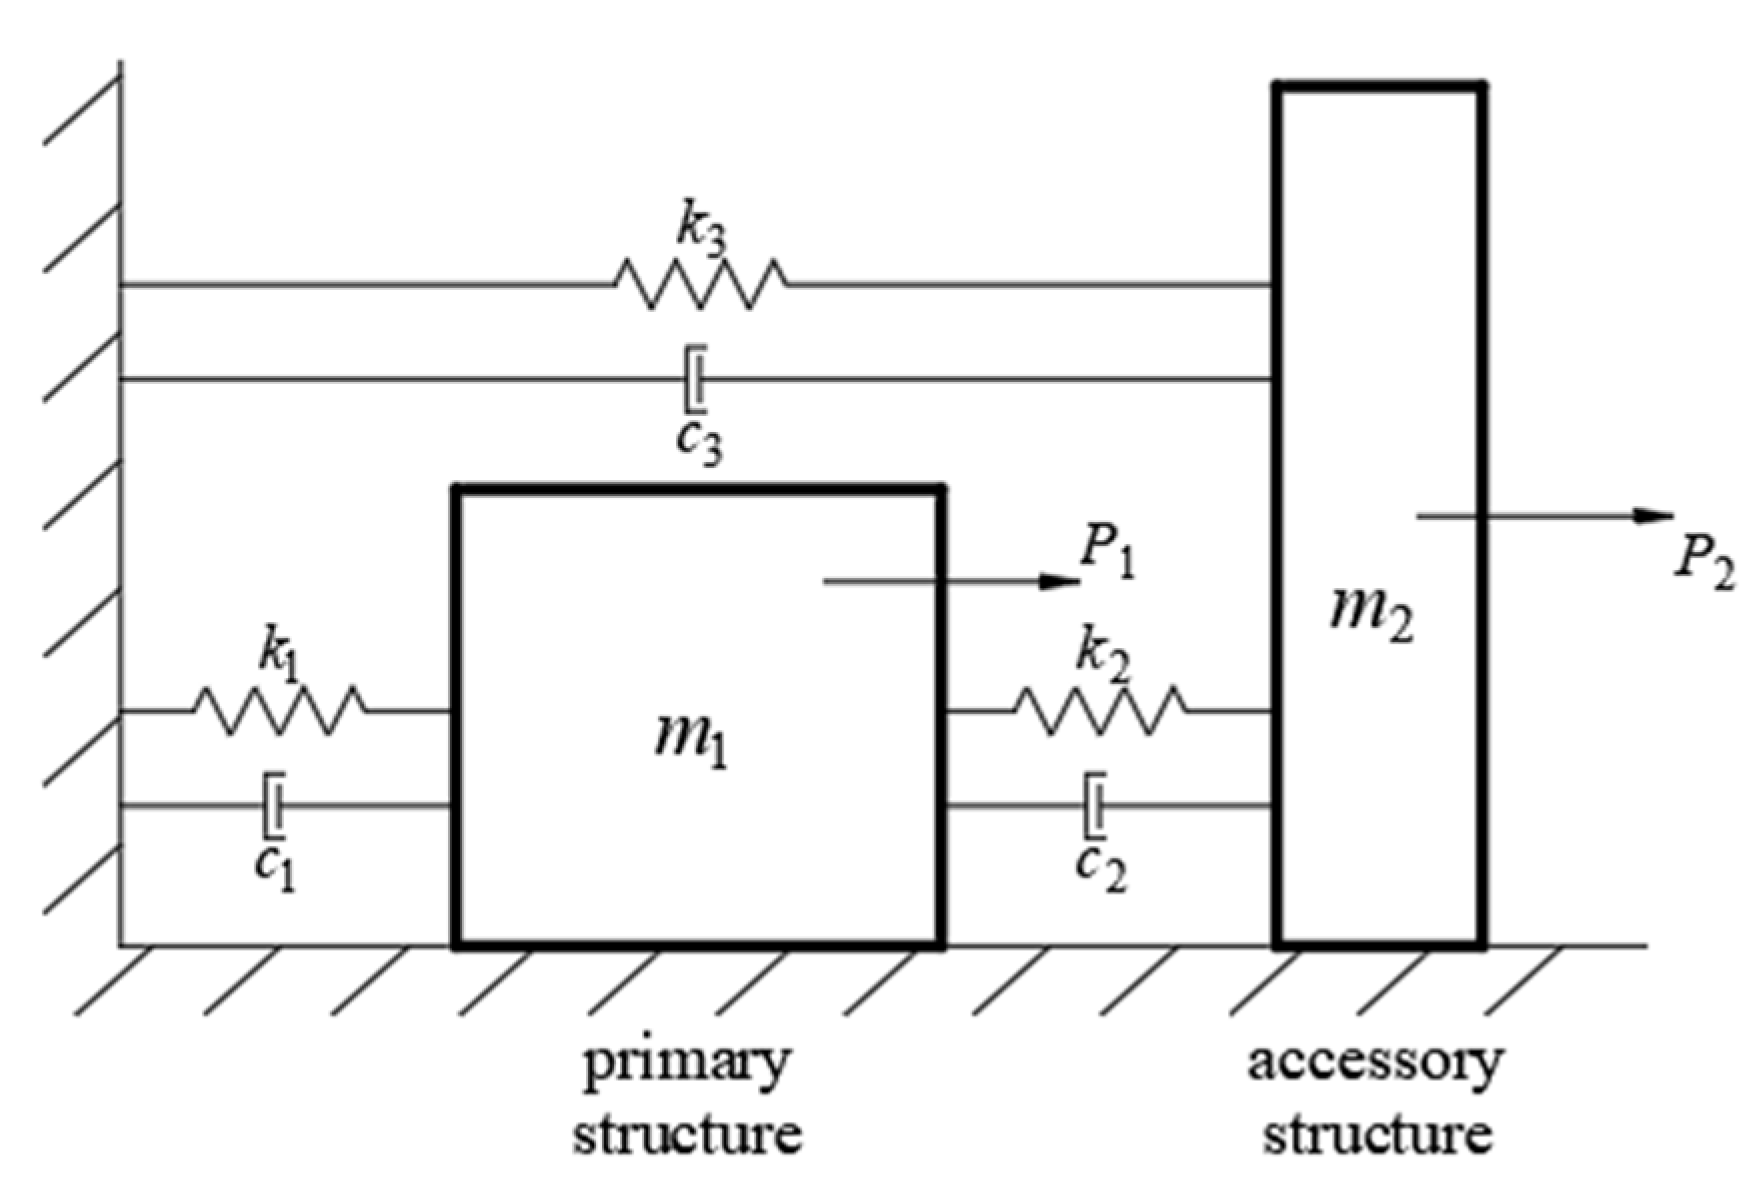
3.2. Theoretical Model

The hydraulic structures, including dams, spillway guide walls, hydraulic gates, are complex multi-degrees-of-freedom (MDOF) systems with complicated connections and damping conditions. For ease of calculation, the complex MDOF system should be simplified appropriately. This paper mainly concerns the vibrational response of the guide wall and the dam so that the system can be transformed into a two-degrees-of-freedom system. It is worth mentioning that the guide wall has a lighter weight compared to the weight of the large-scale concrete dam. To investigate the simplified form of the vibration system in this circumstance, the existing research of the hydraulic gate, another type of lightweight hydraulic structure, can provide a reference.
To investigate the hydraulic gate vibration, Liang [12] established a two-degrees-of-freedom theoretical model, shown in Figure 6. The model is inspired by the dynamic vibration absorber (DVA), which is commonly employed in the transportation field to control the vibration of vehicles [33]. The two-degrees-of-freedom system consists of two parts: the lightweight accessory structure and the heavyweight primary structure. While the primary structure is under the external excitation P 1 , the vibration component induced by P 1 is transferred from the primary structure to the accessory structure through the simplified stiffness K 2 and damping C 2 , leading to an intensity increase in the accessory structure. This kind of vibration can be defined as associated vibration (AV), and the two-degrees-of-freedom system can be consequently named as the AV system. In practice, the hydraulic gate can be treated as the accessory structure, and the dam can be treated as the primary structure. By analyzing the dynamic responses of the accessory structure in this model, the mechanism of intense vibration that occurred in the surface outlet radial gate of the Jinping arch dam in China has been successfully elucidated.
It is noted that the spillway guide wall has a lighter weight than the dam, and can also be considered as an accessory structure connected to the dam. However, the theoretical model for the vibration mechanism of the spillway guide wall is quite different from that for the hydraulic gate vibration mechanism. The reason is that the hydraulic gate is rigidly connected to the dam, while the guide wall is connected to not only the dam but also the foundation. Moreover, the connection between the guide wall and the dam is usually in a flexible form, such as sealing devices, diving joint, and the connection between the guide wall and the foundation is similar to the dam–foundation connection. With regard to these characteristics, the former model can be modified as shown in Figure 7, with the constraint between the guide wall and the foundation taken into account. Note that only horizontal constraints are considered in the theoretical model. The reasons are that in prototype results, the vertical displacements of the dam and the guide wall show less synchronization for structural resonance frequencies, which is analyzed in Section 2. As shown in Figure 8, the vertical displacement of the guide wall is measured as being smaller, which, in practice, is not a major threat to safety [13].
The EOMs for this modified two-degrees-of-freedom system are as follows [34,35]:
{ M 1 x ¨ 1 + C 2 ( x ˙ 1 x ˙ 2 ) + K 2 ( x 1 x 2 ) + C 1 x ˙ 1 + K 1 x 1 = P 1 M 2 x ¨ 2 + C 2 ( x ˙ 2 x ˙ 1 ) + K 2 ( x 2 x 1 ) + C 3 x ˙ 2 + K 3 x 2 = P 2
where x 1 , x ˙ 1 , and x ¨ 1 denote the displacement, velocity, and acceleration of the primary structure, respectively; x 2 , x ˙ 2 , and x ¨ 2 denote the displacement, velocity, and acceleration of the accessory structure, respectively; P 1 and P 2 denote the time-variant external exciting force applied to the primary structure and the accessory structure, respectively; M 1 and M 2 denote the coupled mass of the accessory structure and the accessory structure, respectively, which are the sums of the structural and added masses of the corresponding structure, i.e., M j = M s j + M a j   ( j = 1 , 2 ) ; K 1 and C 1 denote the stiffness and damping of the primary structure, respectively; K 2 and C 2 represent the stiffness and damping between the accessory structure and the primary structure, respectively; K 3 and C 3 represent the stiffness and damping between the accessory structure and the foundation, respectively. As K 2 and C 2 approach zero, the connection to the primary structure tends to disappear; therefore, the accessory structure becomes an independent structure subjected to the forced vibration (FV) only. Similarly, while K 3 and C 3 approach zero, the accessory structure becomes an absolute accessory unit of the dam, and the associated vibration (AV) will be generated. Therefore, the dynamic system shown in Figure 7 can be named as the associated-forced coupled vibration (AFCV) system, and in this AFCV system, K 2 and C 2 represent the factors of AV; K 3 and C 3 represent the factors of FV.
In this study, the exciting forces are flow excitations measured on the fluid–structure interface, which can be Fourier transformed as the sum of a series of harmonic forces in the engineering vibrational field. Hence, P 1 and P 2 can be expressed as harmonic forces [4,5,12,33,36] with forms as below:
P 1 = F 1 e i ω 0 t
P 2 = F 2 e i ω 0 t
where F 1 and F 2 denote the amplitudes of corresponding external exciting forces; i is the imaginary unit; ω 0 is the frequency of excitation, which is considered as an equalized value in Equations (18) and (19), since both excitations are induced from supercritical flow.
Matching the form of the exciting forces, the dynamic responses can be expressed as follows:
x 1 = X 1 e i ω 0 t
x 2 = X 2 e i ω 0 t
with two complex coefficients, X 1 and X 2 , given to match the form of the excitation. After substitution into Equation (17), X 1 and X 2 can be obtained as follows:
X 1 = ( M 2 ω 0 2 + i ω 0 C 2 + K 2 + i ω 0 C 3 + K 3 ) F 1 + ( i ω 0 C 2 + K 2 ) F 2 ( M 2 ω 0 2 + i ω 0 C 2 + K 2 + i ω 0 C 3 + K 3 ) ( M 1 ω 0 2 + i ω 0 C 1 + K 1 ) + ( M 2 ω 0 2 + i ω 0 C 3 + K 3 ) ( i ω 0 C 2 + K 2 )
X 2 = ( i ω 0 C 2 + K 2 ) F 1 + ( M 2 ω 0 2 + i ω 0 C 1 + K 1 + i ω 0 C 2 + K 2 ) F 2 ( M 2 ω 0 2 + i ω 0 C 2 + K 2 + i ω 0 C 3 + K 3 ) ( M 1 ω 0 2 + i ω 0 C 1 + K 1 ) + ( M 2 ω 0 2 + i ω 0 C 3 + K 3 ) ( i ω 0 C 2 + K 2 )
To analyze the dynamic response of the accessory structure under this system, the amplitude coefficient is defined as the ratio between the moduli of X 2 and the static response X s t
| X 2 X s t | = A 1 2 + A 1 2 B 1 2 + B 1 2
where
X s t = F 2 K 2 + K 3 A 1 = γ λ 13 2 / λ 12 2 + γ μ λ 01 2 λ 12 2 μ λ 01 2 λ 13 2 + μ λ 12 2 + μ λ 13 2 + λ 13 2 / λ 12 2 + 1 A 2 = 2 γ ξ 2 λ 01 λ 13 2 / λ 12 + 2 γ ξ 2 λ 01 λ 12 + 2 μ ξ 1 λ 01 λ 12 2 + 2 μ ξ 1 λ 01 λ 13 2 + 2 ξ 2 λ 01 λ 13 2 / λ 12 + 2 ξ 2 λ 01 λ 12 B 1 = μ λ 01 4 λ 12 2 λ 13 2 μ λ 01 2 λ 13 2 μ λ 01 2 λ 12 2 4 μ λ 01 2 λ 12 λ 13 2 ξ 1 ξ 2 4 μ λ 01 2 λ 12 2 λ 13 ξ 1 ξ 3 4 μ λ 01 2 λ 12 λ 13 ξ 2 ξ 3 μ λ 01 2 λ 12 2 λ 13 2 + μ λ 12 2 + μ λ 13 2 λ 01 2 λ 13 2 + 1 B 2 = 2 μ λ 01 3 λ 12 λ 13 2 ξ 2 2 μ λ 01 3 λ 12 2 λ 13 ξ 3 2 μ λ 01 3 λ 12 2 λ 13 2 ξ 1 + 2 μ λ 01 λ 13 ξ 1 + 2 μ λ 01 λ 12 2 ξ 1 + 2 μ λ 01 λ 12 λ 13 2 ξ 2 + 2 μ λ 01 λ 12 2 λ 13 ξ 3 2 λ 01 3 λ 12 λ 13 2 ξ 2 + 2 λ 01 λ 13 ξ 3 + 2 λ 01 λ 12 ξ 2
with parameters including excitation amplitude ratio
γ = F 1 F 2
coupled mass ratio
μ = M 1 M 2
frequency ratio
λ a b = ω a ω b   ( a , b = 0 , 1 , 2 , 3 )
where ω j (j = 1,2,3) denotes the natural frequency of different structure in different system
ω 1 = K 1 M 1 ,   ω 2 = K 2 M 2 ,   ω 3 = K 3 M 2
and damping ratio
ξ 1 = C 1 2 M 1 ω 1 ,   ξ 2 = C 2 2 M 2 ω 2 ,   ξ 3 = C 3 2 M 2 ω 3
In this AFCV system, the natural frequency and damping ratio of the accessory structure are coupled values depending on M 2 , K 2 , K 3 , C 2 and C 3 , which are too complicated for calculation. Therefore, ω 2 and ω 3 are defined to represent the decoupled nature frequencies of the accessory structure in the AV system and the independent FV system. Similarly, ξ 2 and ξ 3 are decoupled damping ratios of AV and FV systems.
To investigate the mechanism of guide wall vibration, the amplitude coefficient of the accessory structure is calculated to analyze its dynamic response in the AFCV system, and the aforementioned two kinds of vibrations are taken into account and a comparison is made to explore their contribution to the coupled vibration.

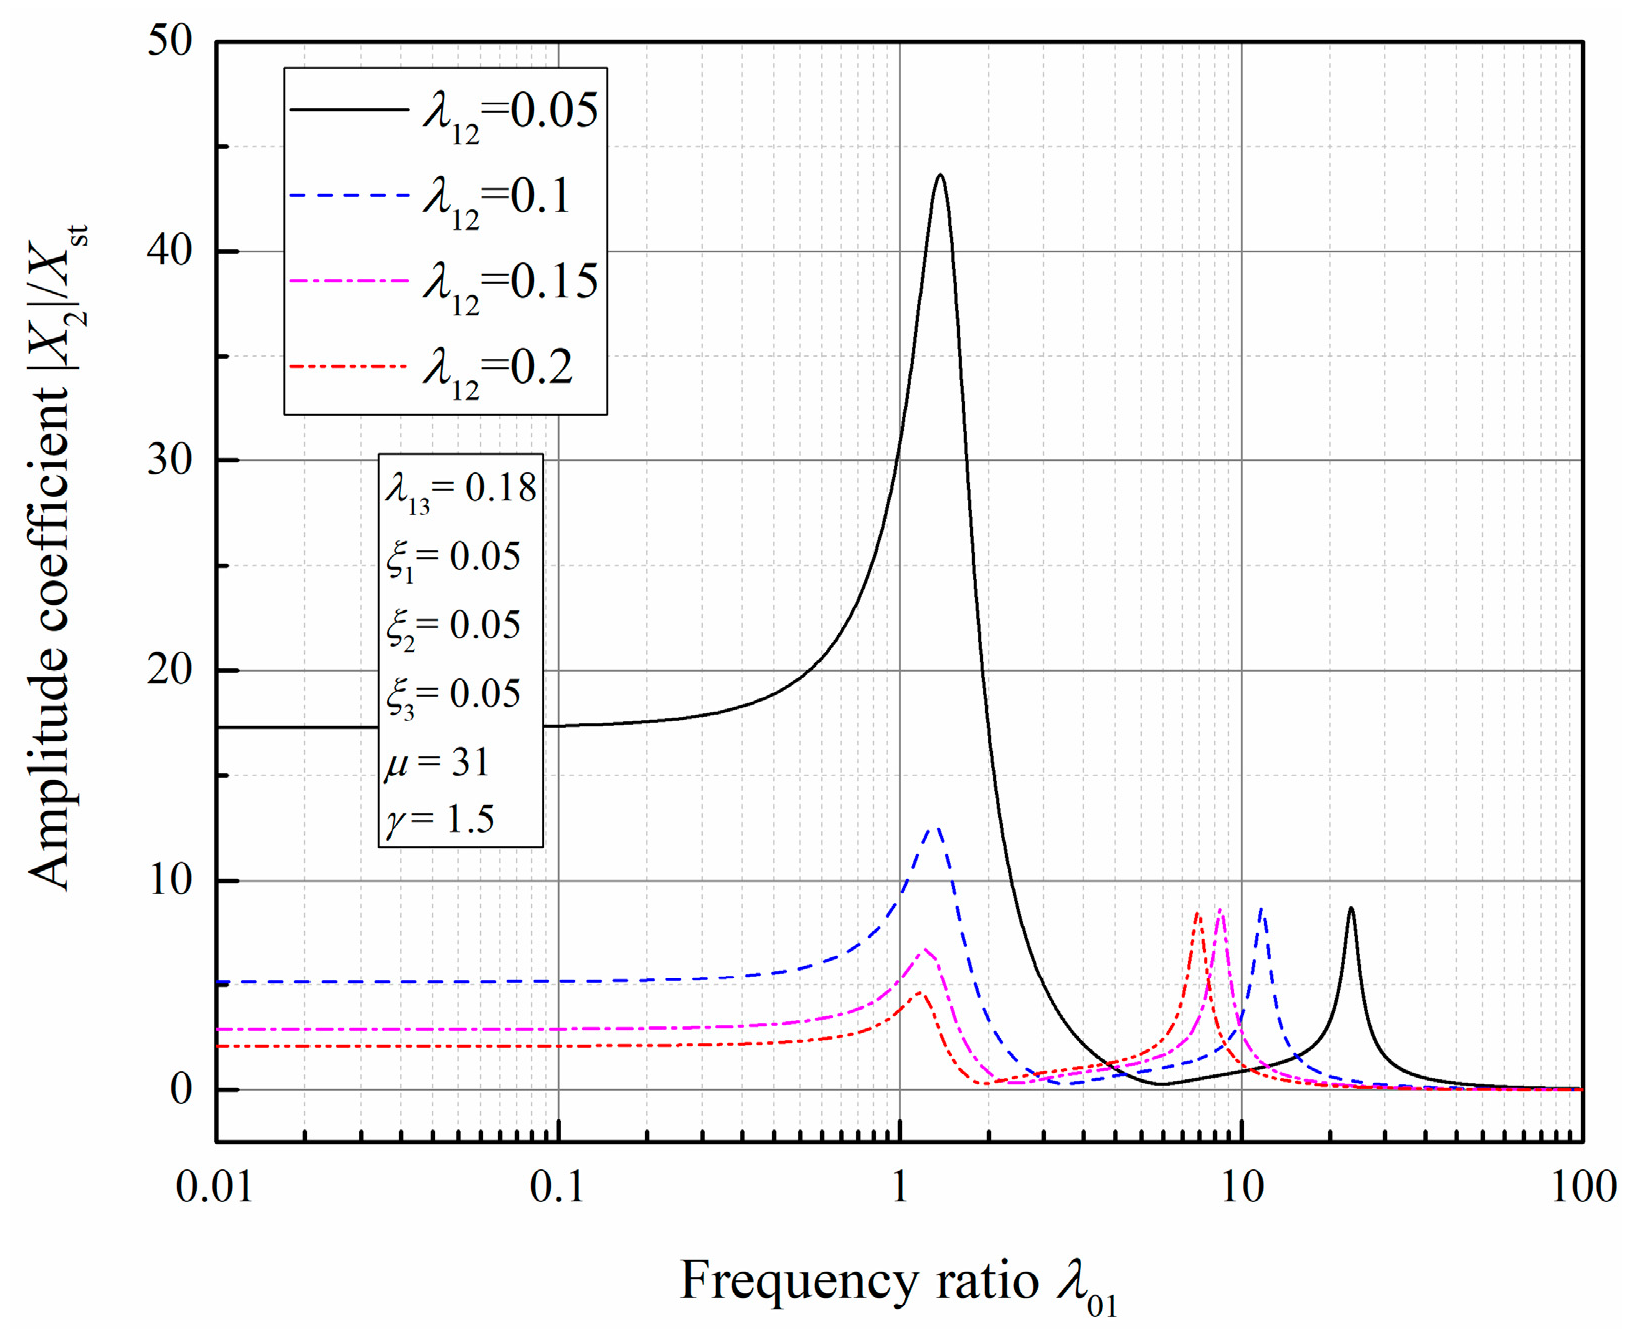
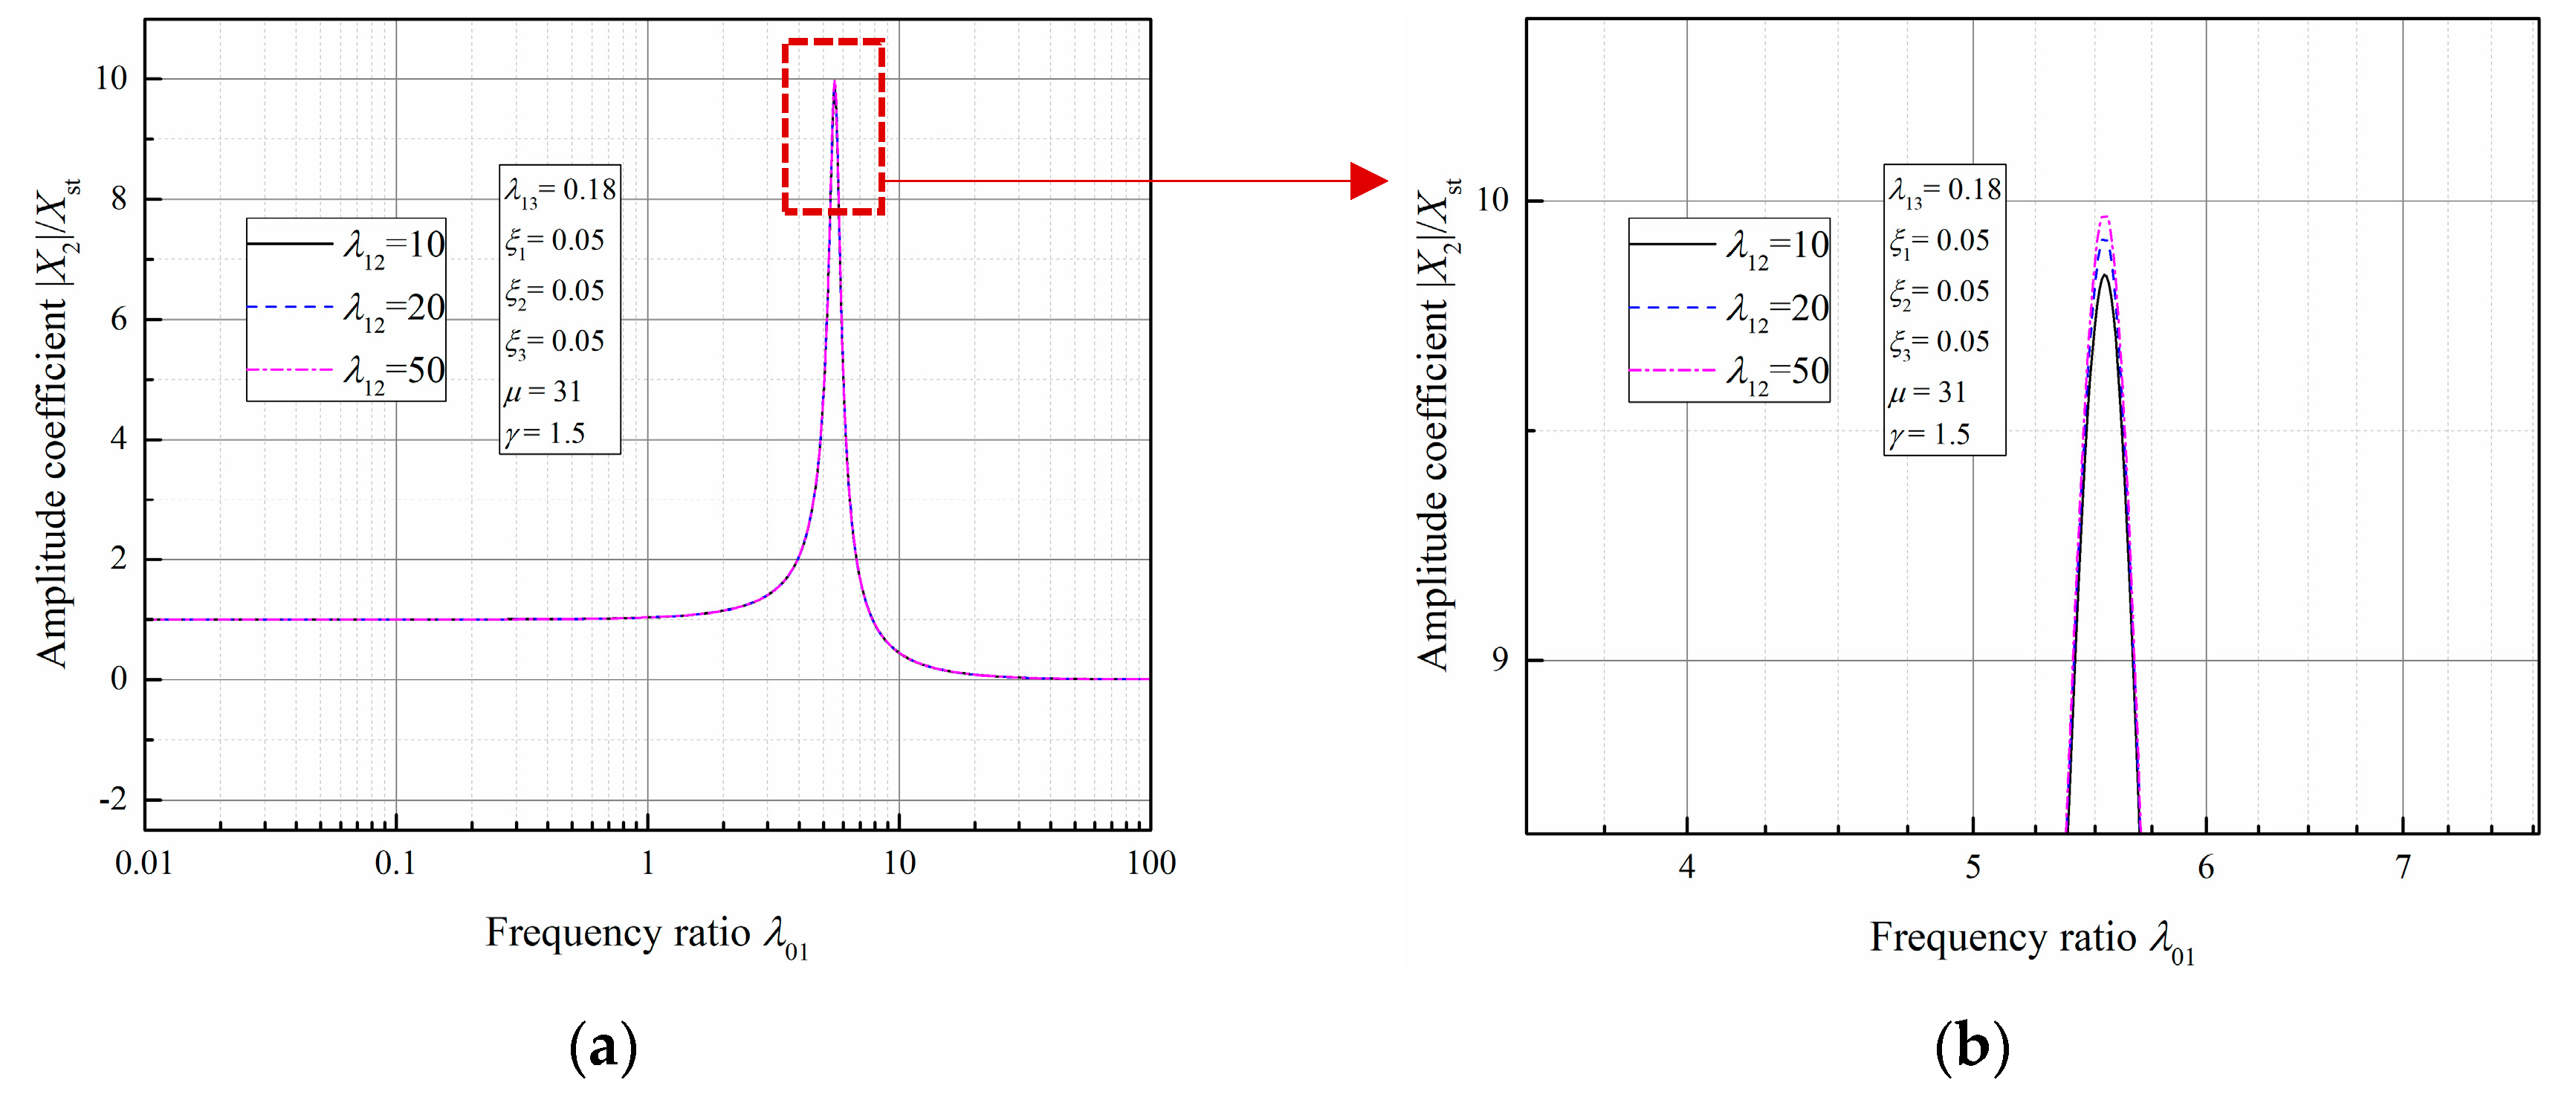
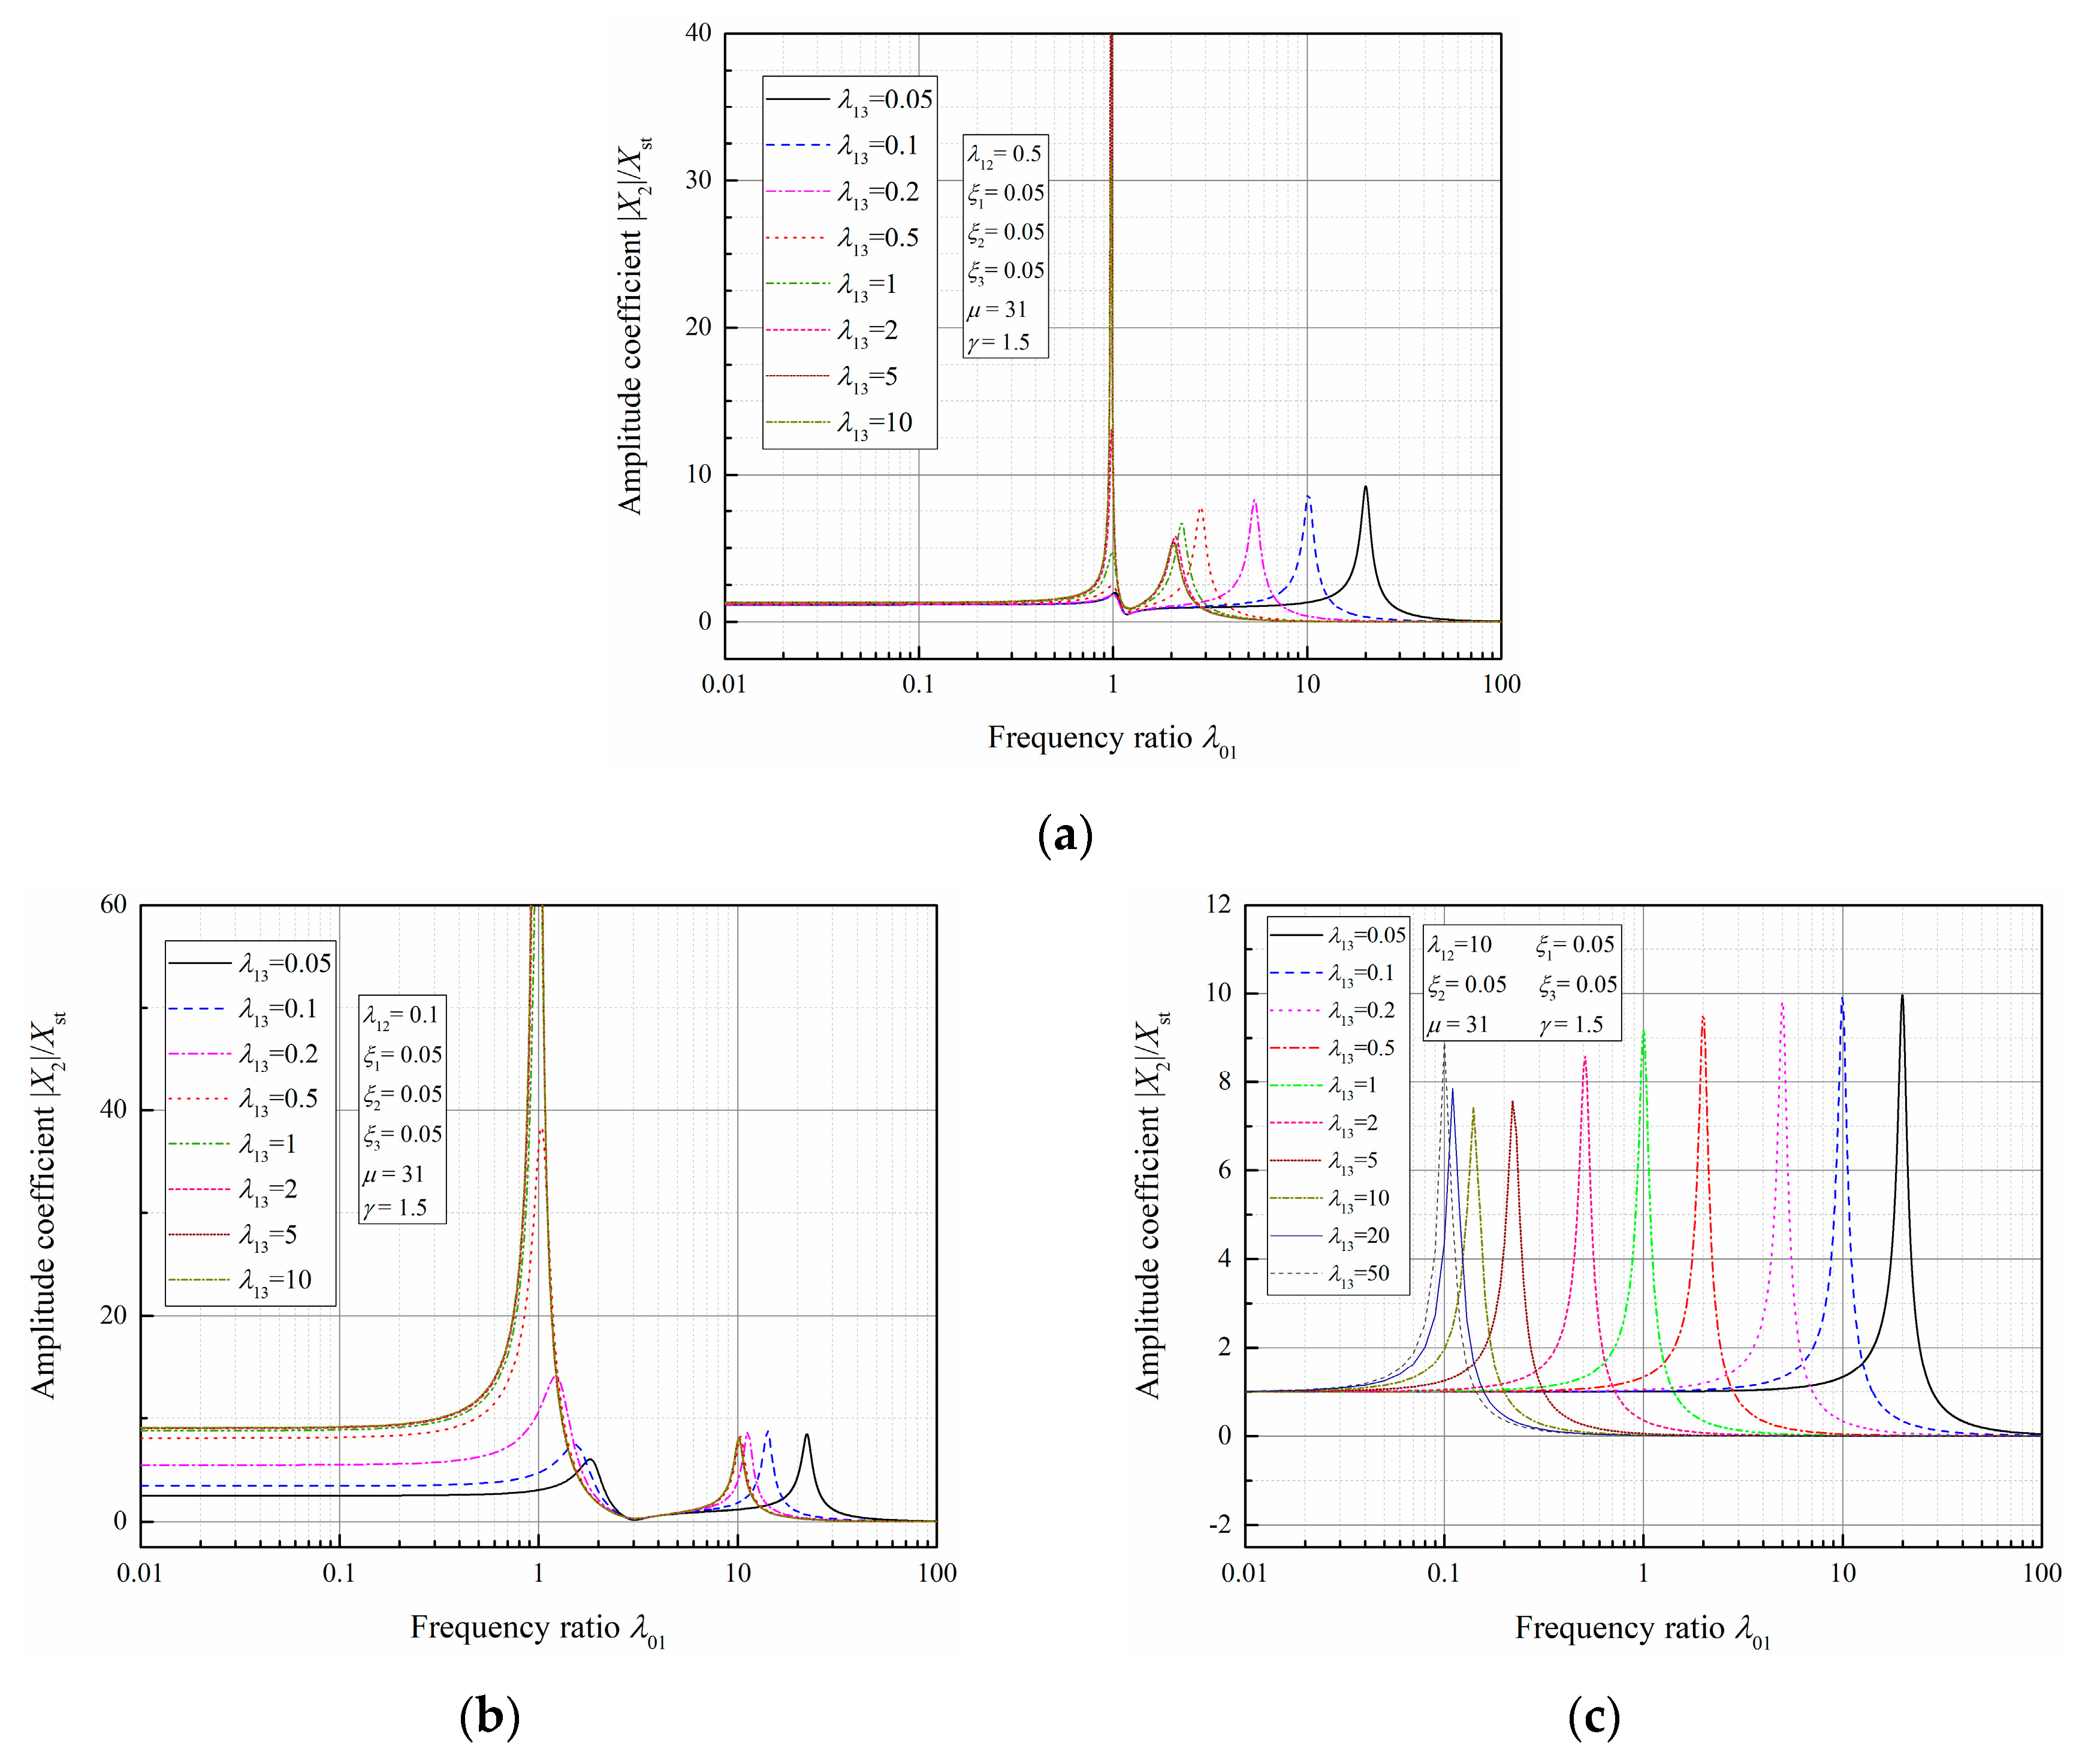
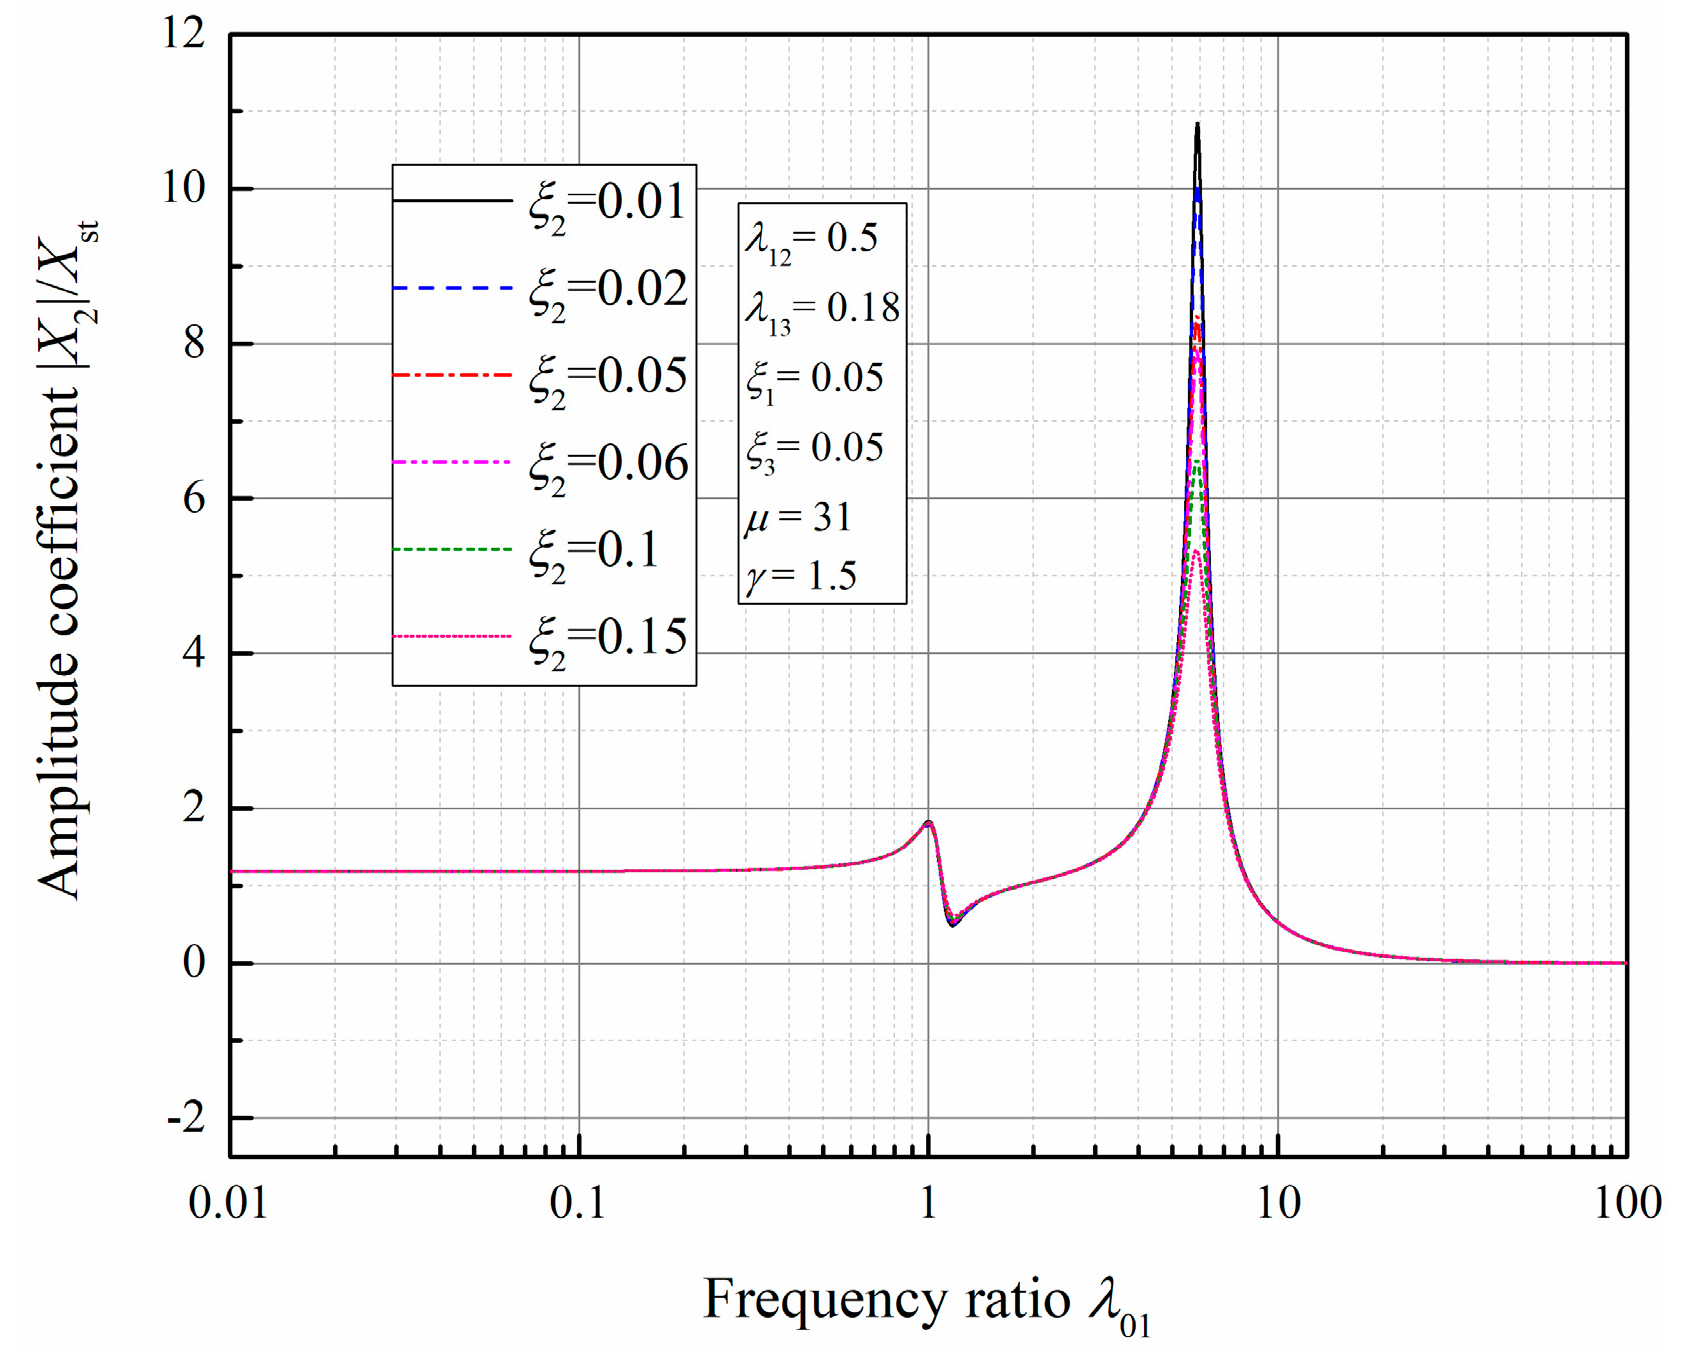
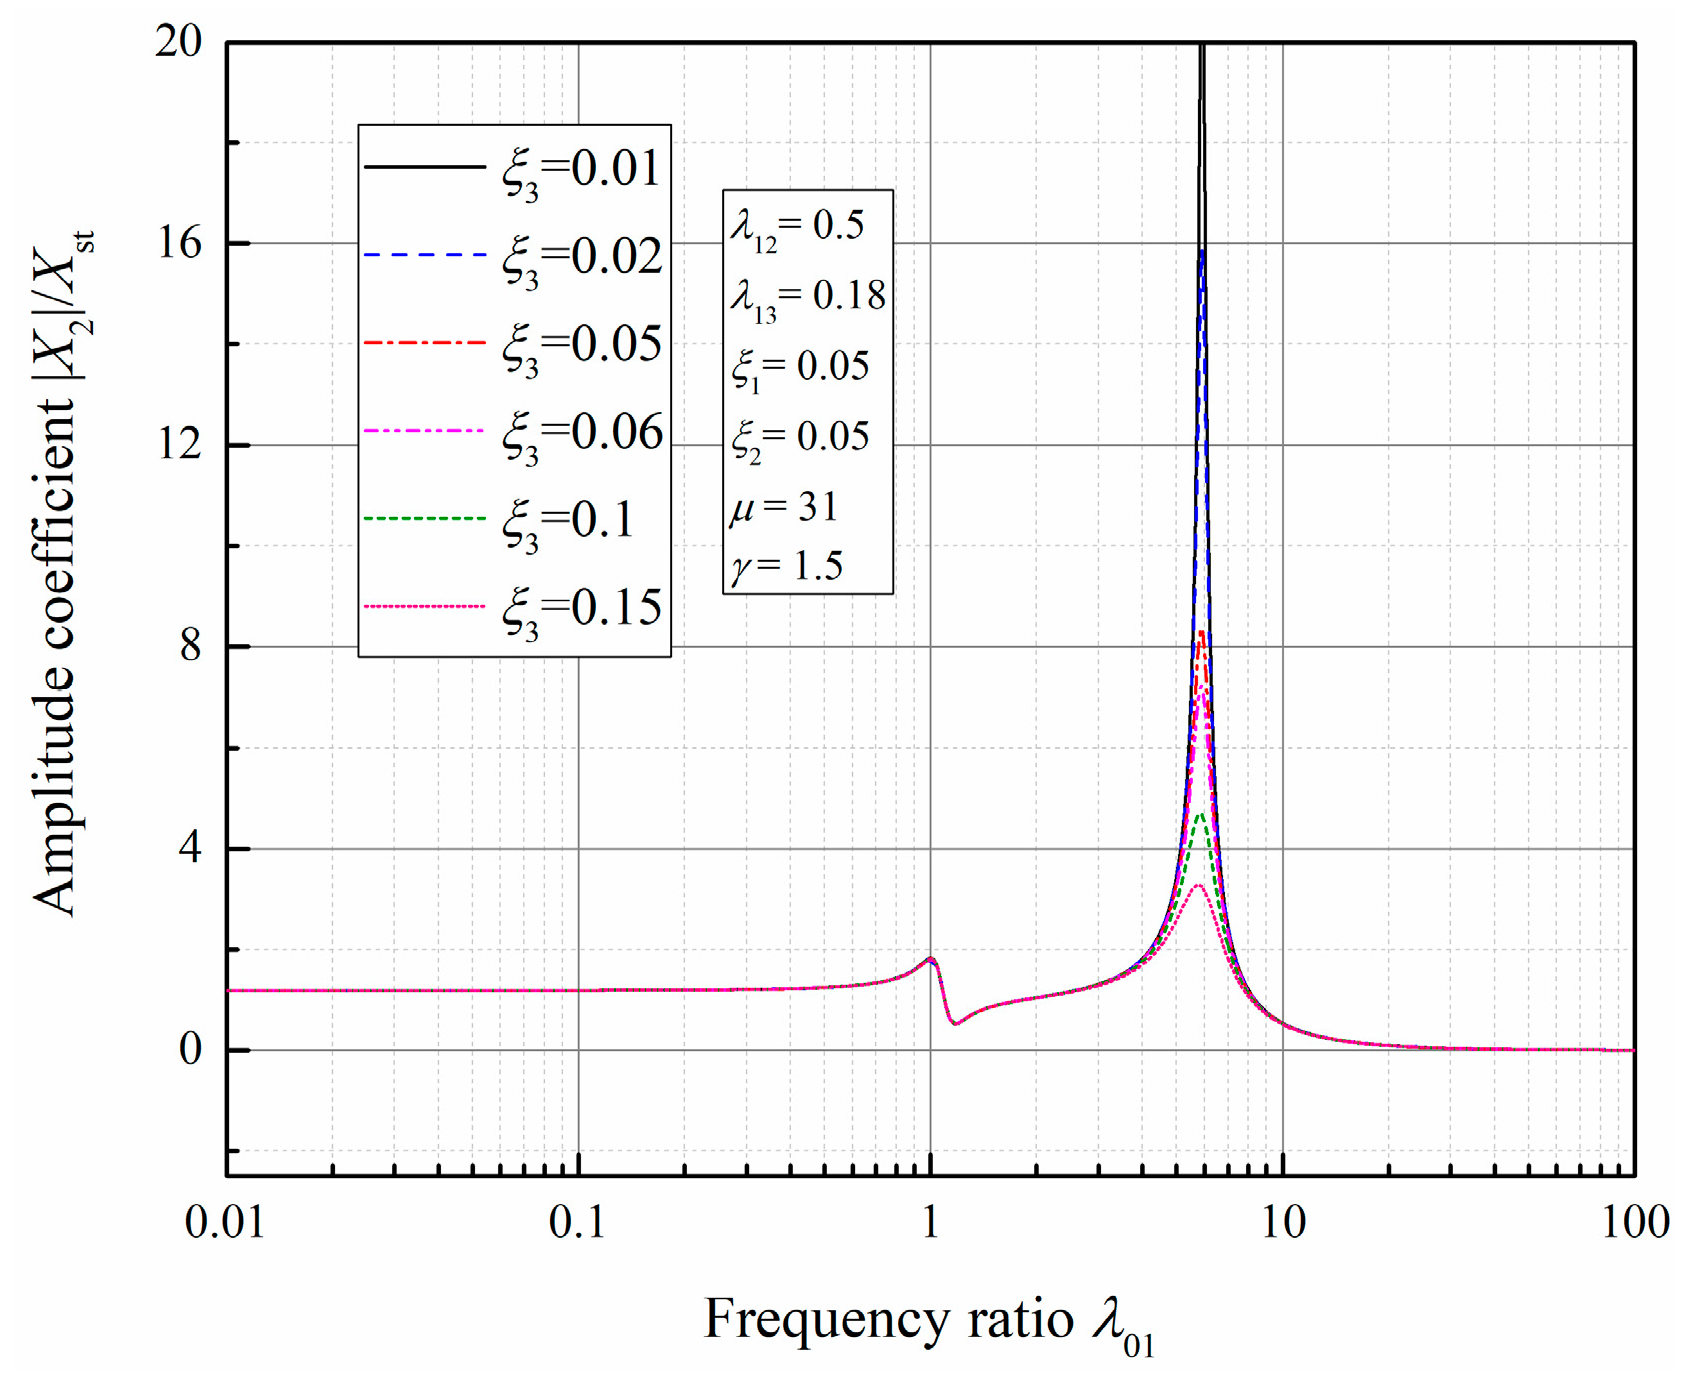
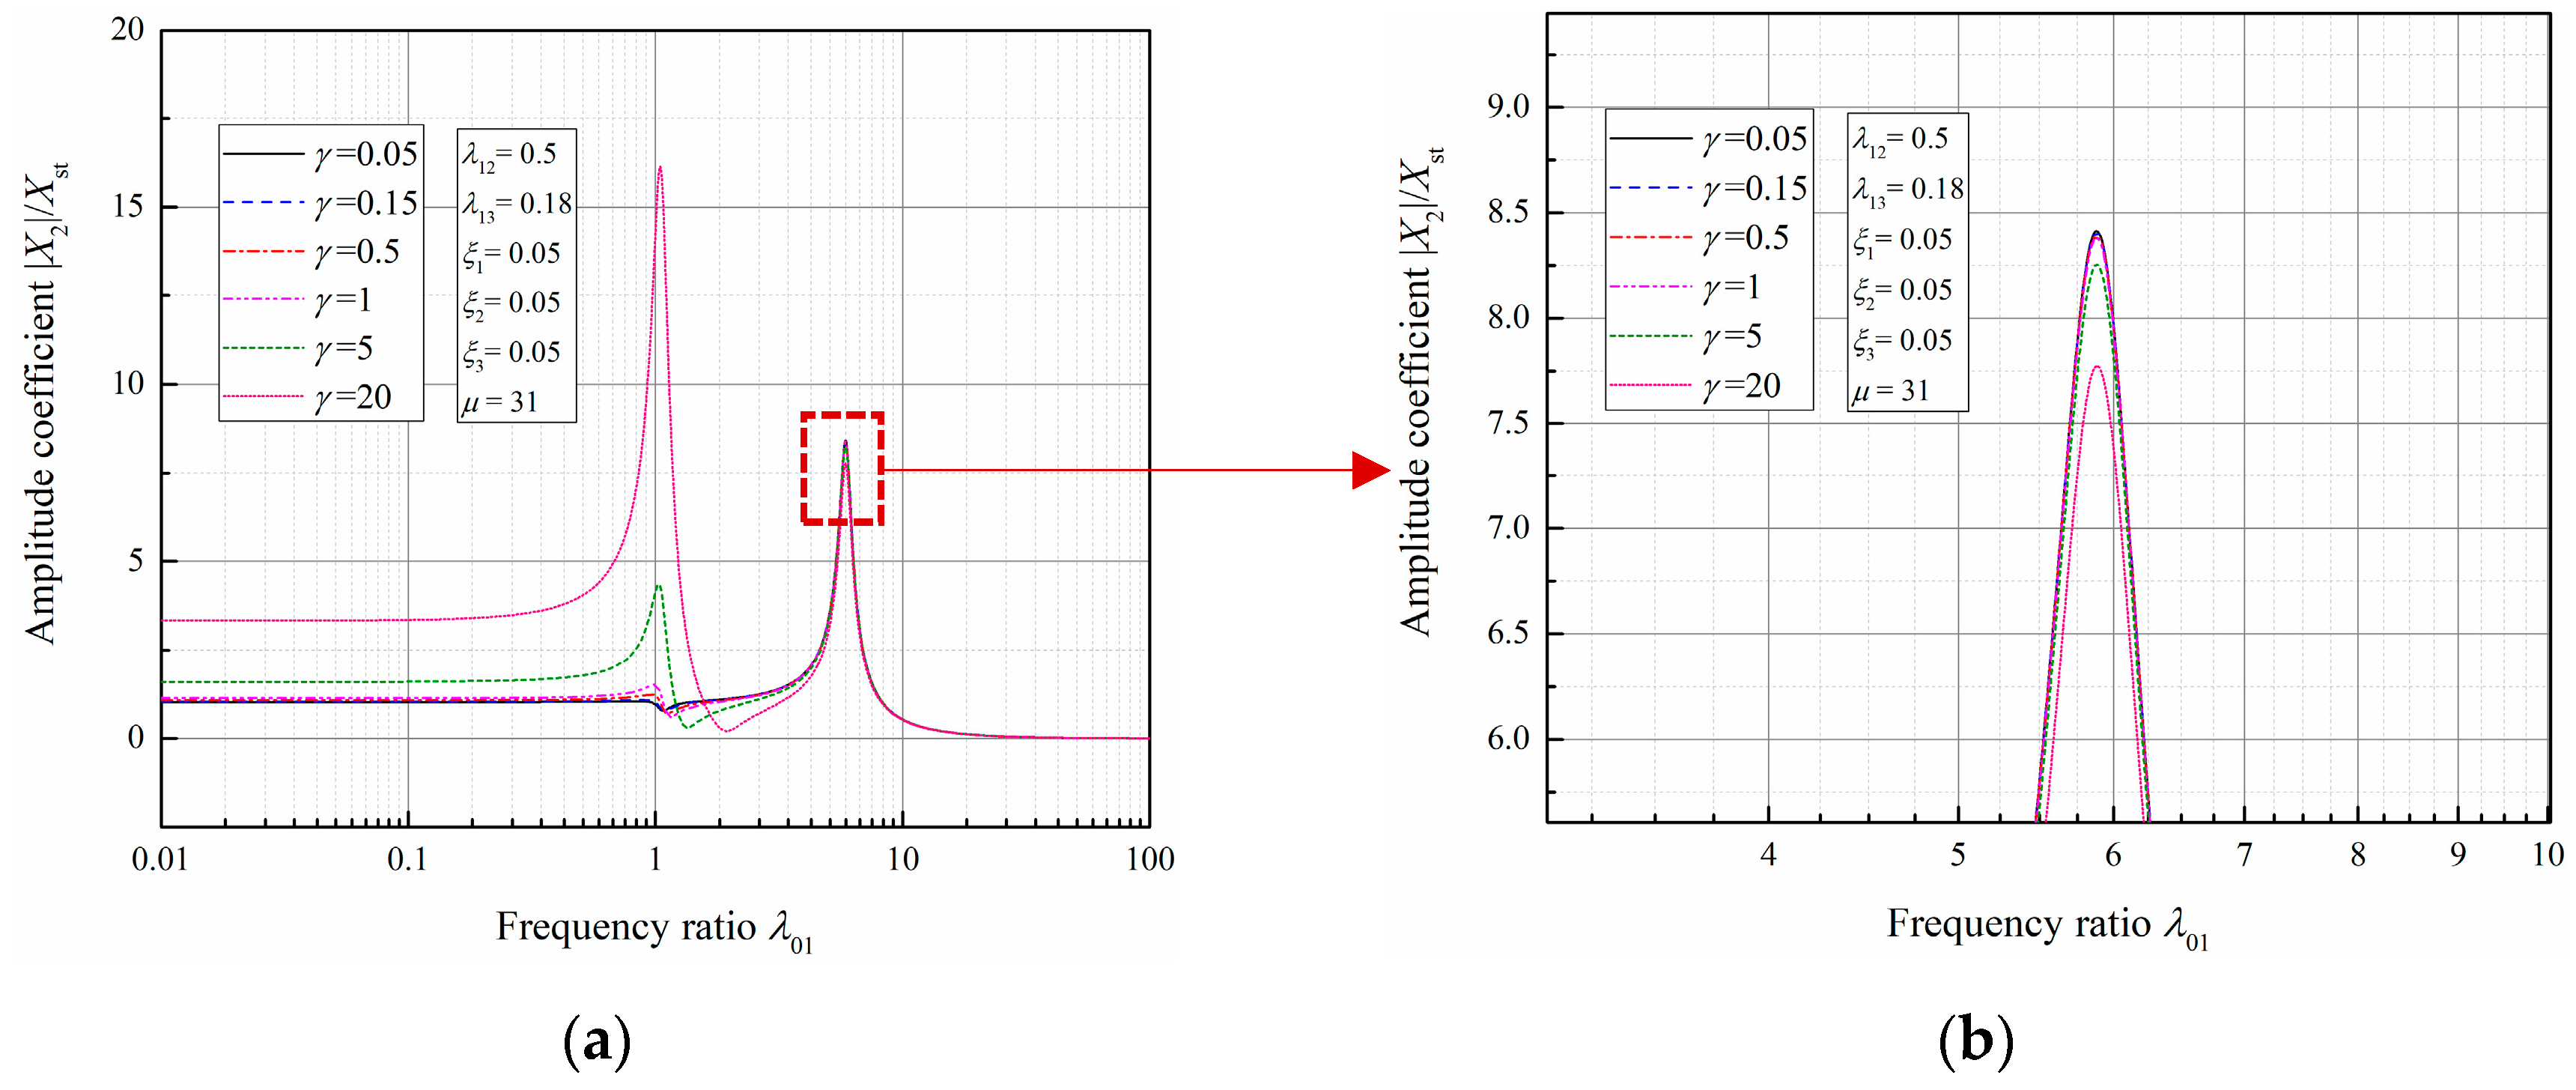
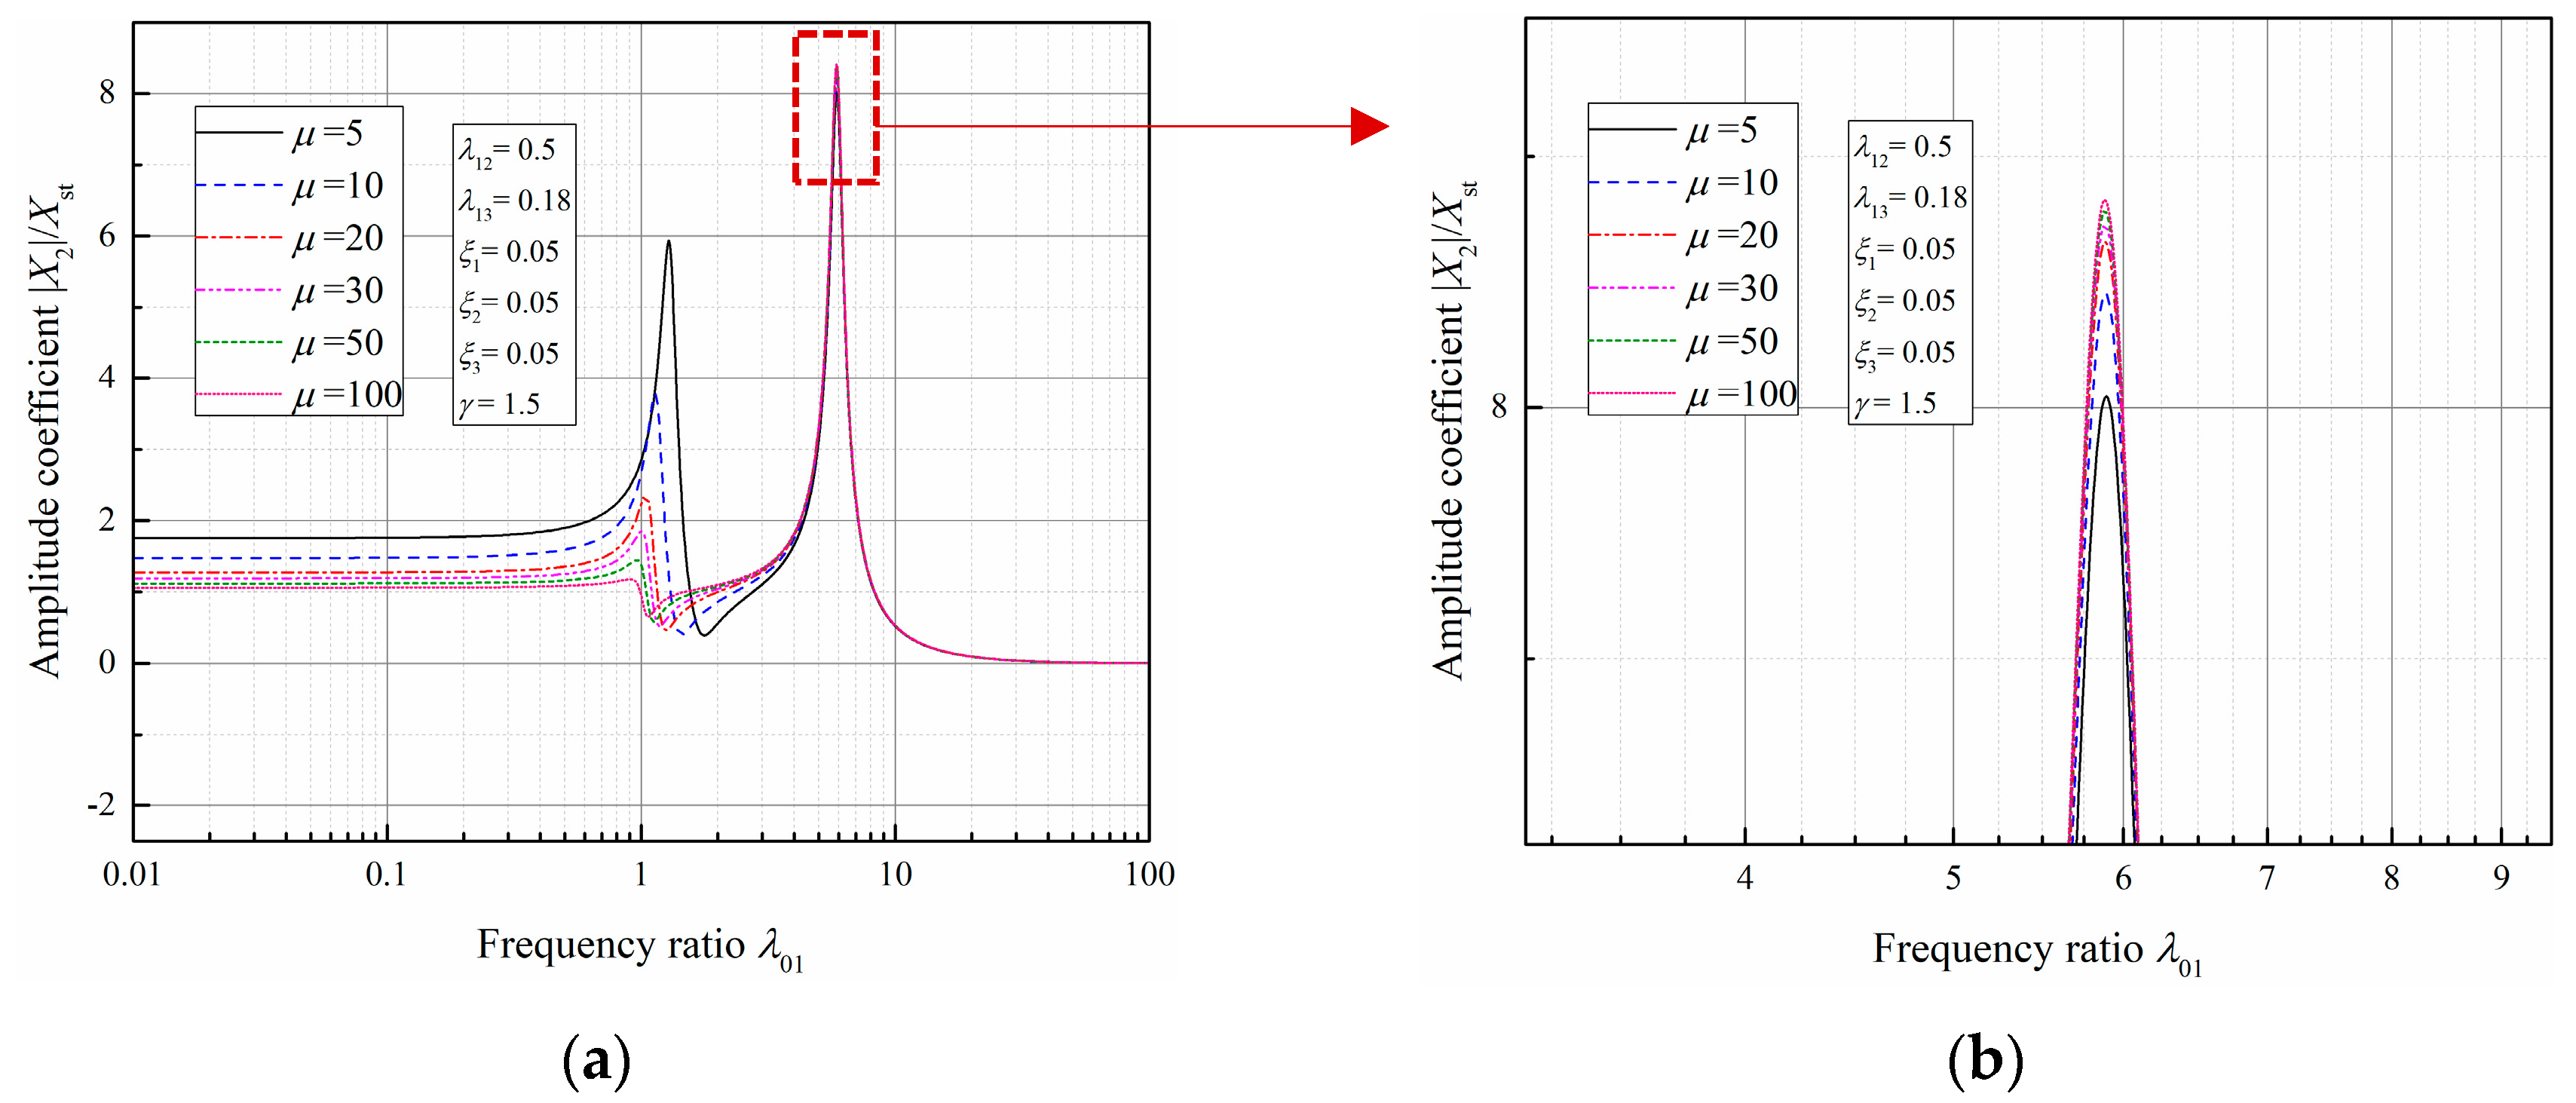
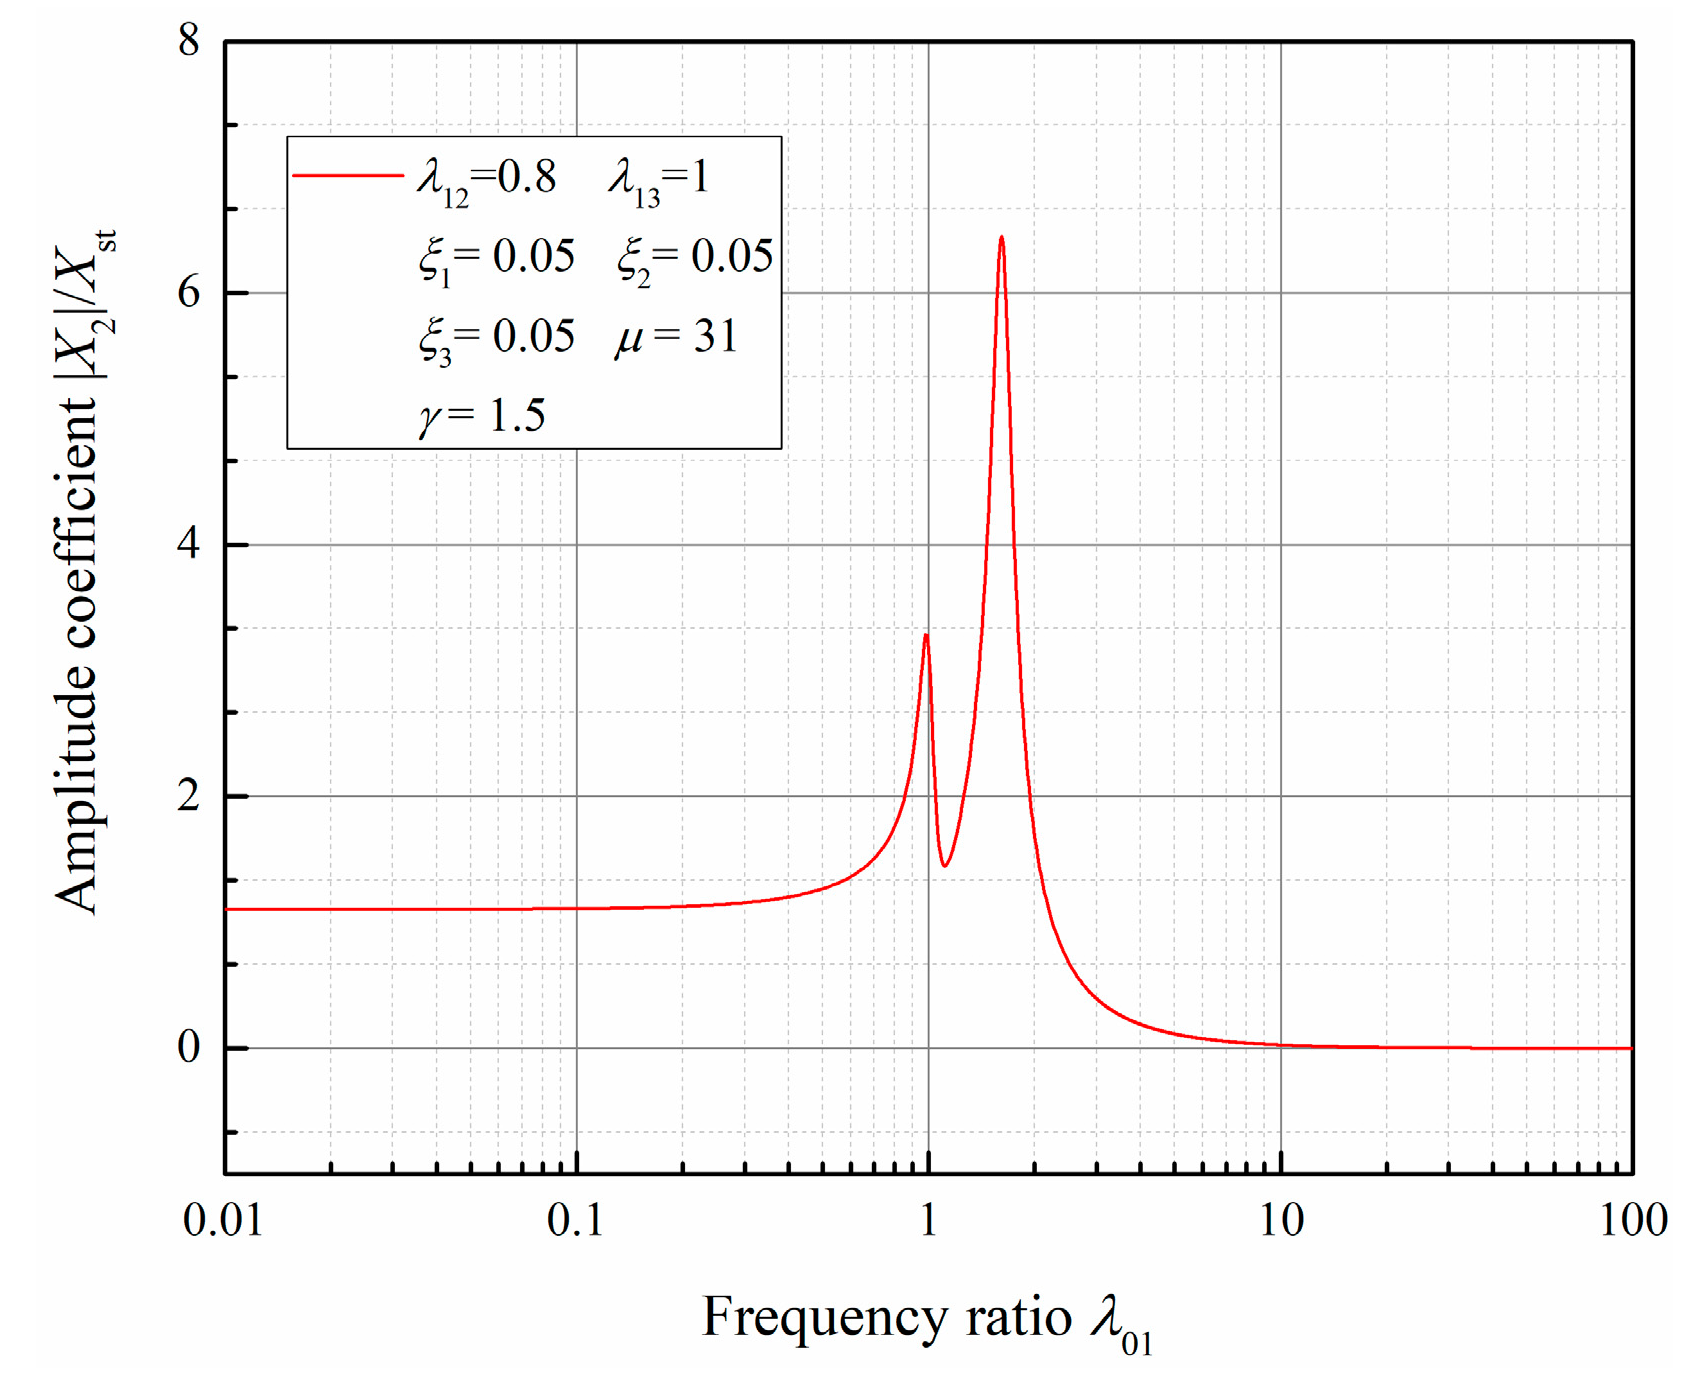
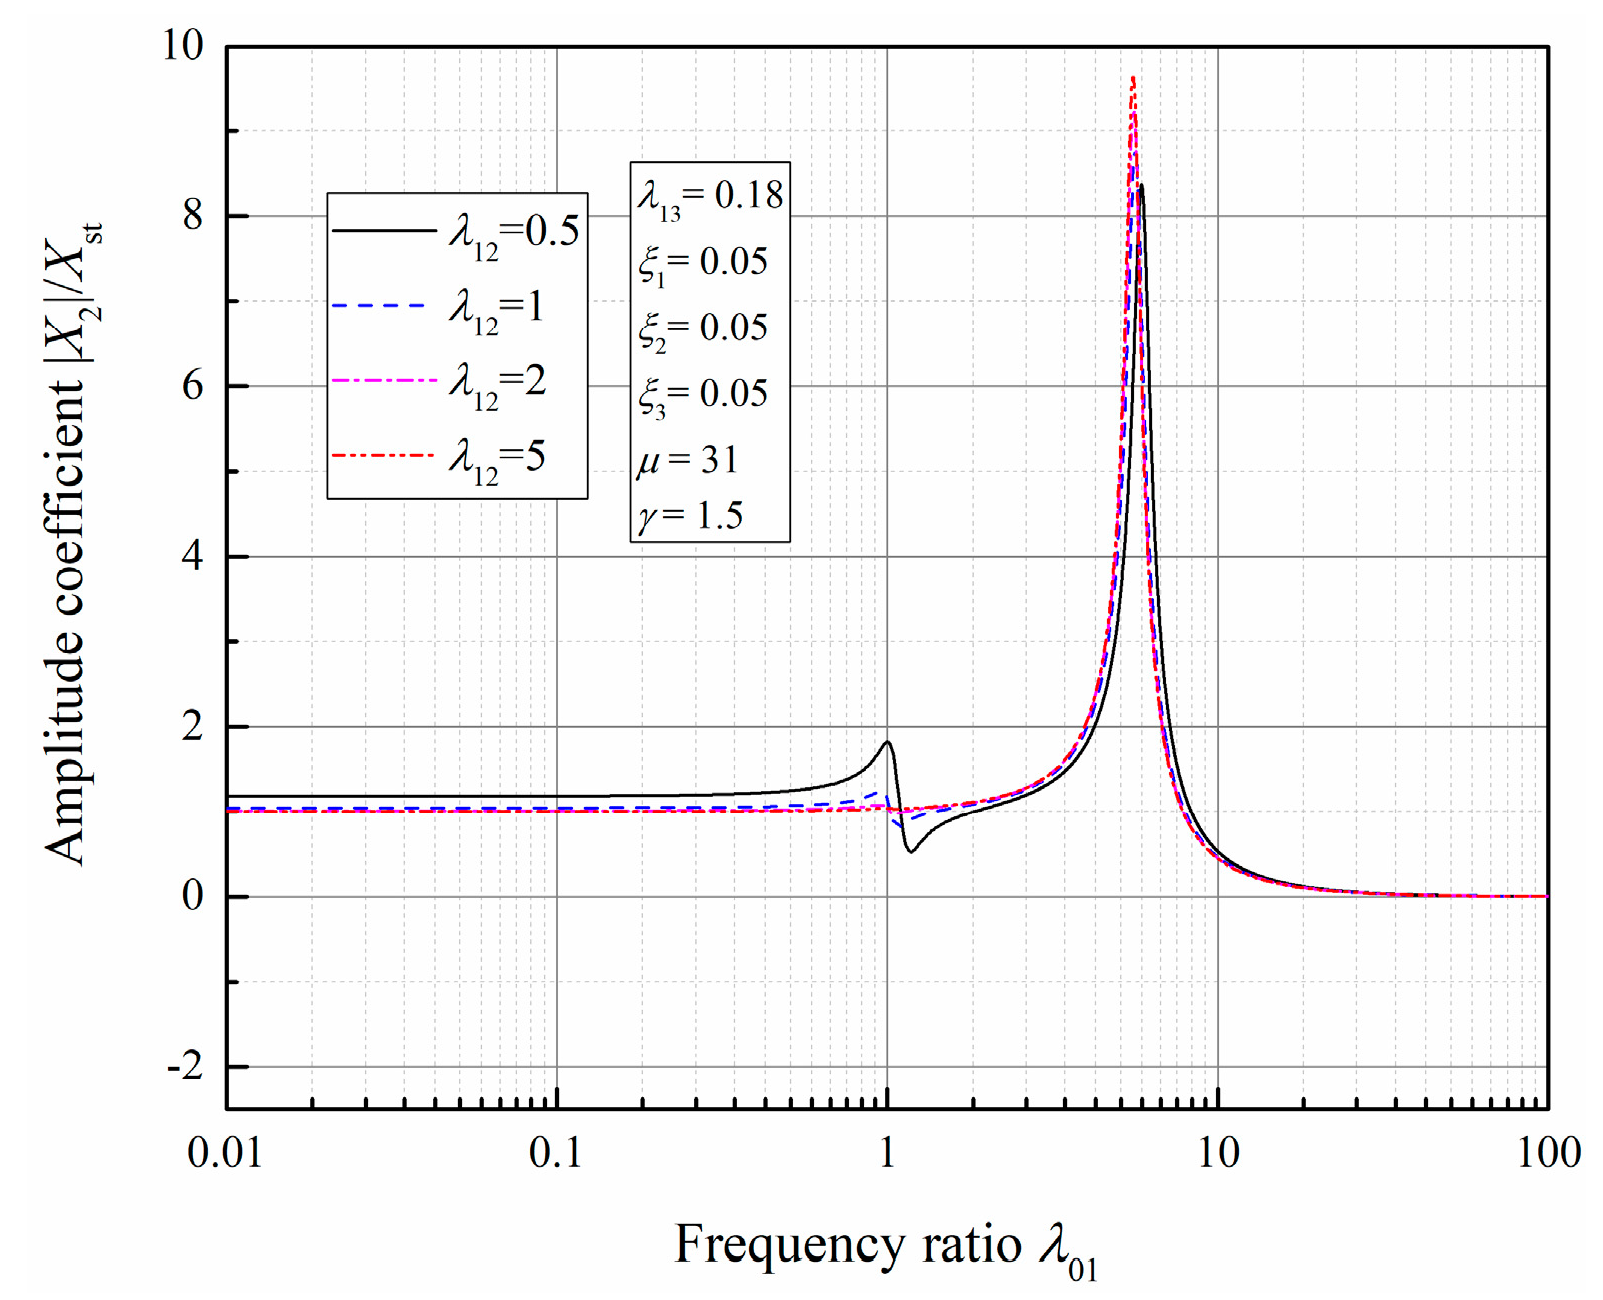
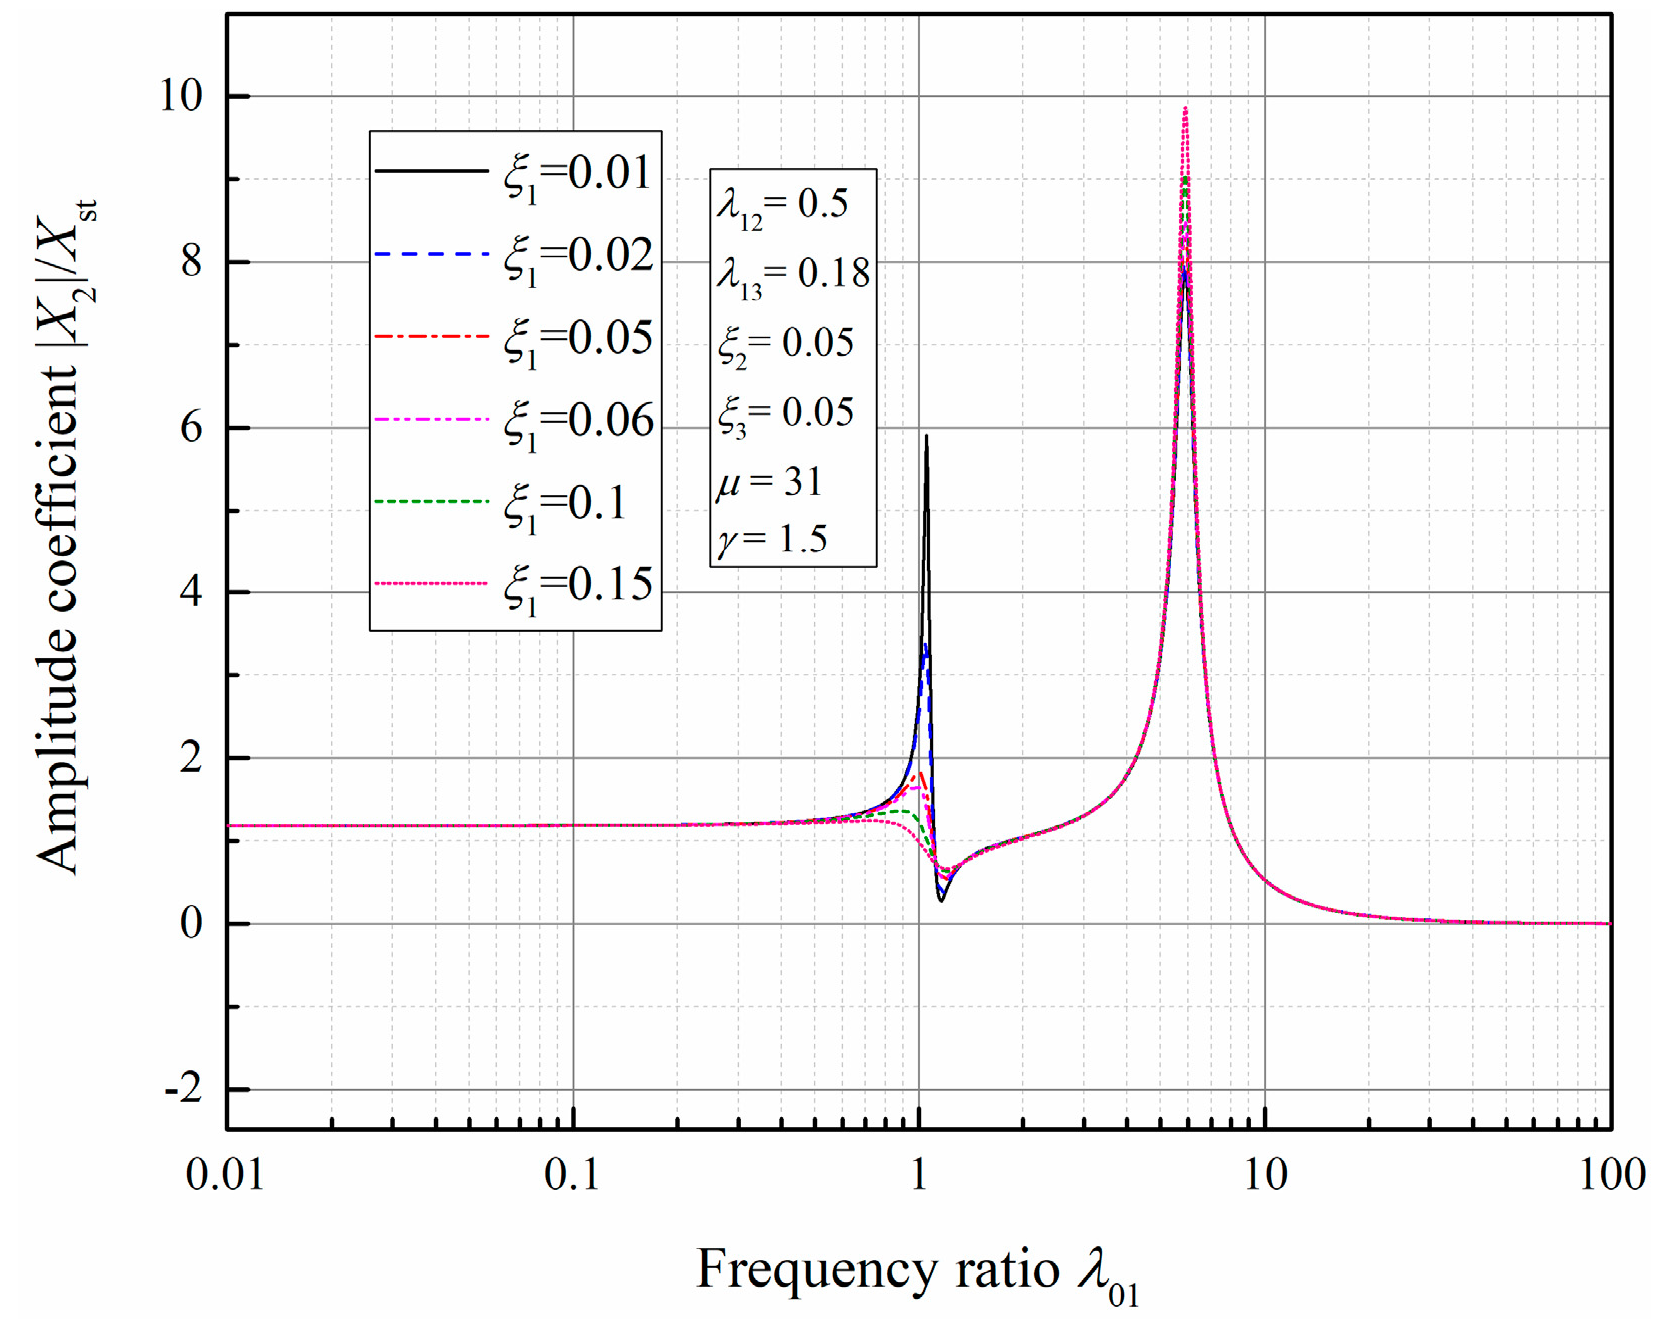
3.3. Parameter Sensitivity Analyses

To investigate the influence of every parameter on the amplitude coefficient given in Equation (25), sensitivity analyses for each parameter are performed, and reasonable values are set for all the parameters except the target one beforehand. Referring to the minimum value specified in the code for seismic design of hydraulic structures [37], the damping ratio of the structure made of concrete is considered to be 0.05, i.e., ξ 1 = ξ 2 = ξ 3 = 0.05 . The excitation amplitude ratio γ is considered to be 1.5, which is concluded from previous flow excitation studies [13,38,39]. According to the practical structures of TGHS [40] and the added mass of each part of structures, the coupled mass ratio μ is calculated to be 31. The parameter λ 13 is considered to be 0.18, which is deduced from the coupled mass ratio. It is noted that the values of these parameters are only referential values for qualitative studies of each parameter, and the values can be changed to apply this analysis to other practical projects. Based on these predefined values, the dynamic response (amplitude coefficient) with the variation of λ 12 is shown in Figure 9, Figure 10 and Figure 11.
As shown in Figure 9, the influence of the parameter λ 12 on the dynamic response is investigated for the case of λ 12 λ 13 = 0.2 . Two peaks appear when the external excitation frequency is roughly equal to the natural frequency of the primary structure and the accessory structure in the AV system (i.e., ω 0 = ω 1 and ω 0 = ω 2 ). With the increase of λ 12 , the peak value of ω 0 = ω 1 decreases, while the peak value of ω 0 = ω 2 shows no apparent change. The peak of ω 0 = ω 1 demonstrates that the vibration of the accessory structure synchronizes with the primary structure, i.e., AV is generated; and the peak value of ω 0 = ω 1 represents the intensity of AV. The significant decrease in the amplitude coefficient when ω 0 ω 1 can be explained as the reduction of vibrational synchronization between the vibrations of the primary structure and the accessory structure. It is noticeable that the excitation frequency of the first peak is slightly greater than ω 1 , which is considered to be induced by the constraint between the accessory structure and the foundation.
As shown in Figure 10, while 0.2 < λ 12 5 , there are still two peaks on the curve, but the peak corresponding to ω 0 = ω 1 tends to disappear with the increase of λ 12 . Different from Figure 9, the second peak no longer occurs when ω 0 = ω 2 , but is generated when ω 0 = ω 3 , and its value increases with an increasing λ 12 . This phenomenon can be illustrated as the recession of AV: as λ 12 increases, which means the frequency ω 2 gradually approaches and exceeds ω 1 , the vibration synchronization is weakened, causing a further decrease in the vibration induced by the primary structural vibration. Simultaneously, with a larger ω 2 and a smaller ω 3 , the FV of the accessory structure subjected to external excitation becomes more significant so that the peak value of ω 0 = ω 3 increases with the increase in λ 12 .
Another situation where λ 12 > 5 is shown in Figure 11. In this situation, the curve becomes single-peaked. The peak of ω 0 = ω 1 mentioned above has entirely disappeared, which indicates that the vibration of the accessory structure has totally separated from that of the primary structure and becomes an independent FV. Moreover, the peak value of ω 0 = ω 3 marginally rises with a larger λ 12 .
By the discrimination of the above three situations, the dynamic response with a various parameter has been adequately analyzed. Generally speaking, with the increase of λ 12 , AV decreases until it disappears. As λ 01 increases, the first peak roughly matches ω 0 = ω 1 and the peak value significantly decreases with a rising λ 12 , and disappears when λ 12 > 5 . Moreover, the second peak initially corresponds to ω 0 = ω 2 , but when the value of λ 12 approaches that of λ 13 , the abscissa of this peak remains almost unchanged with the variation of λ 12 and gradually approaches ω 0 = ω 3 .
As illustrated in Figure 12, the influence of the parameter λ 13 on the dynamic response is investigated. Figure 12a shows the dynamic response of the accessory structure in the case of λ 12 = 0.5 . It is noteworthy that the peak value is remarkably increased with an increasing λ 13 in the case of ω 0 = ω 1 , denoting the dominance of AV; the other peak originally corresponds to ω 0 = ω 3 while λ 13 < λ 12 = 0.5 , but becomes asymptotic to ω 0 = ω 2 as λ 13 gets larger. Moreover, Figure 12b,c are detailed to obtain more specific analyses for the influence of λ 13 on the dynamic response with different λ 12 . It is evident that similar conclusions can be drawn from Figure 12a,b. For the one-peak situation (Figure 12c), the peak of ω 0 = ω 3 abides by the same law as that in Figure 12a, before eventually becoming asymptotic to ω 0 = ω 2 when λ 13 > λ 12 . The phenomenon above can be interpreted as the growth of AV with the increase of λ 13 . When λ 13 is increased, which means that the natural frequency of the accessory structure in the independent FV system (as an independent structure) has been decreased. It can be inferred that the influence of AV will become salient.
Combined with the analyses of λ 12 , it can be concluded that λ 12 is a parameter determining the number of peaks, and λ 13 is a parameter determining peak values. Both λ 12 and λ 13 determine the vibration type. AV is dominant when λ 12 < λ 13 ; as λ 12 / λ 13 gets larger, the vibration gradually becomes the independent FV. The dividing point is λ 12 = λ 13 from the curves. Based on the above analyses, the parameter λ 12 is considered to be 0.5 in subsequent analyses to take the effects of both AV and independent FV into consideration, which can be seen from Figure 10.
As illustrated in Figure 13, the influence of the damping ratio ξ 1 on the dynamic response is investigated. It can be discovered that the increase of ξ 1 suppresses the value of the first peak, but has the opposite effect on the value of the second peak. According to Figure 14, the value of the second peak decreases with the increase of the damping ratio ξ 2 , but the value of the first peak has not been influenced. Figure 15 illustrates the influence of the damping ratio ξ 3 on the dynamic response, which is similar to that of ξ 2 , but the decrease influence of ξ 3 on the second peak is greater. In conclusion, the three damping ratios change the peak values, but they do not change the dominant vibration type.
As illustrated in Figure 16, as the parameter γ increases, the first peak value is significantly increased, while the second peak value is slightly reduced. The changes reflect the transformation of the vibration type. According to Figure 17, the increase of the parameter μ can result in a decrease in the value of first peak. Moreover, it causes a marginal increase in the second peak value but has no effect on the vibration type.

4. Verifications

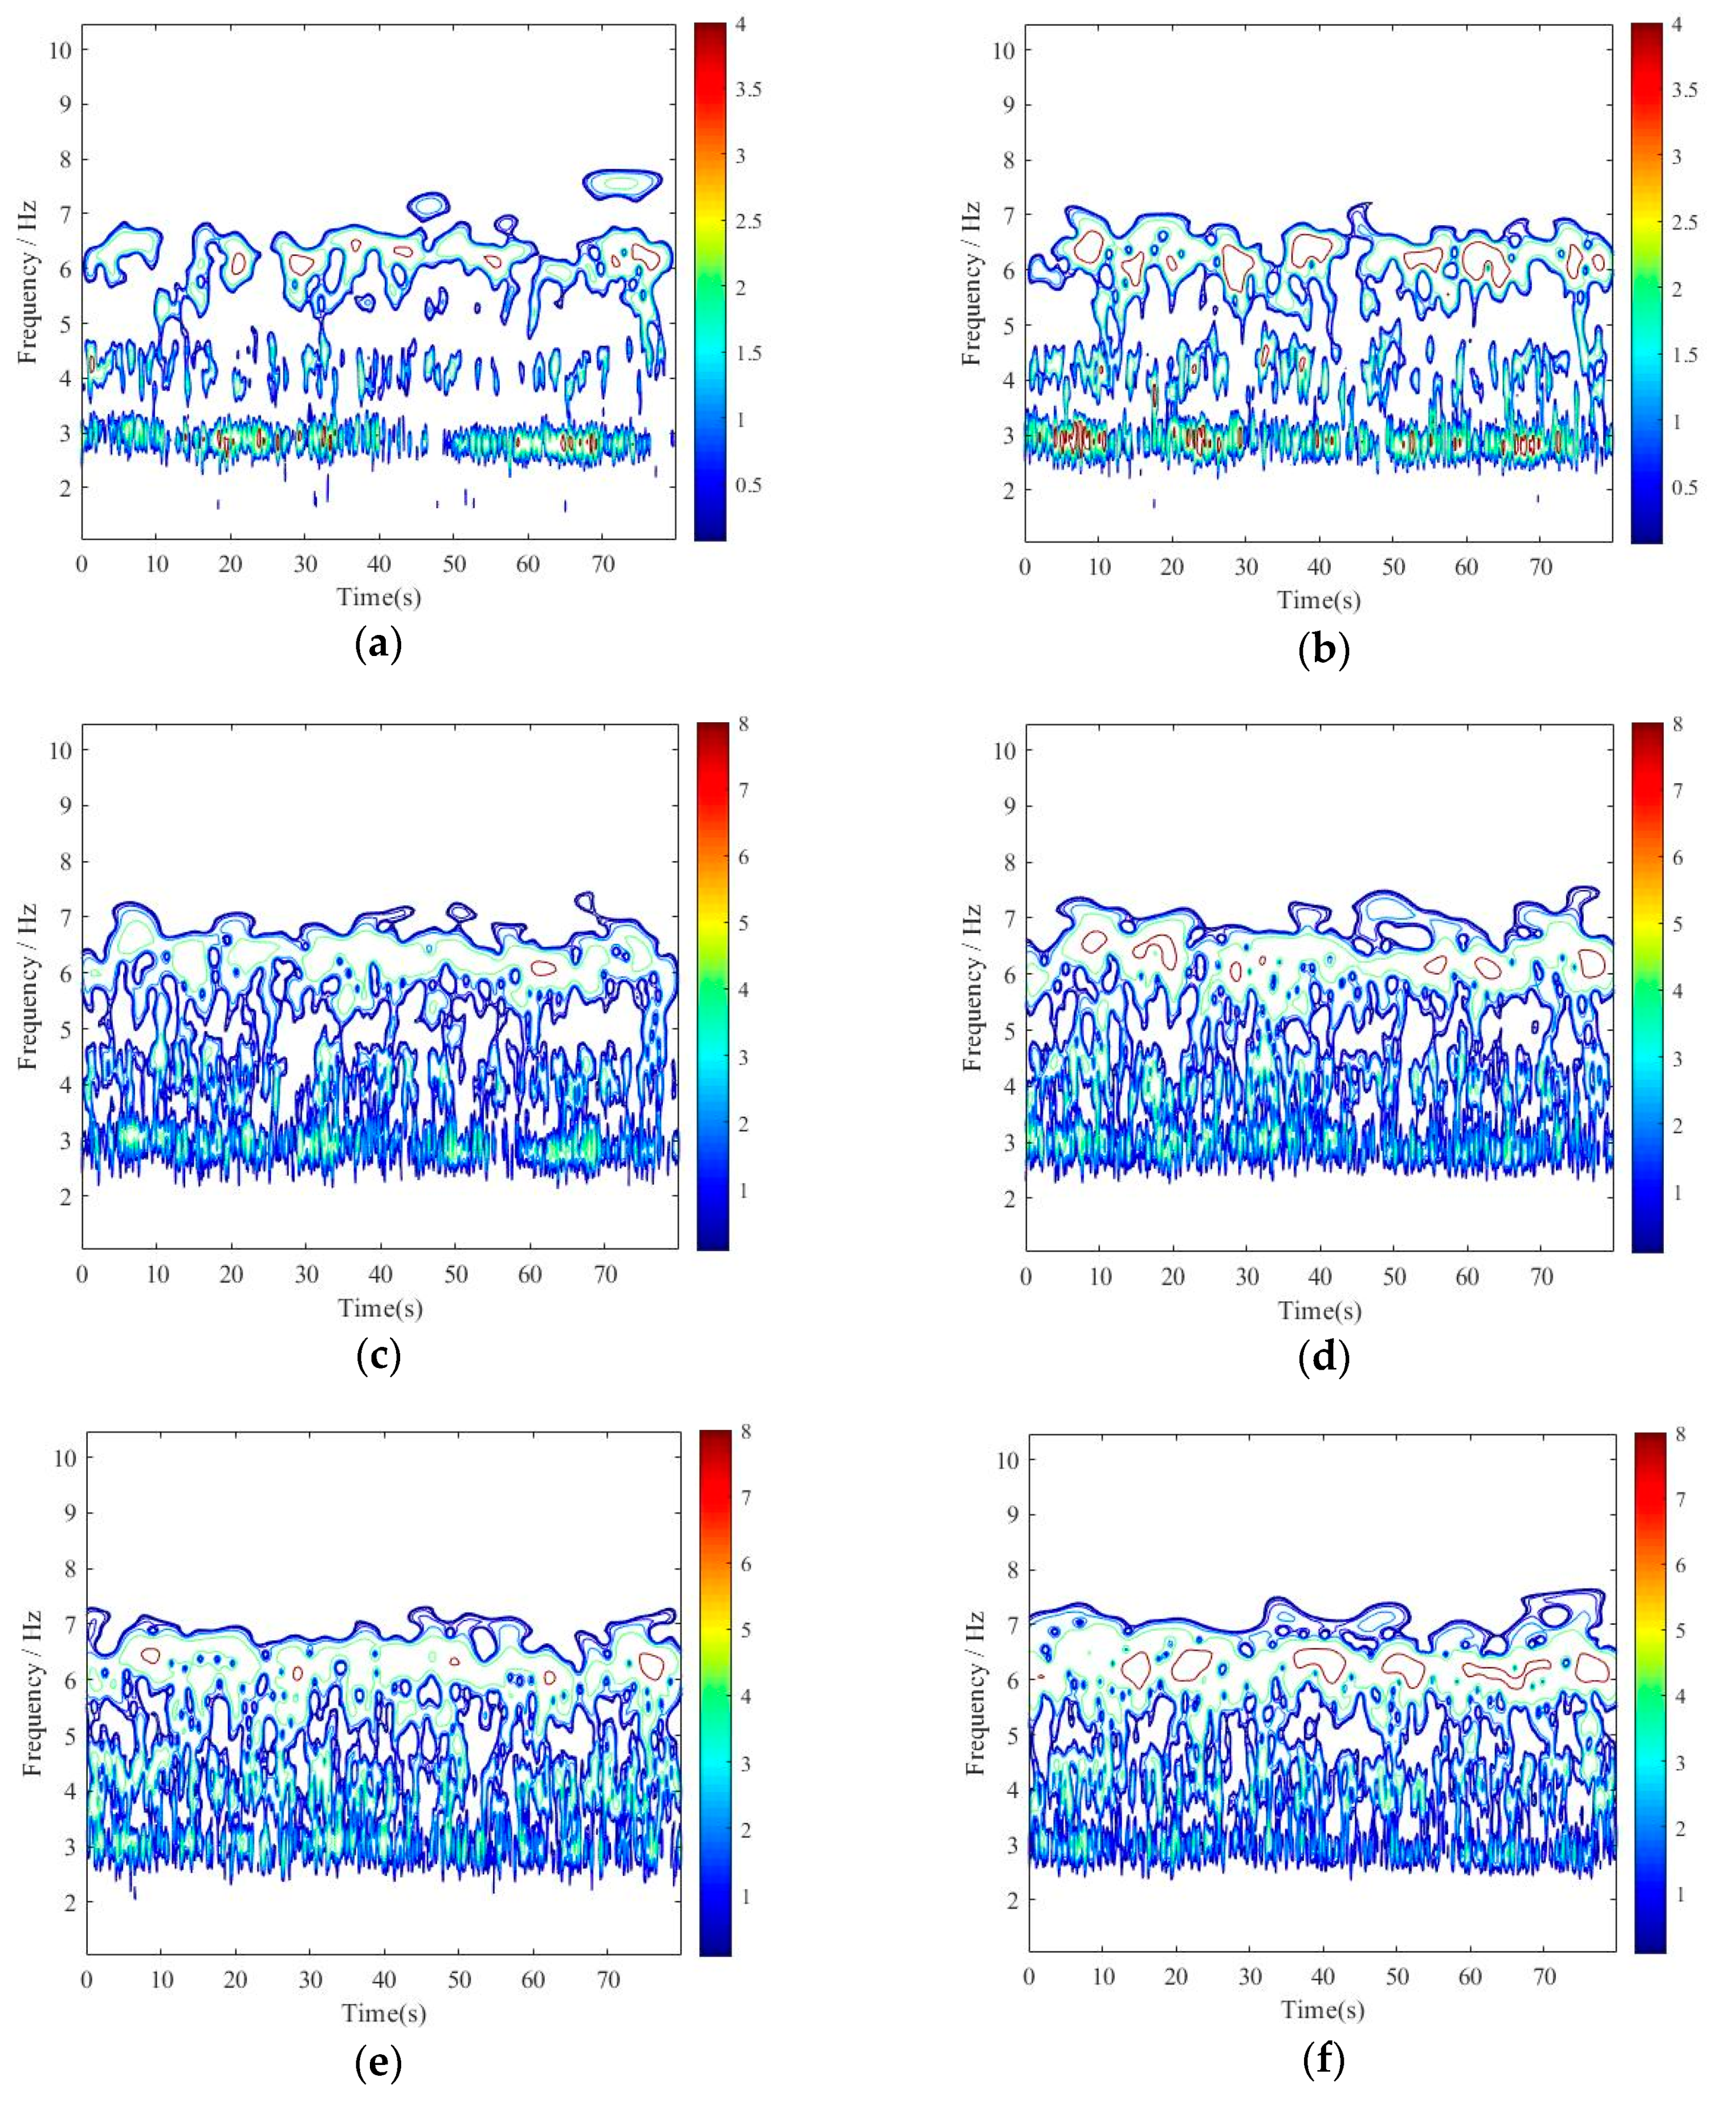
4.1. Vibration Correlation Analyses by XWT Method

As recommended in the introduction, cross-wavelet transform (XWT) is an efficient method to analyze the correlation between two signals. Suppose the wavelet coefficients W y ( a , τ ) of a finite time signal y ( t )
W y ( a , τ ) = 1 a + y ( t ) ψ ( t ) d t
with
ψ ( t ) = 1 a ψ ( t τ a )   ( a > 0 , τ )
where a represents the scaling parameter; t represents time; τ represents the location of t; ψ ( t ) denotes the mother wavelet; and ψ ( t ) extends the mother wavelet to a wavelet family. In practice, the mother wavelet ψ ( t ) is always considered as a Morlet wavelet:
ψ ( t ) = π 1 / 4 e i ω t e t 2 / 2
where ω is the nondimensional frequency, which is considered to be six to satisfy the admissibility condition [41].
For two signals, y ( t ) and z ( t ) , the XWT is defined as follows:
X W y , z ( a , τ ) = W y ( a , τ ) W z * ( a , τ )
the asterisk * denotes the complex conjugate. In engineering practice, the XWT is always transferred to the form of the cross-wavelet scalogram (XWS) to analyze the non-stationary signal:
X W S y , z ( a , τ ) = X W y , z ( a , τ ) X W y , z * ( a , τ ) = | X W y , z ( a , τ ) | 2
By defining X W y , z ( a , τ ) and X W S y , z ( a , τ ) , the correlation between two signals in both time and frequency domains is revealed, and the value of X W S y , z ( a , τ ) represents the correlation level.
Applying the XWT technique for signals obtained from 1# dam block and eight guide wall blocks, the correlation level in the form of XWS is illustrated in Figure 18. The figures show that the vibration of the dam block and guide wall blocks demonstrate clear synchronized correlation for the frequency band of about 2.5–7 Hz. It can be interpreted that under these synchronized vibration frequencies, AV tends to occur. For the 1# and 2# guide wall block, the correlations of both time and frequency domains are weaker, and the dominant synchronized frequency is located around 2.8 Hz, which may represent the natural frequency of the large-sized dam. It can be deduced that the vibration of these guide wall blocks may derive from the dam block, i.e., AV is dominant in these guide wall blocks. Meanwhile, in downstream guide wall blocks (3#–8# blocks), the correlative frequency bands are broader, and the dominant synchronized frequency is gradually increased to about 6.2 Hz, which represents the natural frequency of the small-sized guide wall. The natural frequency of the dam becomes less evident, from which it can be inferred that the influence of AV is attenuated in downstream guide wall blocks. The guide wall vibration transforms into independent FV, and the broad correlative frequency bands are derived from the broad frequency band of flow fluctuation that acts on both the dam and the guide wall.
Combined with the theoretical model of the AFCV system in Section 3, the above phenomena can be elucidated. Generally speaking, the damping ratio of a built-up structure is fixed, which can infer that parameters ξ 1 and ξ 3 are constant; each guide wall block can be considered as being the same structures, therefore, the parameters λ 13 and μ are fixed in this case. For blocks which are located more downstream, the connecting effect to the dam is weakened, and the natural frequency of the accessory structure in the AV system has the same tendency, leading to an increase in λ 12 ; the longer propagation path facilitates the attenuation of vibration, which means an increase in ξ 2 ; the downstream blocks are located at the dissipation zone, and contact with more complex flow conditions and more severe pulsation, causing γ to decrease. Summarized from Figure 9, Figure 10, Figure 11, Figure 14, and Figure 16, it can be discovered that the above changes of λ 12 and γ sharply decline the amplitude coefficient for ω 0 = ω 1 , which is equivalent to the attenuation of the AV intensity; the change in ξ 2 increases the amplitude coefficient for ω 0 = ω 2 , which means that the independent FV is enhanced. As a result, the XWS patterns are more concentrated on lower frequencies, as shown in Figure 18a–c; the value of XWS in downstream blocks is remarkably higher than that in upstream blocks, as shown in Figure 18d–h. Hence, the actual vibrational circumstances validate the correctness of the theoretical model in Section 3.

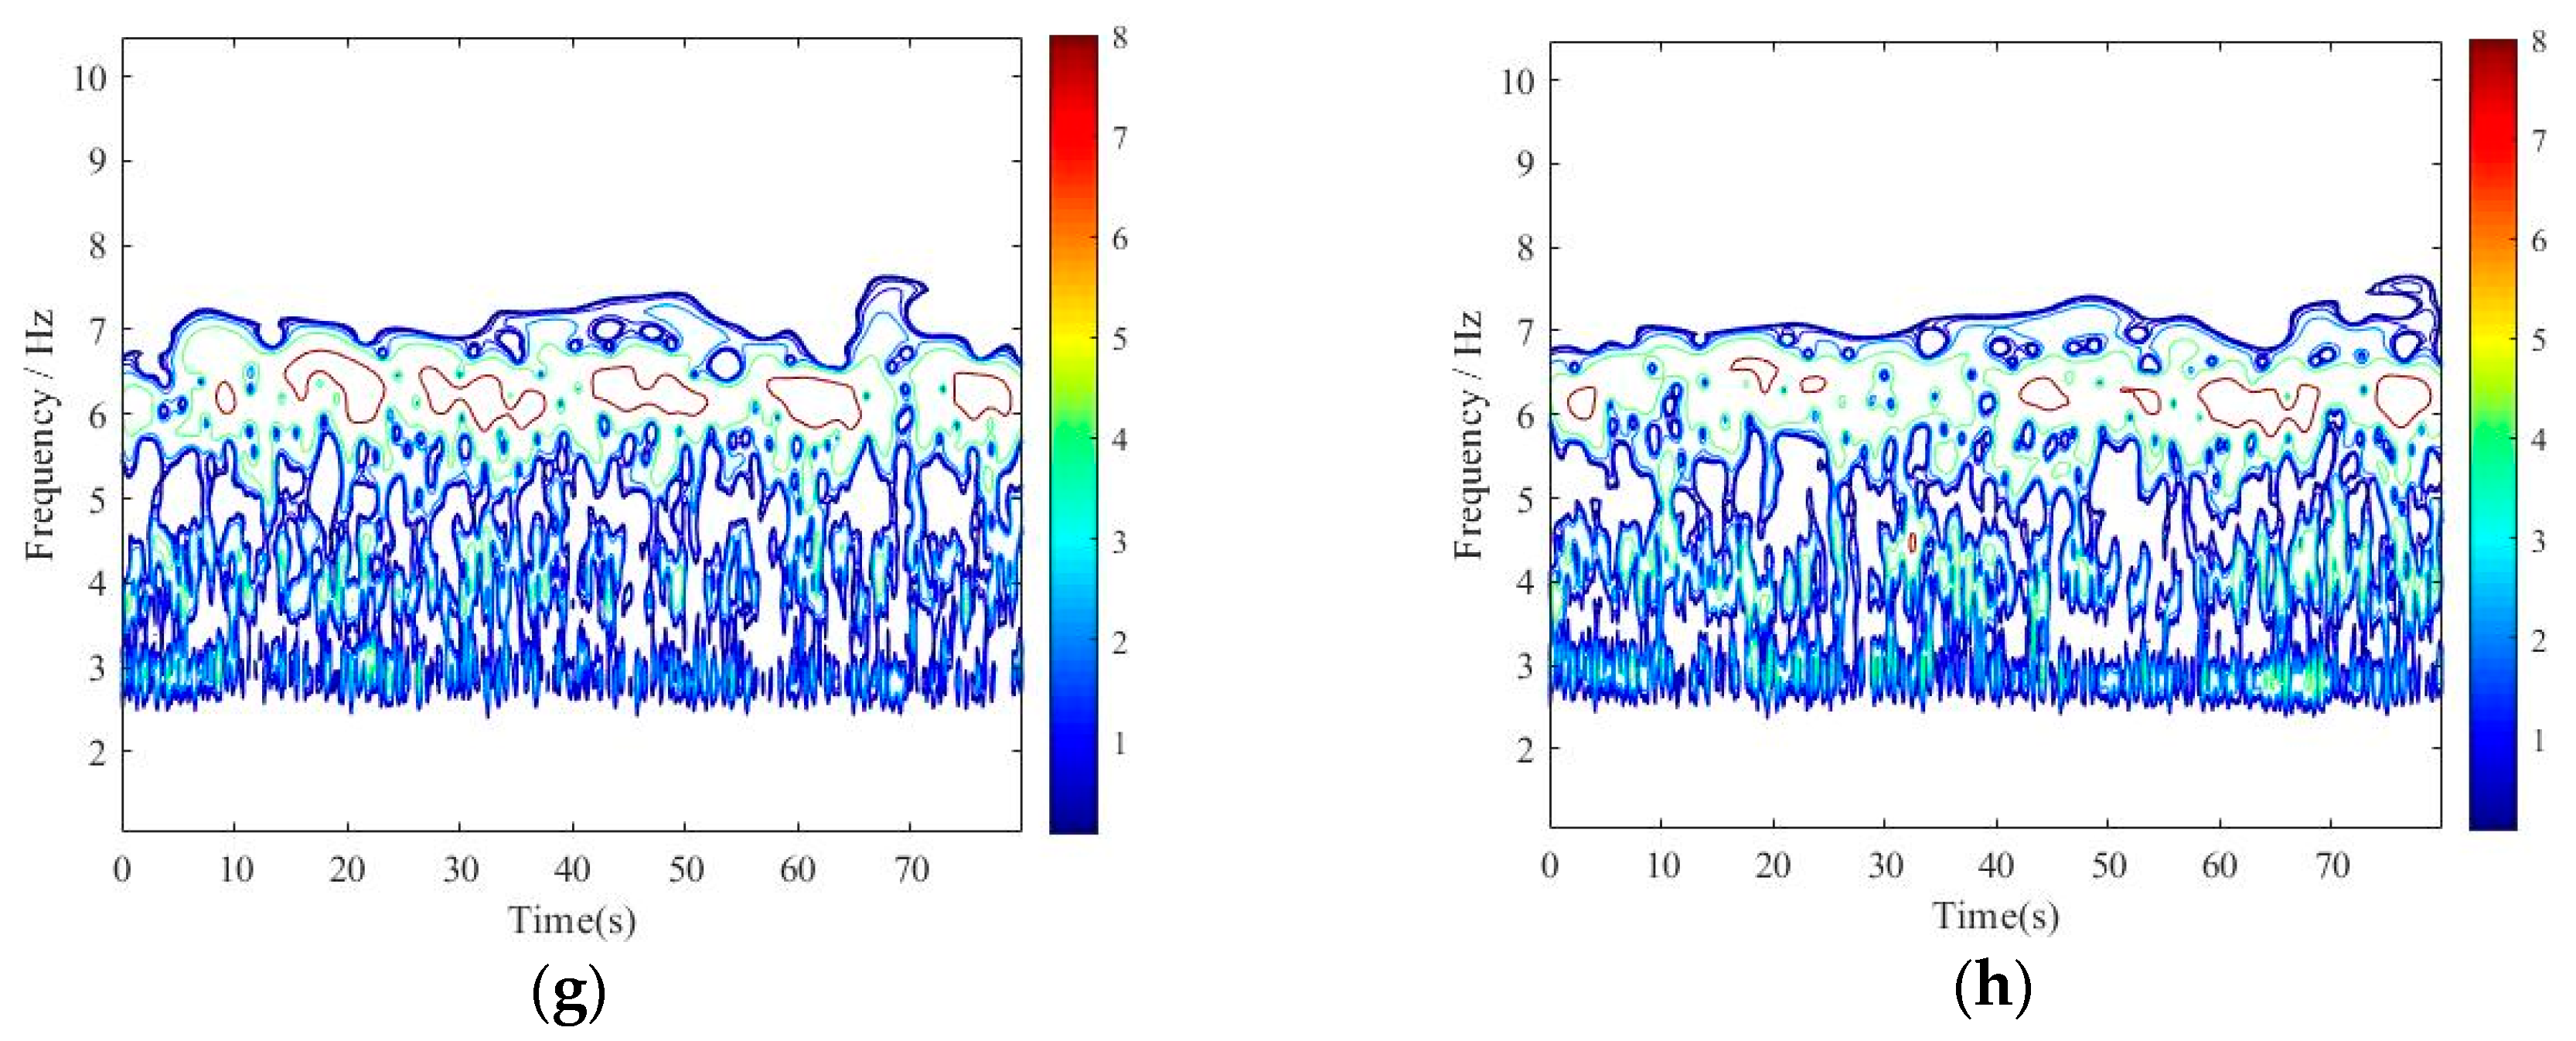
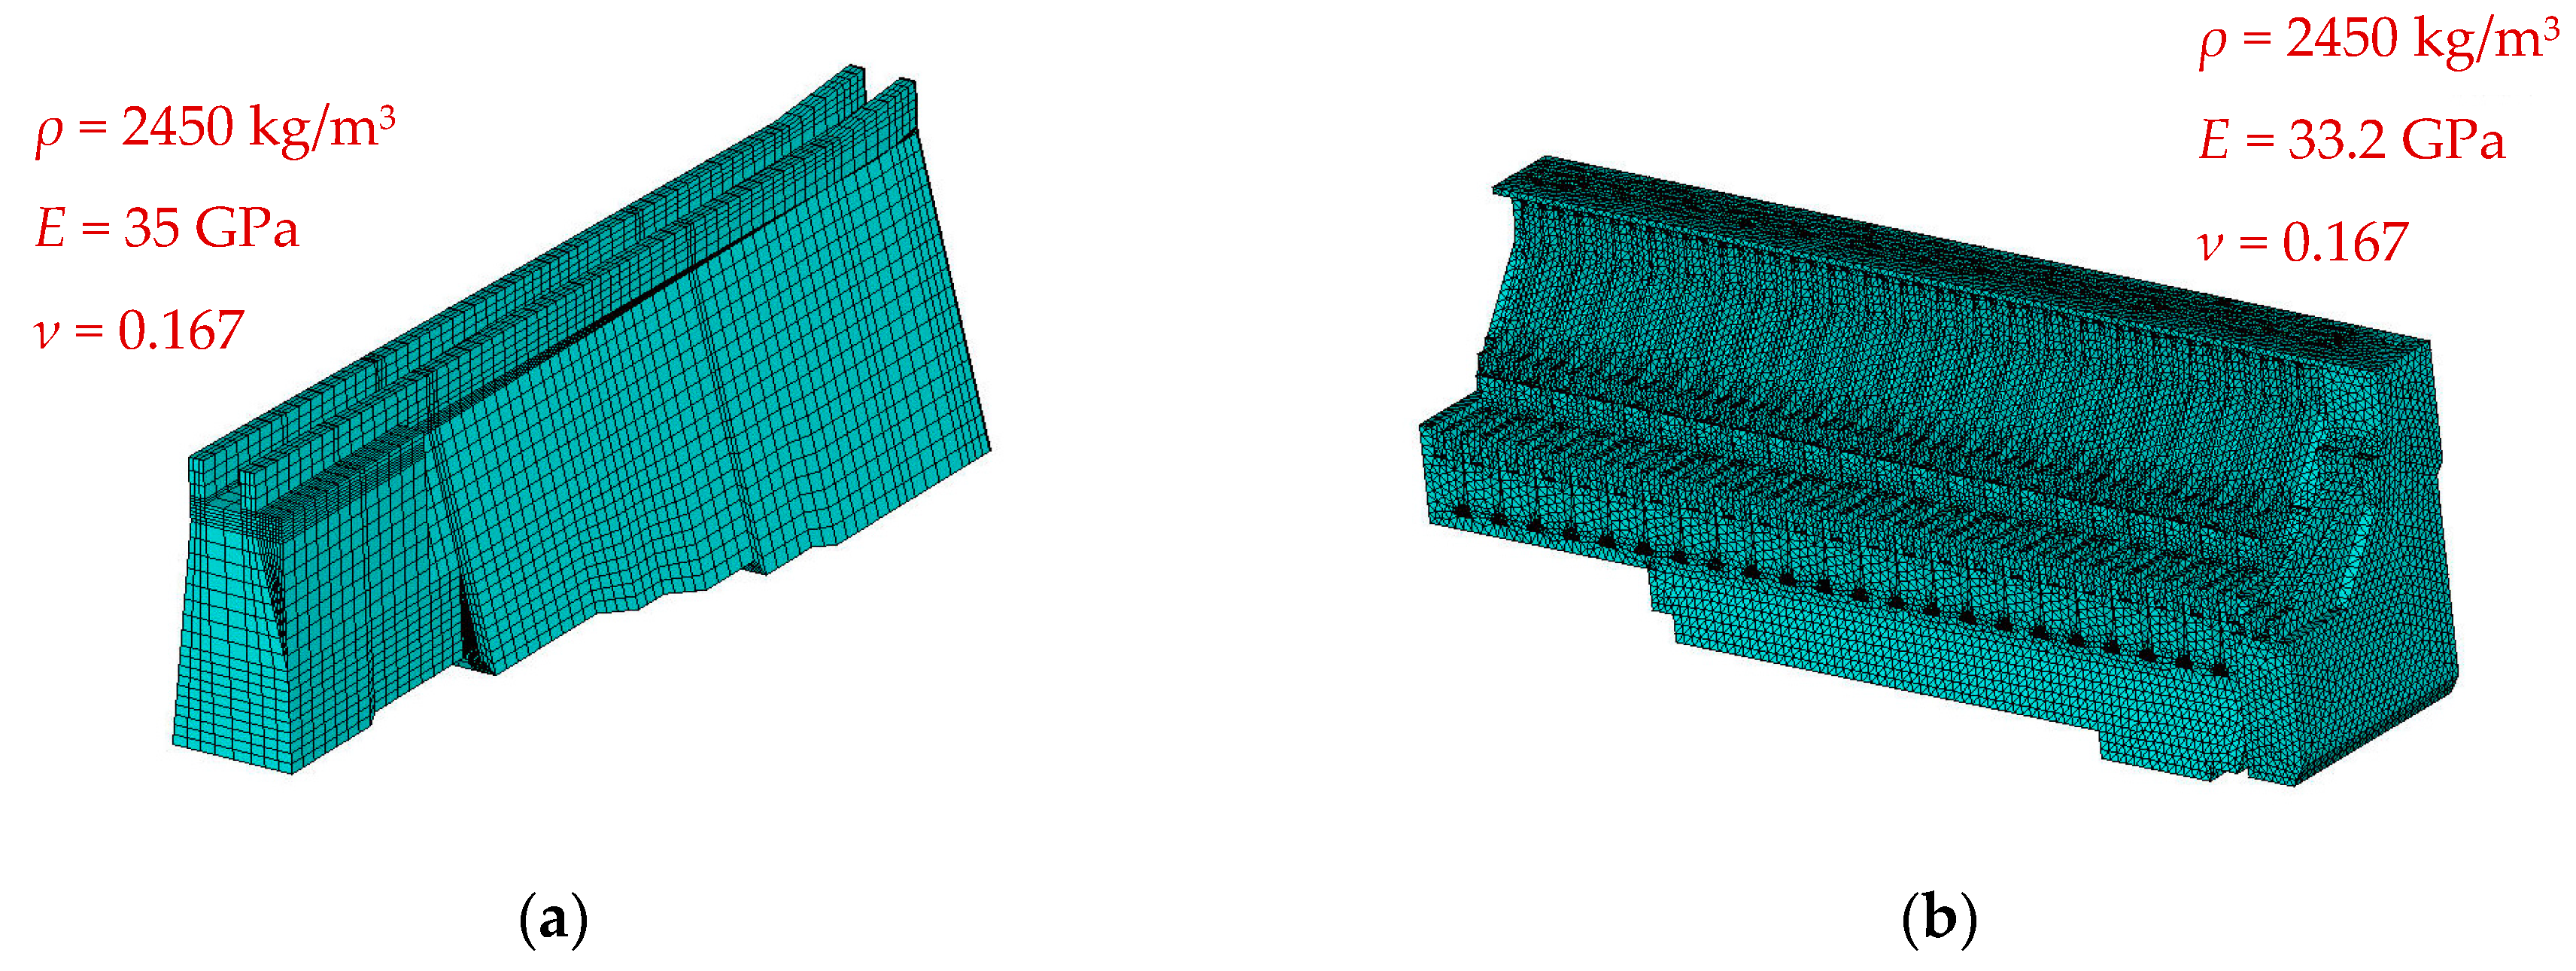
4.2. Numerical Simulation

Based on the above analysis, it can be concluded that AV can be detected in the guide wall structure, and it indeed amplifies the vibrations of certain blocks on the guide wall during the discharge process. To explore the detailed mechanism of guide wall vibration, numerical simulations for the vibration mode of the dam and the guide wall are proposed using the commercial software ANSYS.
Compared with the operational modal parameter identification by eigensystem realization algorithm (ERA) on the same project [42], it is shown that the vibration appears as the vibration of an integral structure, rather than the independent vibration of each block, due to the transmission of shear forces through joints and thermal expansion (the tests were implemented in the summer). Therefore, the cementation between adjacent blocks is considered, with the integral numerical models built, and the frequencies of the dam and the guide wall are calculated for both dry and wet modes.
The numerical models and the corresponding material parameters (density ρ, elastic modulus E, and Poisson ratio ν) are shown in Figure 19. For the guide wall, the connection to the foundation is simplified as the all-degrees of freedom (all-DOF) constraint applied to the bottom, which corresponds to the constraints in the independent FV system; the connection to the dam is simplified as the all-DOF without the longitudinal displacement constraint for the diving joint between the guide wall and the dam, corresponding to the constraints in the AV system. For the AFCV system, both kinds of constraints are applied. For the dam, the all-DOF constraint is applied to the bottom, and the diving joint between the guide wall and dam is considered as the all-DOF without the longitudinal displacement constraint. For the wet mode, the range of water is considered to be twice as much as the height of the guide wall or the dam.
Table 2 shows several natural frequencies of the dam for both dry and wet modes. There are several modes with frequencies that match actual dominant frequencies. It is noted that the dam is a structure with closely spaced natural frequencies, whether in dry or wet mode. That is, under the flow fluctuation with a broad frequency band, there is always a mode with a natural frequency which is close to the excitation frequency.
As mentioned above, by changing constraints, the vibration modes for the AV system, independent FV system and AFCV system can be respectively analyzed. Table 3 illustrates some typical natural frequencies of the guide wall. There are also several modes with frequencies that match the actual dominant frequencies.
According to prototype tests, the root mean square (RMS) of the horizontal displacement reaches a maximum in the 6# guide wall block. Through numerical simulation, it can be found that for all three vibration systems, there are always several natural frequencies in the range of 2–7 Hz that are in accordance with actual vibrational characteristics. The corresponding vibration patterns, their orders, and natural frequencies are illustrated in Figure 20. Therefore, these vibration modes can be inferred to participate in the actual vibration.

4.3. Vibration Mechanism Analyses for the TGHS Left Guide Wall

Based on the spectrum analyses, XWT correlation analyses, and numerical simulation, the detailed mechanism of the TGHS left guide wall vibration can be clarified with the proposed AFCV theory. The guide wall vibration consists of the AV induced by the dam vibration and the independent FV caused by flow fluctuation. The contribution of AV depends on the location of the guide wall block. Using the theoretical model detailed in Section 3, the mechanism can be verified as below.
According to the modal analyses, the dam is a structure with closely spaced modes, therefore, there is always a natural frequency of the dam that matches the excitation frequency. The concerned frequencies for all of the corresponding vibration systems have participated in the vibration, which means they also match the excitation frequencies. Referring to the corresponding natural frequencies in Figure 20, the parameter λ 12 can be considered as 0.8, and λ 13 can be considered as 1. Consequently, the dynamic response of the guide wall is shown in Figure 21.
For this case, parameters ξ 2 and γ are considered to be corresponding parameter values of the integral guide wall, as well as the parameter λ 12 , as mentioned above. For upstream guide wall blocks, which are further from the dissipation zone and closer to the dam, the flow fluctuations are weak, and the frequency bands are narrow. As mentioned above, the external excitation matches the natural frequency of the dam; therefore, λ 01 is located around 1. As shown in Figure 21, there is a peak value at λ 01 = 1 , indicating that the guide wall vibration is significantly affected by the dam, i.e., AV is significant, corresponding to Figure 18a–c. While, for downstream guide wall blocks, which are closer to the dissipation zone, the flow here demonstrates strong fluctuation and a broad frequency bandwidth. The ratio between the frequencies of external excitation and the dam (i.e., λ 01 ) range from 0.2 to 5 (analogous to Figure 10). It is noted that the two peaks are located in this range, which indicates that both AV and independent FV contribute to the guide wall vibration. Due to the greater peak value of ω 0 = ω 2 , the contribution from independent FV is more significant than that from AV. Because there are also several natural frequencies of the dam which are in this range, it illustrates a broader correlation between the dam block and the guide wall blocks, as seen in Figure 18d–h.
Therefore, by the verification of prototype tests, it can be demonstrated that the vibration mechanism of the TGHS left guide wall can be distinctly clarified by the theoretical model, in other words, the proposed AFCV theory is valid and correct.

5. Conclusions

In this paper, a new vibration mechanism is presented to analyze the flow-induced vibration (FIV) of the spillway guide wall in a hydropower station, with the new concepts of associated vibration (AV) and associated-forced coupled vibration (AFCV) defined. The prototype tests on the left guide wall of the Three Gorges Hydropower Station (TGHS) indicate that there are several similar dominant frequencies of the horizontal displacements between 1# dam block and guide wall blocks. To investigate the mechanism of the vibration synchronization, a two-degrees-of-freedom theoretical model of the AFCV system is proposed, considering the lightweight spillway guide wall as an accessory structure installed in both the large-scale primary structure (the dam) and the foundation. Afterwards, the practicability of this theoretical model is verified by mutual analyses. Using the cross-wavelet transform (XWT), the correlation between the vibrational signals measured on the dam block and guide wall blocks, respectively, is illustrated, which confirms the existence of AFCV. With the vibrational characteristics calculated by numerical simulation, the vibration mechanism is clarified by the theoretical model.
In brief, the guide wall vibration is not only a simple independent forced vibration (FV) but also a vibration influenced by the dam, of which the effect can be named as AFCV. This kind of vibration derives from the effect of the shear force through joints and thermal expansion. The contribution level of the AV on the guide wall depends on the relative position of the guide wall, the dam, and the position of the dissipation zone. When the guide wall is positioned closer from the dam and further to the dissipation zone, the guide wall vibration appears to possess synchronized characteristics with the dam, proving the existence of AV; the synchronized vibrational frequency band is narrow but concentrated, which indicates AV is a dominant vibration component in this case. On the contrary, when the guide wall is positioned further from the dam and closer to the dissipation zone, the guide wall vibration appears to be with a broad frequency band and possesses more independent FV characteristics, although the vibration intensity tends to increase because of the stronger fluctuation in the flow.
It is noted that all of the above changes in the vibrational characteristics can be elucidated by varying the parameters in the theoretical model, such as λ 12 , ξ 2 , γ, which indicates the validity of the theoretical model. Furthermore, by changing parameters using practical engineering measures, the model can provide a certain beneficial reference regarding vibration reduction.
Moreover, it should be pointed out that due to the complexity of the engineering structures and FSI effect, the mechanism of vibration propagation and the engineering measures to reduce propagation still require further investigation.

Author Contributions

Conceptualization, J.L. and C.L.; data curation, B.M.; formal analysis, Y.Z.; funding acquisition, J.L. and B.M.; methodology, Y.Z. and C.L.; software, Y.Z.; validation, J.L.; writing—original draft preparation, Y.Z.; writing—review and editing, J.L. and C.L.

Funding

This research was funded by National Key R&D Program of China (No. 2016YFC0401905), Science Fund for Creative Research Groups of the National Natural Science Foundation of China (No. 51621092), National Natural Science Foundation of China (No. 51579173, No. 51779167, No. 51809194), China Postdoctoral Science Foundation (2019M652550), and Funds for Postdoctoral Scientific Research in Henan Province (in 2019).

Conflicts of Interest

The authors declare no conflict of interest.

Appendix A

Table A1. The working condition of prototype tests.
TimeUpstream Water Level (m)Downstream Water Level (m)Discharge (m3)Opening Outlets
15:00144.8568.0526,0001#, 3#, 5#, 9#, 13#, 15#
16:00144.8768.12
17:00144.8668.12
18:00144.8668.14
19:00144.8668.15
Figure A1. The time-history and Fourier Transform (FT) spectrum of horizontal displacement on 1# dam block.
Applsci 09 02572 g0a1
Figure A2. The time-history and FT spectrum of horizontal displacement in guide wall blocks. (a) 1# guide wall block; (b) 2# guide wall block; (c) 3# guide wall block; (d) 4# guide wall block; (e) 5# guide wall block; (f) 6# guide wall block; (g) 7# guide wall block; (h) 8# guide wall block.
Applsci 09 02572 g0a2aApplsci 09 02572 g0a2b

References

  1. Naudascher, E.; Rockwell, D. Flow-Induced Vibrations: An Engineering Guide; Balkema: Rotterdam, The Netherlands, 1994. [Google Scholar]
  2. Blevins, R.D. Flow-Induced Vibration; Van Nostrand Reinhold: New York, NY, USA, 1977. [Google Scholar]
  3. Weaver, D.S. On flow induced vibrations in hydraulic structures and their alleviation. Can. J. Civ. Eng. 1975, 3, 126–137. [Google Scholar] [CrossRef]
  4. Liang, C. Research on Vibration Mechanism and Reduction Methods for Structures and Surronding Ground under Excitations Generated by High Dam Flood Disc. Ph.D. Thesis, Tianjin University, Tianjin, China, 2017. (In Chinese). [Google Scholar]
  5. Lian, J.J.; Yang, M. Hydrodynamics for High Dam; China Water & Power Press: Beijing, China, 2008. (In Chinese) [Google Scholar]
  6. Conca, C.; Osses, A.; Planchard, J. Added mass and damping in fluid-structure interaction. Comput. Methods Appl. Mech. Eng. 1997, 146, 387–405. [Google Scholar] [CrossRef]
  7. Kolkman, P.A.; Vrijer, A. Gate edge suction as a cause of self-exciting vertical vibrations. In Proceedings of the 17th Congress of the International Association for Hydraulic Research, Baden-Baden, Germany, 15–19 August 1977. [Google Scholar]
  8. Thang, N.D.; Naudascher, E. Vortex-excited vibrations of underflow gates. J. Hydraul. Res. 1986, 24, 133–151. [Google Scholar] [CrossRef]
  9. Thang, N.D.; Naudascher, E. Self-excited vibrations of vertical-lift gates. J. Hydraul. Res. 1986, 24, 391–404. [Google Scholar] [CrossRef]
  10. Lian, J.J.; Li, Y.P. Research on mechanism of large amplitude self-excited vibration of hydro-automatic flap gate. Shuili Xuebao 1994, 11, 56–64. (In Chinese) [Google Scholar] [CrossRef]
  11. Yuan, X.M.; Cui, G.T.; Zhang, Y.F. Application of artificial neural network approach to implement recognition and predict flow induced vibration system. Shuili Xuebao 1999, 3, 13–20. (In Chinese) [Google Scholar] [CrossRef]
  12. Liang, C.; Lian, J.J.; Ma, B.; Liu, F.; Liu, Z. Analysis for the cause and mechanism of the hydraulic gate vibration during flood discharging from the perspective of structural dynamics. Shock Vib. under review.
  13. Lian, J.J.; Cui, G.T.; Huang, J.L. Study on flow induced vibration of spillway guide wall. Shuili Xuebao 1998, 11, 33–37. (In Chinese) [Google Scholar] [CrossRef]
  14. Dehdar-behbahani, S.; Parsaie, A. Numerical modeling of flow pattern in dam spillway’s guide wall. Case study: Balaroud dam, Iran. Alexandria Eng. J. 2016, 55, 467–473. [Google Scholar] [CrossRef]
  15. Wang, J.; Chen, H. Improved design of guide wall of bank spillway at Yutang Hydropower Station. Water Sci. Eng. 2010, 3, 67–74. [Google Scholar] [CrossRef]
  16. Zhu, B.; Wu, J.F.; Peng, D. Flow-induced vibration analysis for dividing-wall in bottom outlets section of Wan’an project. J. Yangtze River Sci. Res. Inst. 1994, 11, 30–37. (In Chinese) [Google Scholar]
  17. Li, H.K.; Lian, J.J.; Liu, Y.Z. Prototype observation of flood discharge-induced vibration and its dynamic identification and safety evaluation of Three Gorges left guide wall. Hydro-Sci. Eng. 2010, 3, 59–64. (In Chinese) [Google Scholar] [CrossRef]
  18. Chen, L.L.; Qian, S.G. FEM analysis on flow-induced vibration of TGP left training wall. Yangtze River 2000, 31, 7–9. (In Chinese) [Google Scholar] [CrossRef]
  19. He, L.J.; Lian, J.J.; Ma, B. Intelligent damage identification method for large structures based on strain modal parameters. J. Vib. Control 2013, 20, 1783–1795. [Google Scholar] [CrossRef]
  20. Ouyang, Q.P.; He, L.; Lian, J.J.; Chen, Y.Y.; Ma, B. Damage identification method for guide wall structures based on a hybrid algorithm of clonal selection and particle swarm optimization. J. Vib. Shock 2014, 33, 120–126. (In Chinese) [Google Scholar] [CrossRef]
  21. Humar, J. Dynamics of Structures, 3rd ed.; CRC Press: Boca Raton, FL, USA, 2012. [Google Scholar]
  22. Du, Q.; Yang, S. Application of the EMD method in the vibration analysis of ball bearings. Mech. Syst. Sig. Process. 2007, 21, 2634–2644. [Google Scholar] [CrossRef]
  23. Jordan, D.A.; Hajj, M.R.; Tieleman, H.W. Wavelet analysis of the relation between atmospheric wind and pressure fluctuations on a low-rise building. J. Wind Eng. Ind. Aerodyn. 1997, 69–71, 647–655. [Google Scholar] [CrossRef]
  24. Adamowski, J.F. River flow forecasting using wavelet and cross-wavelet transform models. Hydrol. Process. 2008, 22, 4877–4891. [Google Scholar] [CrossRef]
  25. De Michele, G.; Sello, S.; Carboncini, M.C.; Rossi, B.; Strambi, S.K. Cross-correlation time-frequency analysis for multiple EMG signals in Parkinson’s disease: A wavelet approach. Med. Eng. Phys. 2003, 25, 361–369. [Google Scholar] [CrossRef]
  26. Lian, J.J.; Zhang, Y.; Liu, F.; Zhao, Q. Analysis of the ground vibration induced by high dam flood discharge using the cross wavelet transform method. J. Renew. Sustain. Energy 2015, 7, 043146. [Google Scholar] [CrossRef]
  27. Li, C.X.; Zhang, J. Nonlinear coupled dynamics analysis of a truss spar platform. China Ocean Eng. 2016, 30, 835–850. [Google Scholar] [CrossRef]
  28. Li, C.; Liu, Y. On the weakly nonlinear seakeeping solution near the critical frequency. J. Fluid Mech. 2018, 846, 999–1022. [Google Scholar] [CrossRef]
  29. Sigrist, J.F. Fluid-Structure Interaction: An Introduction to Finite Element Coupling; Wiley: New York, NY, USA, 2015. [Google Scholar]
  30. Zhang, E.M.; Dai, S.S. Fluid-Structure Interaction Dynamics; National Defense Industry Press: Beijing, China, 2011. (In Chinese) [Google Scholar]
  31. Kuo, J.S.H. Fluid-Structure Interactions: Added Mass Computations for Incompressible Fluid; University of California: Berkley, CA, USA, 1982. [Google Scholar]
  32. Cui, G.T.; Ma, B. Comprehensive compound method for flow-induced vibration of hydraulic structures. Adv. Sci. Technol. Water Resour. 2010, 30, 1–10. (In Chinese) [Google Scholar]
  33. Thompson, A.G. Optimum tuning and damping of a dynamic vibration absorber applied to a force excited and damped primary system. J. Sound Vib. 1981, 77, 403–415. [Google Scholar] [CrossRef]
  34. Chopra, A.K. Dynamics of Structures: Theory And Applications to Earthquake Engineering, 2nd ed.; Prentice Hall: Bergen, NJ, USA, 2001. [Google Scholar]
  35. Clough, R.W. Dynamics of Structures, 2nd ed.; McGraw-Hill Inc.: New York, NY, USA, 1993. [Google Scholar]
  36. Liu, G.H.; Lian, J.J.; Liang, C. Completeness verification of complex response spectrum method for underdamped and overdamped multiple-support systems regarding the decoupled damping as mathematical parameter without physical meaning. J. Earthq. Eng. 2016, 20, 1104–1125. [Google Scholar] [CrossRef]
  37. National Energy Administration of the People’s Republic of China. Code for Seismic Design of Hydraulic Structures of Hydropower Project (NB 35047-2015); China Electric Power Press: Beijing, China, 2015. (In Chinese)
  38. Zhang, S.M.; Chen, J. Studies on characteristics of hydrodynamic pressure acting on guide wall. J. Yangtze River Sci. Res. Inst. 1996, 13, 14–20. (In Chinese) [Google Scholar]
  39. Lian, J.J.; Cui, G.T.; Lin, J.Y. Analysis on flow-induced vibration of over flow high arch dam and its verification. Shuili Xuebao 1999, 12, 23–32. (In Chinese) [Google Scholar] [CrossRef]
  40. Zhou, H.; Wang, D.; Li, H.; Li, Q.; Zhang, G. Modified RCC technique for construction of left guide wall at Three Gorges Project. China Three Gorges Constr. 2002, 1, 17–18. (In Chinese) [Google Scholar]
  41. Torrence, C.; Compo, G.P. A practical guide to wavelet analysis. Bull. Am. Meteorol. Soc. 1998, 79, 61–78. [Google Scholar] [CrossRef]
  42. Lian, J.J.; Li, H.K.; Zhang, J.W. ERA modal identification method for hydraulic structures based on order determination and noise reduction of singular entropy. Sci. China Ser. E: Technol. Sci. 2008, 52, 400–412. [Google Scholar] [CrossRef]
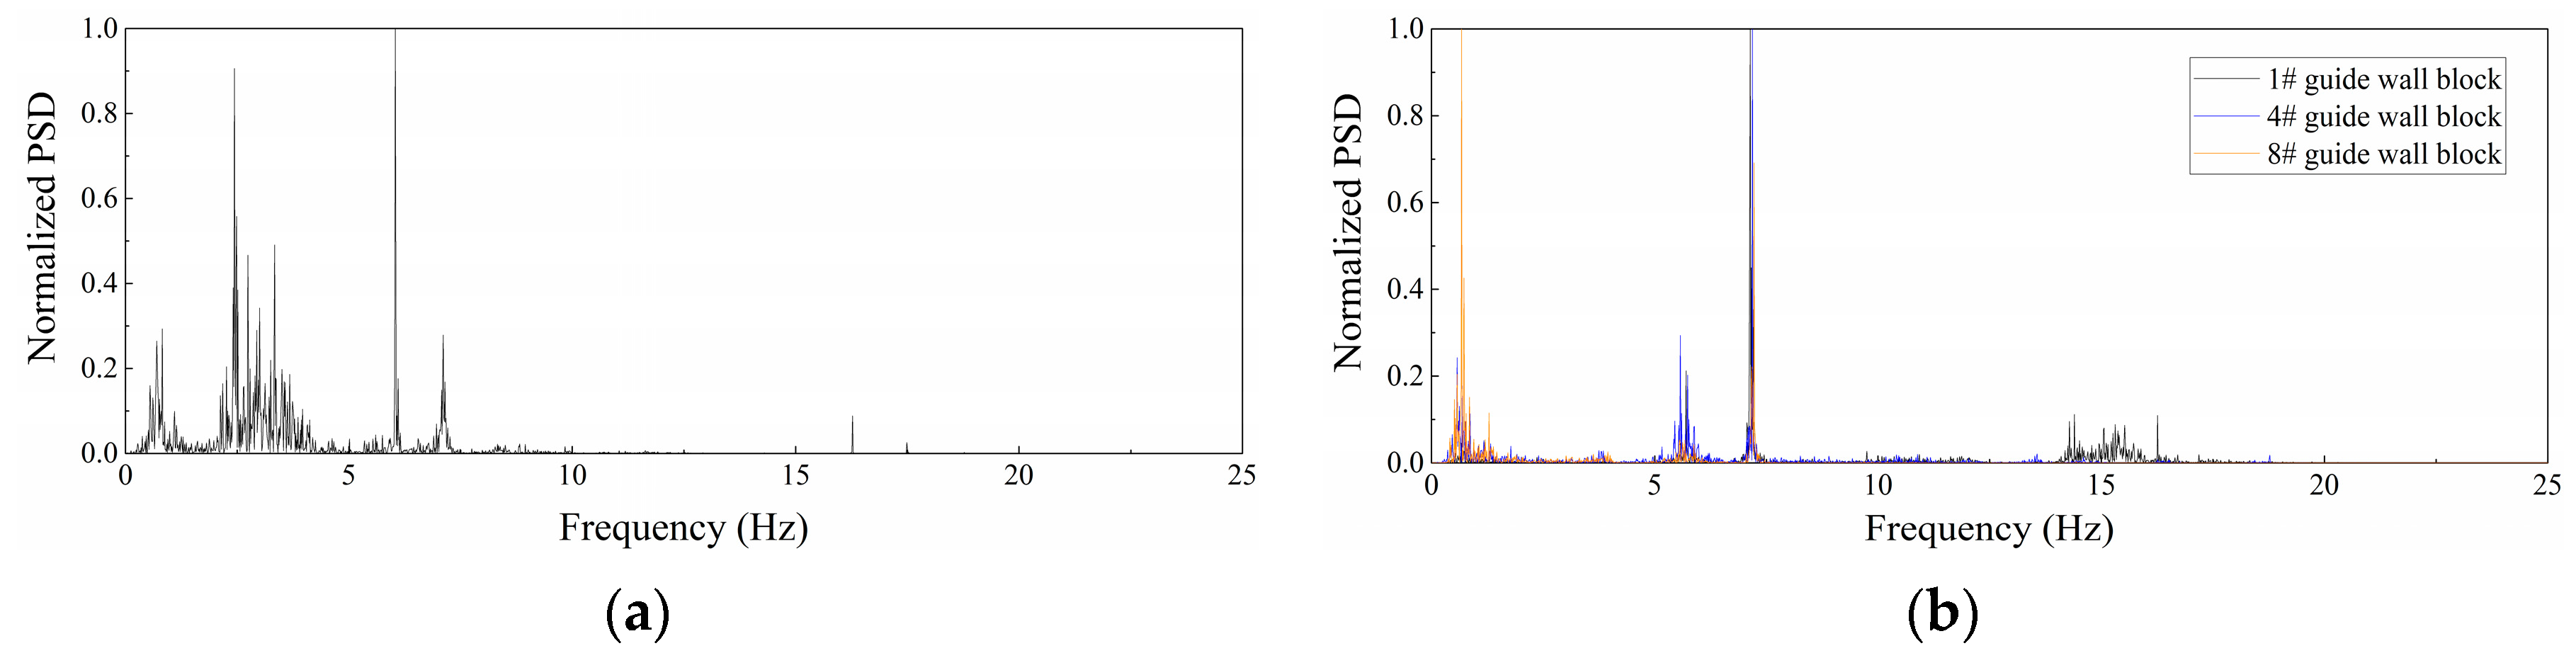
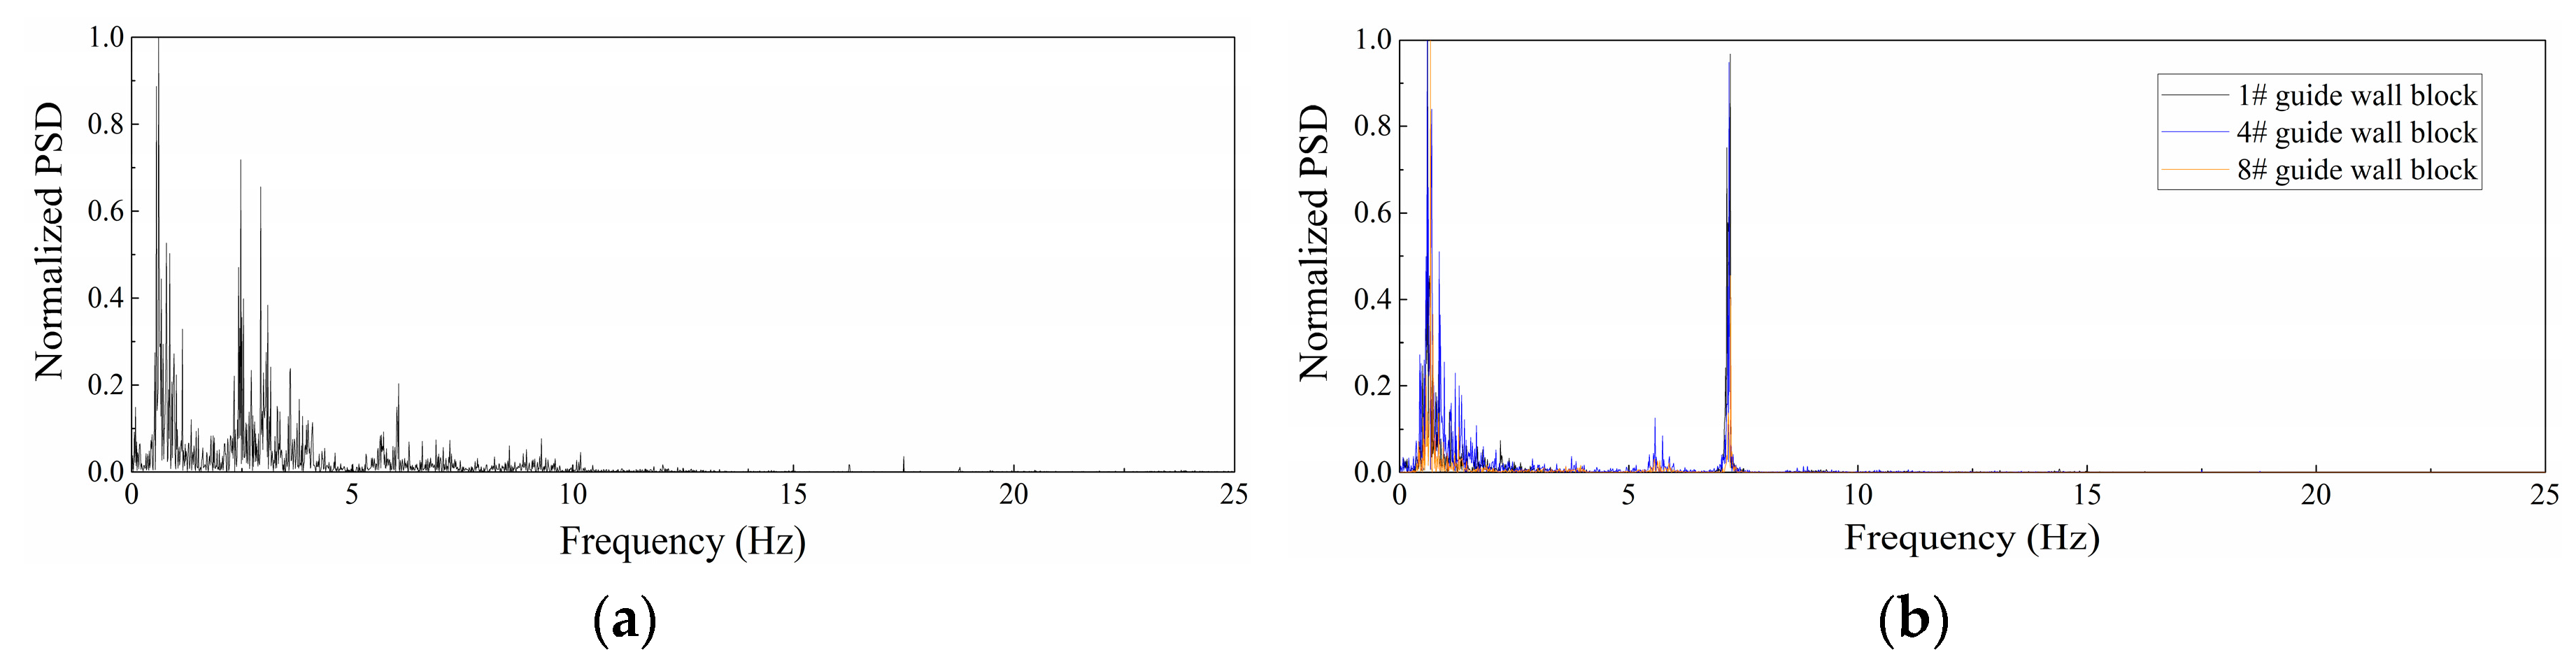
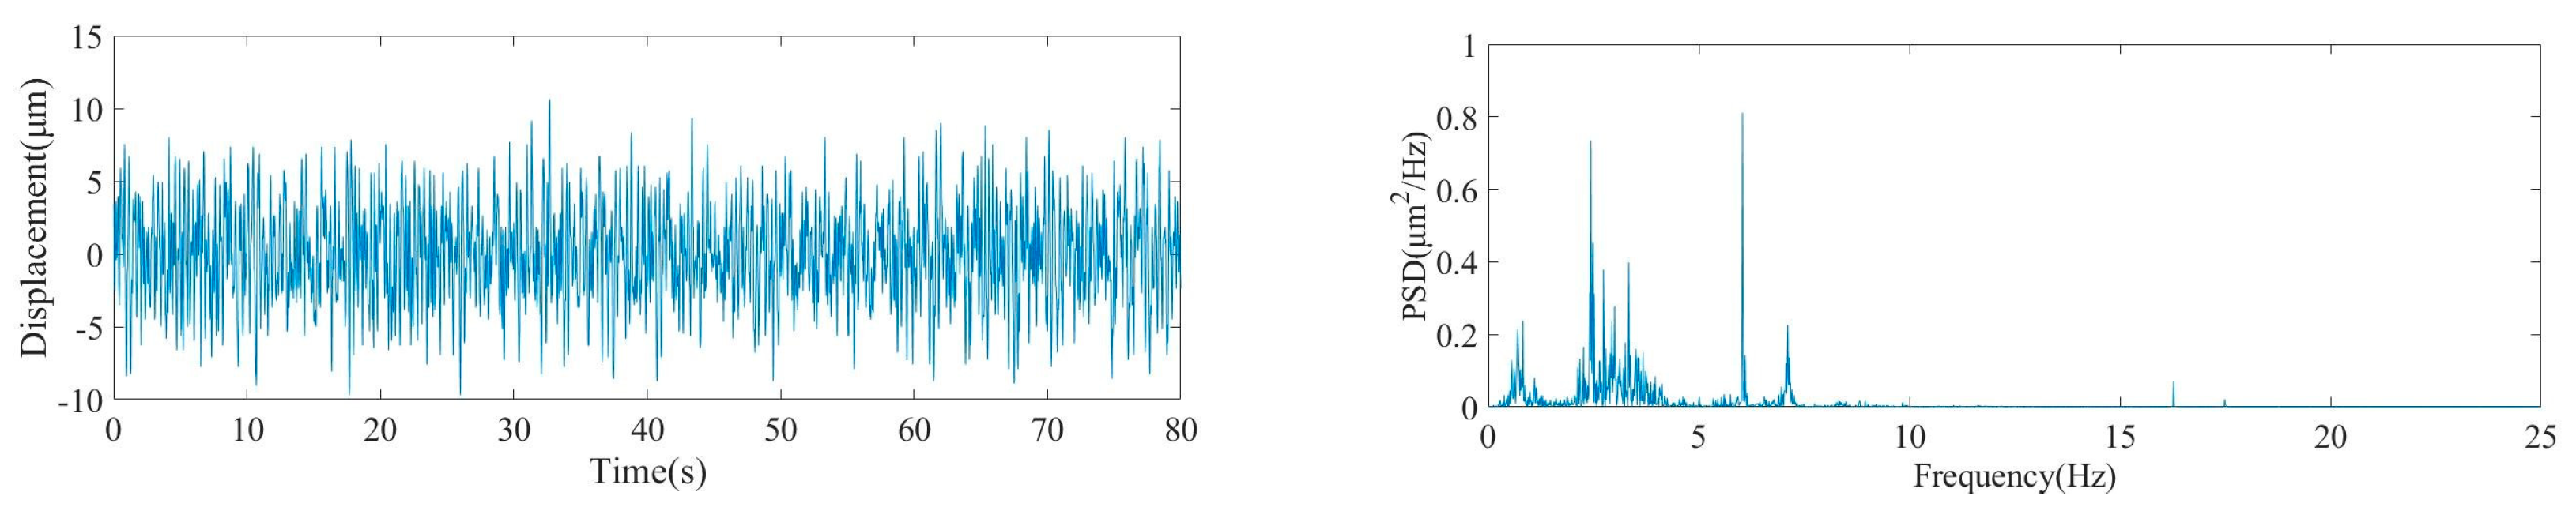
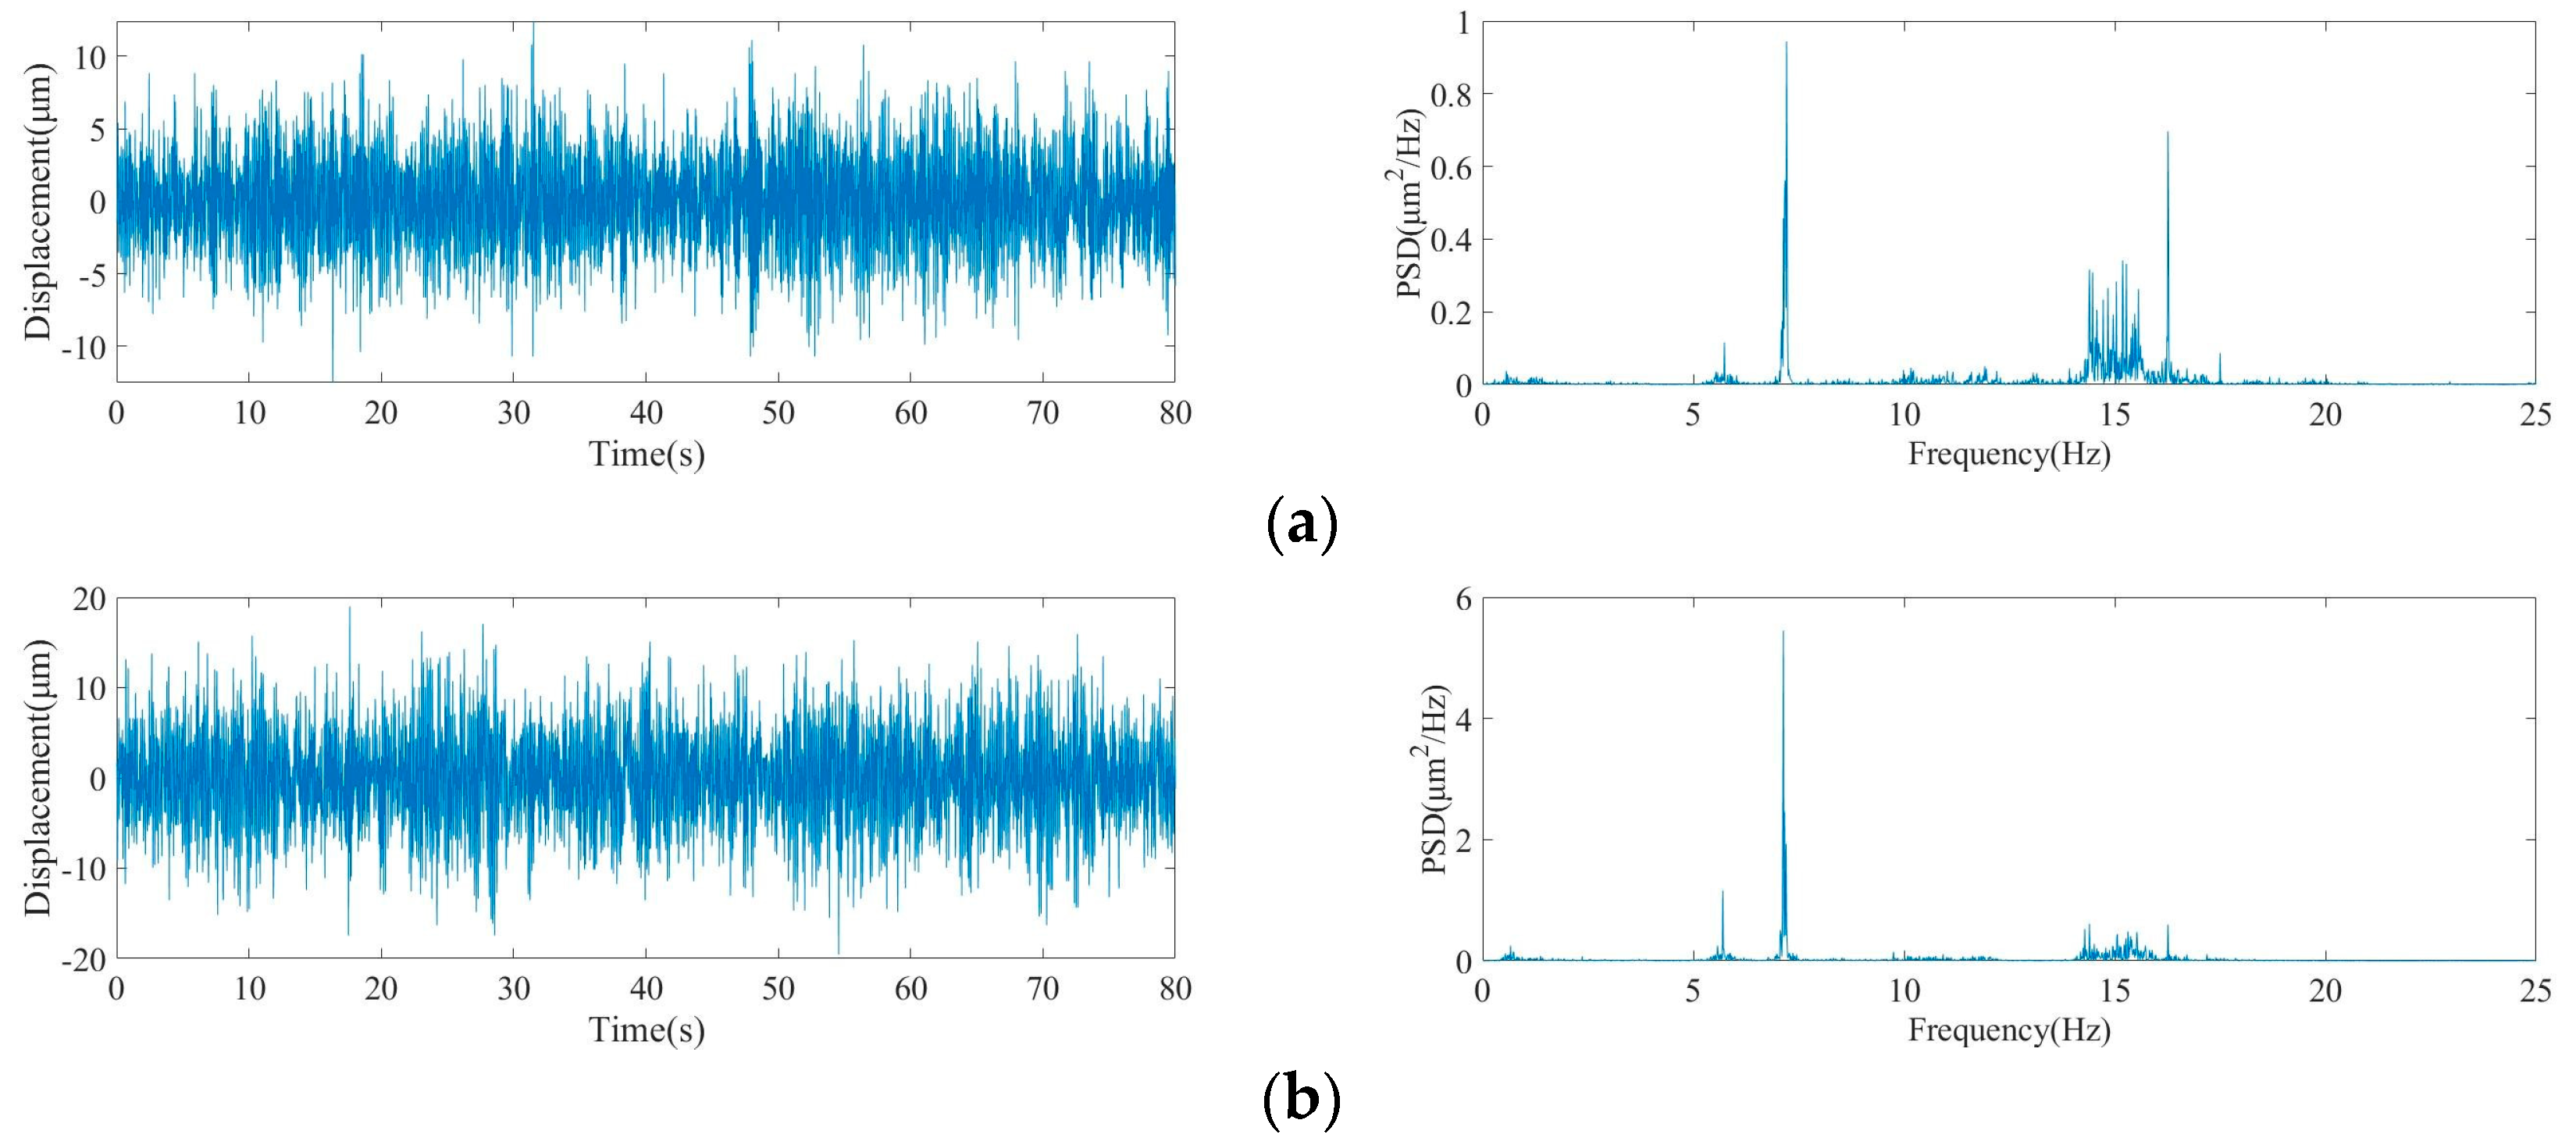
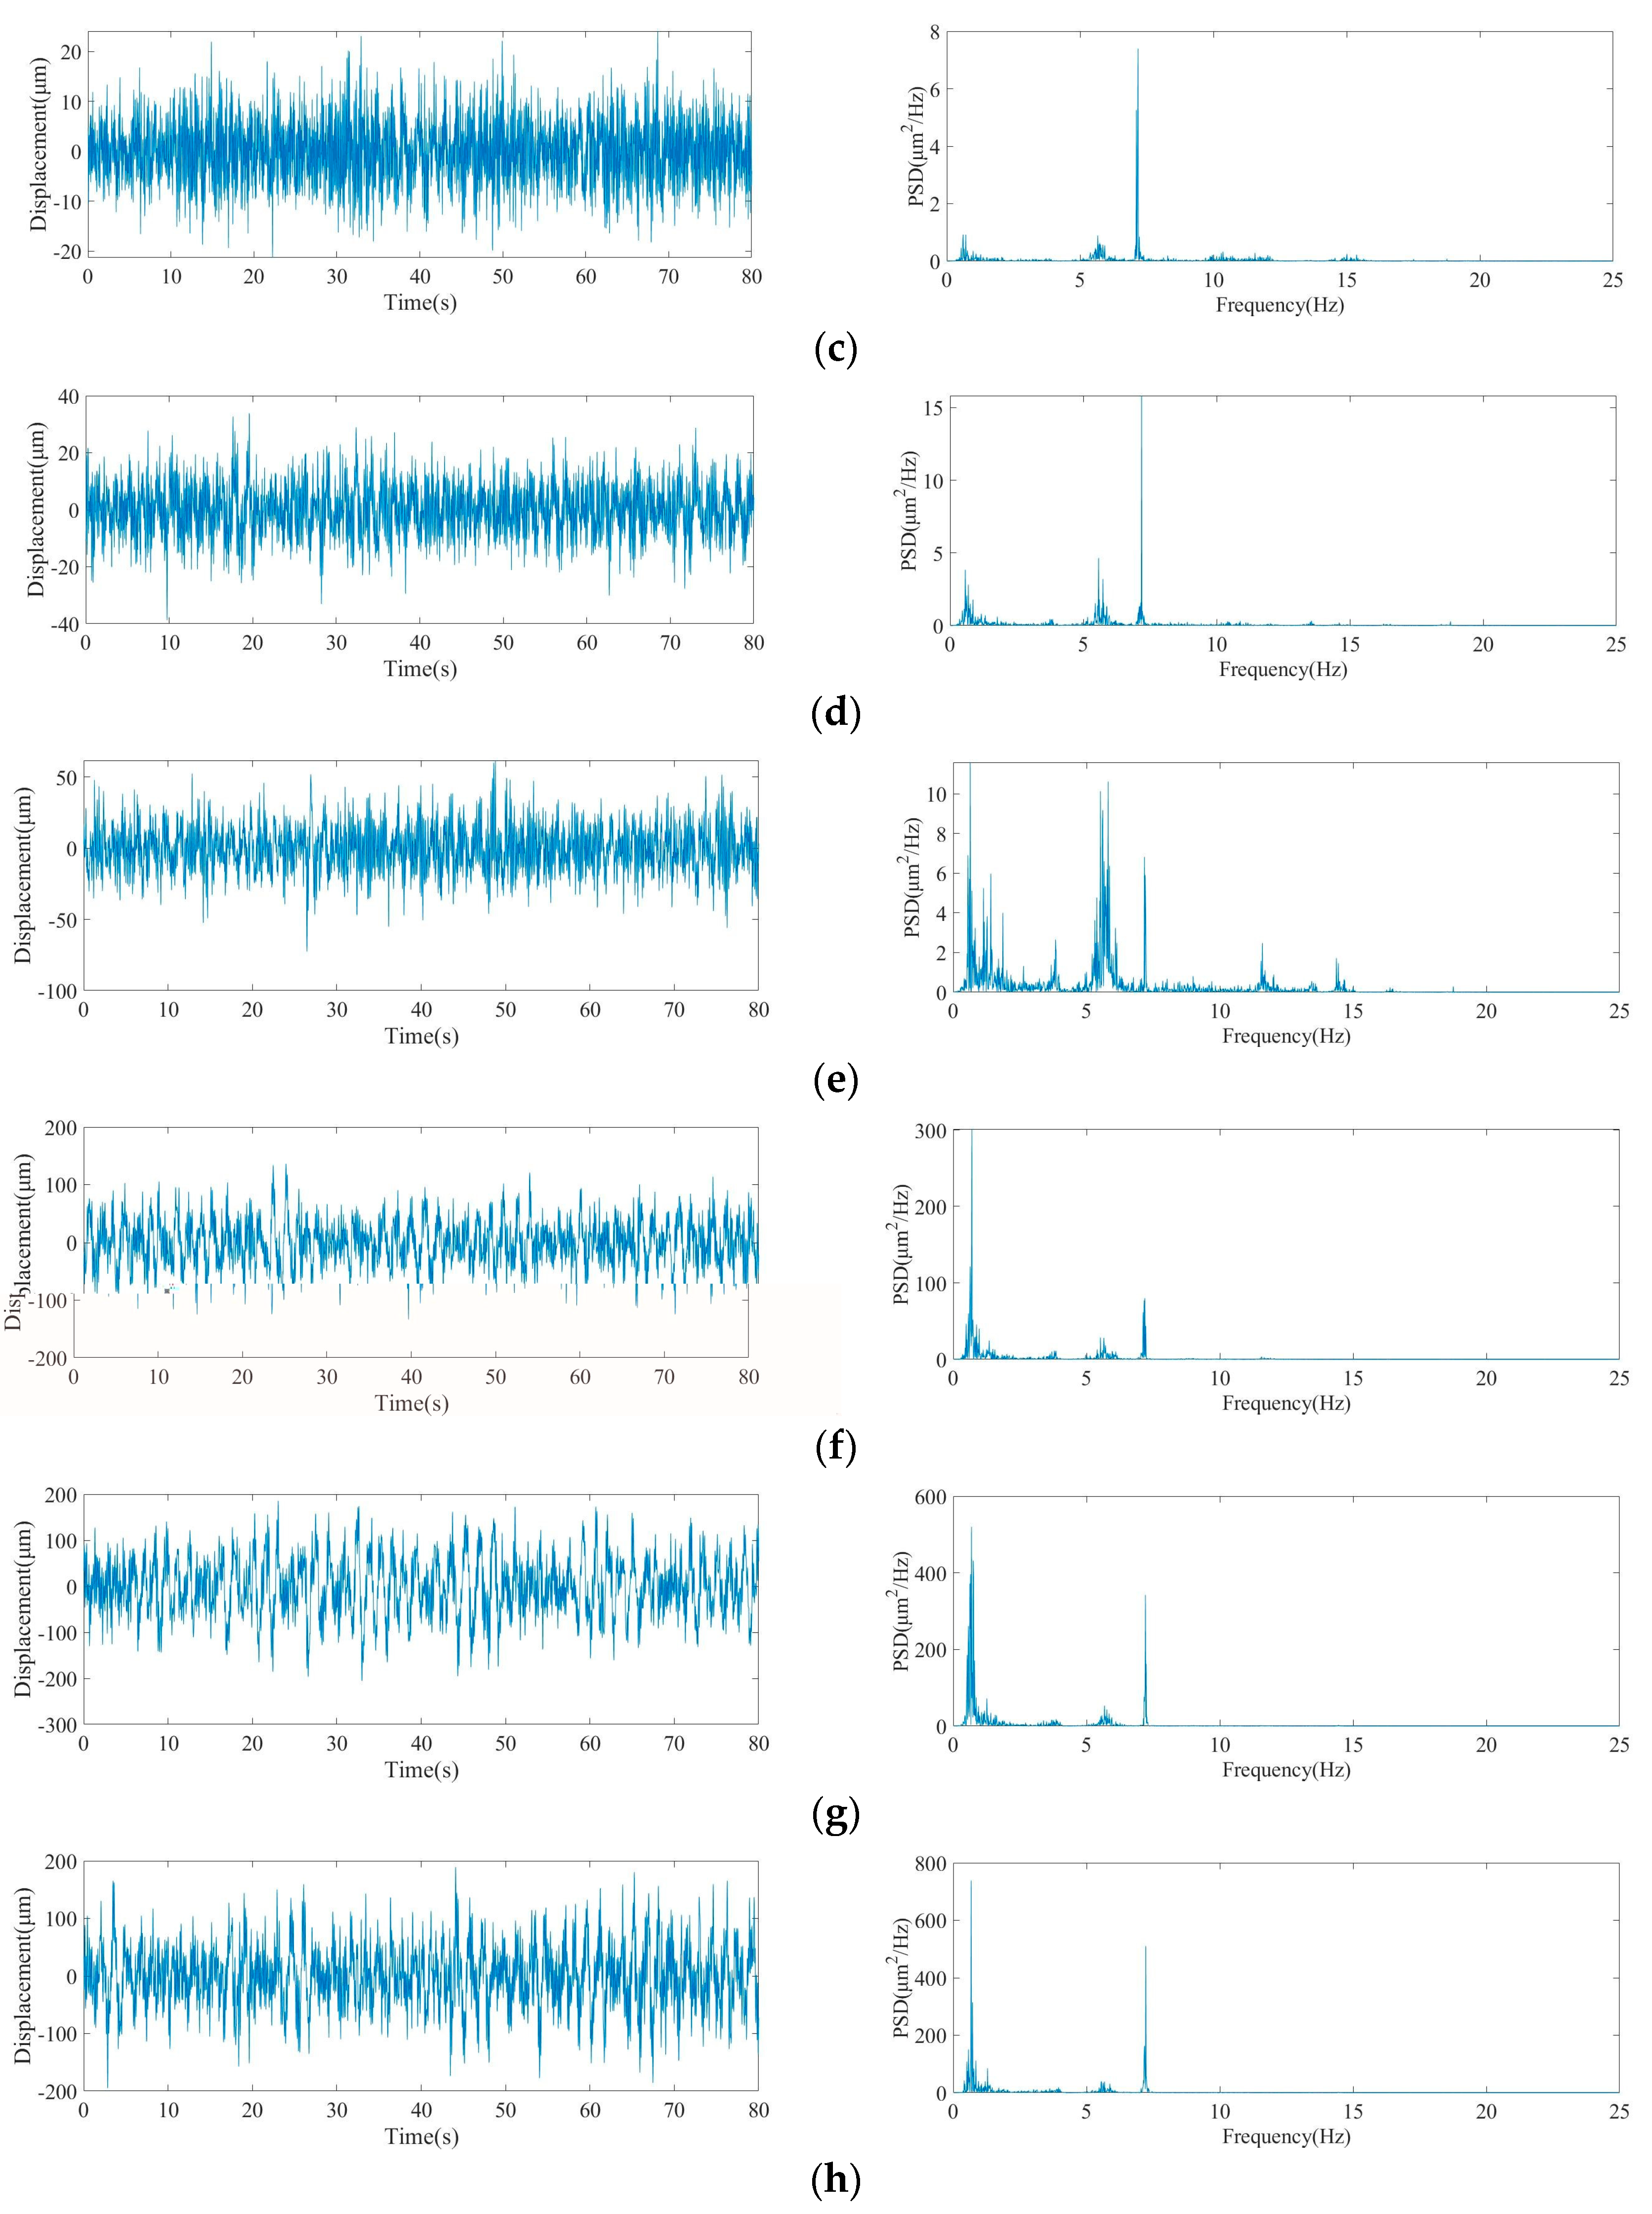
Figure 1. Hydraulic structures of the Three Gorges Hydropower Station (TGHS). (a) The layout of the TGHS project; (b) the enlarged view of left guide wall, spillway guide wall, and left powerhouse.
Applsci 09 02572 g001
Figure 2. The layout of measuring points. (a) The locations of measuring points; (b) dam block measuring points; (c) guide wall block measuring points (same layout for each block); (d) displacement sensor (horizontal and vertical); (e) acquisition devices.
Applsci 09 02572 g002
Figure 3. The comparison of Fourier Transform (FT) spectrums of horizontal displacements of the 1# dam block and typical guide wall blocks. (a) 1# dam block; (b) typical guide wall blocks.
Applsci 09 02572 g003
Figure 4. The comparison of FT spectrums of vertical displacements of the 1# dam block and typical guide wall blocks. (a) 1# dam block; (b) typical guide wall blocks.
Applsci 09 02572 g004
Figure 5. The left guide wall of TGHS in still water.
Applsci 09 02572 g005
Figure 6. A two-degrees-of-freedom theoretical model for a hydraulic gate: the associated vibration (AV) system.
Applsci 09 02572 g006
Figure 7. The modified two-degrees-of-freedom theoretical model for the guide wall: the associated-forced coupled vibration (AFCV) system.
Applsci 09 02572 g007
Figure 8. The comparison of horizontal and vertical displacements of a typical guide wall block. (a) Horizontal displacement; (b) vertical displacement.
Applsci 09 02572 g008
Figure 9. The dynamic response of the accessory structure with a varying parameter λ 12 ( λ 12 λ 13 = 0.2 ) .
Applsci 09 02572 g009
Figure 10. The dynamic response of the accessory structure with varying parameter λ 12 ( 0.2 < λ 12 5 ) .
Applsci 09 02572 g010
Figure 11. The dynamic response of the accessory structure with varying parameter λ 12 ( λ 12 > 5 ) . (a) The entire graph; (b) partial enlarged view of the peak.
Applsci 09 02572 g011
Figure 12. The dynamic response of the accessory structure with varying parameter λ 13 . (a) λ 12 = 0.5 ; (b) λ 12 = 0.1 ; (c) λ 12 = 10 .
Applsci 09 02572 g012
Figure 13. The dynamic response of the accessory structure upon varying the parameter ξ 1 .
Applsci 09 02572 g013
Figure 14. The dynamic response of the accessory structure upon varying the parameter ξ 2 .
Applsci 09 02572 g014
Figure 15. The dynamic response of the accessory structure upon varying the parameter ξ 3 .
Applsci 09 02572 g015
Figure 16. The dynamic response of the accessory structure upon varying the parameter γ. (a) The entire graph; (b) partial enlarged view of the second peak.
Applsci 09 02572 g016
Figure 17. The dynamic response of the accessory structure upon varying the parameter μ. (a) The entire graph; (b) partial enlarged view of the second peak.
Applsci 09 02572 g017
Figure 18. Contour of the cross-wavelet scalogram (XWS) between 1# dam block and corresponding guide wall blocks. (a) 1# guide wall block; (b) 2# guide wall block; (c) 3# guide wall block; (d) 4# guide wall block; (e) 5# guide wall block; (f) 6# guide wall block; (g) 7# guide wall block; (h) 8# guide wall block.
Applsci 09 02572 g018aApplsci 09 02572 g018b
Figure 19. Numerical model of concerned structures. (a) Guide wall; (b) spillway dam.
Applsci 09 02572 g019
Figure 20. Vibrational modes which are in accordance with actual vibrational characteristics. (a) The associated vibration (AV) system; (b) the independent forced vibration (FV) system; (c) the associated-forced coupled vibration (AFCV) system.
Applsci 09 02572 g020
Figure 21. The dynamic response of the TGHS left guide wall.
Applsci 09 02572 g021
Table 1. Dominant frequencies of horizontal displacements in different parts of structures.
StructuresDominant Frequencies (Hz)
1# dam block0.83, 2.44, 3.34, 6.04, 7.11, 16.27
Guide wall blocks0.56–0.7, 5.58–5.81, 7.14–7.22, 14.4, 16.26
Table 2. Natural frequencies of the dam.
OrderDry Mode (Hz)Wet Mode (Hz)OrderDry Mode (Hz)Wet Mode (Hz)
12.701.88238.766.03
22.982.21259.106.27
53.953.24309.606.67
96.324.20359.796.99
106.404.39379.837.18
Table 3. Natural frequencies of the guide wall.
OrderAV SystemIndependent FV SystemAFCV System
Dry Mode (Hz)Wet Mode (Hz)Dry Mode (Hz)Wet Mode (Hz)Dry Mode (Hz)Wet Mode (Hz)
31.241.064.572.005.602.00
52.651.787.192.807.592.81
73.562.028.623.119.553.31
84.083.639.533.5610.593.90
96.093.679.794.1311.254.35
106.384.1510.514.3511.404.88
116.724.3010.714.8511.515.01
1710.655.7412.355.8413.146.01
1811.185.8612.686.0013.226.21
2011.536.1312.946.2213.646.69

