Experimental Study on Mechanics and Permeability Properties of Water-Bearing Raw Coal Samples Under In-Situ Stress


Abstract
1. Introduction
2. Test Device and Scheme Design
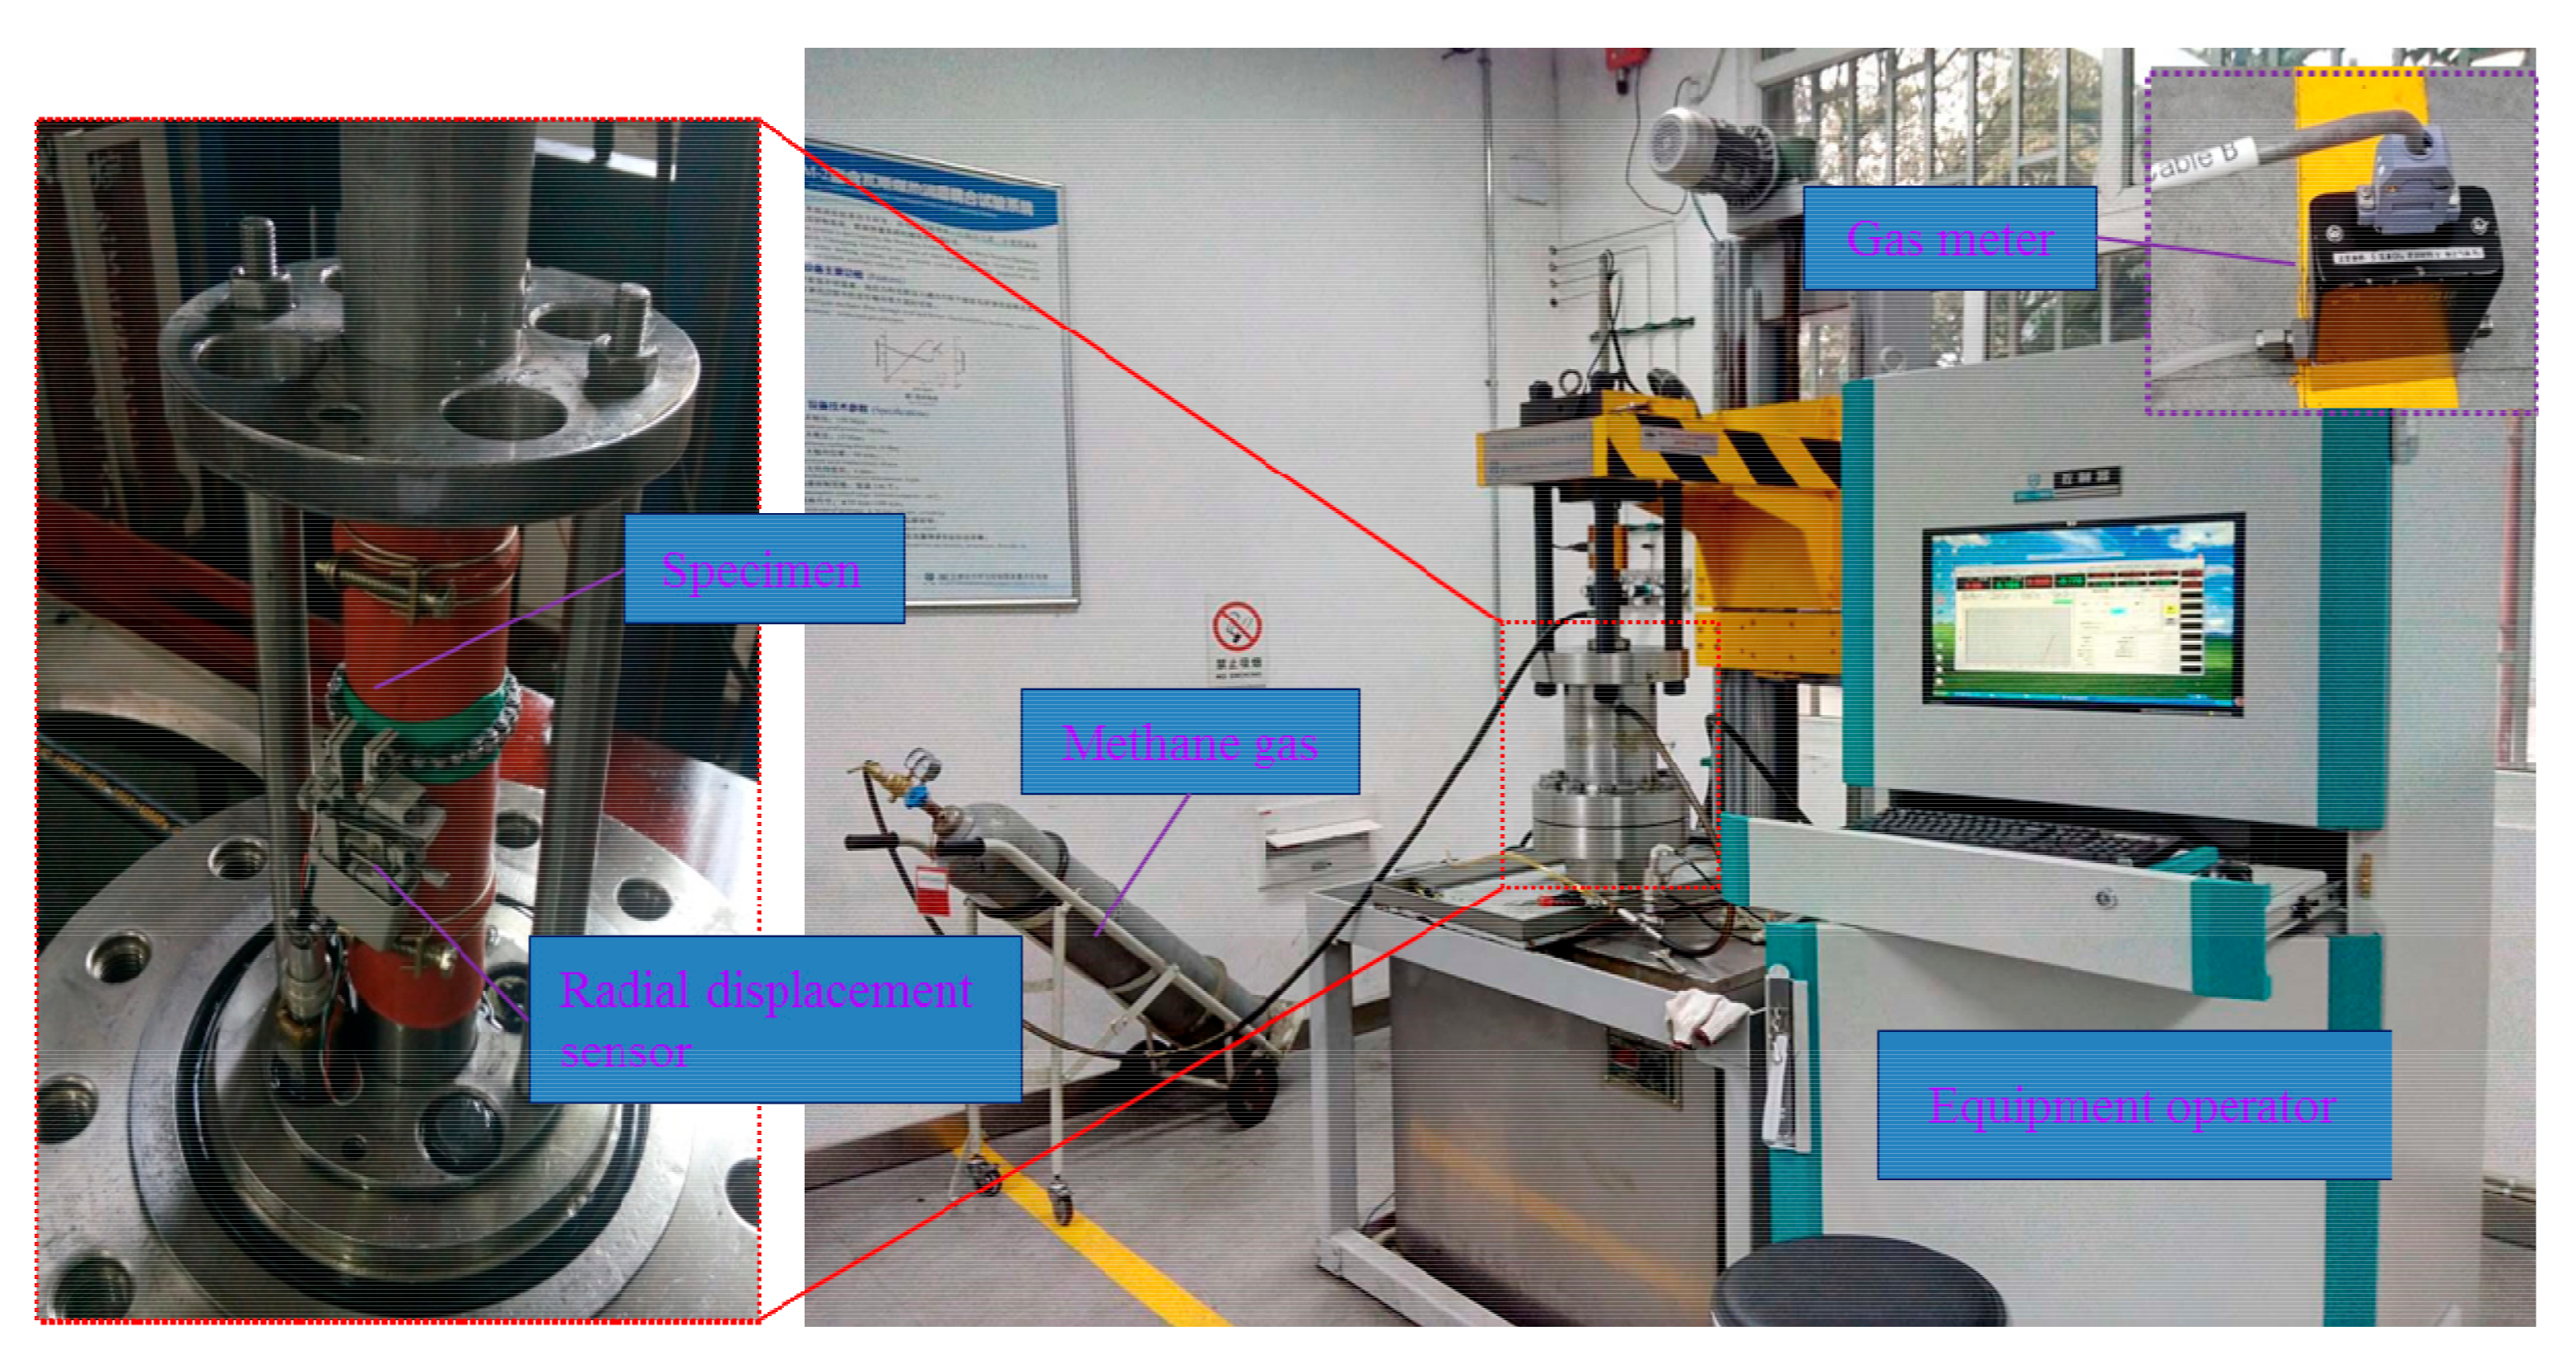
2.1. Test Device
2.2. Sample Preparation
2.3. Scheme Design
3. Test Results and Theoretical Analysis
3.1. Analysis of Pre-Peak Loading and Unloading Results
3.2. Analysis of the Deformation Properties during Post-Peak Loading and Unloading
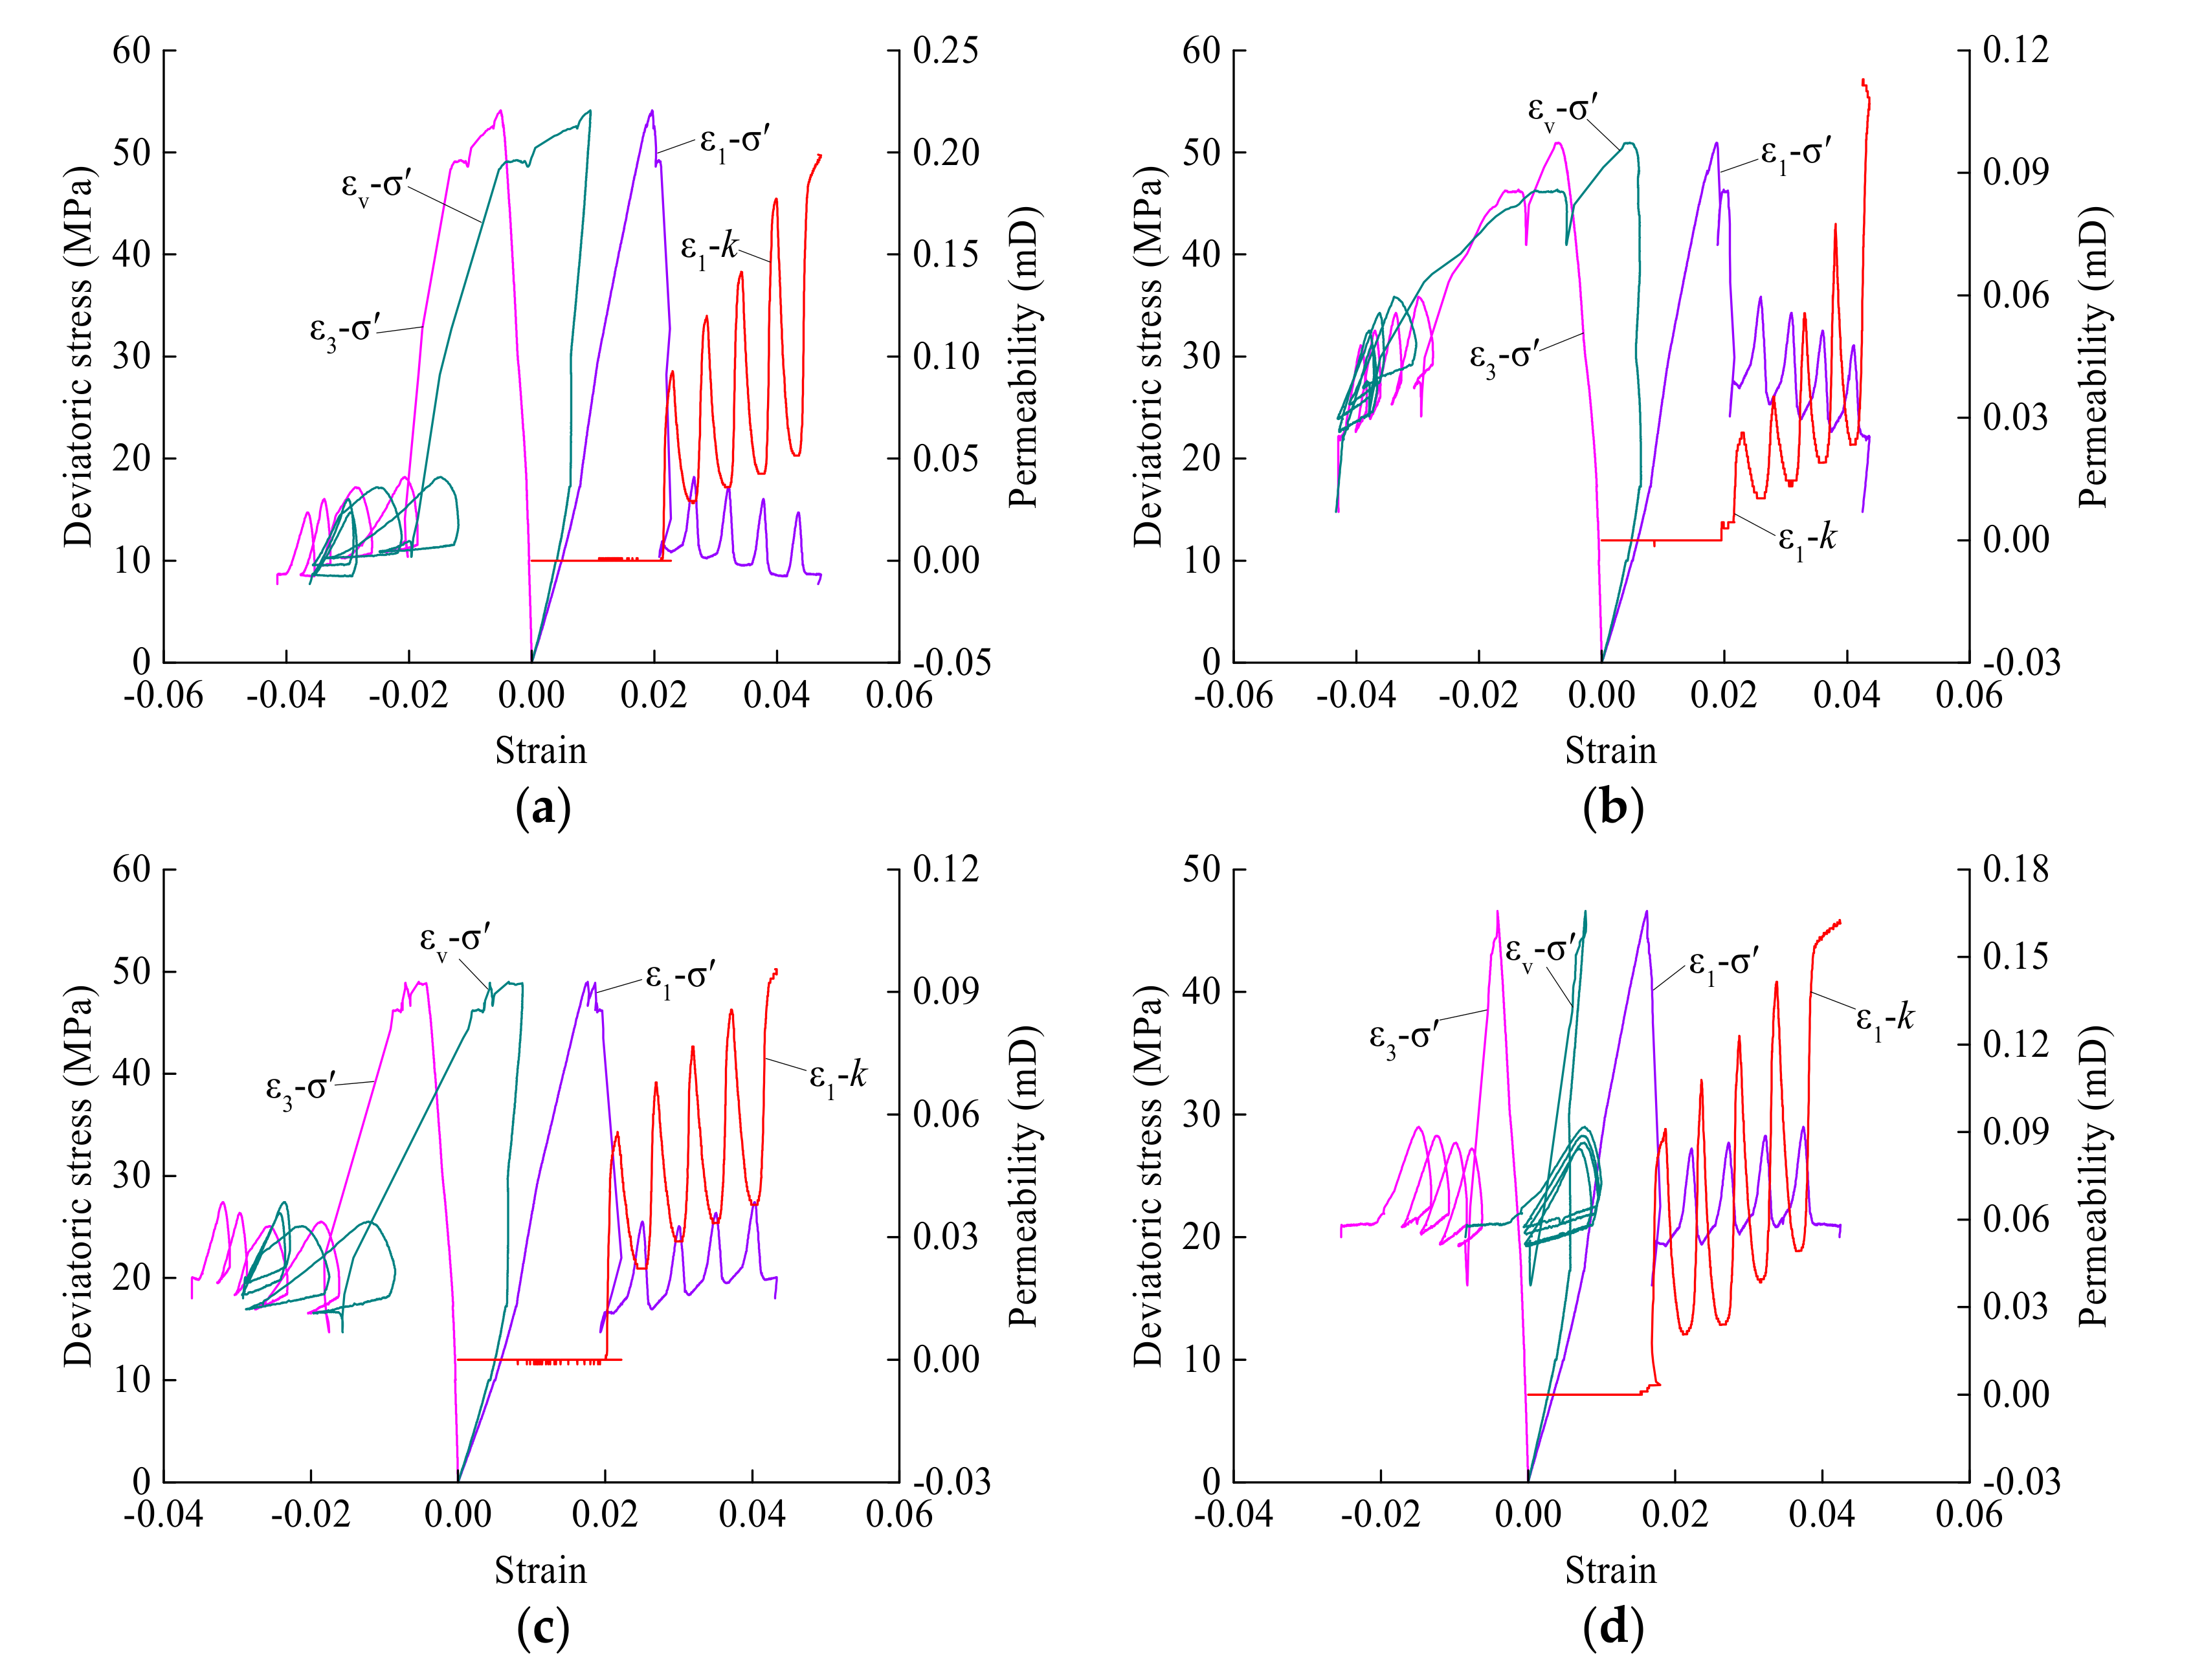
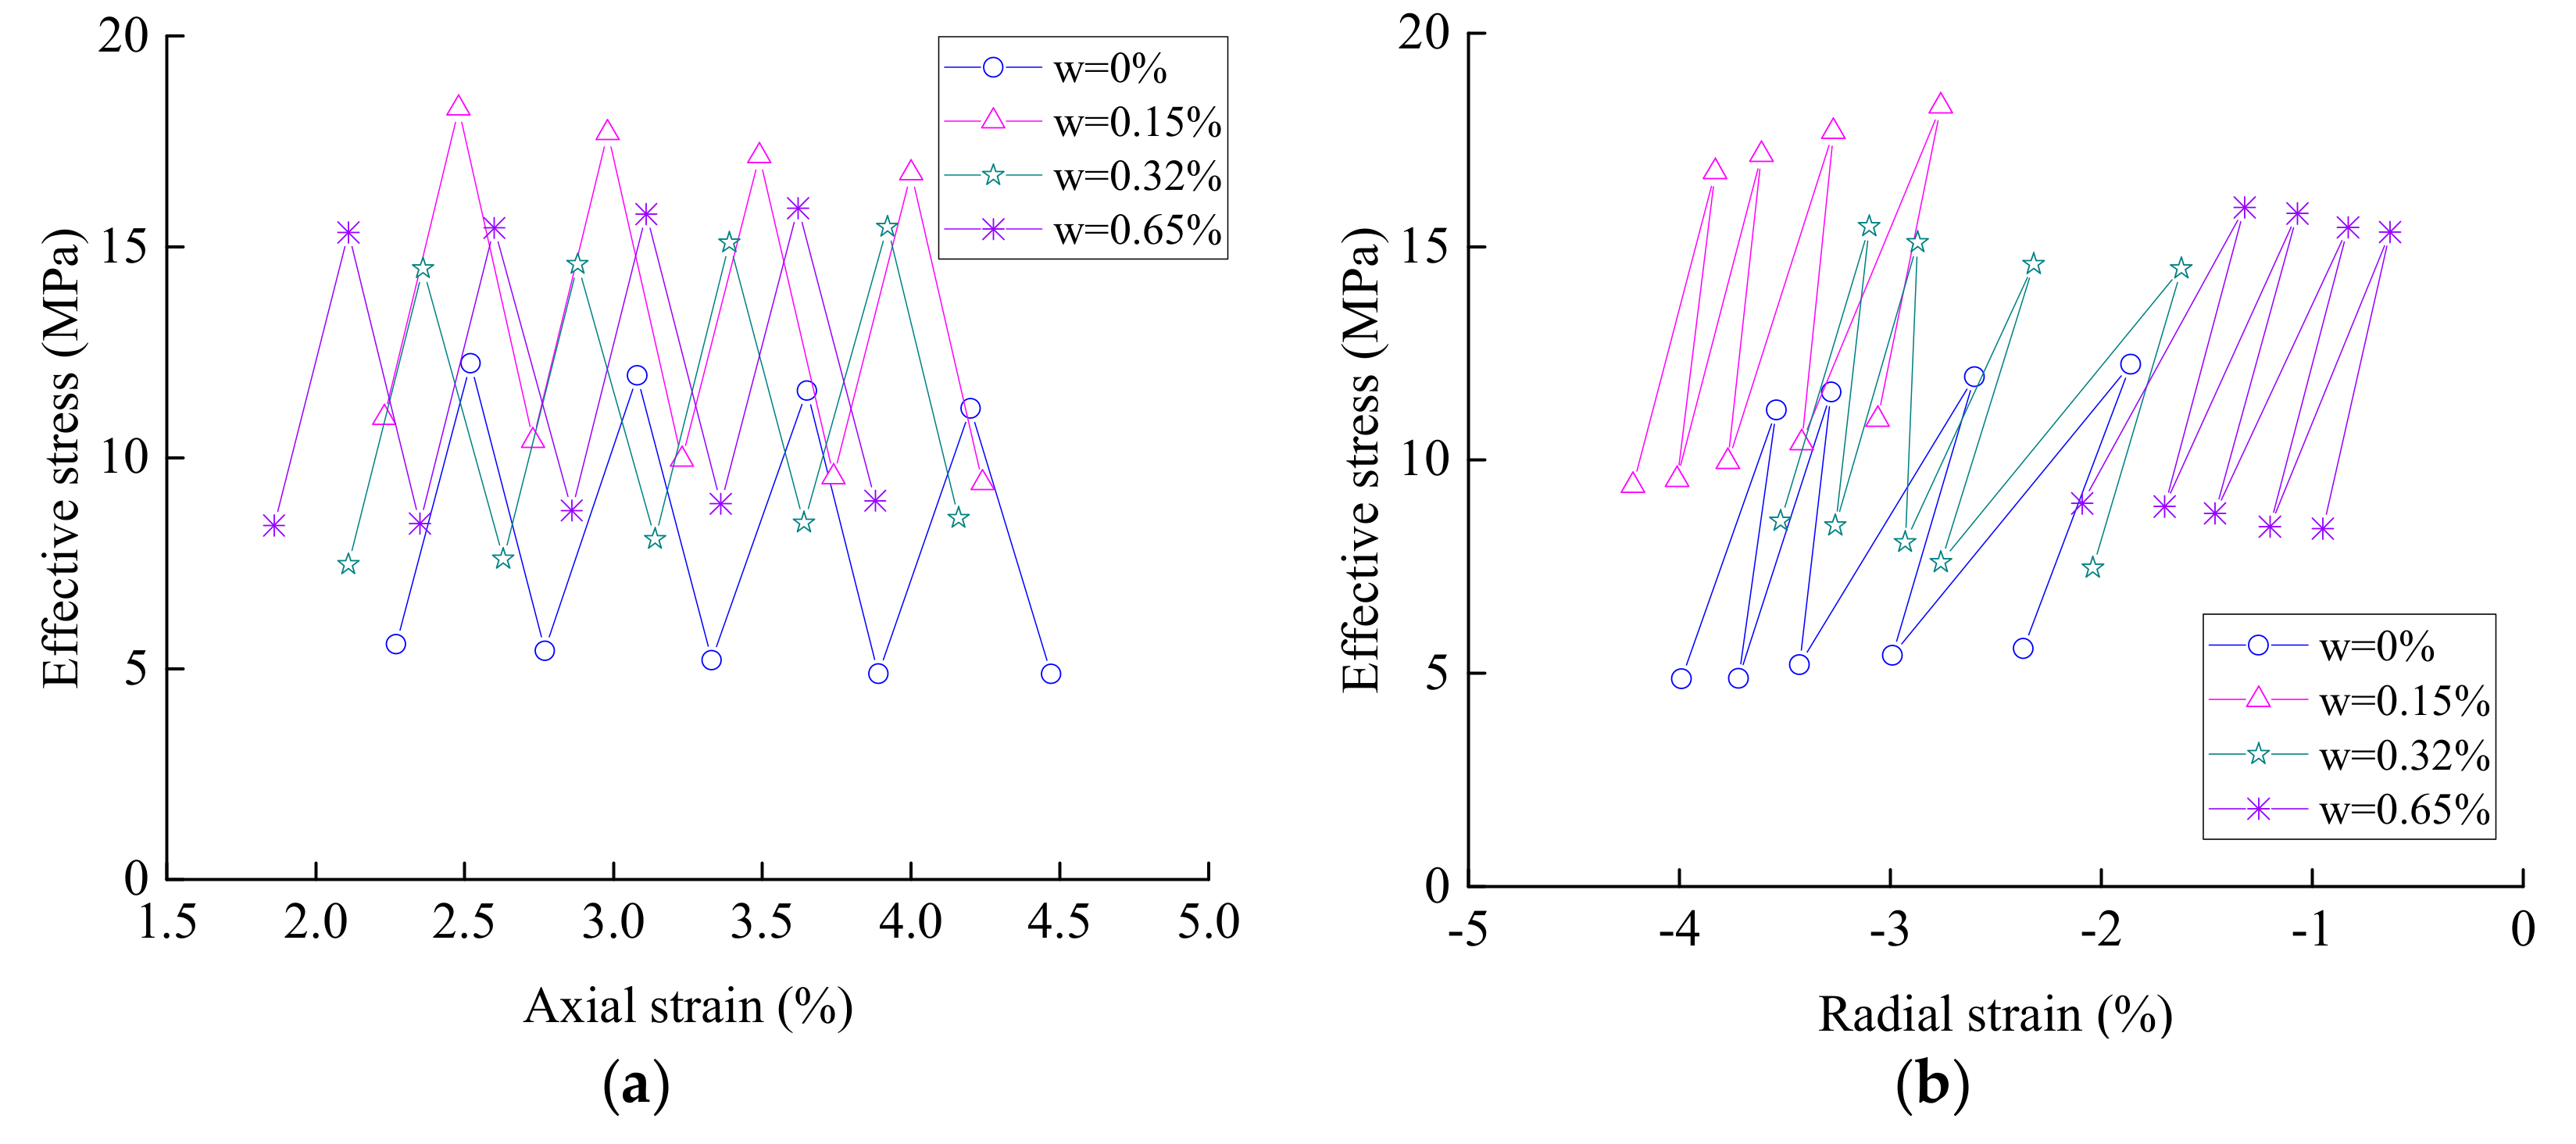
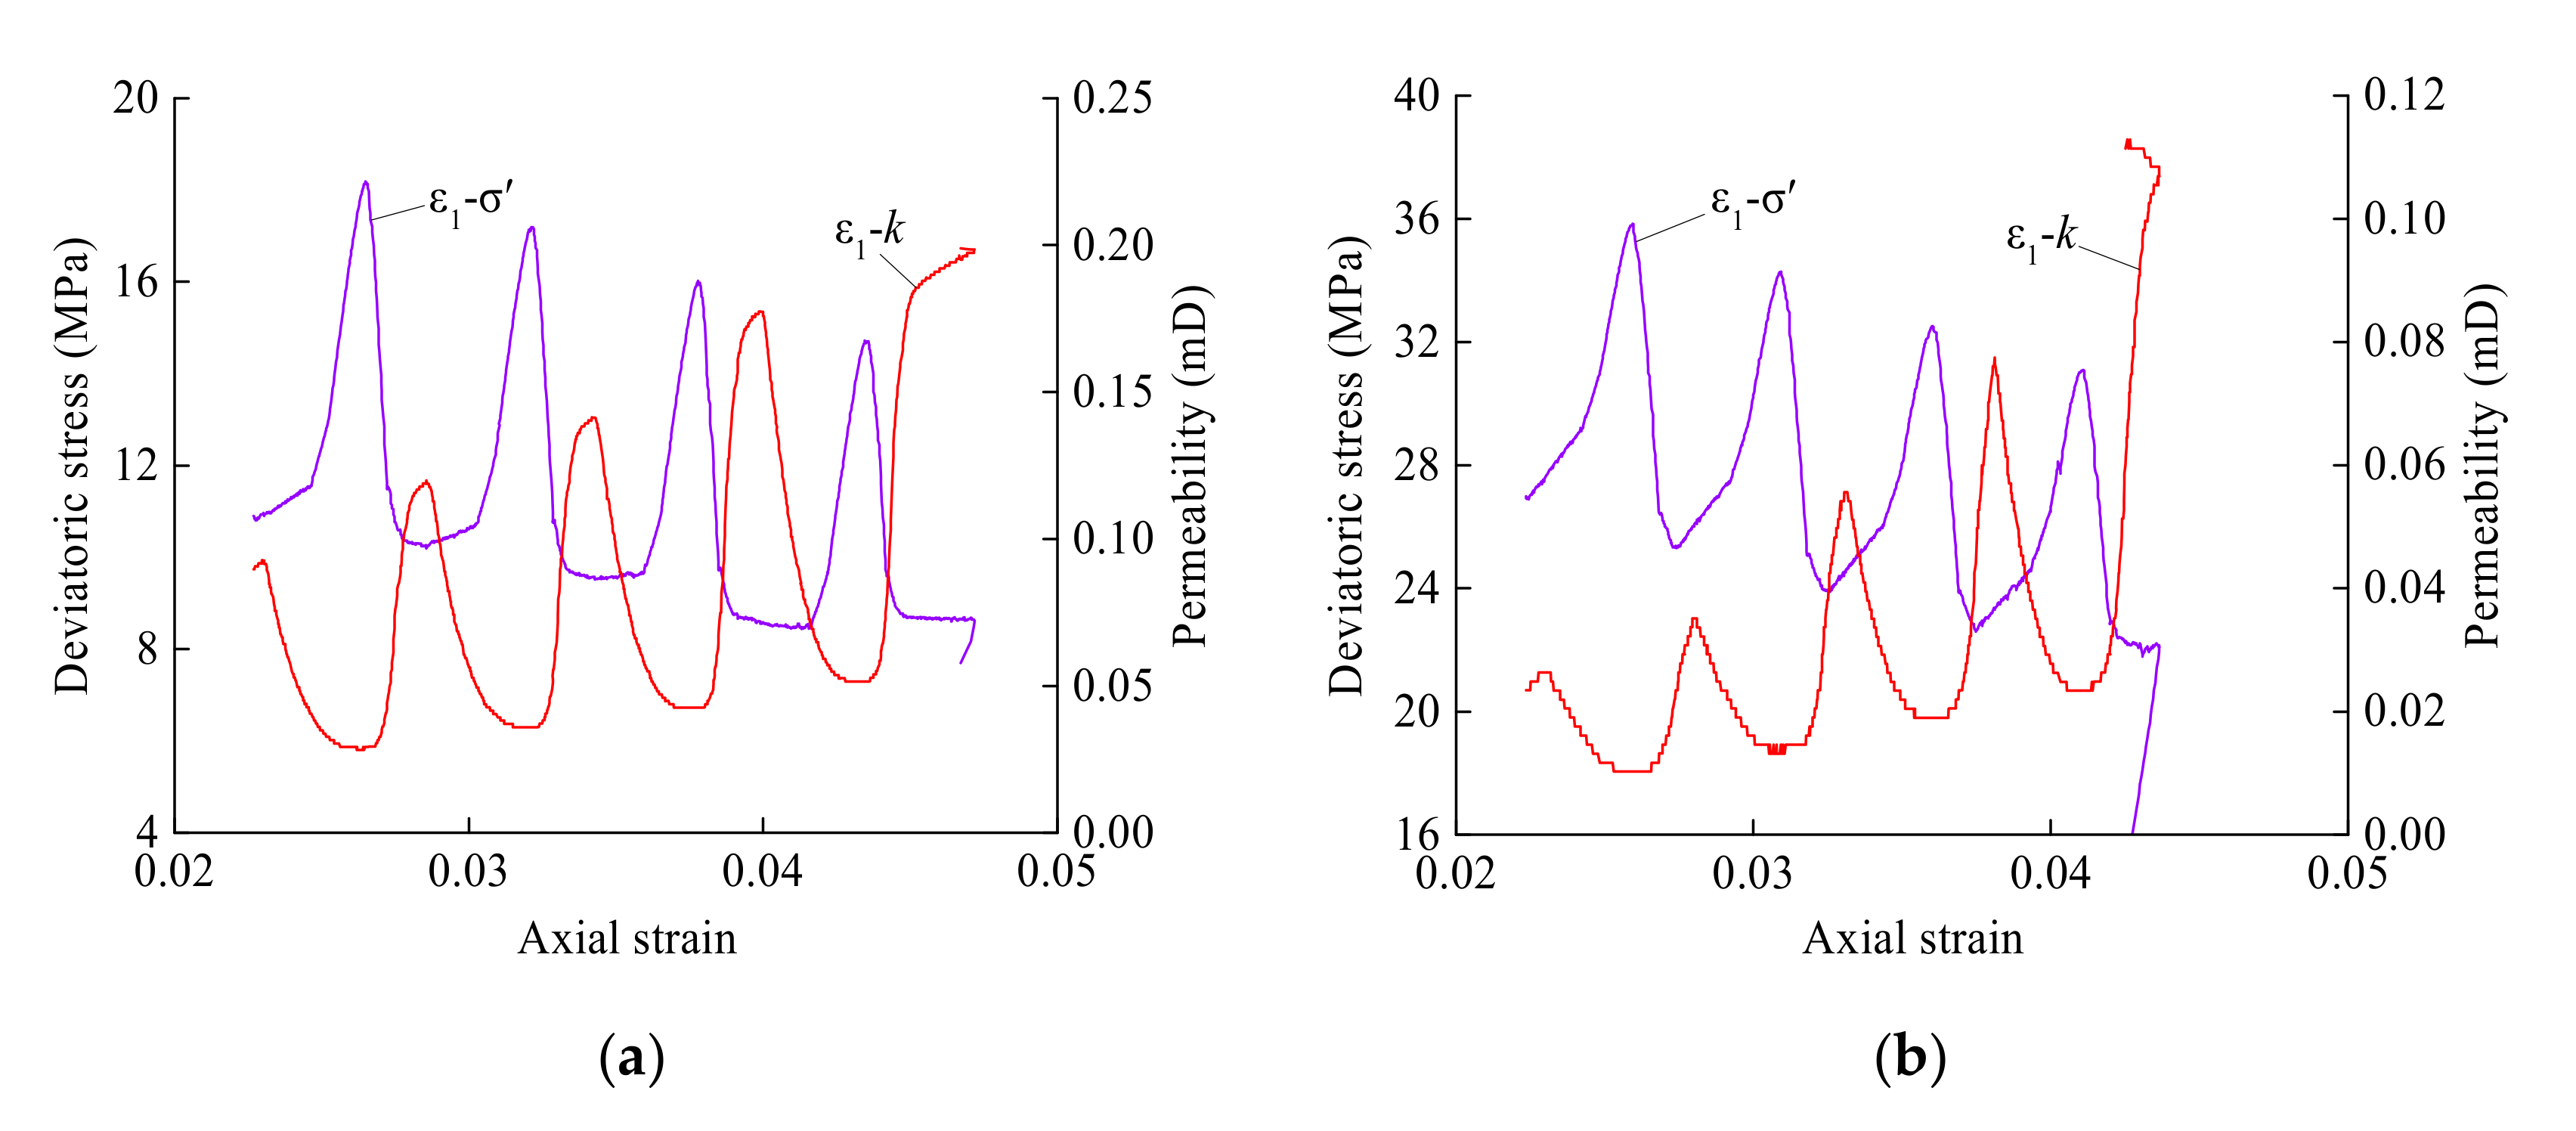
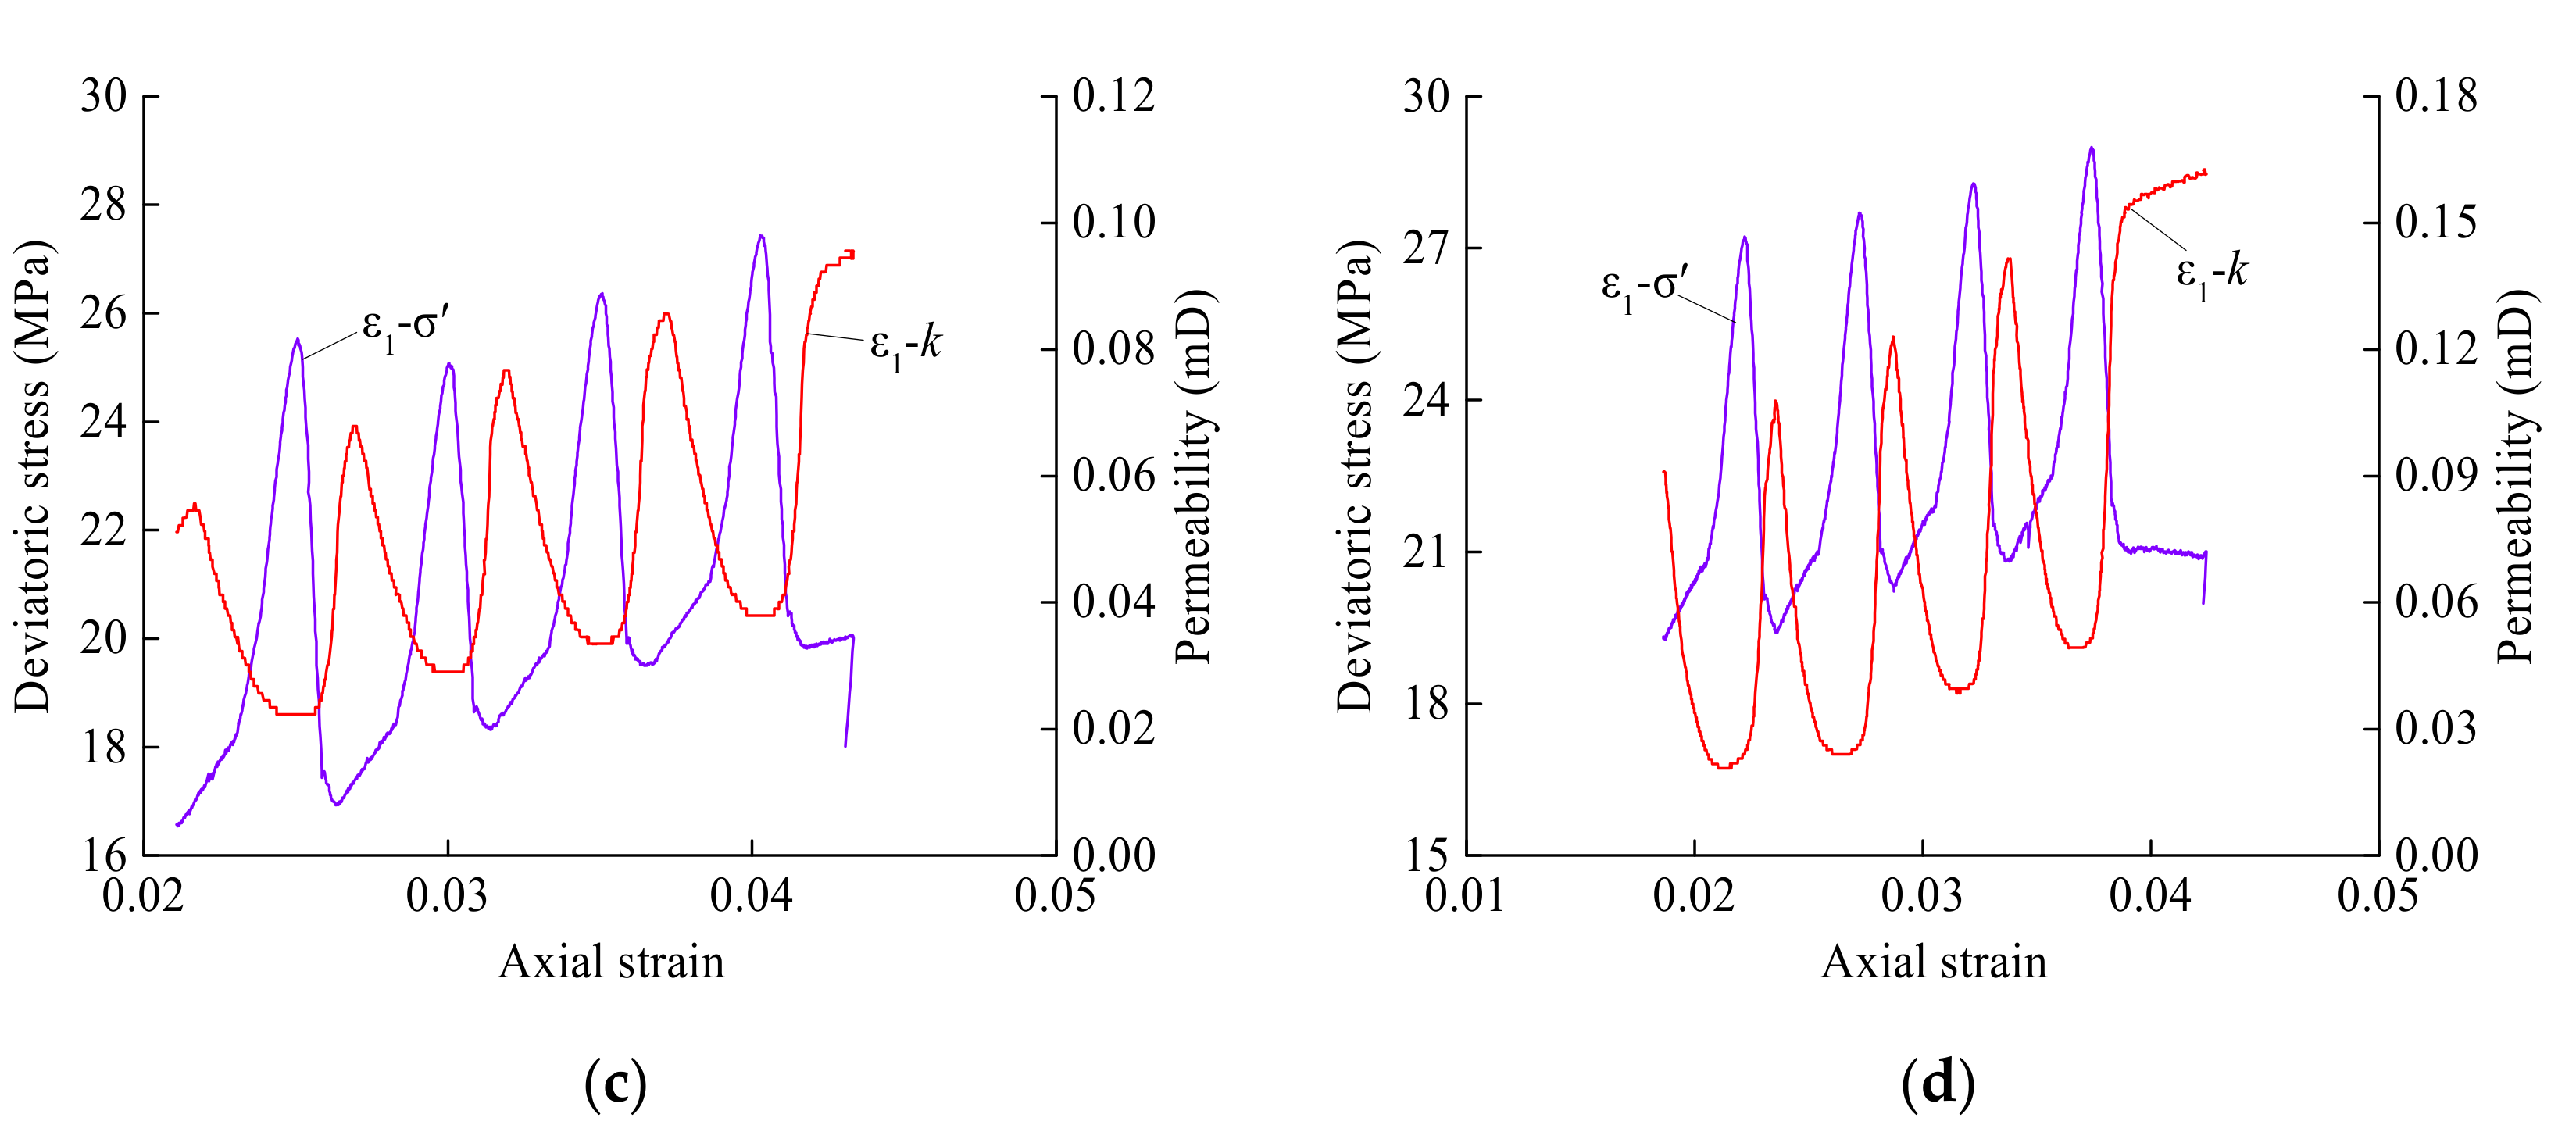
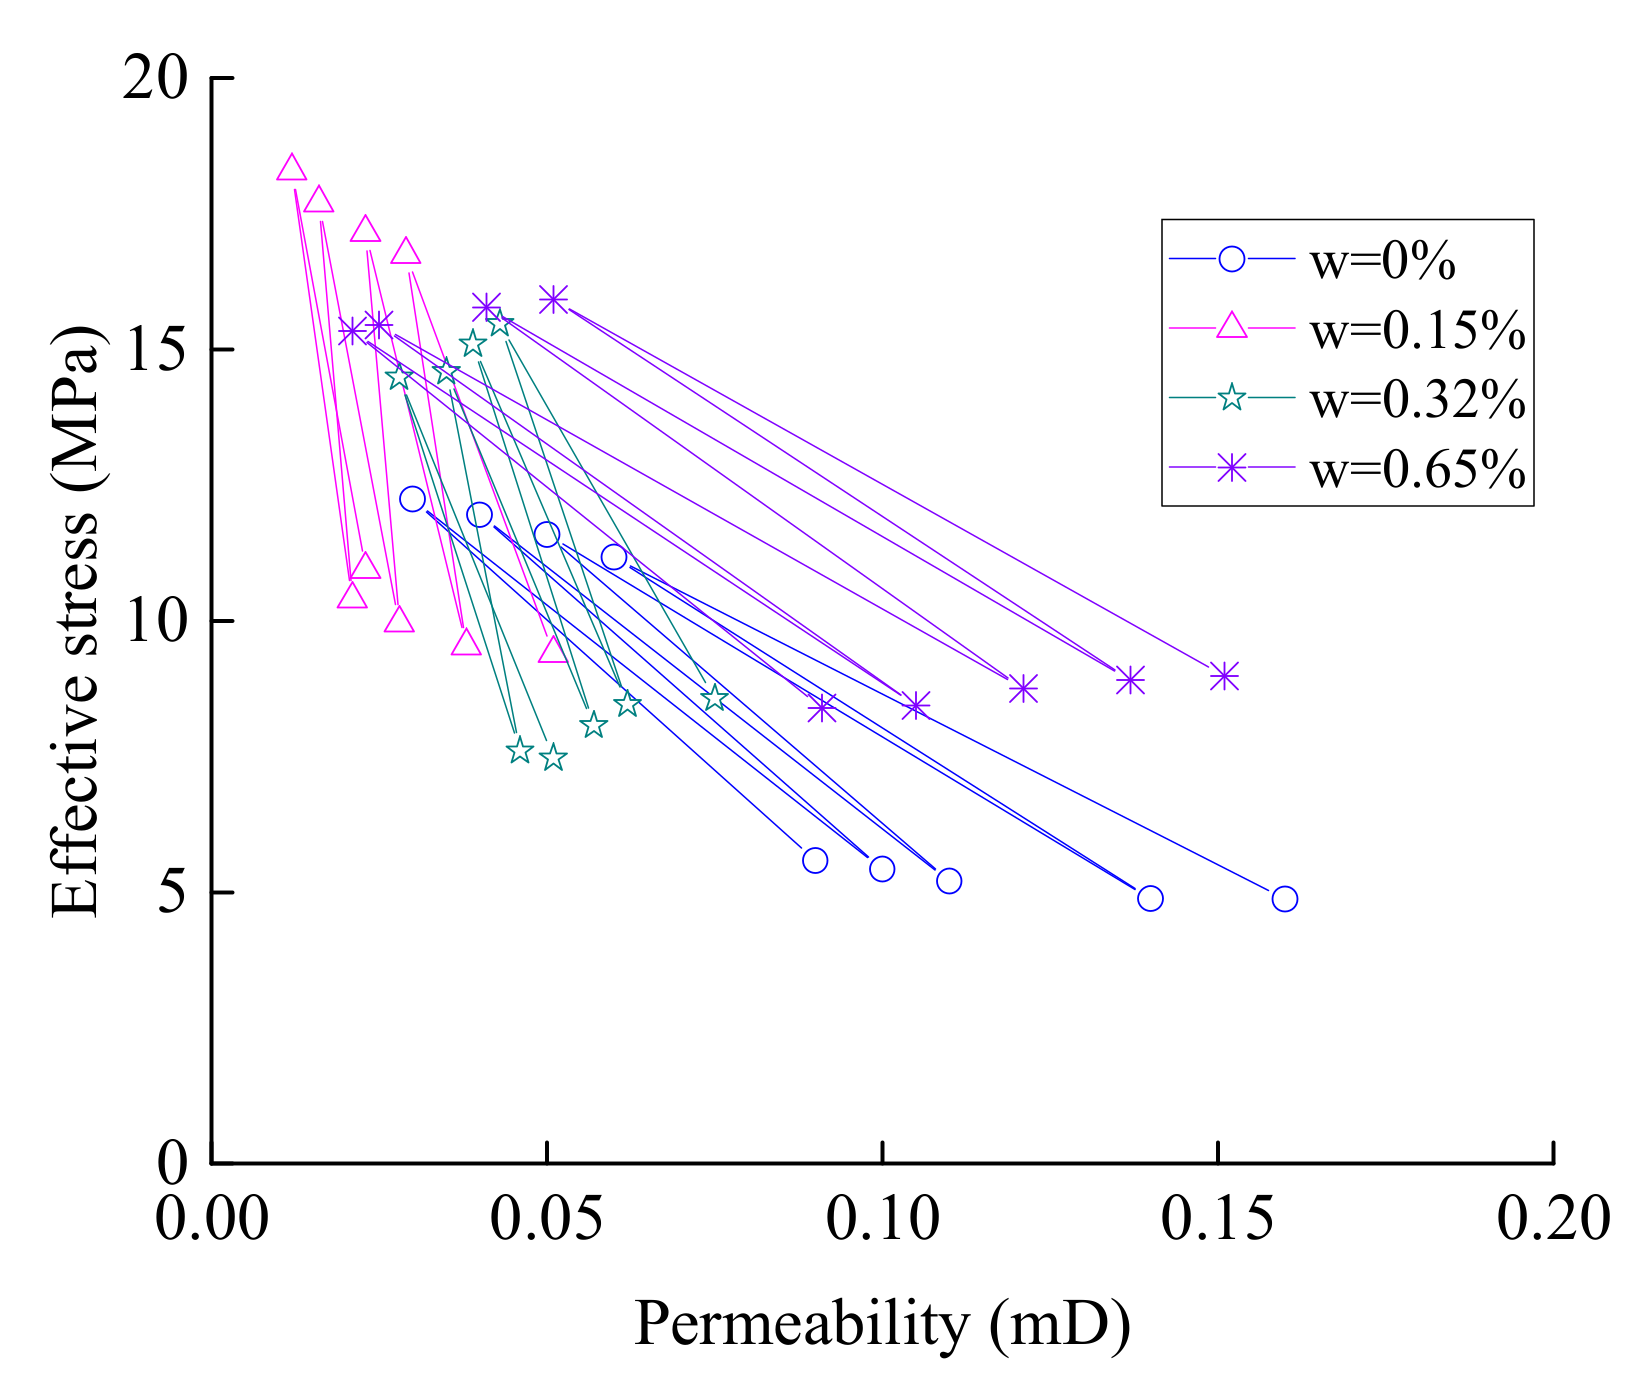
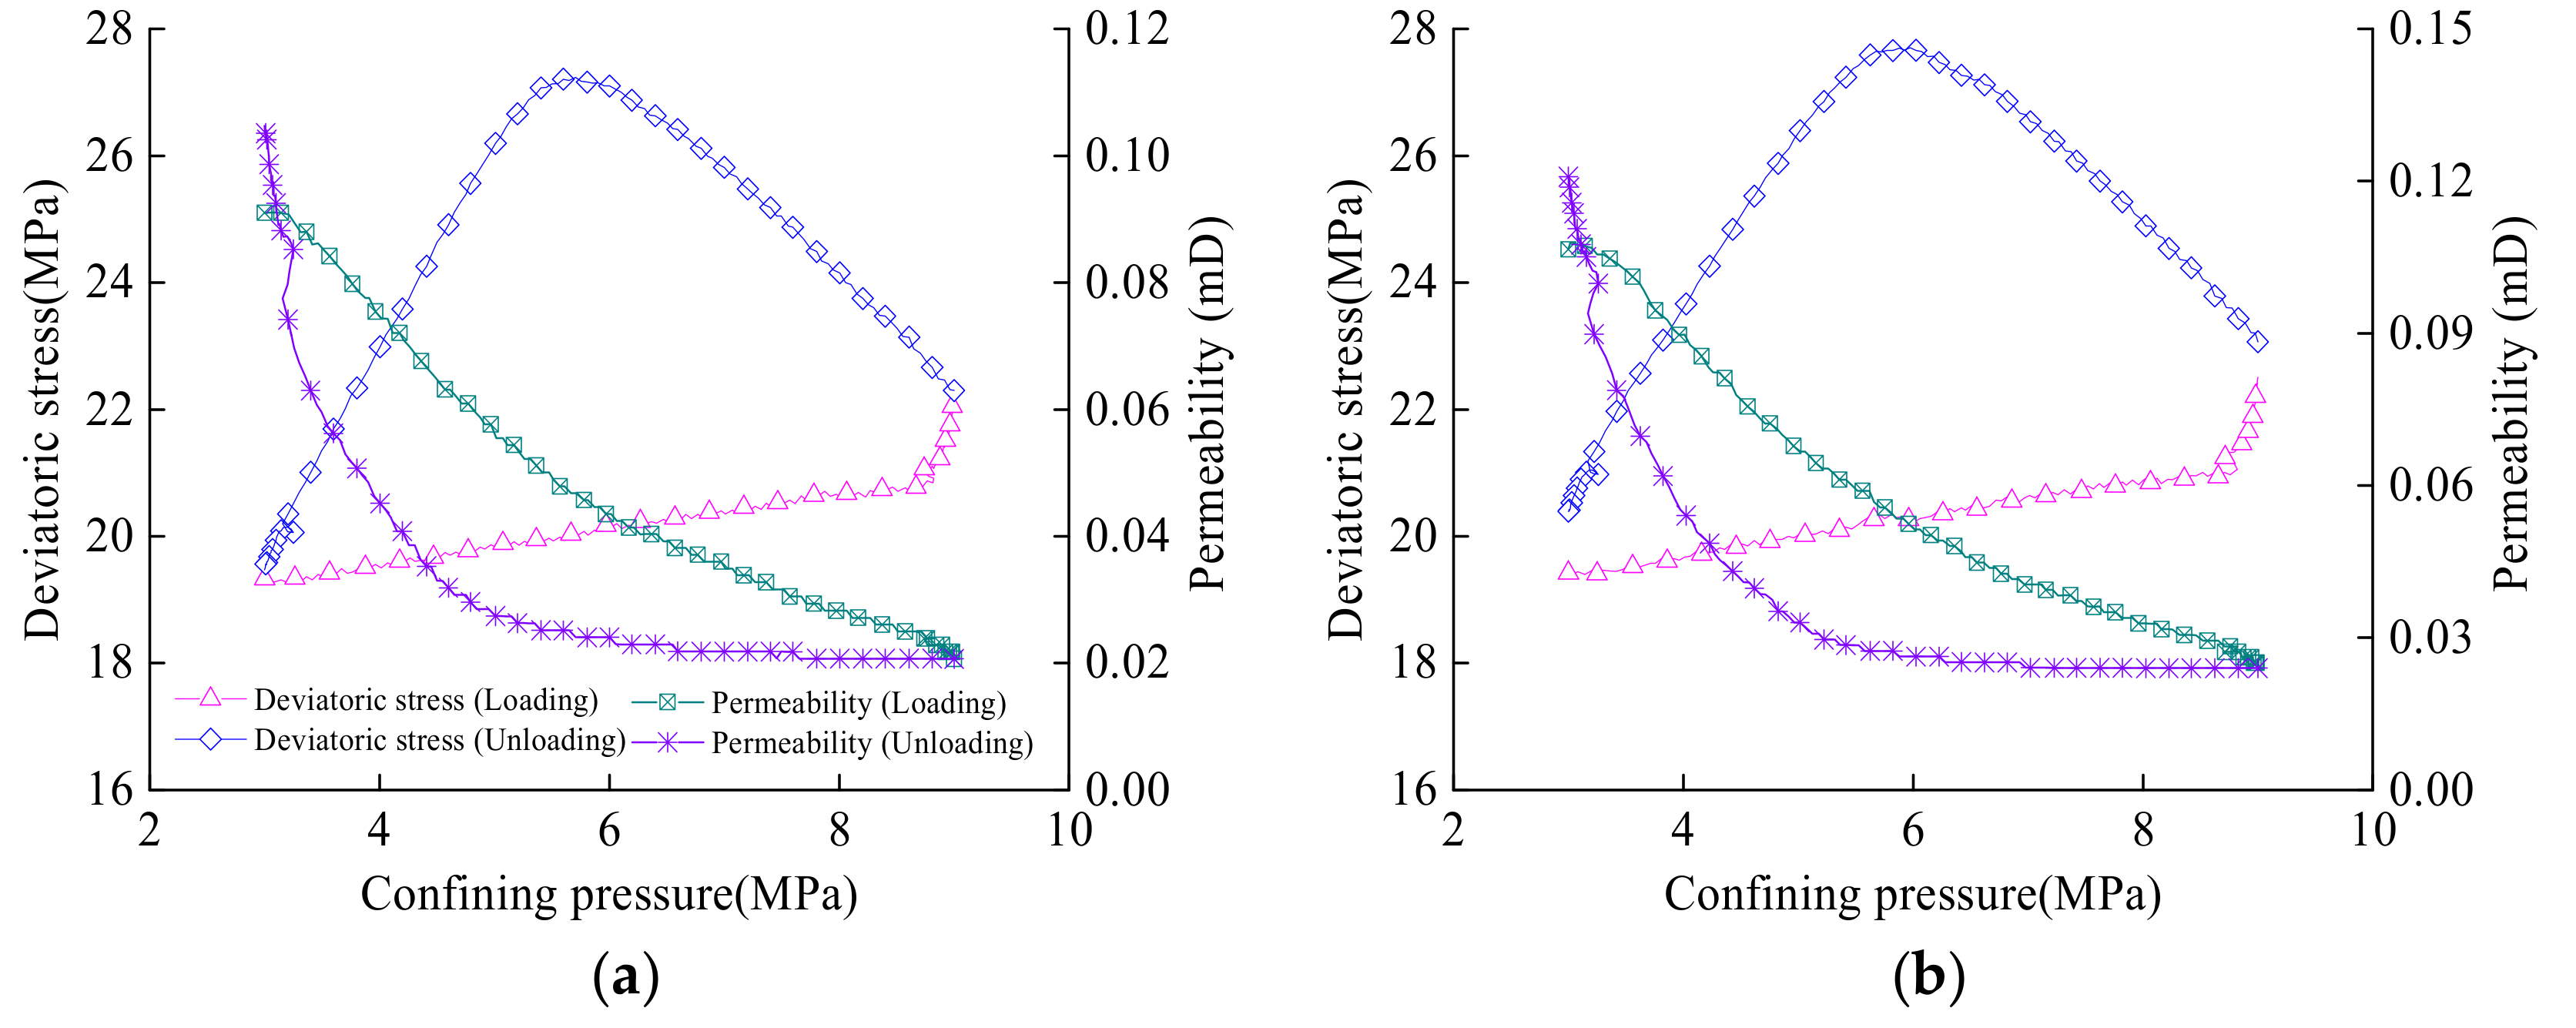
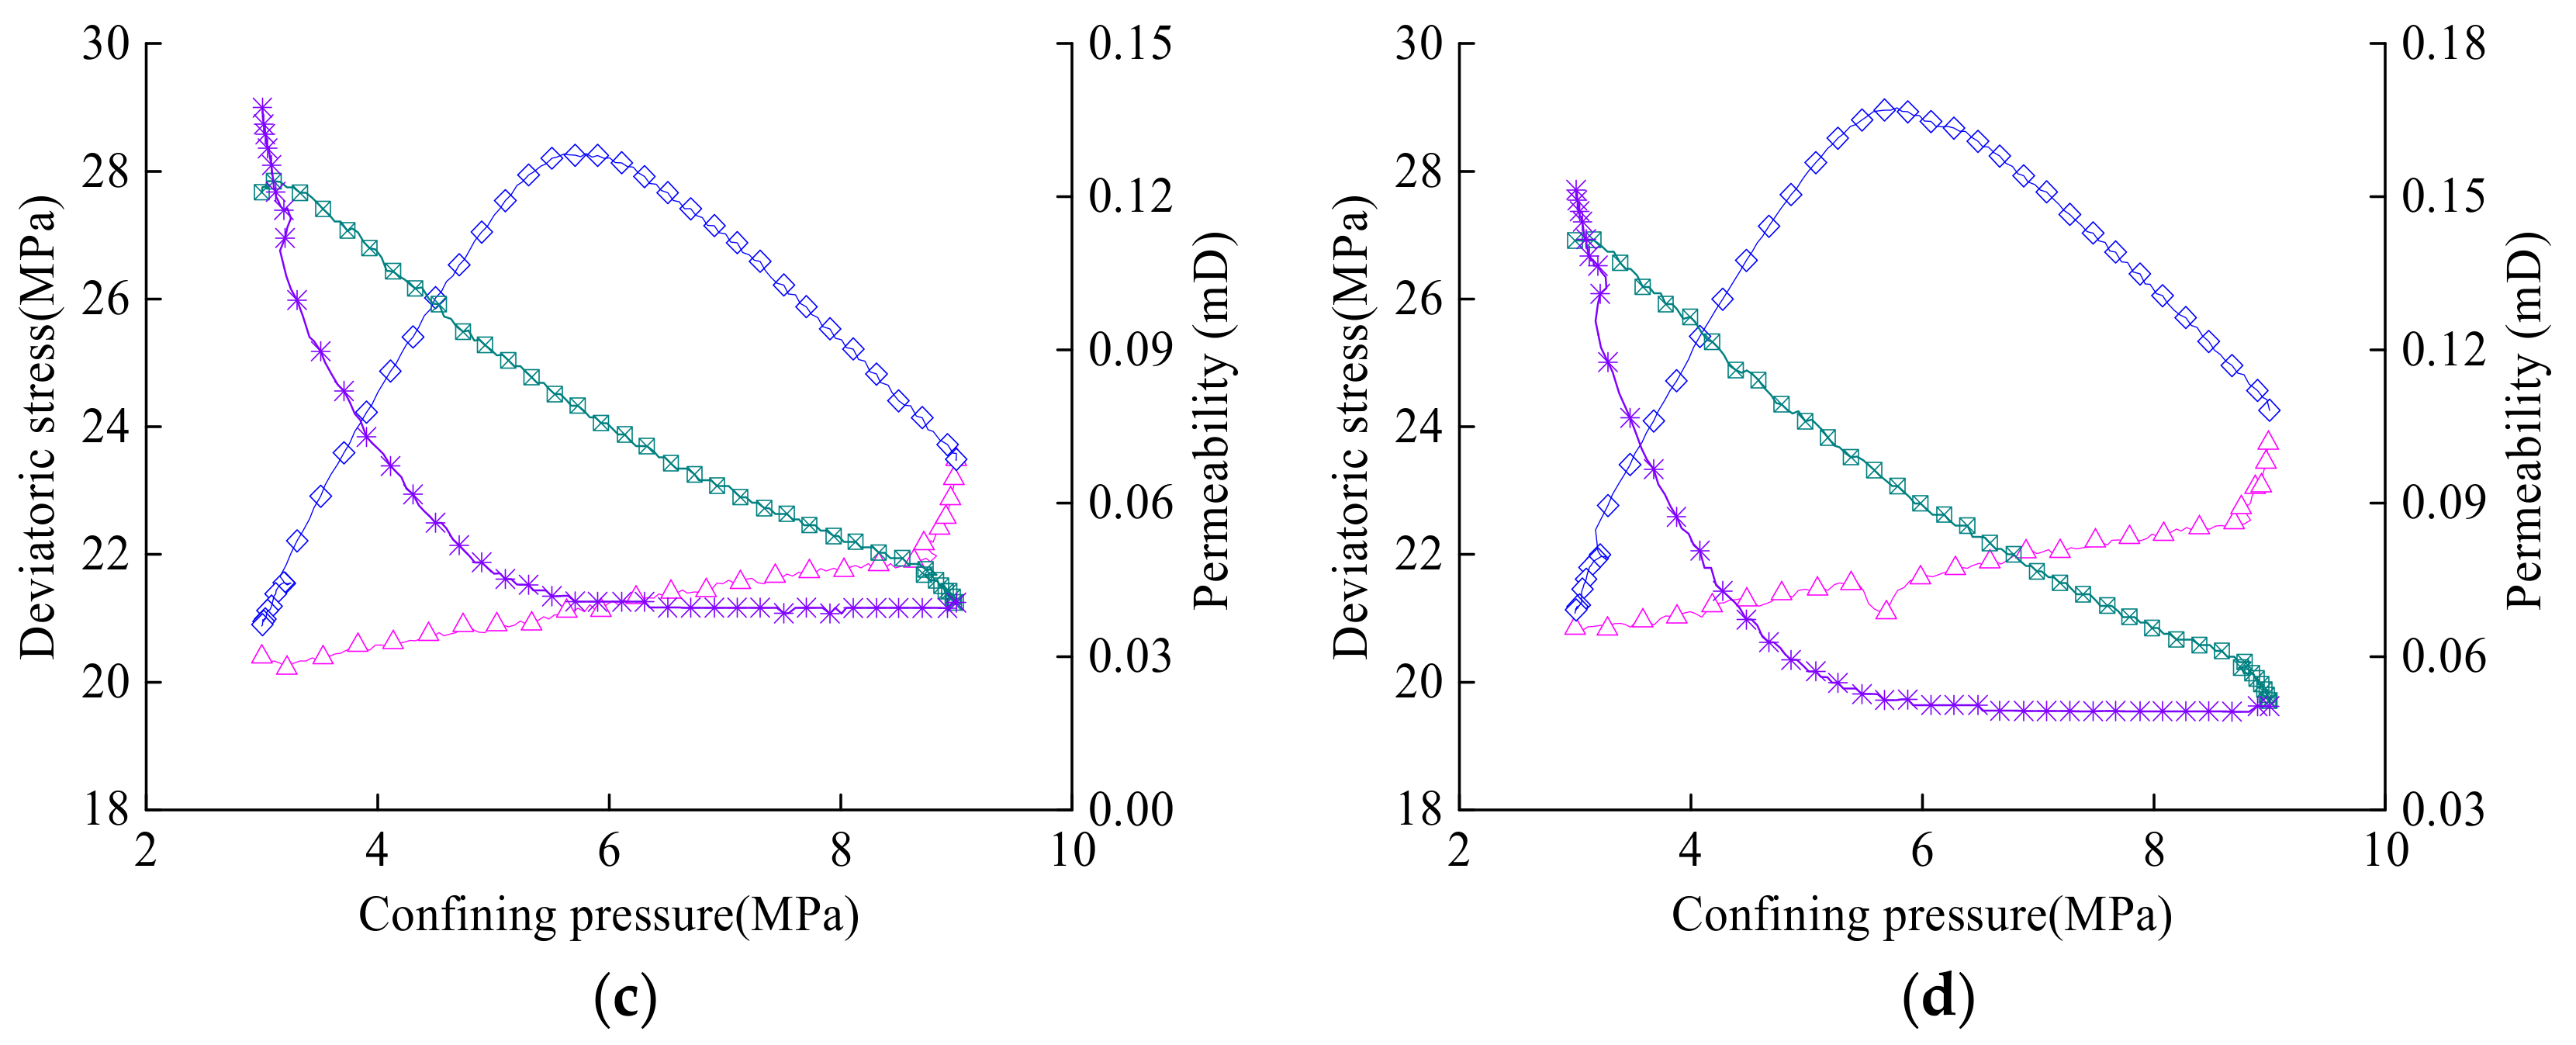
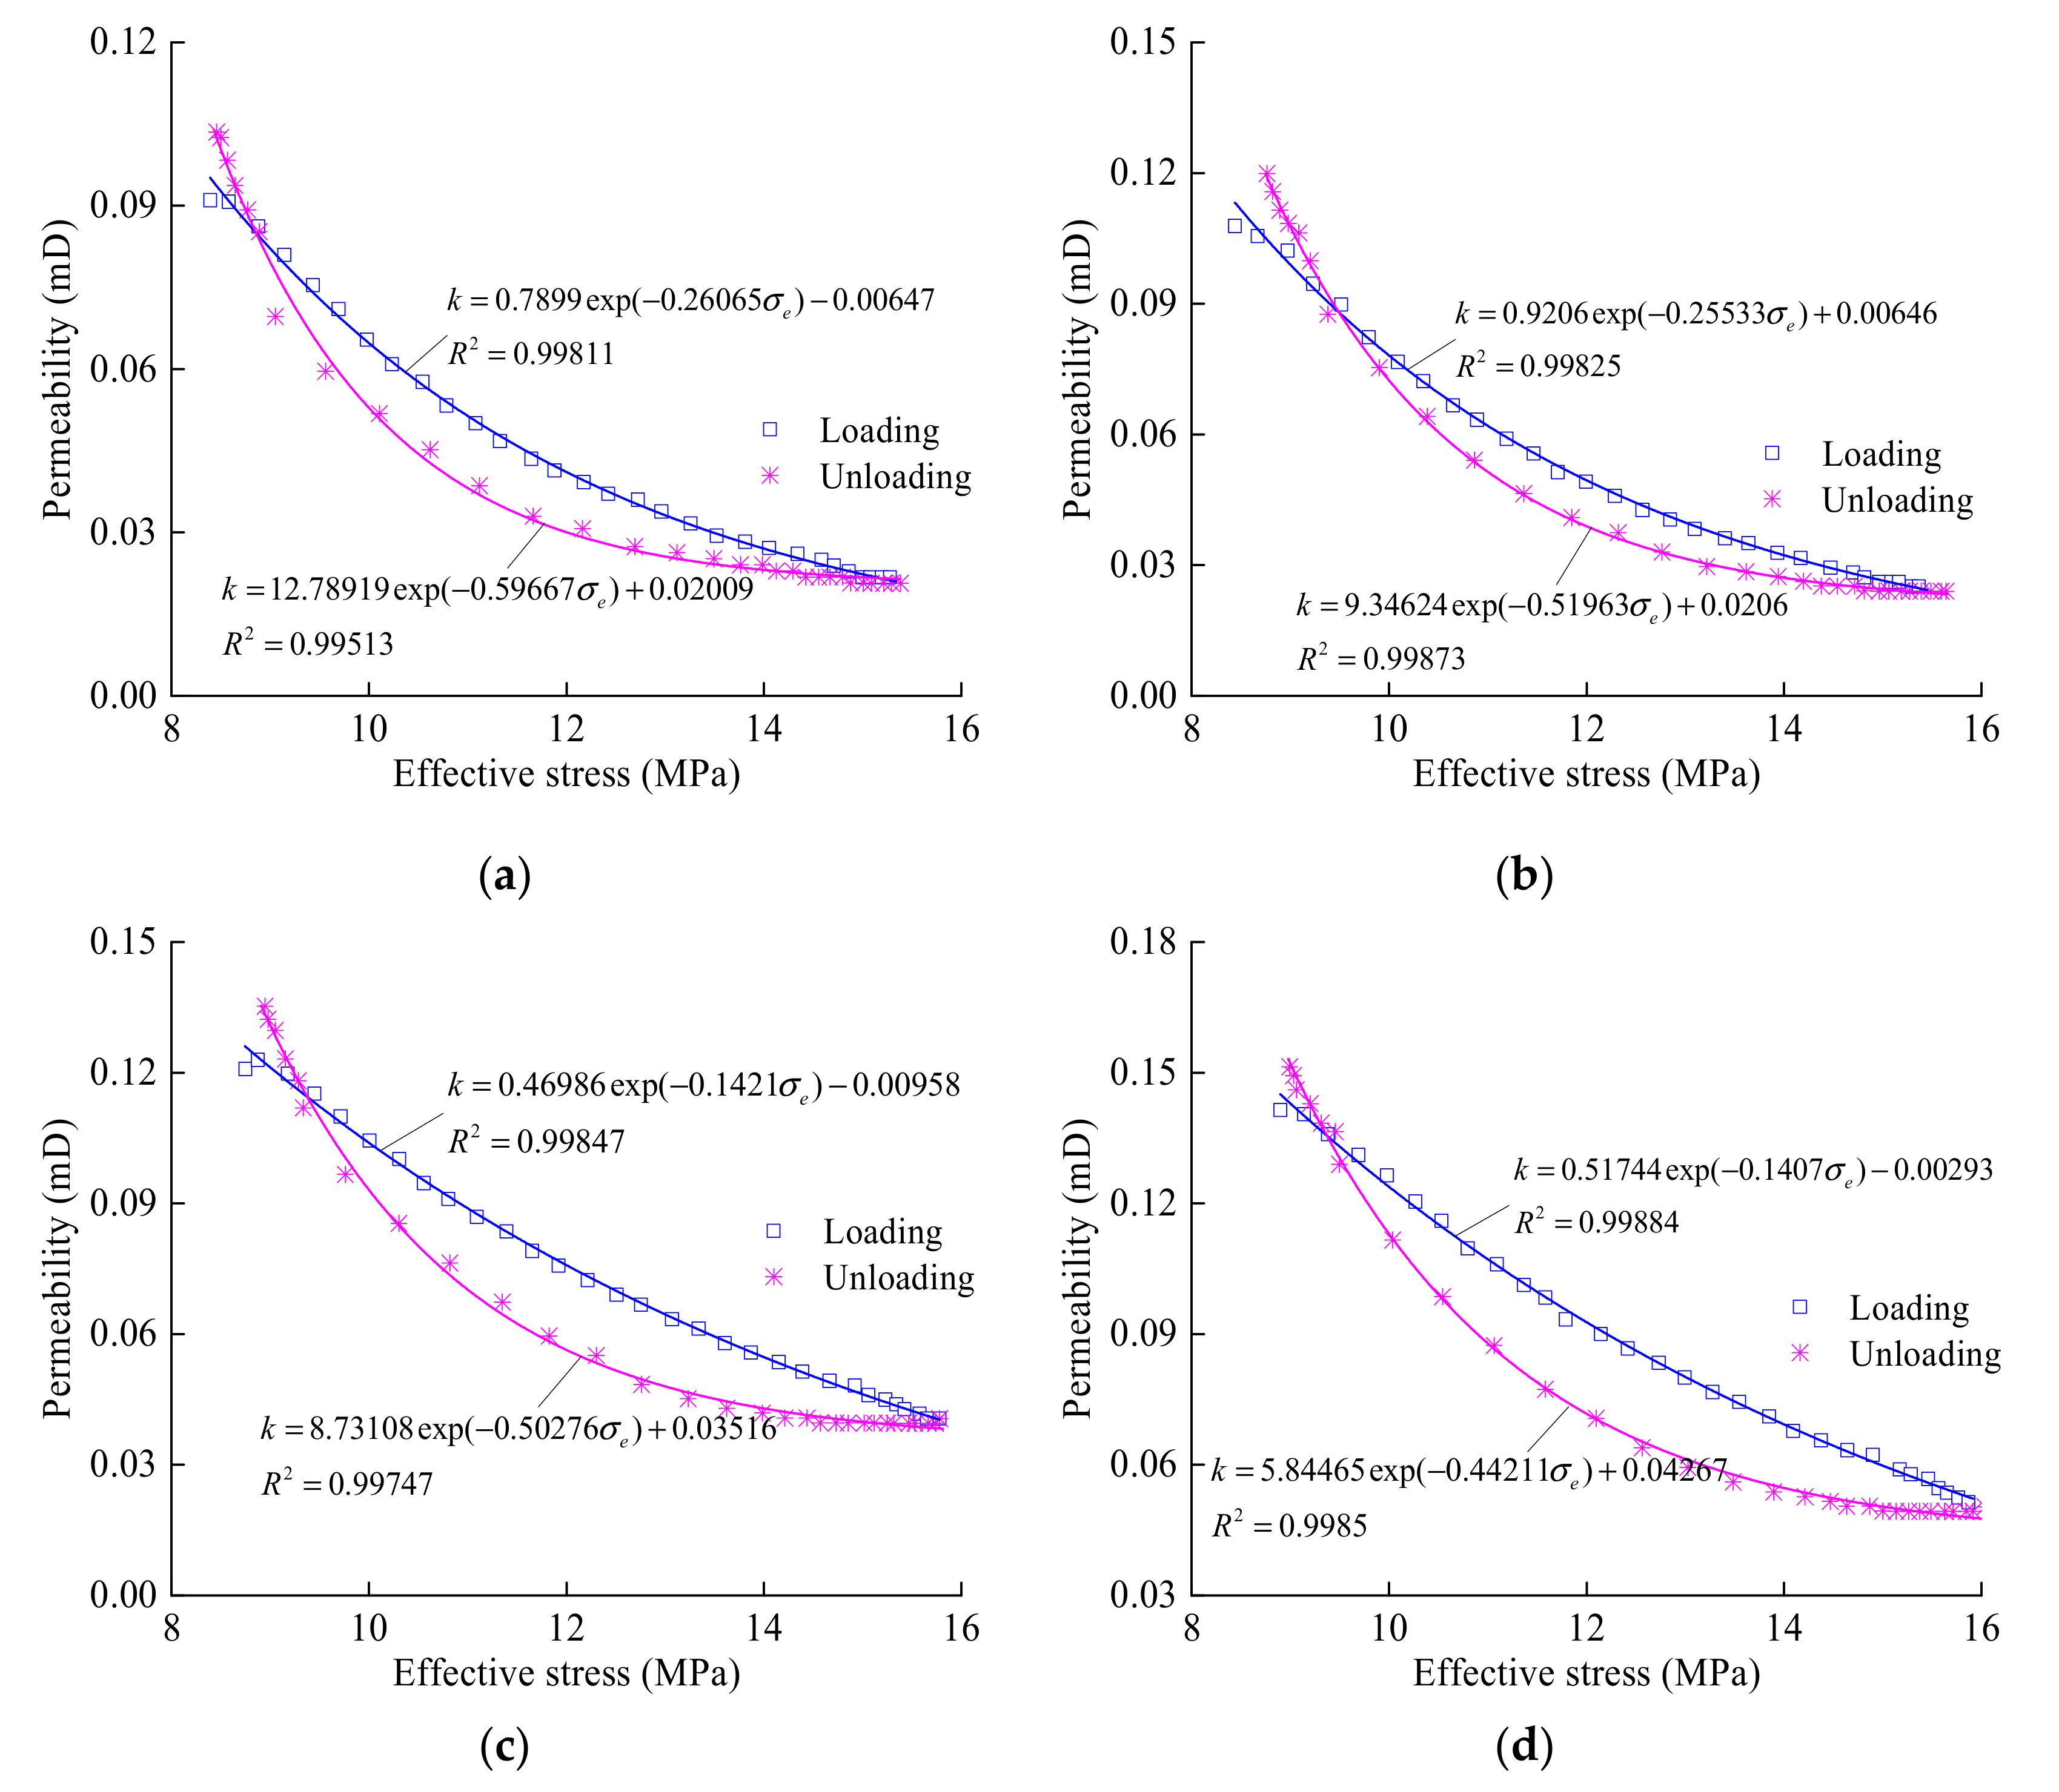
3.3. Analysis of the Permeability Properties during Post-Peak Loading and Unloading
4. Discussion
5. Conclusions
Author Contributions
Funding
Acknowledgments
Conflicts of Interest
References
- Jin, H. Experiment and mechanism analysis of the developing process of coal and gas outburst. J. China Coal Soc. 2012, 37, 98–103. [Google Scholar]
- Yan, J.W.; Zhang, X.B.; Zhang, Z.M. Research on geological control mechanism of coal-gas outburst. J. China Coal Soc. 2013, 38, 1174–1178. [Google Scholar]
- Ye, Z.W.; Zhang, L.; Hao, D.Y.; Zhang, C.; Wang, C. Experimental study on the response characteristics of coal permeability to pore pressure under loading and unloading conditions. J. Geophys. Eng. 2017, 14, 1020–1031. [Google Scholar] [CrossRef]
- Wang, L.L.; Jiang, B.; Wang, J.L.; Wang, J.Y.; Qu, Z.H. Effects of in-situ stress and joint on permeability of the coal bed in Linfen block, southeastern Ordos Basin, China. Russ. Geol. Geophys. 2018, 59, 299–312. [Google Scholar] [CrossRef]
- Ju, Y.; Zhang, Q.G.; Zheng, J.T.; Wang, J.G.; Chang, C.; Gao, F. Experimental study on CH4 permeability and its dependence on interior fracture networks of fractured coal under different excavation stress paths. Fuel 2017, 202, 483–493. [Google Scholar] [CrossRef]
- Xue, Y.; Dang, F.N.; Cao, Z.Z.; Du, F.; Ren, J.; Chang, X.; Gao, F. Deformation, Permeability and Acoustic Emission Characteristics of Coal Masses under Mining-Induced Stress Paths. Energies 2018, 11, 2233. [Google Scholar] [CrossRef]
- Wang, K.; Du, F.; Wang, G. Investigation of gas pressure and temperature effects on the permeability and steady-state time of chinese anthracite coal: An experimental study. J. Nat. Gas Sci. Eng. 2017, 40, 179–188. [Google Scholar] [CrossRef]
- Li, B.B.; Yang, K.; Li, J.H.; Ren, C.H.; Xu, J.; Zuo, Y.J.; Zhang, M. Experimental study on the adsorption and permeability characteristics of coal under the coupling of stress and temperature. J. China Coal Soc. 2018, 43, 2857–2865. [Google Scholar]
- Li, B.B.; Yang, K.; Xu, J.; Zhang, M.; Li, X.J. Experimental study on permeability characteristics and adsorption swelling of coal considering temperature effect. J. China Coal Soc. 2018, 43, 1761–1768. [Google Scholar]
- Zhang, L.L.; Li, Q.; Zhang, Q.; Ren, Y.J. Study on pore damage and permeability evolution properties of coal rock caused by liquid nitrogen soaking. Chin. J. Rock Mech. Eng. 2018, 37, 3938–3946. [Google Scholar]
- Yang, Z.Z.; Zhang, Y.P.; Jia, M.; Li, X.G.; Wei, Z.; Zhang, L. Experimental research on influence of low temperature on coal permeability. Rock Soil Mech. 2017, 38, 354–360. [Google Scholar]
- Chen, Y.L.; Li, X.L.; Li, B. Coal Anisotropic Sorption and Permeability: An Experimental Study. Processes 2018, 6, 104. [Google Scholar] [CrossRef]
- Zhang, Z.T.; Zhang, R.; Liu, J.F.; Liu, X.H.; Li, J.W. Permeability evolution of unloaded coal samples at different loading rates. Therm. Sci. 2014, 18, 1497–1504. [Google Scholar] [CrossRef]
- Zhao, H.G.; Zhang, D.M.; Liu, C.; Deng, B.Z.; Bian, G.; Li, W.P. Mechanical characteristics and permeability evolution rule of coal under loading-unloading conditions. Chin. J. Eng. 2016, 38, 1674–1680. [Google Scholar]
- Duan, M.K.; Jiang, C.B.; Yu, H.; Lu, T.Y.; Niu, B.W.; Sun, D.L. Experimental research on energy dissipation and seepage properties of coal under loading-unloading conditions at different stress levels. Rock Soil Mech. 2018, 39, 1346–1354. [Google Scholar]
- Li, Y.; Tang, D.; Xu, H.; Meng, Y.J.; Li, J.Q. Experimental research on coal permeability: The roles of effective stress and gas slippage. J. Nat. Gas Sci. Eng. 2014, 21, 481–488. [Google Scholar] [CrossRef]
- Zhang, X.M.; Zhang, D.M.; Leo, C.J.; Yin, G.Z.; Feng, D.; Liyanapathirana, D.S. Damage Evolution and Post-peak Gas Permeability of Raw Coal Under Loading and Unloading Conditions. Transp. Porous Media 2017, 117, 465–480. [Google Scholar] [CrossRef]
- Pan, Z.; Connell, L.D.; Camilleri, M.; Connelly, L. Effects of matrix moisture on gas diffusion and flow in coal. Fuel 2010, 89, 3207–3217. [Google Scholar] [CrossRef]
- Liu, Z.F.; Kang, T.H.; Lu, W.; Gao, L. Experiment on Water Injection Affected to Mechanics Features of Coal Body. Coal Sci. Technol. 2010, 38, 17–19. [Google Scholar]
- Perera, M.S.A.; Ranjith, P.G.; Peter, M. Effects of saturation medium and pressure on strength parameters valley brown coal: Carbon dioxide, water and nitrogen saturations. Energy 2011, 36, 6941–6947. [Google Scholar] [CrossRef]
- Qin, H.; Huang, G.; Wang, W.Z. Experimental study of acoustic emission characteristics of coal samples with different moisture contents in process of compression deformation and failure. Chin. J. Rock Mech. Eng. 2012, 31, 1115–1120. [Google Scholar]
- Wang, K.; Jiang, Y.F.; Xu, C. Mechanical properties and statistical damage model of coal with different moisture contents under uniaxial compression. Chin. J. Rock Mech. Eng. 2018, 37, 1017–1026. [Google Scholar]
- Wang, S.; Li, H.M.; Wang, W.; Li, D.Y. Experimental study on mechanical behavior and energy dissipation of anthracite coal in natural and forced water-saturation states under triaxial loading. Arab. J. Geosci. 2018, 11, 668. [Google Scholar] [CrossRef]
- Feng, Z.C.; Zhao, D.; Zhao, Y.S. Experimental study on impact of water ratio to adsorption of lump coal. Chin. J. Rock Mech. Eng. 2009, 28, 3291–3295. [Google Scholar]
- Wang, S.; Elsworth, D.; Liu, J. Permeability evolution in fractured coal: The roles of fracture geometry and water-content. Int. J. Coal Geol. 2011, 87, 13–25. [Google Scholar] [CrossRef]
- Yin, G.Z.; Jiang, C.B.; Xu, J.; Guo, L.S.; Peng, S.J.; Li, W.P. An Experimental Study on the Effects of Water Content on Coalbed Gas Permeability in Ground Stress Fields. Transp. Porous Media 2012, 94, 87–99. [Google Scholar] [CrossRef]
- Jiang, C.B.; Duan, M.K.; Yin, G.Z.; Wu, G.P.; Yu, H. Loading-unloading experiments of coal containing gas under the condition of different moisture contents. J. China Coal Soc. 2016, 41, 2230–2237. [Google Scholar]
- Wei, J.P.; Wei, L.; Wang, D.K. Experimental study of moisture content influences on permeability of coal containing gas. J. China Coal Soc. 2014, 39, 97–103. [Google Scholar]
- Yuan, X.; Jiang, D.Y. Experimental study of gas permeability of coal under different moisture state. J. Min. Saf. Eng. 2018, 35, 649–656. [Google Scholar]
- Xu, J.; Peng, S.J.; Yin, G.Z.; Tao, Y.Q.; Yang, H.W.; Wang, W.Z. Development and application of triaxial servo-controlled seepage equipment for thermo-fluid-solid coupling of coal containing methane. Chin. J. Rock Mech. Eng. 2010, 36, 112–117. [Google Scholar]
- Zhang, D.M.; Bai, X.; Qi, X.H.; Zhang, X.M.; Yi, L.D. Acoustic emission characteristics and in-situ stresses of bedding rock based on Kaiser effect. Chin. J. Rock Mech. Eng. 2016, 35, 87–97. [Google Scholar]
- Li, Y.J.; Huang, X.C.; Qiu, Y.P.; Chen, X. Meso-mechanical testing study of microfracturing process property of gypsum breccia under condition of water damage. Rock Soil Mech. 2009, 30, 1221–1225. [Google Scholar]


| Water Content/% | σ1 = 18.6 MPa | σ1 = 25.85 MPa | Peak Strength (σ3 = 3 MPa) | ||||||
|---|---|---|---|---|---|---|---|---|---|
| ε1/% | ε2/% | εv/% | ε1/% | ε2/% | εv/% | ε1/% | ε2/% | εv/% | |
| 0 | 0.4918 | –0.045 | 0.4011 | 0.7848 | –0.082 | 0.6211 | 1.968 | –0.505 | 0.9587 |
| 0.15 | 0.4975 | –0.048 | 0.4017 | 0.7919 | –0.086 | 0.6206 | 1.87 | –0.709 | 0.455 |
| 0.32 | 0.4983 | –0.04 | 0.4192 | 0.7903 | –0.07 | 0.6506 | 1.74 | –0.432 | 0.8757 |
| 0.65 | 0.4803 | –0.054 | 0.373 | 0.7581 | –0.097 | 0.5639 | 1.614 | –0.417 | 0.7799 |
| σ3/MPa | Water Content 0% | Water Content 0.15% | ||||||||
|---|---|---|---|---|---|---|---|---|---|---|
| σ1/MPa | σe/MPa | ε1/% | ε3/% | k/mD | σ1/MPa | σe/MPa | ε1/% | ε3/% | k/mD | |
| 3 | 13.90 | 5.58 | 2.27 | –2.37 | 0.09 | 29.99 | 10.95 | 2.23 | –3.06 | 0.023 |
| 9 | 21.86 | 12.24 | 2.52 | –1.86 | 0.03 | 40.01 | 18.29 | 2.48 | –2.76 | 0.012 |
| 3 | 13.41 | 5.42 | 2.77 | –2.99 | 0.10 | 28.35 | 10.40 | 2.73 | –3.42 | 0.021 |
| 9 | 20.99 | 11.95 | 3.08 | –2.60 | 0.04 | 38.25 | 17.70 | 2.98 | –3.27 | 0.016 |
| 3 | 12.74 | 5.20 | 3.33 | –3.43 | 0.11 | 27.04 | 9.96 | 3.23 | –3.77 | 0.028 |
| 9 | 19.93 | 11.59 | 3.65 | –3.28 | 0.05 | 36.64 | 17.16 | 3.49 | –3.61 | 0.023 |
| 3 | 11.80 | 4.88 | 3.89 | –3.72 | 0.14 | 25.78 | 9.54 | 3.74 | –4.01 | 0.038 |
| 9 | 18.66 | 11.17 | 4.20 | –3.54 | 0.06 | 35.4 | 16.75 | 4.00 | –3.83 | 0.029 |
| 3 | 11.77 | 4.87 | 4.47 | –3.99 | 0.16 | 25.34 | 9.40 | 4.24 | –4.22 | 0.051 |
| σ3/MPa | Water Content 0.32% | Water Content 0.65% | ||||||||
| σ1/MPa | σe/MPa | ε1/% | ε3/% | k/mD | σ1/MPa | σe/MPa | ε1/% | ε3/% | k/mD | |
| 3 | 19.57 | 7.47 | 2.11 | –2.04 | 0.051 | 22.33 | 8.39 | 1.86 | –0.95 | 0.091 |
| 9 | 28.61 | 14.49 | 2.36 | –1.62 | 0.028 | 31.16 | 15.34 | 2.11 | –0.63 | 0.021 |
| 3 | 19.94 | 7.60 | 2.63 | –2.76 | 0.046 | 22.47 | 8.44 | 2.35 | –1.20 | 0.105 |
| 9 | 28.93 | 14.59 | 2.88 | –2.32 | 0.035 | 31.50 | 15.45 | 2.60 | –0.83 | 0.025 |
| 3 | 21.37 | 8.07 | 3.14 | –2.93 | 0.057 | 23.39 | 8.75 | 2.86 | –1.46 | 0.121 |
| 9 | 30.45 | 15.10 | 3.39 | –2.87 | 0.039 | 32.49 | 15.78 | 3.11 | –1.07 | 0.041 |
| 3 | 22.53 | 8.46 | 3.64 | –3.26 | 0.062 | 23.88 | 8.91 | 3.36 | –1.70 | 0.137 |
| 9 | 31.56 | 15.47 | 3.92 | –3.10 | 0.043 | 32.90 | 15.92 | 3.62 | –1.32 | 0.051 |
| 3 | 22.87 | 8.57 | 4.16 | –3.52 | 0.075 | 24.08 | 8.98 | 3.88 | –2.09 | 0.151 |
© 2019 by the authors. Licensee MDPI, Basel, Switzerland. This article is an open access article distributed under the terms and conditions of the Creative Commons Attribution (CC BY) license (http://creativecommons.org/licenses/by/4.0/).
Share and Cite
Zhang, Z.; Wang, H.; Wang, L.; Zhang, D. Experimental Study on Mechanics and Permeability Properties of Water-Bearing Raw Coal Samples Under In-Situ Stress. Appl. Sci. 2019, 9, 2549. https://doi.org/10.3390/app9122549
Zhang Z, Wang H, Wang L, Zhang D. Experimental Study on Mechanics and Permeability Properties of Water-Bearing Raw Coal Samples Under In-Situ Stress. Applied Sciences. 2019; 9(12):2549. https://doi.org/10.3390/app9122549
Chicago/Turabian StyleZhang, Zuxun, Hongtu Wang, Li Wang, and Dongming Zhang. 2019. "Experimental Study on Mechanics and Permeability Properties of Water-Bearing Raw Coal Samples Under In-Situ Stress" Applied Sciences 9, no. 12: 2549. https://doi.org/10.3390/app9122549
APA StyleZhang, Z., Wang, H., Wang, L., & Zhang, D. (2019). Experimental Study on Mechanics and Permeability Properties of Water-Bearing Raw Coal Samples Under In-Situ Stress. Applied Sciences, 9(12), 2549. https://doi.org/10.3390/app9122549