Article

Investigation of Crack Propagation and Healing of Asphalt Concrete Using Digital Image Correlation

1
Faculty of Applied Engineering, University of Antwerp, 2020 Antwerp, Belgium
2
Laboratory of Biomedical Physics, University of Antwerp, 2020 Antwerp, Belgium
*
Author to whom correspondence should be addressed.
Appl. Sci. 2019, 9(12), 2459; https://doi.org/10.3390/app9122459
Submission received: 13 May 2019 / Revised: 30 May 2019 / Accepted: 12 June 2019 / Published: 16 June 2019
(This article belongs to the Special Issue Asphalt Materials)

Abstract

:
The fatigue performance and healing ability of asphalt pavements are important for mixture design, rehabilitation, and maintenance of the roads. By analyzing these parameters in an asphalt mixture, it is possible to predict the crack formation and propagation in asphalt pavements and healing of these cracks during the rest periods. The healing effect in asphalt mixtures has been observed and verified by many researchers and different methods exist to evaluate this phenomenon. However, current methods are still inadequate to fully observe and quantify the healing phenomenon in asphalt mixtures. In this study, a digital image correlation (DIC) method is used to calculate the strain map on the surface of cylindrical asphalt specimens during the indirect tensile fatigue test. This strain map is used to detect the location of crack initiations and development of the microcracks during the experiments. Next, the specimens are unloaded and the temperature of the climate chamber is increased to 60 °C for 18 h to investigate the healing phenomenon on the surface of the specimens. It is observed that the strain reduces near the microcrack areas especially at the tip of the microcracks. Furthermore, using DIC it is possible to observe the healing rate and the minimum time required to heal the microcracks on the surface of the specimens.

1. Introduction

Asphalt mixtures are the most common types of pavements used in the world. They are heterogeneous materials that consist of mineral aggregates, filler, bitumen, air voids, and possibly other additives. These components constitute a complex microstructure with viscoelastic characteristics. Asphalt mixtures suffer damages from many factors such as traffic load, temperature variations, and oxidations. The dominant mechanism of damage in asphalt mixtures at low temperature is microcrack formation, growth, and ultimately formation and propagation of macrocracks. However, once a microcrack is initiated in the specimen, it starts healing and if it is in the proper condition for a certain time it can even close completely [1]. This property is directly related to the temperature and rest time and can strongly influence the fatigue life of the specimens [2]. To explain the healing phenomenon, different healing mechanism and corresponding models have been proposed by scientists [3,4]. Healing phenomenon is an intrinsic process of the molecular diffusion that occurs along the crack surfaces and fills the discontinuities in the materials. During the healing process, asphalt molecules on faces of the microcracks randomly approach, contact, wet, and diffuse to close the microcracks. The significance of healing has been proven by multiple researchers through different laboratory tests [5]. In one experiment, the change in the stiffness of asphalt mixtures due to temperature and fatigue damage growth and healing during rest periods were evaluated using the impact resonance method. These experiments showed an increase in the dynamic modulus of the damaged specimens after a rest period. It was also proven that a higher healing temperature increases the amount of healing that occurred during the rest periods [6]. Another method to investigate the healing is through dynamic mechanical analysis performed on asphalt mortar to characterize fatigue damage and healing under strain-controlled torsional testing. These experiments illustrate the effects of microdamage healing due to rest periods and the increase of the dynamic modulus after the rest period, and consequently an increase in the fatigue life of asphalt mixtures [7]. However, damage formation and healing are not the only important factors in fatigue experiments. During fatigue experiments, reversible and non-reversible mechanisms happen at the same time. The non-reversible mechanisms are damages caused by self-heating, permanent deformation, and structural damages, and the reversible mechanisms are healing, thixotropy, and steric hardening. Currently, there are no models that can quantitatively identify the contribution of all these phenomena [4,8]. However, while investigating the mechanical recoveries of asphalt mixtures, it is important to take into account that healing is not the only influential phenomenon. Non-linearity, thixotropy, and steric hardening can also generate similar mechanical recoveries during the unloading stage.
Different methods have been suggested by researchers to quantify the healing in asphalt. Some approaches introduce parameters that provide a relative comparison of healing between mixtures and some provide a more absolute measure of healing through proposed parameters [9]. A popular method is to use Schapery’s extended nonlinear elastic-viscoelastic correspondence principle [10] to characterize both the microdamage and microdamage healing during the damage process. Using this method, some healing indices have been defined and it has been demonstrated that longer rest periods result in more healing, and consequently greater fatigue life [11]. In another study, this approach has been used in the dynamic shear rheometer tests with a specifically designed intermittent loading sequence to define a healing rate, as the rate of dissipated energy recovery per unit of rest time, to quantify the healing potential of asphalt binders. The results of that study indicate that binder type, strain level, and temperatures have an important impact on healing [12]. An alternative method to determine the healing rate of asphalt mixtures is based on the recovered dissipated creep strain energy (DCSE) per unit time. This method was used to determine the healing properties of different mixtures and determine the influential factors on their healing capacity [13]. The healing factor currently used by the Flemish road agency for mixture design was developed in 1974 [14] and is 7.1 for all mixtures. This value is outdated and can lead to mistakes in design and faster deterioration of the road construction [15]. Therefore, it is important to further investigate the healing of asphalt concrete with modern instruments. Furthermore, during the past decade, different approaches were introduced to induce the self-healing capacity of asphalt concrete. These methods include induction heating [16], microwave heating [17], and rejuvenation [18,19].
Nowadays, strain gauges and linear variable differential transformers (LVDT) are the most common measurement devices to perform mechanical tests on asphalt mixtures. These measurement devices are simple to use, but they are only able to measure the average deformation in the central region of the specimen and are not able to accurately measure the localized or non-uniform strain distributions. Furthermore, with these sensors measurement locations must be decided prior to the experiments. To solve these issues, two-dimensional digital image correlation (2D-DIC) has been introduced to conduct mechanical testing on asphalt mixtures [20,21,22]. One of the applications of this method is to investigate the crack formation and propagation in asphalt pavements [23,24]. For instance, the cracking mechanism of different asphalt mixtures during three common fracture tests: the indirect tensile (IDT) test, the semi-circular bending (SCB) test, and the three-point bending (3PB) test have been investigated using the DIC technique [25]. DIC can be useful to validate the finite element models predicting the propagation of the crack in pavements [26]. In another study, DIC has been applied for validation of hot mix asphalt mixtures (HMA) fracture mechanics model, a viscoelastic fracture mechanics-based crack growth law, which identifies the fracture energy of the mixtures as a fundamental crack growth threshold [27]. DIC has also been used to investigate the crack opening and closing behavior of asphalt concrete specimens containing iron oxide nanoparticles in double torsion tests and the effect of exposition of the specimens to an alternating magnetic field [28]. In another study, DIC was used to detect damage occurrence and to select the right time to start an inductive heating process to accomplish healing in the asphalt concrete specimens [29]. DIC was also used to investigate the healing mechanism in other materials, like concrete [30].
The purpose of this research is to provide an insight into crack propagation and healing of asphalt on its surface by measuring the strain map on the surface of a cylindrical asphalt mixture during indirect tensile fatigue tests and to propose some healing indices based on the surface strain. Therefore, a healing test, consisting of three stages, was developed. In the first stage, a cyclic load is applied for microcrack formation and propagation until the module of elasticity of the specimen reaches a certain termination value. In the second stage, the loading is stopped and the temperature is increased to initiate the healing in the sample during the rest time. In the final stage, a fatigue test similar to the test of the first stage is conducted until the module of elasticity reaches the same termination value. Images are captured during the experiment and using the DIC technique crack propagation and healing phenomenon are investigated.
The structure of this paper is as follows: In Section 2 a description of the material production and preparation, experimental setup, and different methods used in this research are given. In Section 3 the overview of the measurement results and detailed analysis of the images to investigate crack propagation and healing are summarized. The paper is finalized with some conclusions in Section 4.

2. Materials and Methods

2.1. Specimen Preparation

The specimens were manufactured in the laboratory according to EN 12697-35:2016 [31] and compacted according to EN 12697-31:2007 [32] using a Gyratory Compactor. In this research, a typical asphalt concrete mixture with a maximum aggregate size of 14 mm (AC14) was investigated. In total, three identical cylindrical specimens (S1, S2, S3) with a diameter of 100 mm and a thickness of 40 mm were made. The asphalt mixture contained 4.3% of bitumen by mass of aggregates. A common 35/50 penetration grade bitumen was used. Table 1 shows the basic properties of the used bitumen and in Table 2 the composition of the mixture is presented. Figure 1 shows the final grading curve of the mixture.
When using DIC, the surface of the specimen should be painted by some random speckles. This speckle pattern strongly influences the accuracy of the strain field measurements [33]. Therefore, to have a better accuracy in measurements on asphalt, usually, a thin white paint overprinted by a speckle pattern of black is applied on the surface, resulting in a homogeneous randomly oriented texture [34]. However, this treatment will also cover the aggregate and asphalt distribution information, which is important for local damage identification. Since the natural surface of asphalt mixture includes natural speckles due to different materials inside [35], in this research, only a random black speckle pattern was added to the already existing pattern on the surface. Using this method, the cut surface of the specimen remains visible for further analysis of the crack’s growing path according to the aggregate-binder structure of the specimen.
After the paint had dried, two stripes were glued on the specimens according to the standard to hold two LVDTs to measure the horizontal deformation during the experiments. Then the specimens were conditioned inside the climate chamber of the universal testing machine (UTM).

2.2. Experimental Setup

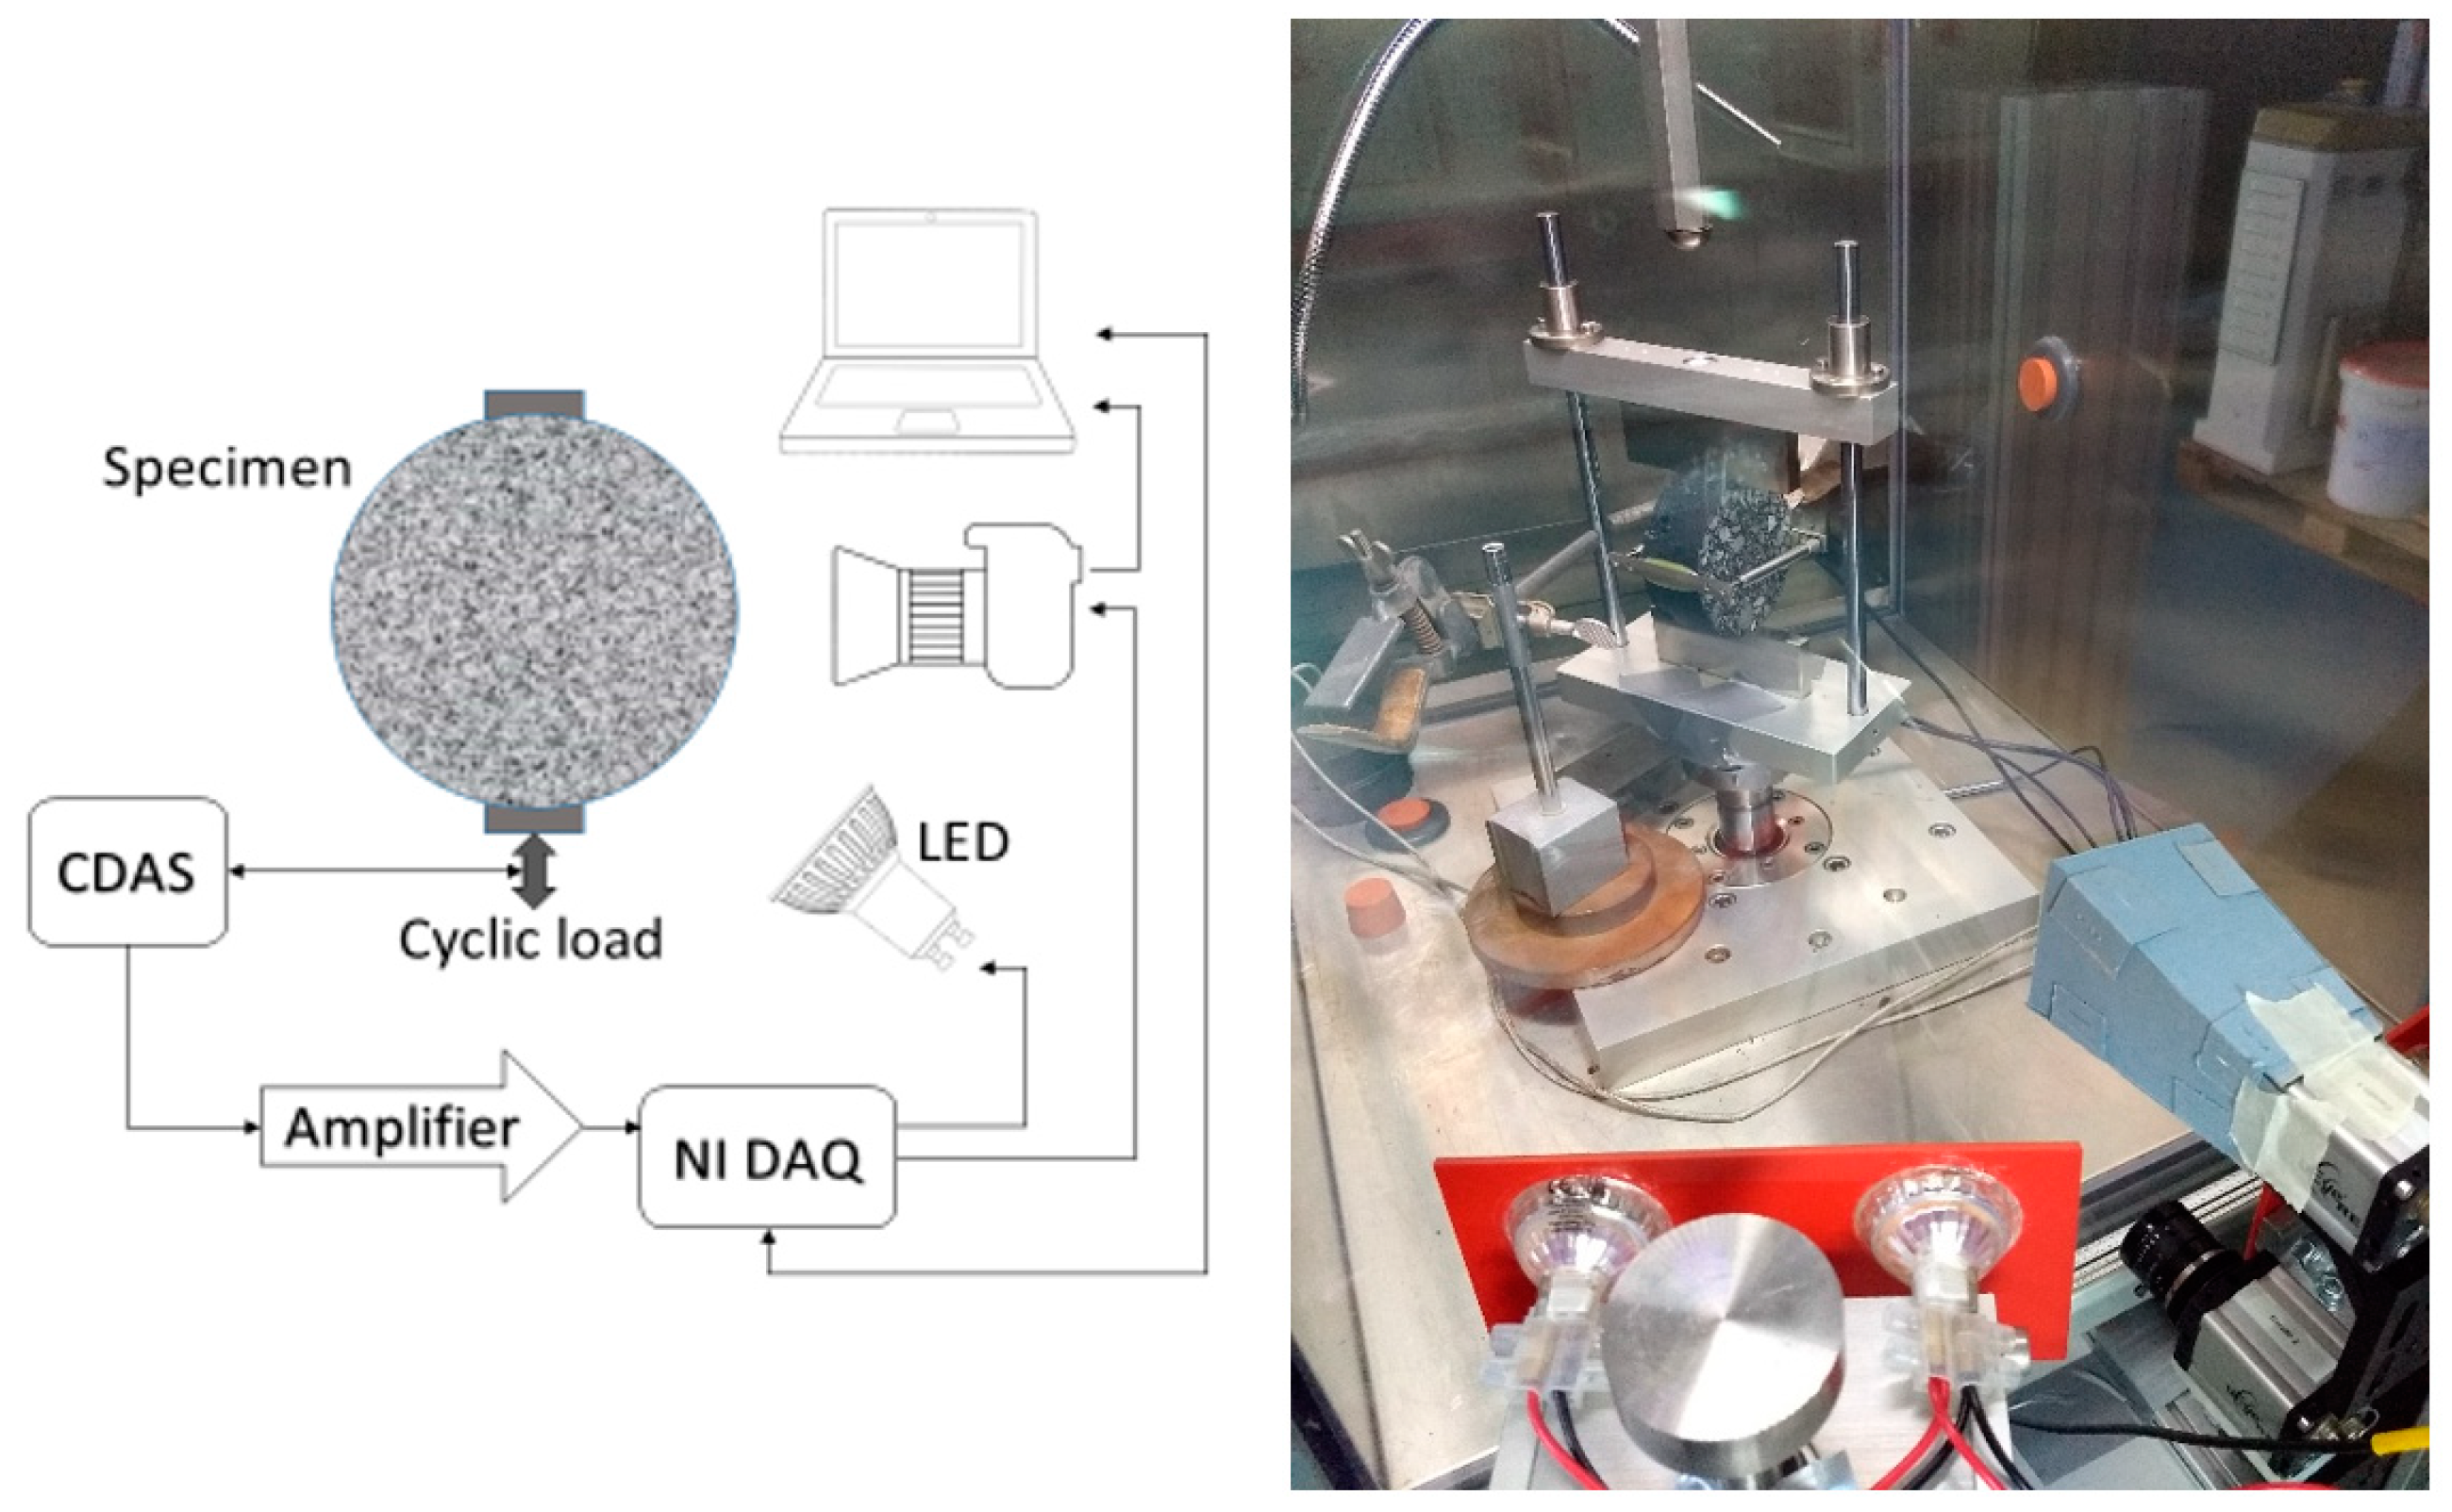
The experiments were designed based on the test described in EN 12697-24:2012 [36], Annex E (Indirect tensile fatigue test on cylindrical shape specimens) and were conducted according to Figure 2 with a Pavetest DTS-30 servo-hydraulic dynamic testing system UTM. After the samples were conditioned to the desired temperature (20 °C), fatigue tests with a 0.1 s haversine load with a maximum load of 600 kPa followed by a rest period of 0.1 s were carried out. A Poisson’s ratio of 0.35 was assumed for this asphalt mixture to determine its resilient modulus (stiffness). To stop the tests at a certain point, termination conditions based on the resilient horizontal strain and the resilient modulus were defined. According to the standard [36], the tests should stop when the resilient horizontal strain and the resilient modulus reach 200% and 50% of their initial values, respectively. However, in these experiments, to avoid having any macrocracks without the possibility of healing, the termination value was defined as reaching 140% of the initial resilient horizontal strain or 71% of the initial resilient modulus. Using these values, at the end of this step, there were no visible cracks on the surface of the specimens. In the second step, the temperature of the climate chamber was raised to 60 °C. This temperature was chosen slightly higher than the softening point of the bitumen used in this study. In previous research [1], samples were placed inside a wooden frame during the healing stage at an elevated temperature. This can help the cracks to close when the specimen expands due to the temperature increase. However, in this research, the samples were left at the exact same position ensuring that the images captured during the healing process can be compared with the previous images. After keeping the temperature of the climate chamber at 60 °C for 18 h it was lowered to 20 °C again. The samples were kept at this temperature for three hours and then the final fatigue tests were continued until the resilient modulus again reaches the termination value defined in the first step. It is expected that this approach will lead to a lower healing degree compared to Reference [1].
The camera used in this research was a GigE uEye UI223xRE-M IDS, with a resolution of 1024 × 768 and frame rate of 30 fps in full resolution. The camera was aligned with four LED spots to generate the proper lighting condition in the images (Figure 2). The load signal was measured by the Pavetest’s compact control and data acquisition system (CDAS) and amplified using an AM 502 differential amplifier and sent to the national instrument NI USB-6343 Multifunction DAQ, as a trigger signal. Using this signal, camera and LED spots were triggered at the desired cycles of the experiment to capture the images. Moreover, the camera captures images with a 20 ms delay after receiving a pulse; therefore, to have a perfect synchronization between the camera and LED spots, the camera was triggered 20 ms before the LED spots. The camera was focused manually and the exposure time was set to 18 ms in order to have the optimum brightness in the images. The camera was calibrated using an AI-08-BMB_9*9 Dantec Dynamics calibration plate and the Istra 4D software. Using the Istra 4D software it was possible to determine the projection parameter and take any distortion of the imaging or tilting of the object into account. For each specimen, first, one image was captured before the experiment starts as a reference image. Then, depending on the total duration of the fatigue tests, approximately 100 images were acquired using a logarithmic relation between the number of images and number of cycles so more images are captured at the end of the experiment when the cracks propagate faster. Finally, 1080 images were captured during the 18 h rest time (one image per minute). Figure 2 shows the experimental set up of the measurements. Only the top camera of this system is active in this research. Moreover, to avoid any unwanted light reflection on the glass of the UTM the whole system was covered with a black plastic cover.

2.3. Healing

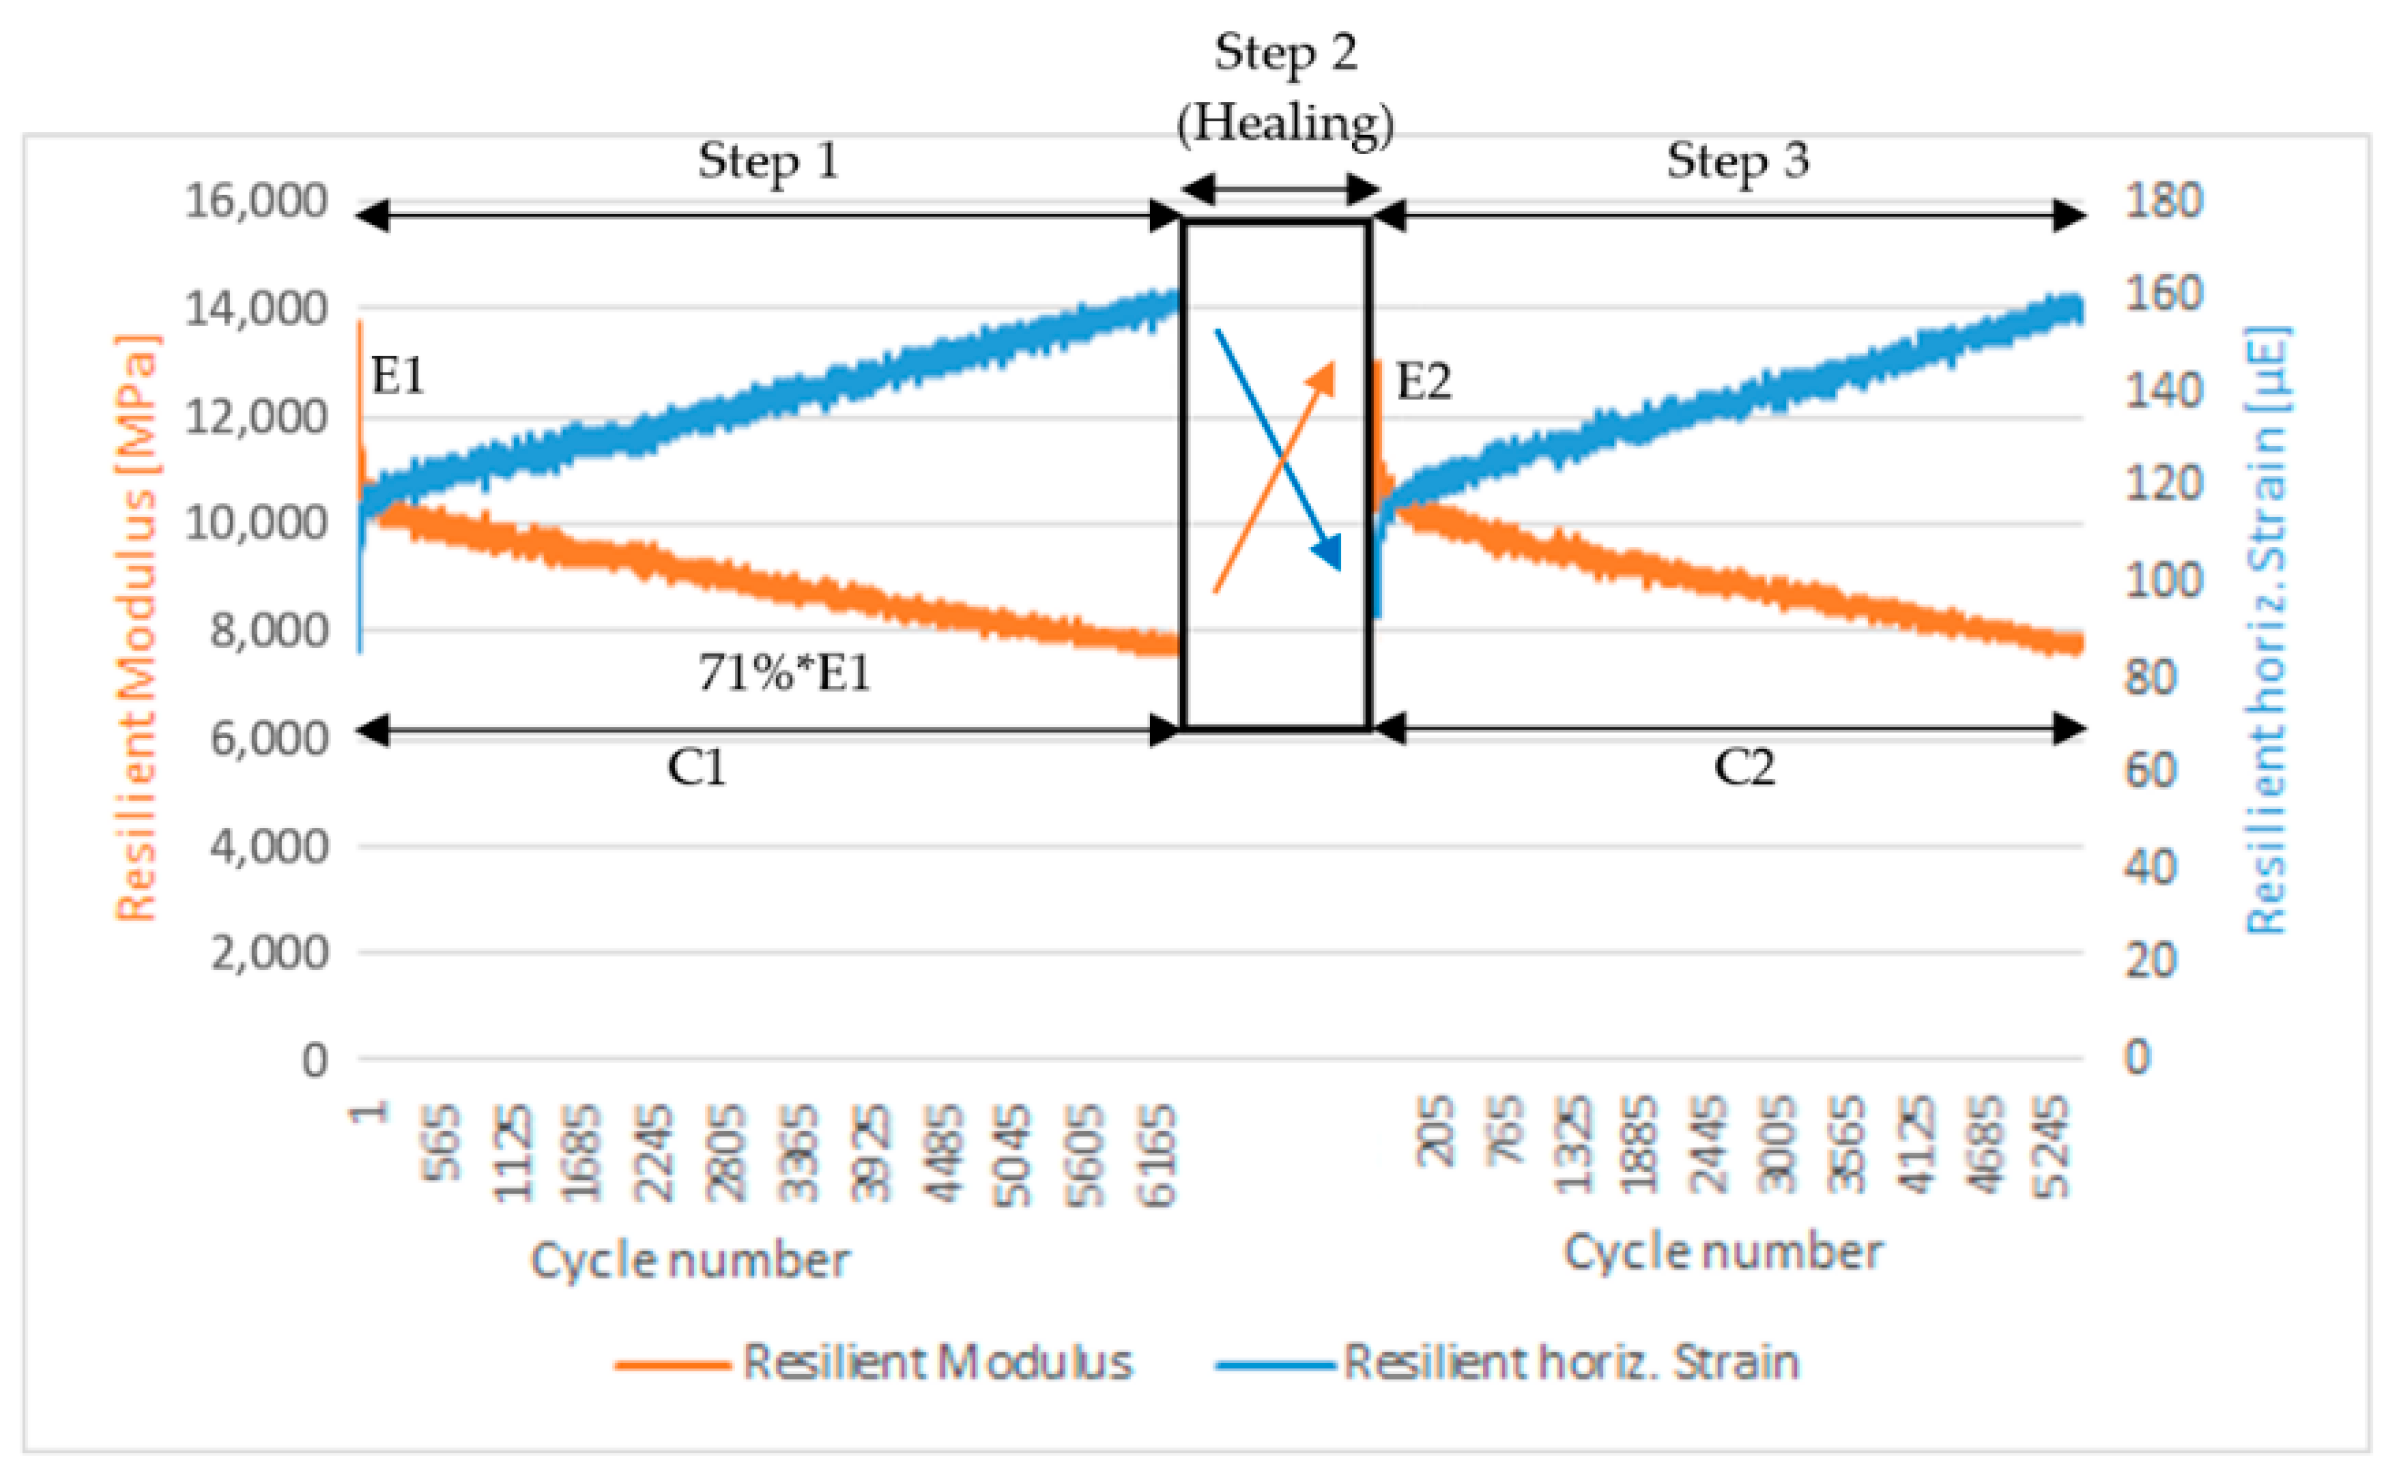
During the tests, the resilient modulus and resilient horizontal strain of the specimens were recorded by the UTM, according to EN 12697-24:2012 Annex E [36]. By plotting this information for both fatigue tests before and after the healing procedure, it is possible to define the extension index (EI) and recovery index (RI) based on Figure 3. The EI is defined in Equation (1) [37] and the RI is calculated according to Equation (2) [2], where 100% means the complete recovery and 0% means no recovery at all.
EI = C 2 C 1
RI = E 2 E 1
C1 and C2 are numbers of loading cycles, and E1 and E2 are the averages of the resilient modulus for the first 100 cycles of each step of the test. As explained in the introduction, these recoveries are not only due to the healing phenomenon and include recoveries based on other mechanisms as well.
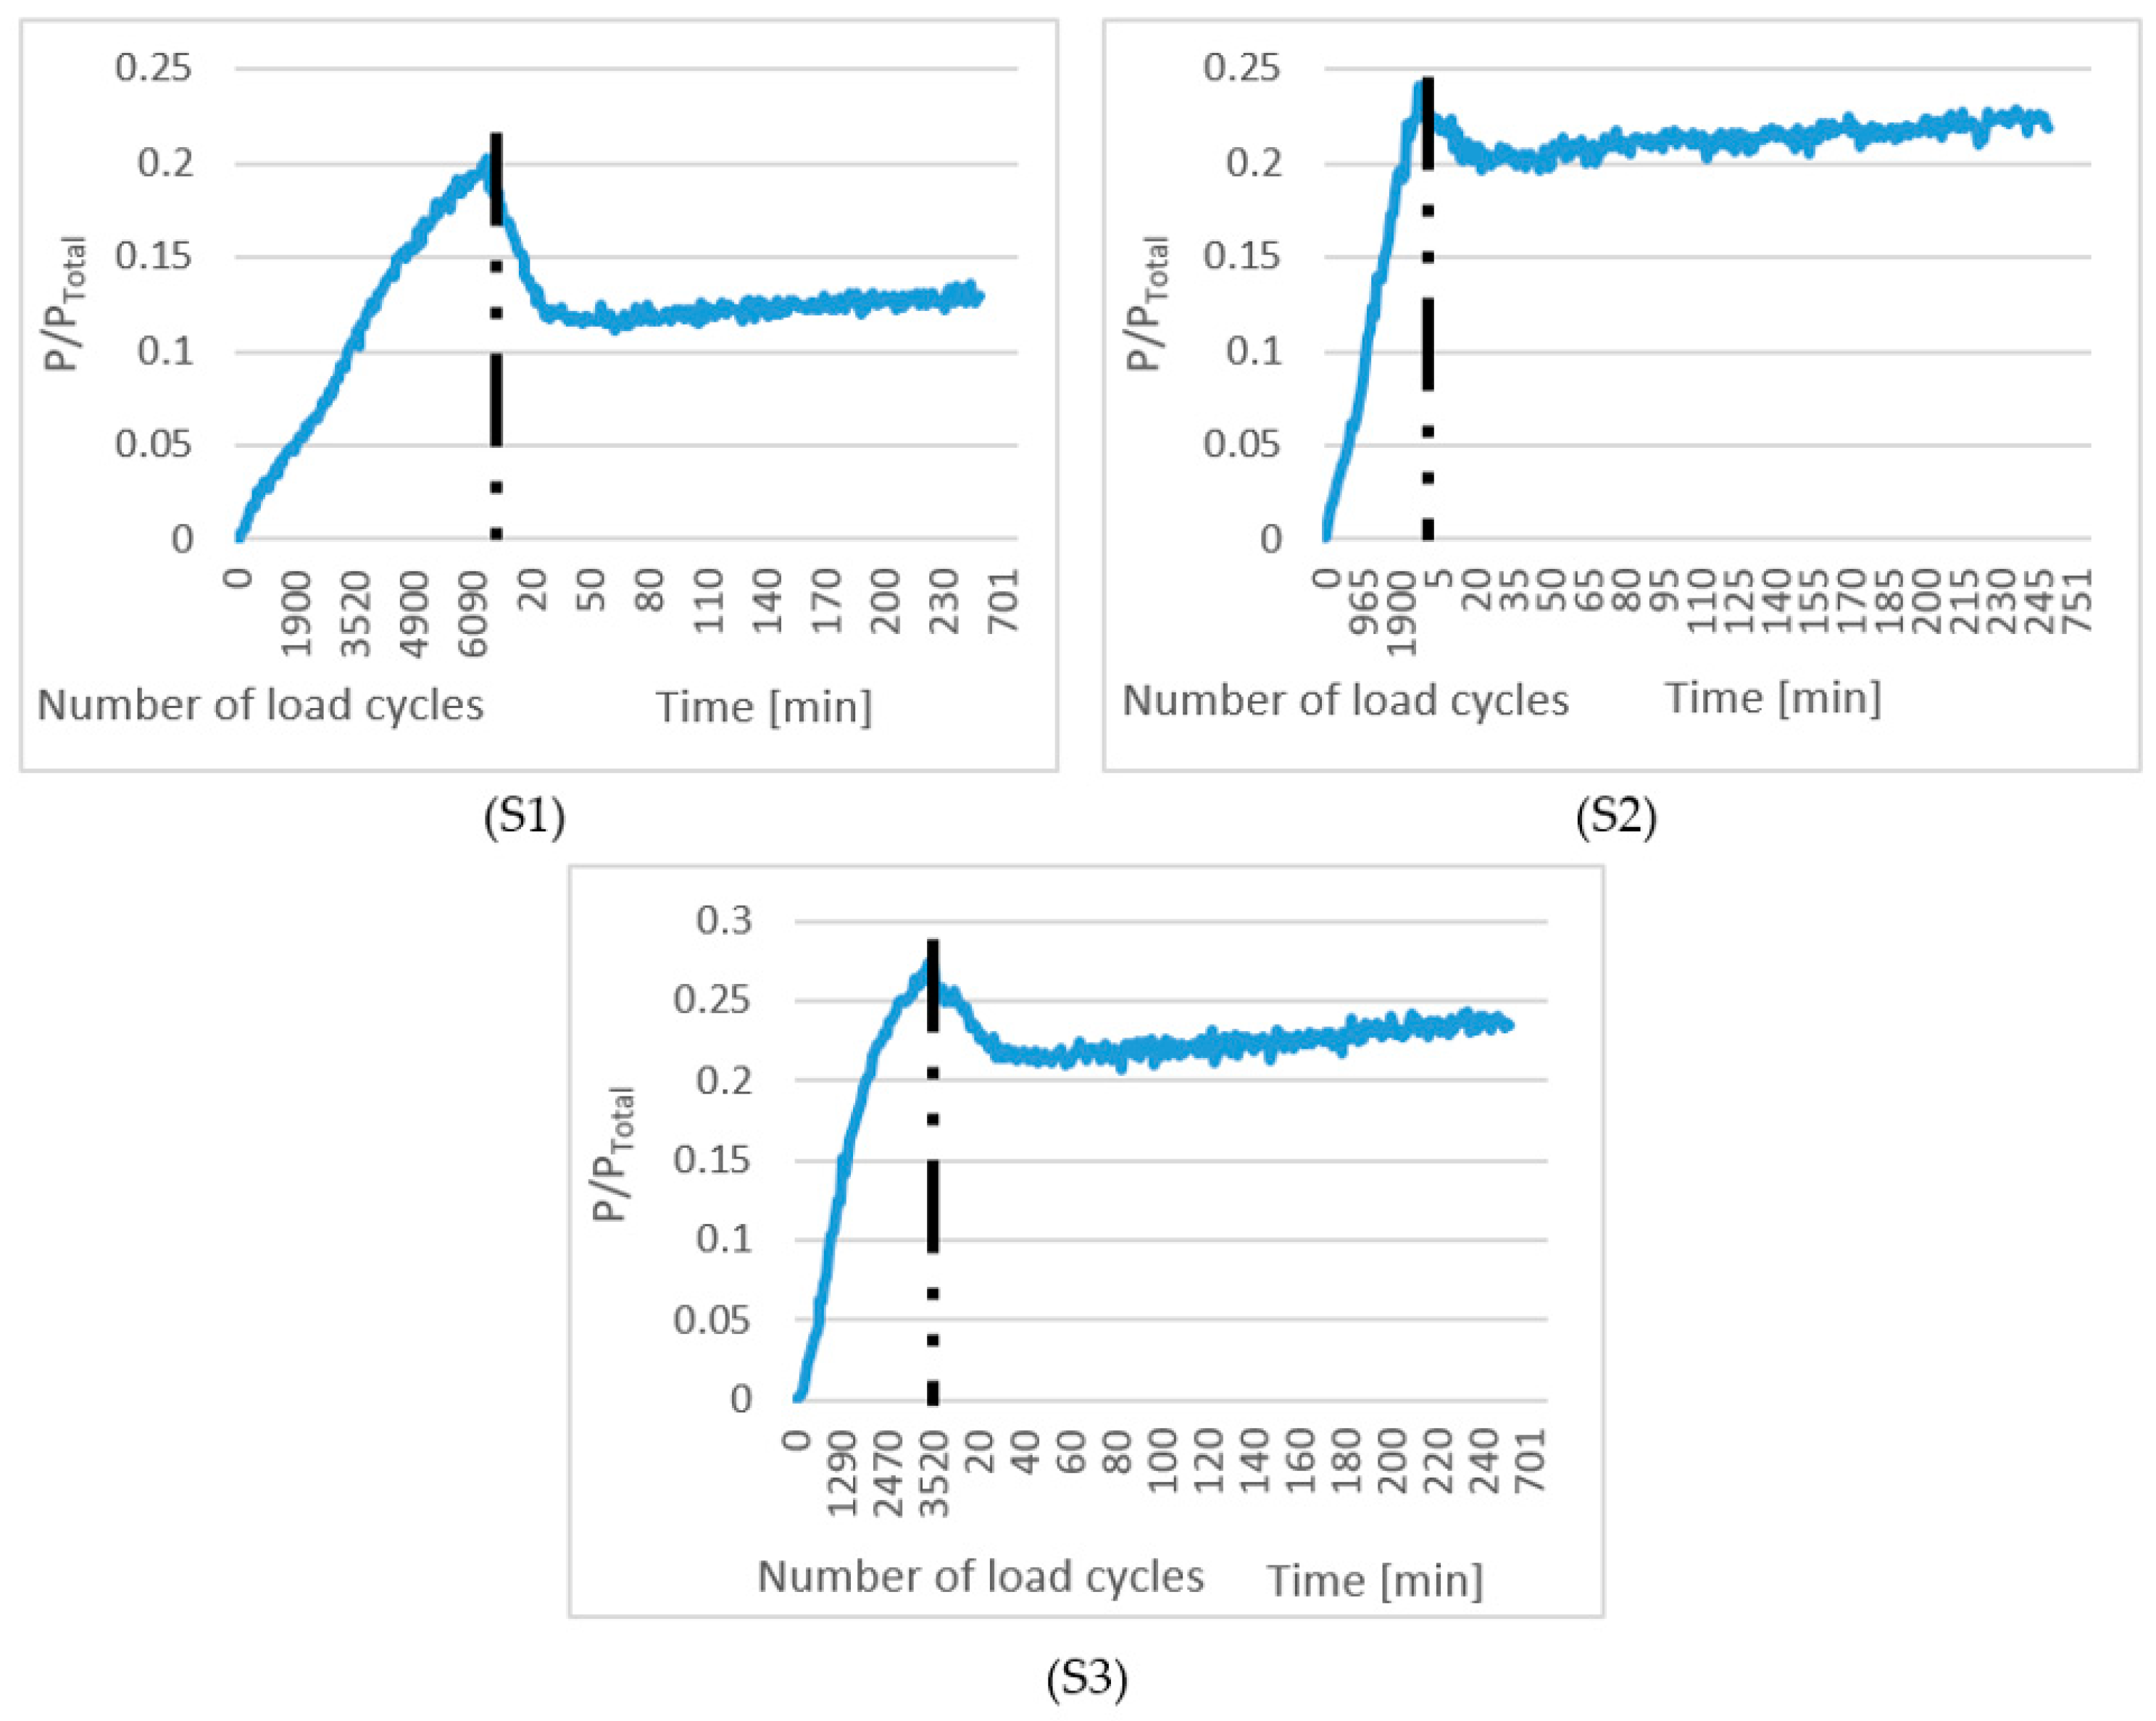
In the next step, the acquired images during the experiments were processed using the Istra 4D software. The facet size and grid spacing were set to 23 and 8 pixels, respectively. Using this software, it is possible to calculate the horizontal strain on the surface of the specimen during the experiments. To show the healing around each microcrack, a region of interest was defined around the areas with high strain and the mean horizontal strains in those regions were calculated and compared through the experiments. Furthermore, to define a general healing factor for the asphalt mixture, the number of facets with horizontal strain higher than 10 µE (P) over the total number of facets (Ptotal) was calculated for all images, see Figure 4. Three values were derived from this figure:
  • Healing time (HT), which represents the time it takes for the surface strain to reach its minimum value,
  • Percentage of the strain recovery (H%) defined as the percentage of strain recovery on the surface of the sample,
  • Strain recovery speed (SR) which represents the speed of strain recovery on the surface of the specimens.

3. Results and Discussion

3.1. Full-Field Strain and Crack Detection

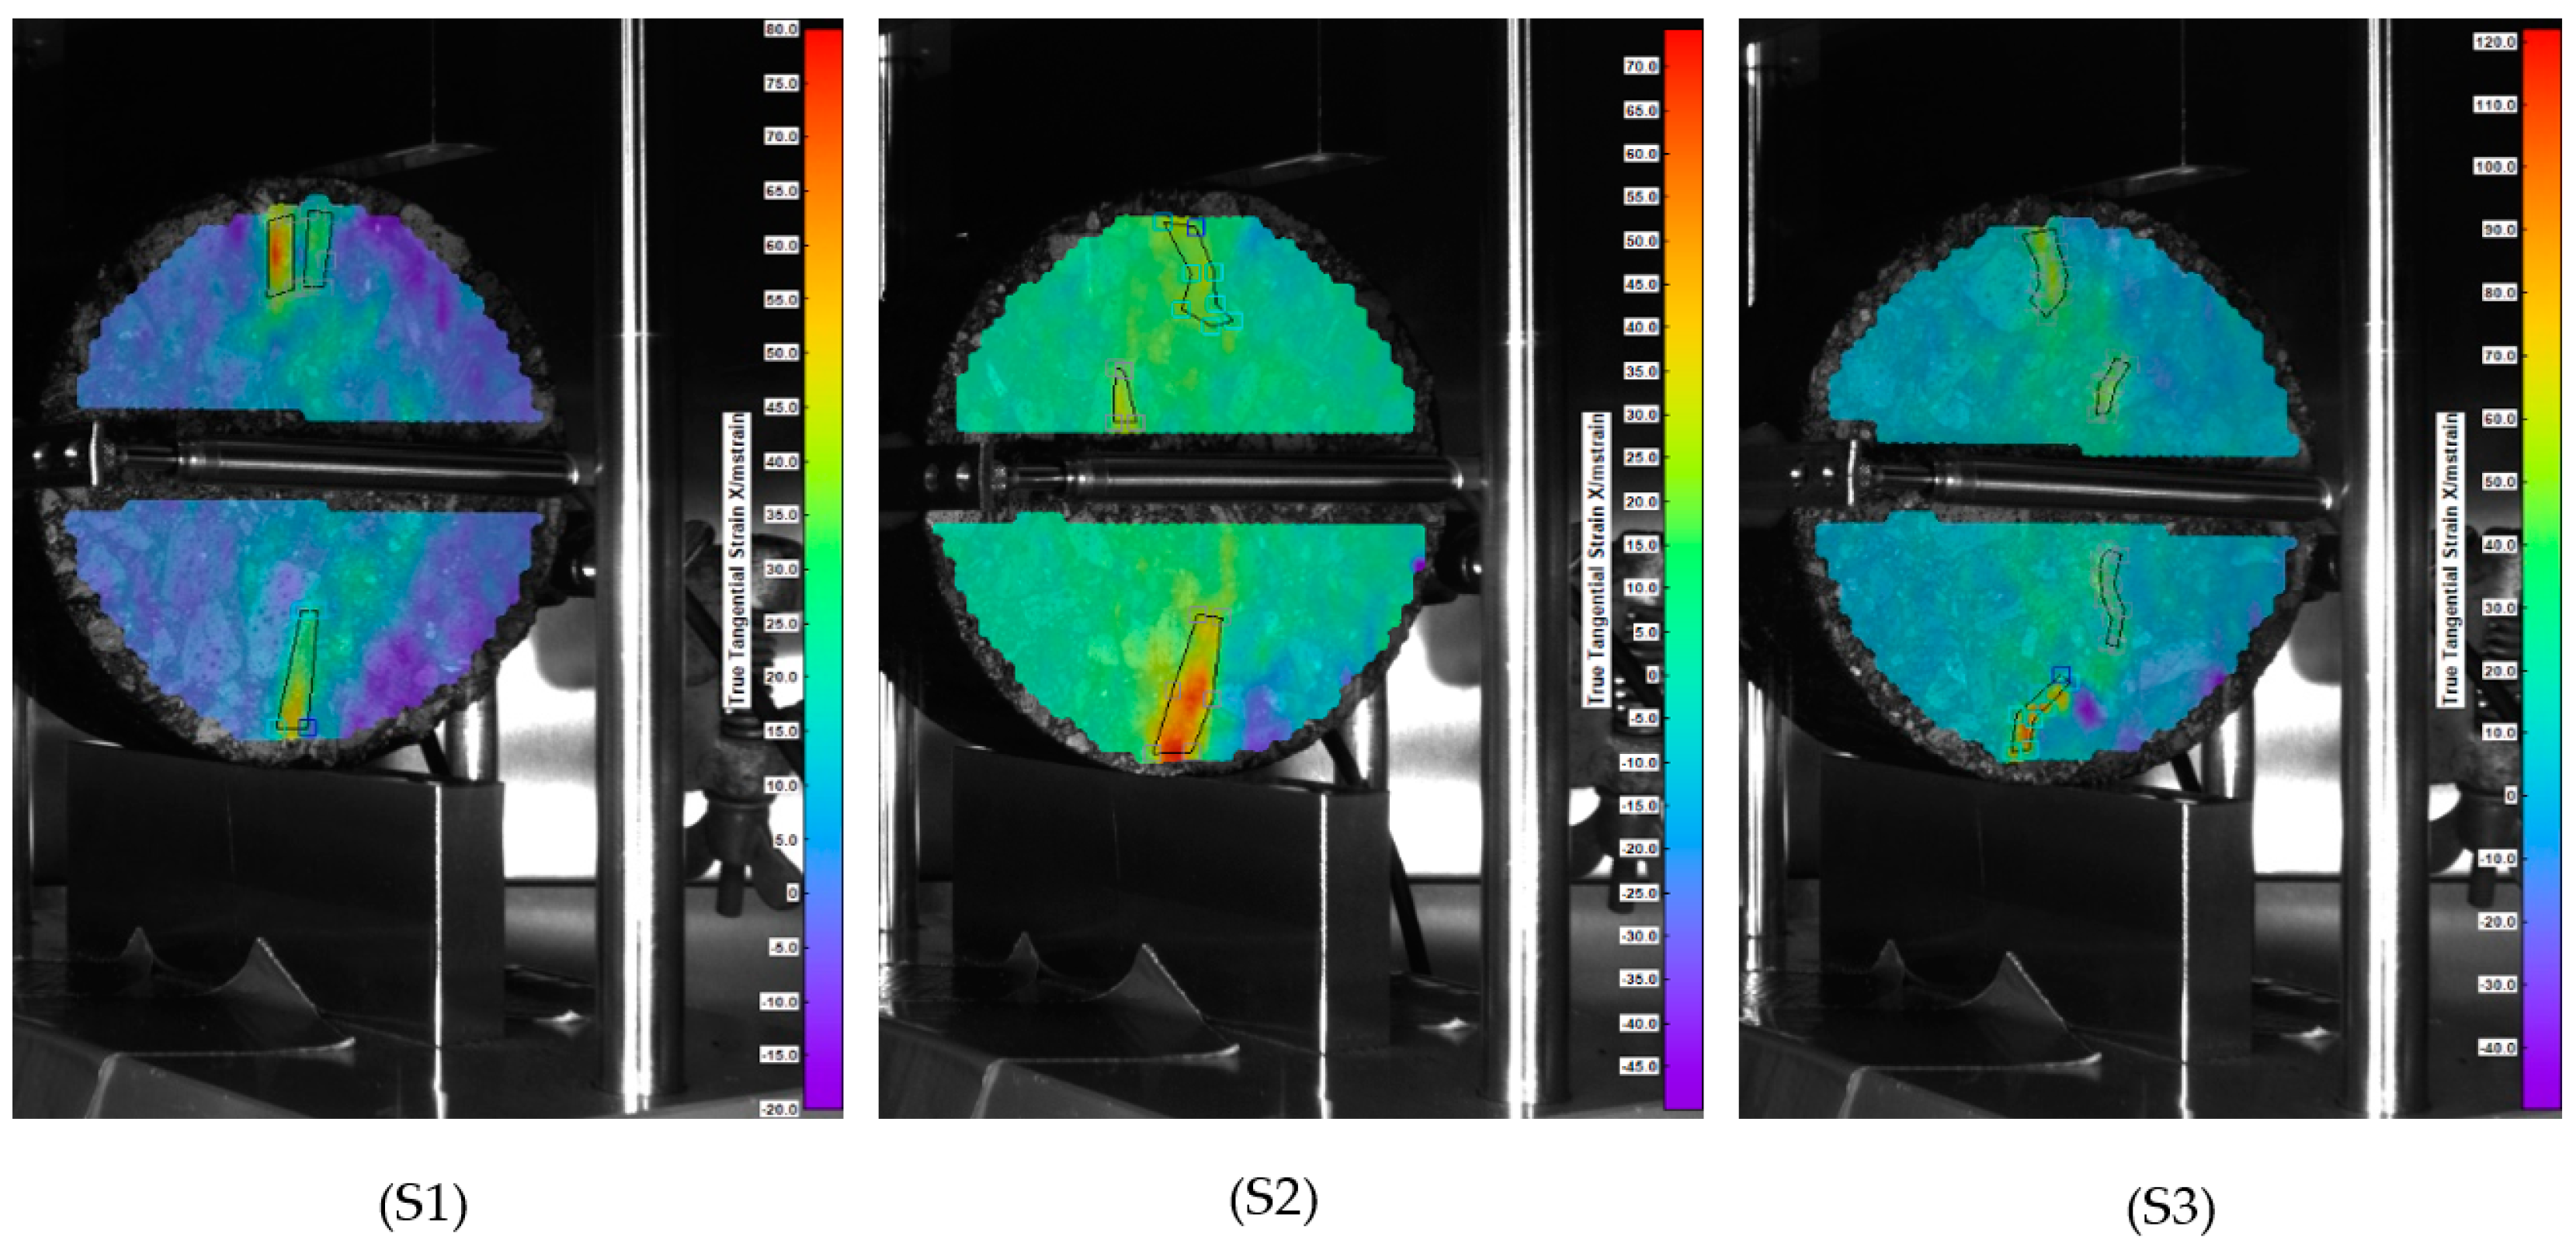
Figure 5 shows the horizontal strain map of the three samples, produced using the same asphalt mixture, at the termination cycle of the first step of the experiment calculated by Istra 4D. As expected, due to the difference between the module of elasticity of the aggregate and binder, the strain obtained within the binders is larger than those within the aggregates. However, after some cycles and before the appearance of any cracks, some locations with higher strain are observed on the surface. By continuing the fatigue experiment, the strain all over the surface increases but the location of the maximum strain remains the same. These are the locations where the cracks will initiate and grow. The increase of strain near the crack location in different steps of the fatigue test can be seen in previous research and is confirmed in this study [38]. It can be seen that the contour line of maximum strains matches very well with the fracture path. Due to the anisotropic characteristics of the asphalt mixture, the strain distribution and crack locations are closely related to the distribution of aggregates and the asphalt mortar (In this research mortar is defined as the mixture of bitumen, filler, and sand). The cracks are normally located at the interface of the aggregate-mortar matrix, but depending on the structure of the mixture, in some cases, the crack passes through the stones as well.

3.2. Healing Phenomenon Near the Microcracks

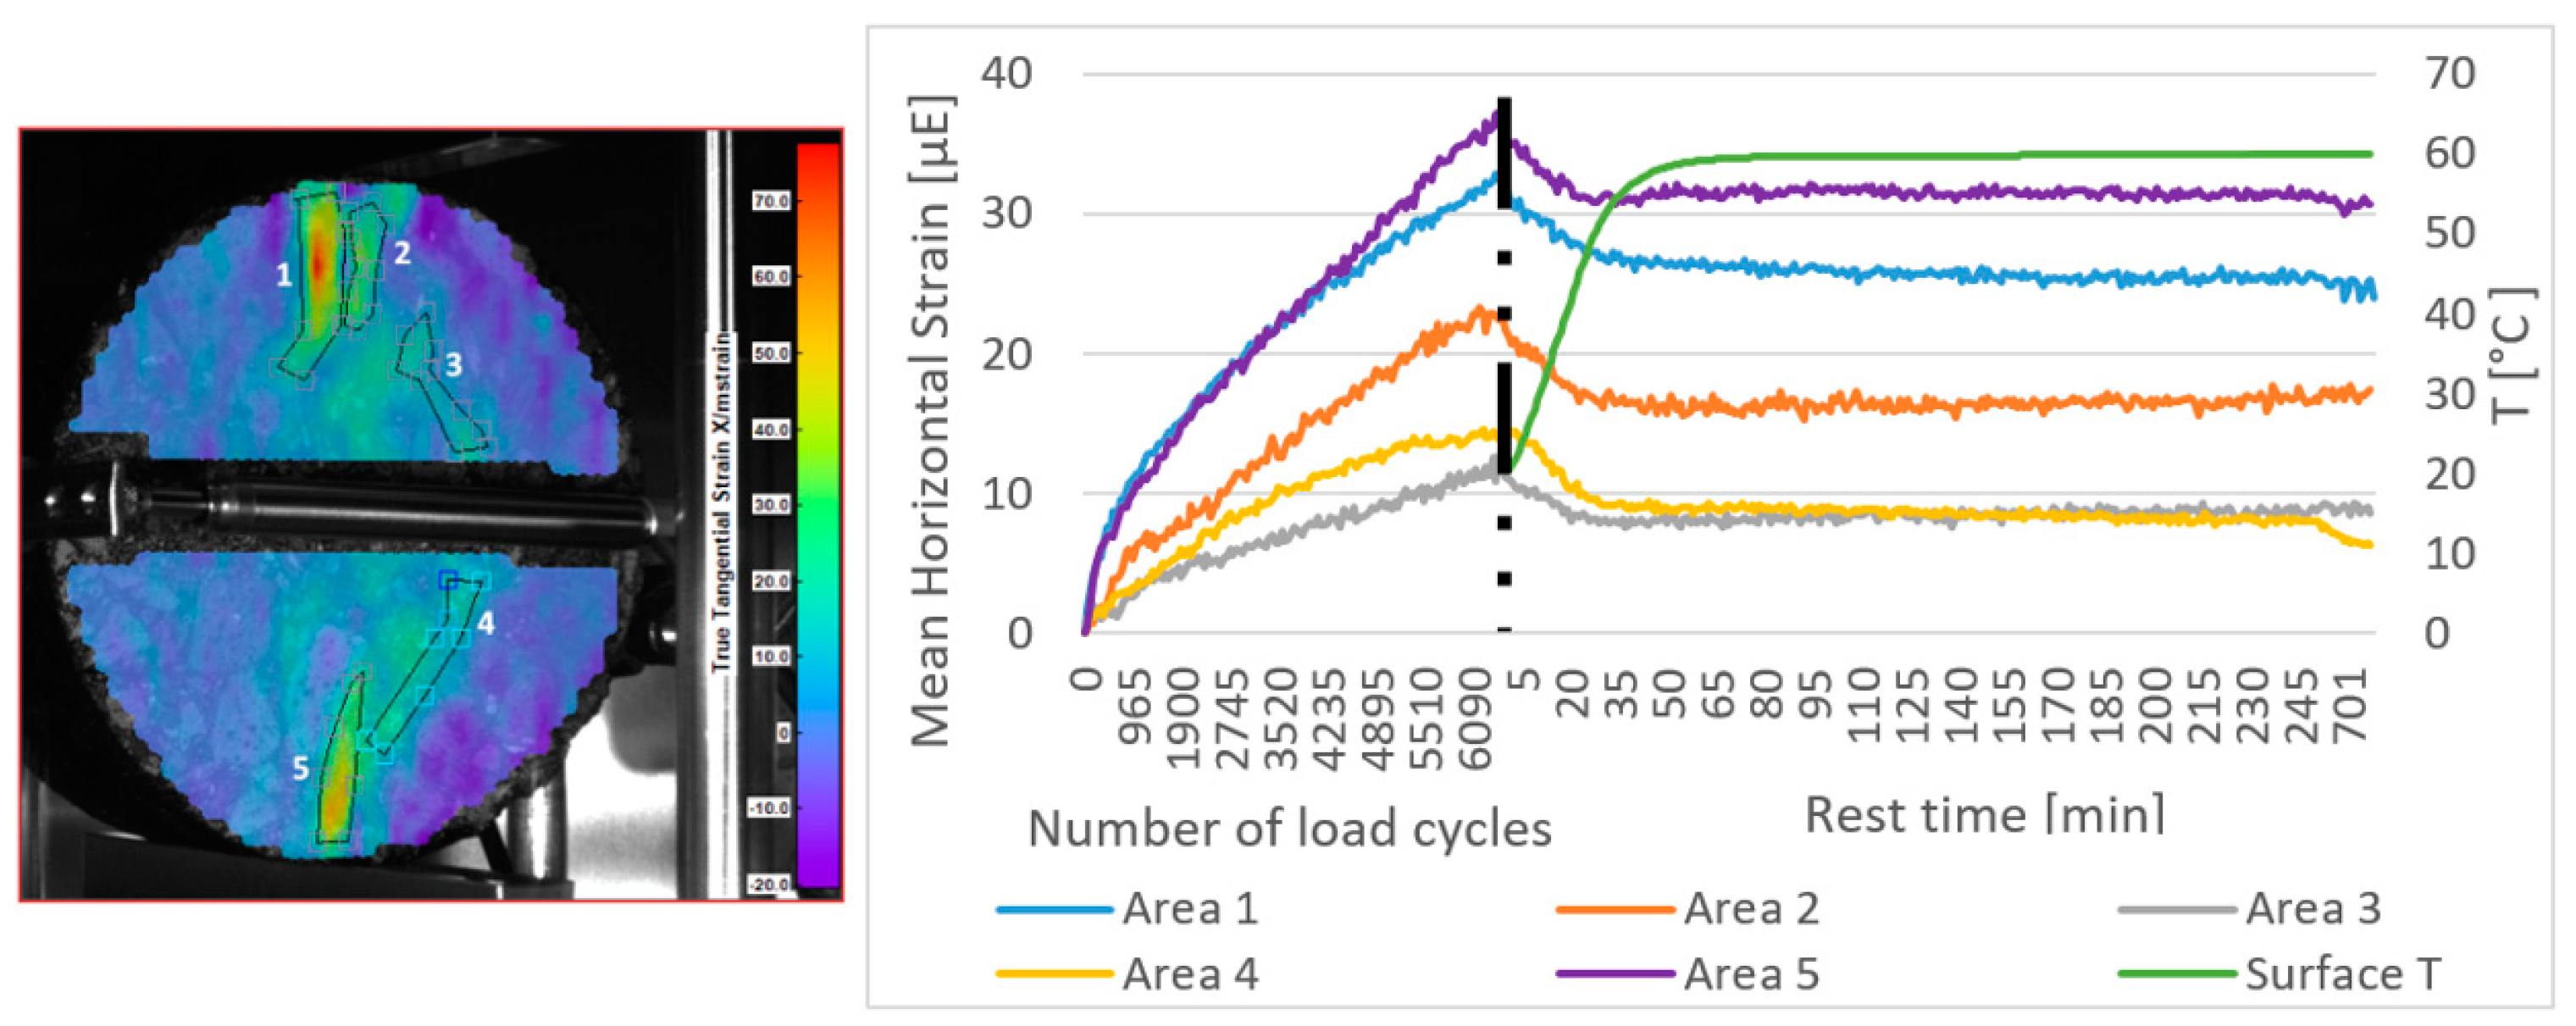
To investigate the healing, regions of interests around the areas with high strain where the microcracks exist were selected (Region 1 to Region 5 in Figure 6 (left)). Figure 6 (right) shows the mean horizontal strain inside the five specified areas during step 1 (the first fatigue test) and step 2 (rest time in elevated temperature). The temperature evaluation on the surface of the specimen is presented in Figure 6 (right). It can be seen that the strains in all the selected regions increase during step 1. After the test is stopped, it takes about 32 min for the mean horizontal strain to reach its minimum. The surface temperature at this time reaches approximately 54.7 °C. After this time the mean horizontal strain fluctuates around that minimum value.
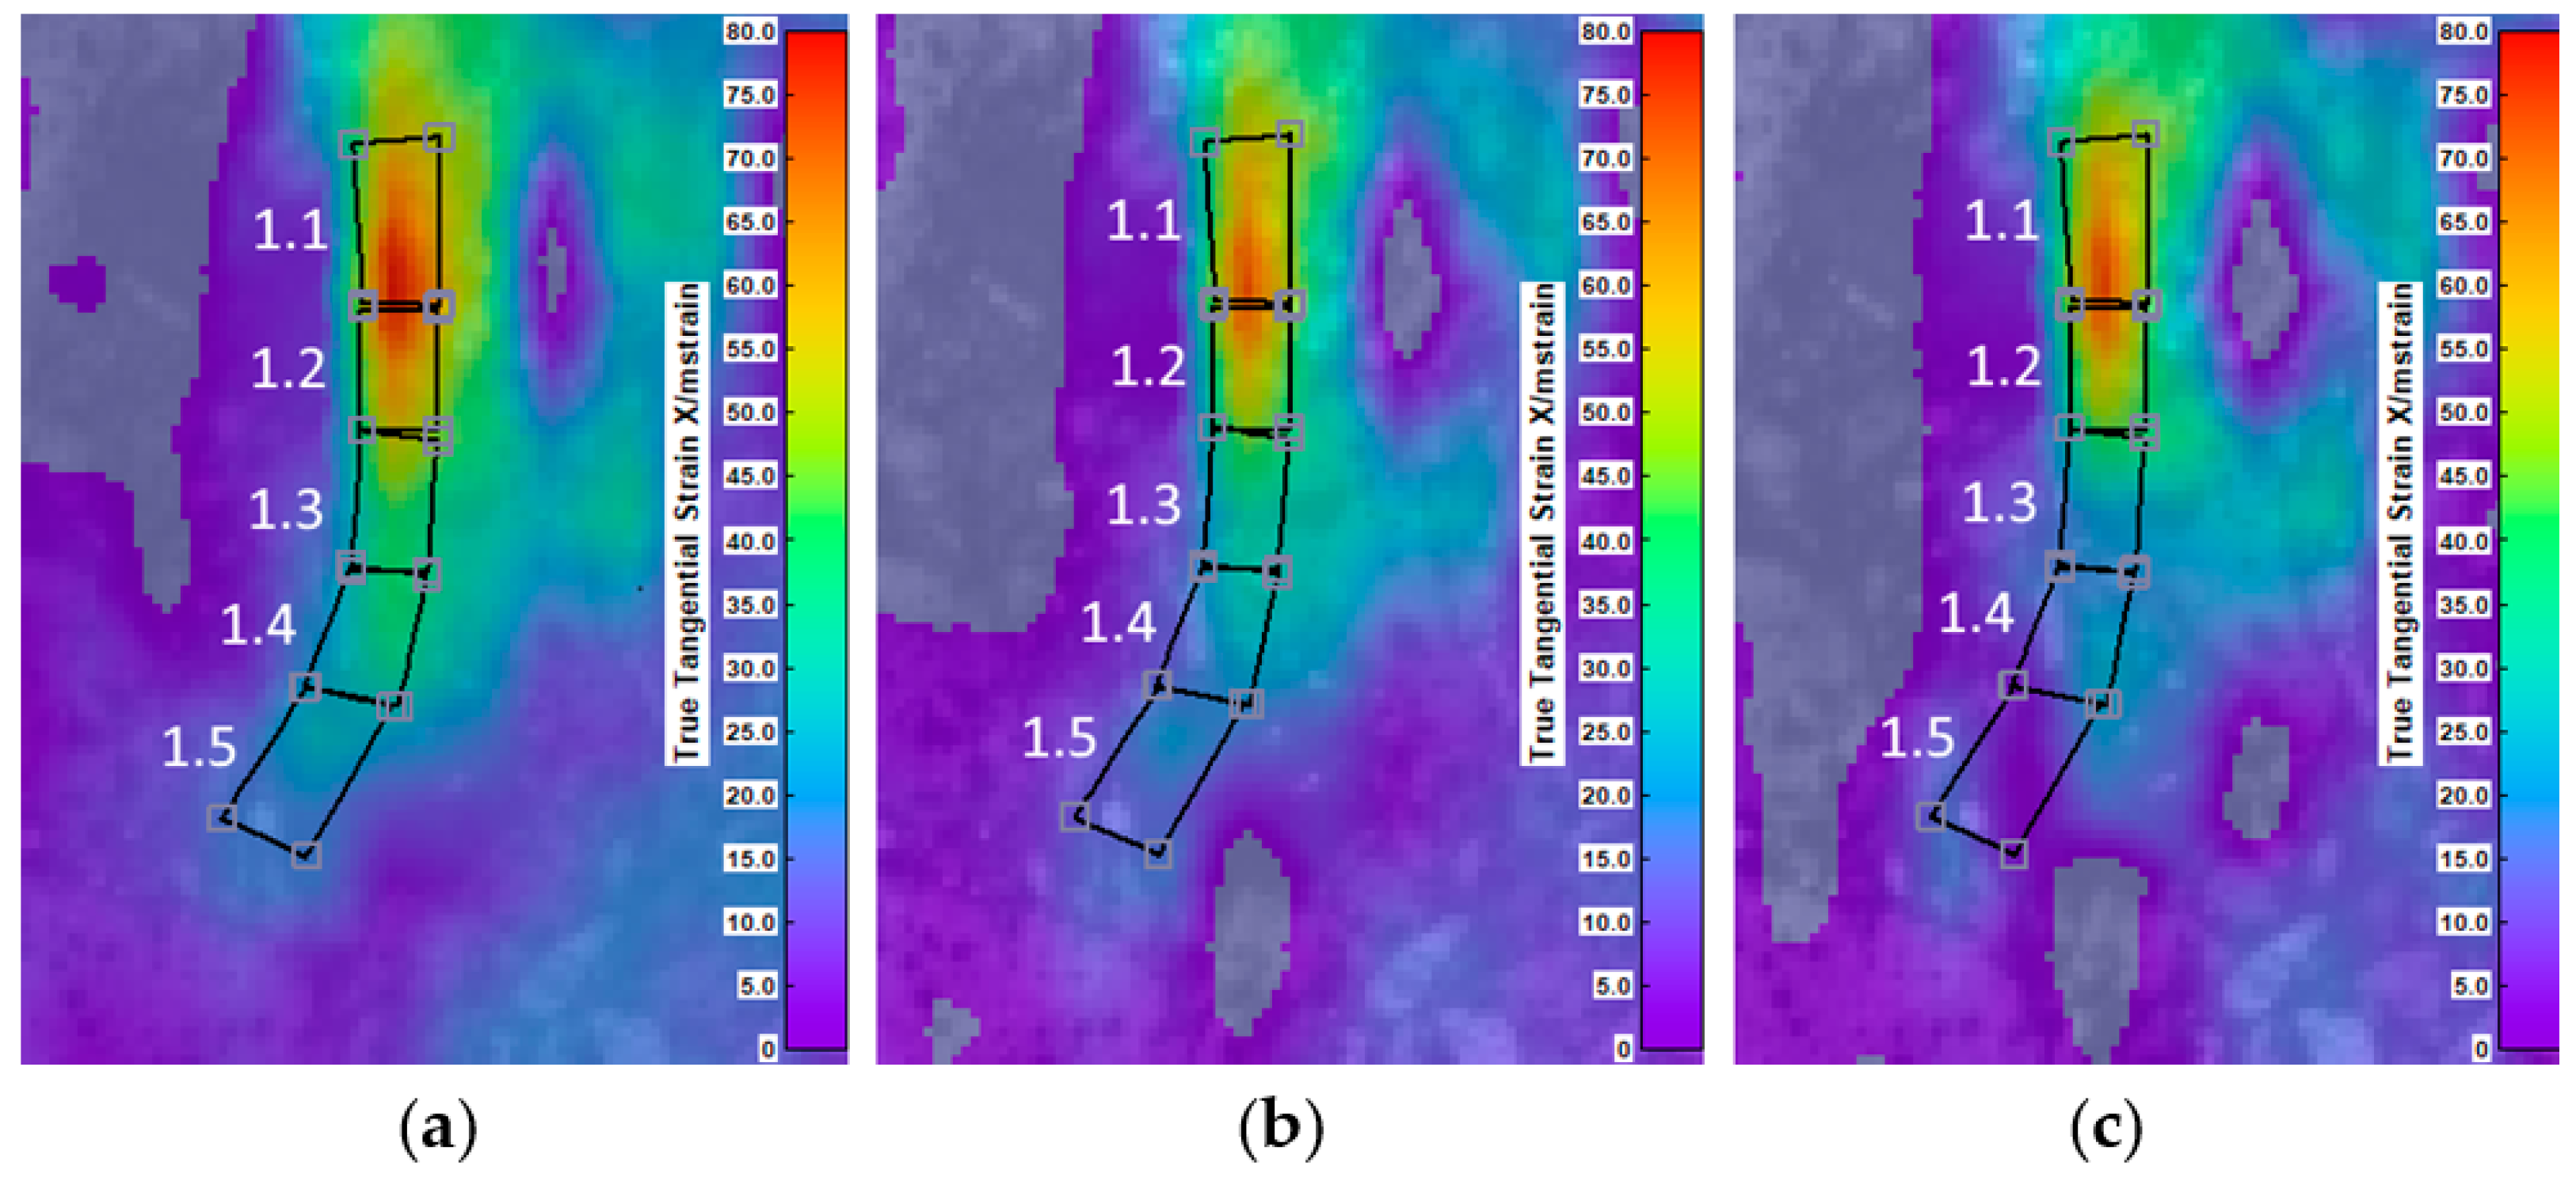
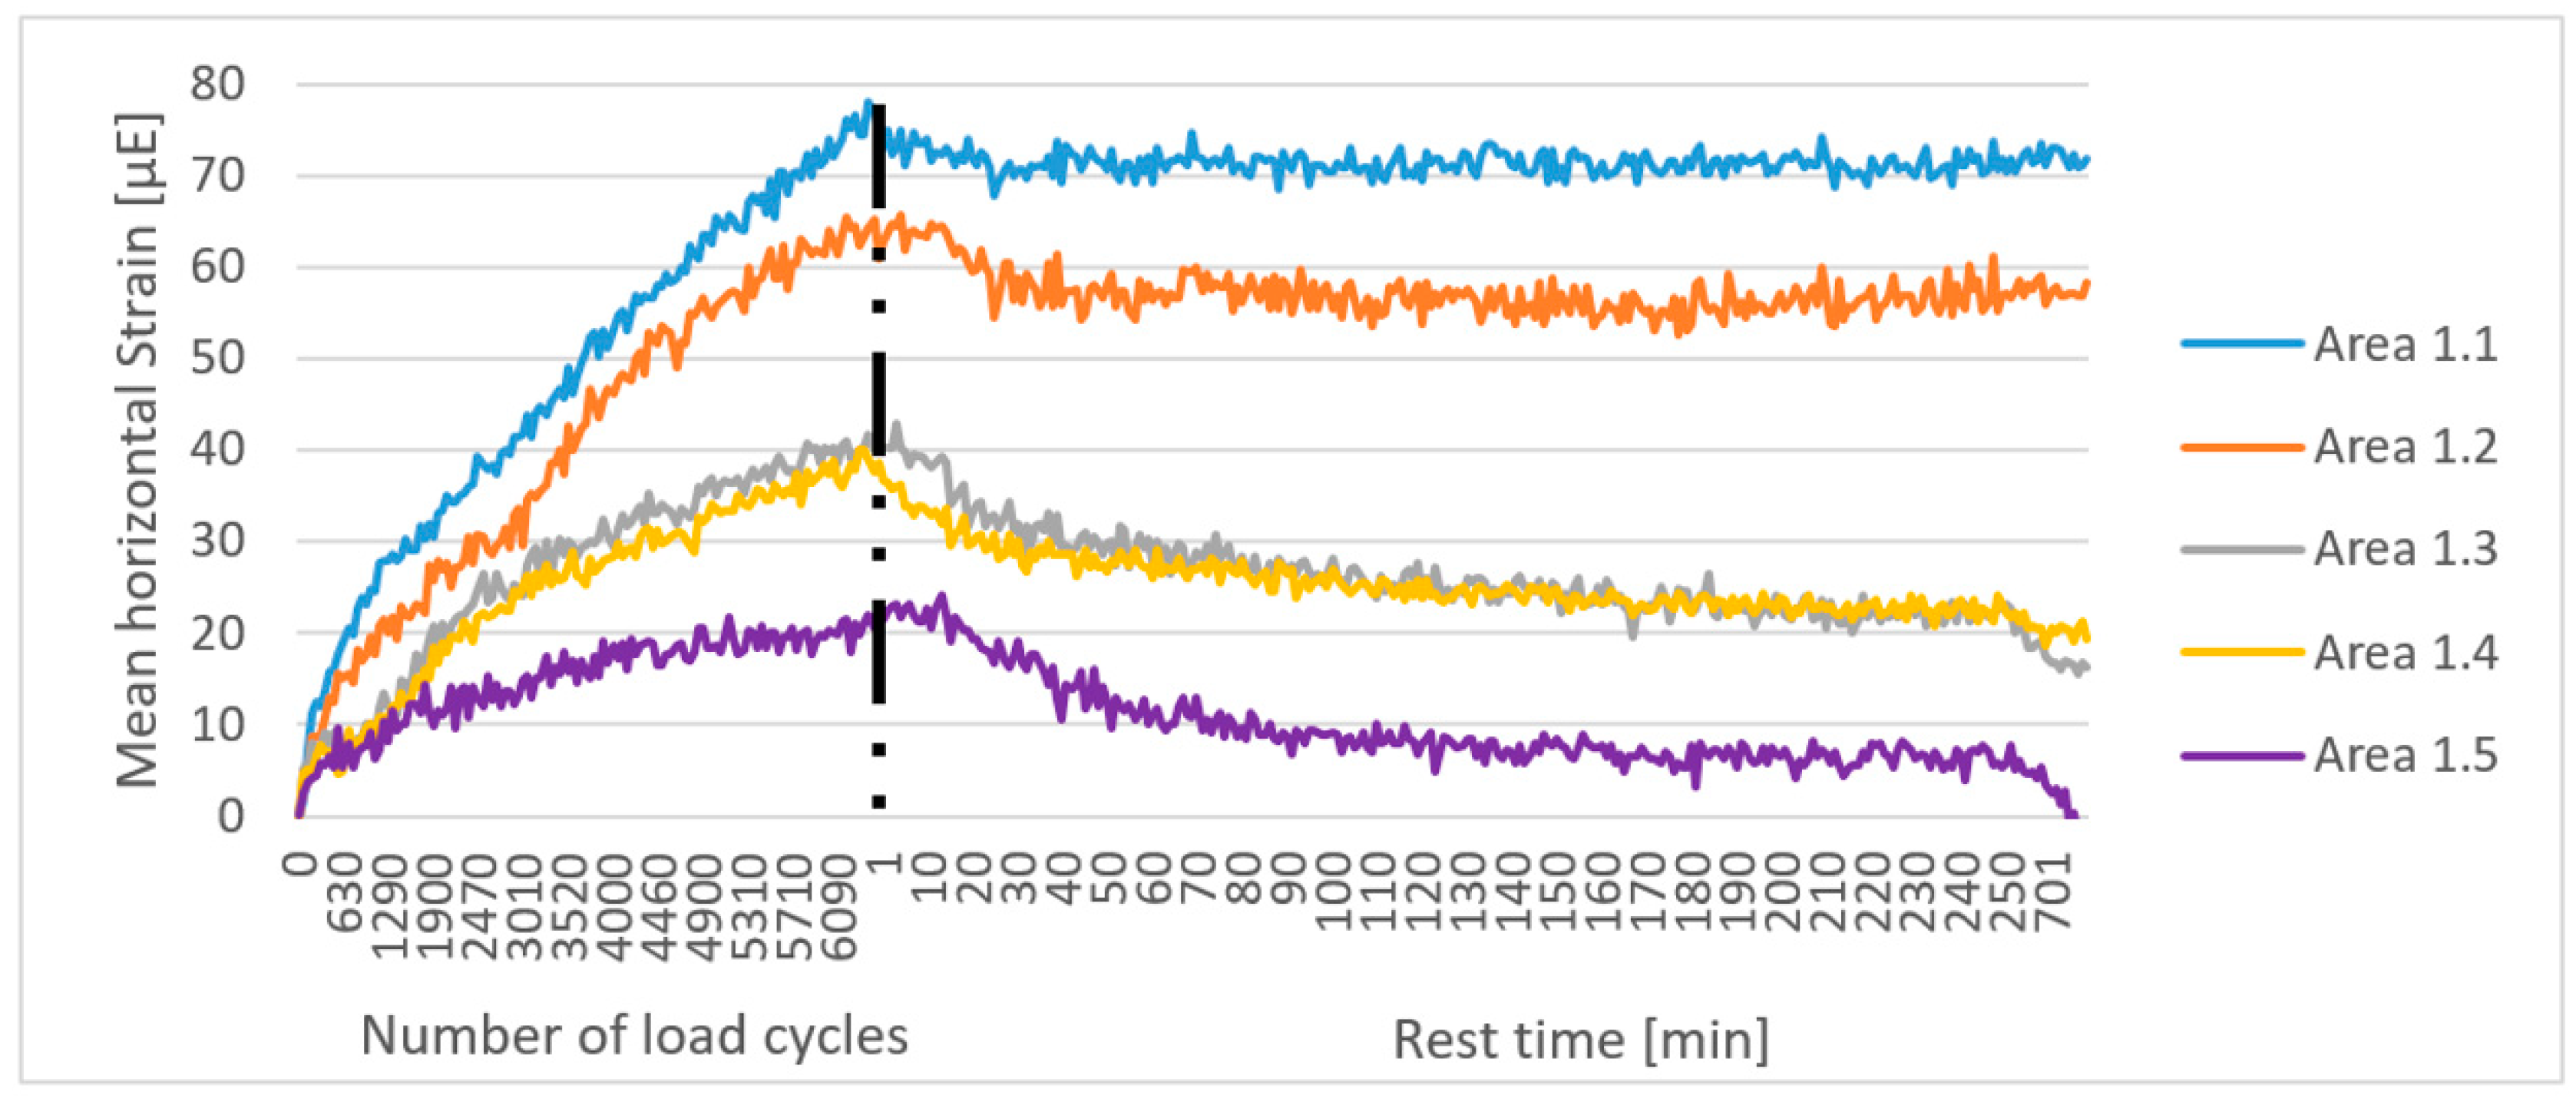
Next, to investigate the level of healing at different locations of a crack path, area 1 of Figure 6 is divided into five smaller areas (Figure 7), from the location with the highest strain (widest part of the microcrack) to the locations with lower strains (tip of the microcrack). Figure 8 shows that the mean horizontal strain is the highest in area 1.1 and it decreases towards area 1.5. Furthermore, the strain reduction is less than 8% in areas 1.1 and 1.2 but it gets to between 50% to 60% for areas 1.3 and 1.4 and finally 100% for area 1.5. Thus, it is possible to conclude that the microcracks can completely heal at their tip (area 1.5) where the faces of the microcracks are close to each other, but they heal much less in the places with a wider crack opening. This is in line with the primary step of the healing process known as wetting of the two faces of the cracks according to the models described in Reference [39]. It should be mentioned that in region 1.1 and 1.2 after the strain reaches a minimum, it slightly increases again until the end of the rest time. This could be due to the fact that there is still a loading plate left on top of the specimen that applies a small force in direction of the crack opening and the creep of asphalt in high temperatures.

3.3. Proposed Healing Indices

In this step, first, resilient modulus and resilient horizontal strain of the three samples are recorded during the fatigue tests, before and after the healing procedure. The resilient modulus decreases during the first fatigue test until it reaches the termination value. Then part of the mechanical properties of the specimens recover during step 2 and a second fatigue test is conducted on the specimens. Recovery indices based on these parameters are calculated using Equations (1) and (2) and are presented in Table 3.
Next, the diagrams of P/Ptotal are plotted for the samples during the first and second step of the experiments (Figure 9). Based on these diagrams and with the procedure explained in Section 2.3, the healing parameters of the samples based on the DIC method are calculated and presented in Table 3. In this table, it can be seen that the average of RI for this mixture is 97%, but the H% value is only 27.7%. Therefore, it could be concluded that strain recovery on the surface does not fully represent the recovery of the mechanical properties of the mixtures. This difference could be due to the fact that H% only investigates the healing of the microcracks on the specimens, but some viscoelastic responses such as non-linearity, thixotropy, and steric hardening can also generate mechanical recovery during the second step of the experiments. Furthermore, H% is based on the microcracks on the surface of the objects. However, healing occurs as well in the microcracks under the surface layer. This can explain the high standard deviation value for H%. The two more interesting calculated parameters are HT, which indicates the time in which all the strain recovery on the surface of the mixture happens, and SR, which shows the speed of this recovery. Without DIC, multiple experiments with different healing times should be conducted to estimate the required healing time for a mixture to achieve its optimum recovery level. However, in this research, the healing level of the asphalt mixture was plotted in time with only one experiment. This diagram was able to give the minimum time (29.33 min) to have the optimum healing for this asphalt concrete in an efficient procedure. This could be useful in practice to decide how much time a mixture needs to heal to an optimum level at a certain temperature. It is also possible to use this method to calculate the SR of different asphalt mixtures and compare their healing rates. However, it should be mentioned that HT and SR are not only dependent on the mixtures but also the temperature increase rate. Thus, they can only be used to compare different mixtures if the exact same healing procedure (step 2) is conducted.

4. Conclusions

Healing is an important parameter of asphalt pavements for mixture design and service life prediction. However, there is still a lack of a proper method to observe and quantify this phenomenon for asphalt mixtures. In this study, the DIC method has been used to firstly predict the crack locations and secondly explore the possibility of observing and measuring the healing ability of asphalt mixtures from the strain map on the surface of the samples. According to the results,
  • This method is able to predict the location of the cracks and observe the healing phenomenon happening in the microcracks.
  • It is possible to observe the amount of healing of different microcracks on the surface of the specimens and it was shown that, as predicted in the healing models, the tip of the microcracks heals more than their widest part.
  • The amount of time it takes for the specimens to heal around the microcracks (HT) can be calculated. This value can be used to plan the minimum time that is required for an asphalt mixture to have its maximum healing at a certain temperature.
  • Finally, two parameters of strain recovery (H%) and strain recovery speed (SR), which can be used qualitatively to compare the healing ability and healing speed of different mixtures, were proposed and calculated for a mixture.
Future research will focus on using this method to investigate the healing of different asphalt mixtures at different temperatures and compare the proposed DIC method with other existing healing identification methods.

Author Contributions

Conceptualization, N.H. and A.M.; methodology, N.H.; software, N.H. and B.R. and J.D.; formal analysis, N.H.; investigation, N.H.; resources, A.M. and G.J. and J.B.; writing—original draft preparation, N.H.; writing—review and editing, N.H. and C.V. and S.V. and A.M. and G.J.; supervision, C.V. and S.V.; project administration, W.V.d.b.

Funding

The authors would like to thank the research council of the Faculty of Applied Engineering of University of Antwerp for granting this project funded by the Everdepoel legacy.

Conflicts of Interest

The funders had no role in the design of the study; in the collection, analyses, or interpretation of data; in the writing of the manuscript, or in the decision to publish the results. Moreover, the authors declare no conflict of interest.

References

  1. García, Á. Self-healing of open cracks in asphalt mastic. Fuel 2012, 93, 264–272. [Google Scholar] [CrossRef]
  2. Xiao, D. State-of-the-art and prospect for self-healing asphalt concrete. In AIP Conference Proceedings; AIP Publishing: Melville, NY, USA, 2017; Volume 1864. [Google Scholar]
  3. Bommavaram, R.; Bhasin, A.; Little, D. Determining intrinsic healing properties of asphalt binders. Transp. Res. Rec. J. Transp. Res. Board 2009, 2126, 47–54. [Google Scholar] [CrossRef]
  4. Sun, D.; Sun, G.; Zhu, X.; Guarin, A.; Li, B.; Dai, Z.; Ling, J. A comprehensive review on self-healing of asphalt materials: Mechanism, model, characterization and enhancement. Adv. Colloid Interface Sci. 2018. [Google Scholar] [CrossRef] [PubMed]
  5. Ayar, P.; Moreno-Navarro, F.; Rubio-Gamez, M.C. The healing capability of asphalt pavements: A state of the art review. J. Clean. Prod. 2016, 113, 28–40. [Google Scholar] [CrossRef]
  6. Daniel, J.S.; Kim, Y.R. Laboratory evaluation of fatigue damage and healing of asphalt mixtures. J. Mater. 2002, 13, 434–440. [Google Scholar] [CrossRef]
  7. Kim, Y.; Little, D.N.; Lytton, R.L. Fatigue and healing characterization of asphalt mixtures. J. Mater. Civ. Eng. 2003, 15, 75–83. [Google Scholar] [CrossRef]
  8. Shan, L.; Tan, Y.; Underwood, S.; Kim, Y.R. Application of thixotropy to analyze fatigue and healing characteristics of asphalt binder. Transp. Res. Rec. 2010, 2179, 85–92. [Google Scholar] [CrossRef]
  9. Roque, R.; Simms, R.; Chen, Y.; Koh, C.; Lopp, G. Development of A Test Method That Will Allow Evaluation and Quantification of the Effects of Healing on Asphalt Mixture; University of South Florida, College of Engineering: Tampa, FL, USA, 2012. [Google Scholar]
  10. Schapery, R.A. Correspondence principles and a generalized J integral for large deformation and fracture analysis of viscoelastic media. Int. J. Fract. 1984, 25, 195–223. [Google Scholar] [CrossRef]
  11. Si, Z.; Little, D.N.; Lytton, R.L. Characterization of microdamage and healing of asphalt concrete mixtures. J. Mater. Civ. Eng. 2002, 14, 461–470. [Google Scholar] [CrossRef]
  12. Shen, S.; Chiu, H.-M.; Huang, H. Characterization of fatigue and healing in asphalt binders. J. Mater. Civ. Eng. 2010, 22, 846–852. [Google Scholar] [CrossRef]
  13. Kim, B.; Roque, R. Evaluation of healing property of asphalt mixtures. Transp. Res. Rec. J. Transp. Res. Board 2006, 1970, 84–91. [Google Scholar] [CrossRef]
  14. Verstraeten, J. Loi de Fatigue en Flexion Repetee des Melanges Bitumineux.; Bulletin de Liaison des Labratoires des Ponts et Chaussees; Institut Francais des Sciences et Technologies des Transports, de l’Aménagement et des Réseaux (IFSTTAR): Paris, France, 1974. [Google Scholar]
  15. Van Den Bergh, W.; Kara, P.; Anthonissen, J.; Margaritis, A.; Jacobs, G.; Couscheir, K. Recommendations and strategies for using reclaimed asphalt pavement in the Flemish Region based on a first life cycle assessment research. IOP Conf. Ser. Mater. Sci. Eng. 2017, 236. [Google Scholar] [CrossRef]
  16. Liu, Q.; Li, B.; Schlangen, E.; Sun, Y.; Wu, S. Research on the mechanical, thermal, induction heating and healing properties of steel slag/steel fibers composite asphalt mixture. Appl. Sci. 2017, 7, 1088. [Google Scholar] [CrossRef]
  17. Norambuena-contreras, J.; Gonzalez-torre, I. Influence of the microwave heating time on the self-healing properties of asphalt mixtures. Appl. Sci. 2017, 7, 1076. [Google Scholar] [CrossRef]
  18. Su, J.F.; Yang, P.; Wang, Y.Y.; Han, S.; Han, N.X.; Li, W. Investigation of the self-healing behaviors of microcapsules/bitumen composites by a repetitive direct tension test. Materials 2016, 9, 600. [Google Scholar] [CrossRef] [PubMed]
  19. Tabaković, A.; Schuyffel, L.; Karač, A.; Schlangen, E. An evaluation of the efficiency of compartmented alginate fibres encapsulating a rejuvenator as an asphalt pavement healing system. Appl. Sci. 2017, 7, 647. [Google Scholar] [CrossRef]
  20. Seo, Y.; Kim, Y.; Witczak, M.; Bonaquist, R. Application of digital image correlation method to mechanical testing of asphalt-aggregate mixtures. Transp. Res. Rec. 2002, 1789, 162–172. [Google Scholar] [CrossRef]
  21. Wen, H.; Kim, Y. Simple performance test for fatigue cracking and validation with westrack mixtures. Transp. Res. Rec. 2002, 1789, 66–72. [Google Scholar] [CrossRef]
  22. Seo, Y.; Chehab, G.R.; Kim, Y.R. Viscoelastoplastic damage characterization of asphalt–aggregate mixtures using digital image correlation. Int. J. Geomech. 2007, 111–118. [Google Scholar] [CrossRef]
  23. Birgisson, B.; Montepara, A.; Romeo, E.; Roncella, R.; Napier, J.A.L.; Tebaldi, G. Determination and prediction of crack patterns in hot mix asphalt (HMA) mixtures. Eng. Fract. Mech. 2008, 75, 664–673. [Google Scholar] [CrossRef]
  24. Tan, Y.; Hou, M.; Zhang, L.; Zhang, K. Studying the strain field distribution of asphalt mixture with the digital speckle correlation method. Road Mater. Pavement Des. 2014, 15, 90–101. [Google Scholar] [CrossRef]
  25. Birgisson, B.; Montepara, A.; Romeo, E.; Roque, R. Road materials and pavement design influence of mixture properties on fracture mechanisms in asphalt mixtures influence of mixture properties on fracture mechanisms in asphalt mixtures. Road Mater. Pavement Des. 2010, 0629, 37–41. [Google Scholar] [CrossRef]
  26. Rashadul Islam, M.; Vallejo, M.J.; Tarefder, R.A. Crack propagation in hot mix asphalt overlay using extended finite-element model. J. Mater. Civ. Eng. 2016, 29, 04016296. [Google Scholar] [CrossRef]
  27. Birgisson, B.; Montepara, A.; Romeo, E.; Roque, R.; Roncella, R.; Tebaldi, G. Determination of fundamental tensile failure limits of mixtures. In Proceedings of the Asphalt Paving Technology-Proceedings, San Antonio, TX, USA, 11–14 March 2007; pp. 303–344. [Google Scholar]
  28. Jeoffroy, E. Activated Crack Healing of Bituminous Materials. Ph.D. Thesis, ETH Zurich, Zürich, Switzerland, 2017. [Google Scholar]
  29. Bueno, M.; Arraigada, M.; Partl, M.N. Damage detection and artificial healing of asphalt concrete after trafficking with a load simulator. Mech. Time-Depend. Mater. 2016, 20, 265–279. [Google Scholar] [CrossRef]
  30. Tsangouri, E.; Aggelis, D.G.; Van Tittelboom, K.; De Belie, N.; Van Hemelrijck, D. Detecting the activation of a self-healing mechanism in concrete by acoustic emission and digital image correlation. Sci. World J. 2013, 2013. [Google Scholar] [CrossRef] [PubMed]
  31. Bureau voor Normalisatie. NBN EN 12697-35:2016 Bituminous Mixtures—Test Methods—Part 35: Laboratory Mixing; Bureau voor Normalisatie: Brussels, Belgium, 2016. [Google Scholar]
  32. Bureau voor Normalisatie. NBN EN 12697-31:2007 Bituminous Mixtures—Test Methods for Hot Mix Asphalt—Part 31: Specimen Preparation by Gyratory Compactor; Bureau voor Normalisatie: Brussels, Belgium, 2007. [Google Scholar]
  33. Lecompte, D.; Smits, A.; Bossuyt, S.; Sol, H.; Vantomme, J.; Van Hemelrijck, D.; Habraken, A.M. Quality assessment of speckle patterns for digital image correlation. Opt. Lasers Eng. 2006, 44. [Google Scholar] [CrossRef]
  34. Romeo, E. Two-dimensional digital image correlation for asphalt mixture characterisation: interest and limitations. Road Mater. Pavement Des. 2013, 14, 747–763. [Google Scholar] [CrossRef]
  35. Xing, C.; Tan, Y.; Liu, X.; Anupam, K.; Scarpas, T. Research on local deformation property of asphalt mixture using digital image correlation. Constr. Build. Mater. 2017, 140, 416–423. [Google Scholar] [CrossRef] [Green Version]
  36. Bureau voor Normalisatie. NBN EN 12697-24:2012 Bituminous Mixtures—Test Methods for Hot Mix Asphalt—Part 24: Resistance to Fatigue; Bureau voor Normalisatie: Brussels, Belgium, 2012. [Google Scholar]
  37. Liu, Q. Induction Healing of Porous Asphalt Concrete; Delft University of Technology: Delft, The Netherlands, 2012. [Google Scholar]
  38. Hasheminejad, N.; Margaritis, A.; Ribbens, B.; Vuye, C.; Blom, J.; Van den Bergh, W.; Dirckx, J.; Vanlanduit, S. Digital image correlation to investigate crack propagation and healing of asphalt concrete. Proceedings 2018, 2, 473. [Google Scholar] [CrossRef]
  39. Van Der Zwaag, S.; Robert, H.; Osgood, R.M.; Parisi, J.; Warlimont, H. Self Healing Materials—An Alternative Approach to 20 Centuries of Materials Science; Springer Science+Business Media B.V.: Dordrecht, The Netherlands, 2008; Volume 5, ISBN 9783540766629. [Google Scholar]
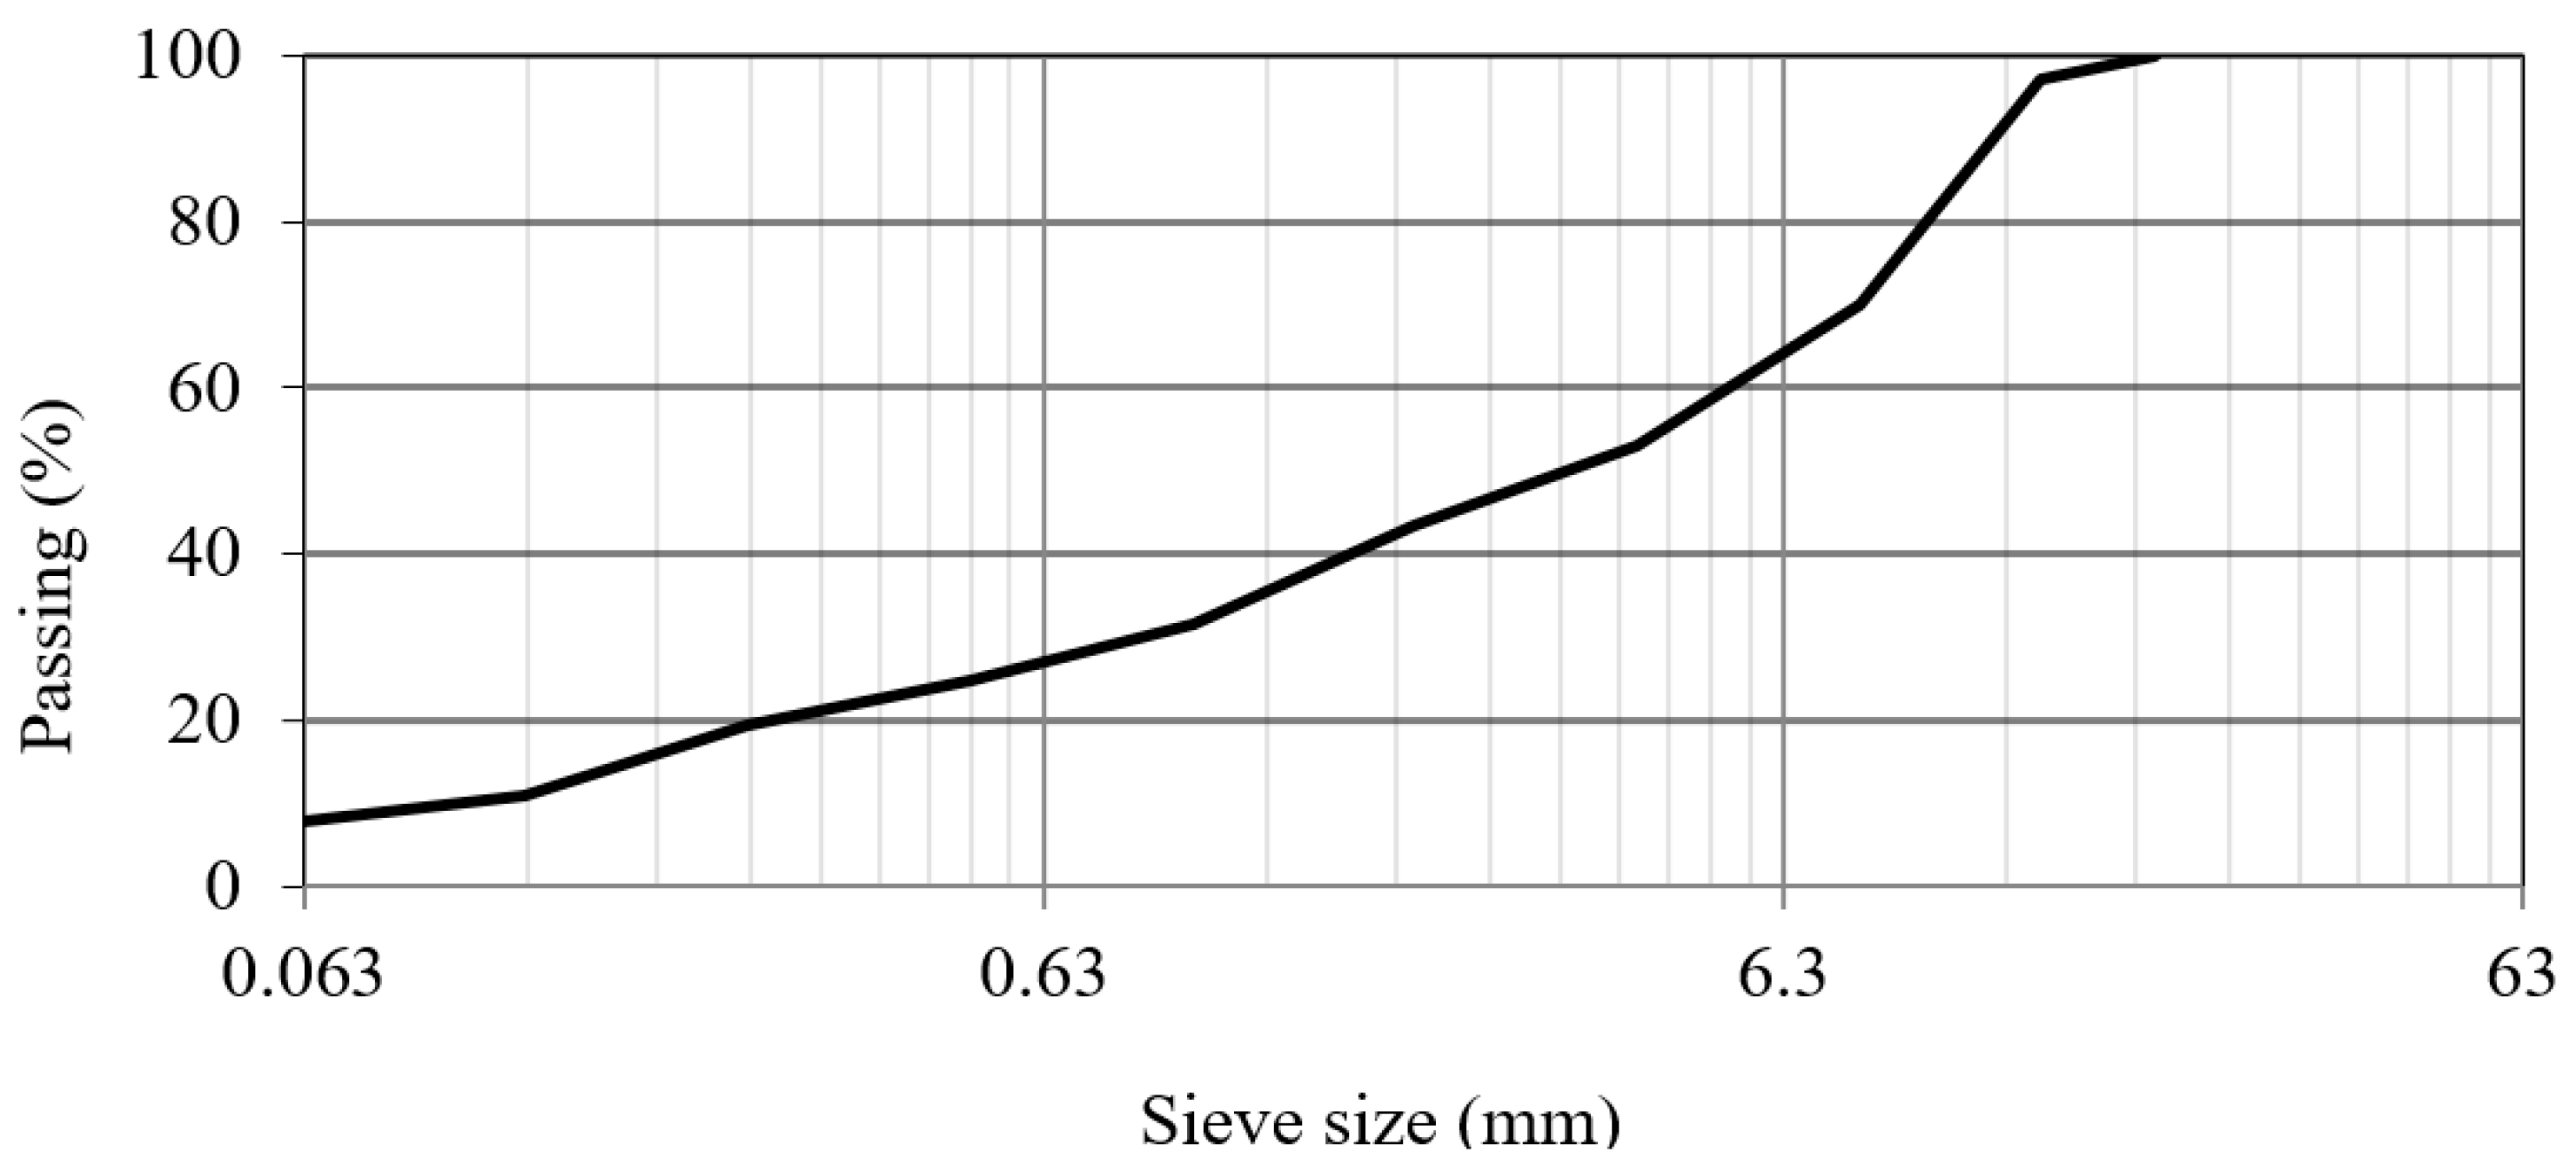
Figure 1. Grading curve of the designed mixture.
Applsci 09 02459 g001
Figure 2. Experimental setup; (Left) schematic view of the setup, (Right) specimen, camera, and LED spots placed in front of the UTM, only the top camera is active and the whole system is covered with a black plastic cover.
Applsci 09 02459 g002
Figure 3. Resilient modulus and resilient horizontal strain of the specimen recorded by the universal testing machine (UTM) during the tests.
Applsci 09 02459 g003
Figure 4. Number of the facets with horizontal strain higher than 10 µE (P) over the total number of facets (Ptotal) including the definition of healing time (HT), percentage of the strain recovery (H%), and strain recovery speed (SR).
Applsci 09 02459 g004
Figure 5. Horizontal strain map of the three samples at the termination cycle of the first step of the experiment calculated by Istra 4D, termination cycles: S1 = 6517, S2 = 2415, S3 = 3585.
Applsci 09 02459 g005
Figure 6. Horizontal strain of specimen S1 at the end of step 1 (left), and the mean horizontal strain of five selected areas(right), the vertical dash-dot line shows the stopping moment of step 1 and start of step 2.
Applsci 09 02459 g006
Figure 7. Five areas on the microcrack 1 of specimen S1 during the second step (healing), (a) 0 min, (b) 32 min, (c) 360 min.
Applsci 09 02459 g007
Figure 8. Mean horizontal strain on five areas of Figure 7, the vertical dash-dot line shows the stopping moment of step 1 and start of step 2.
Applsci 09 02459 g008
Figure 9. P/Ptotal calculated by digital image correlation (DIC) for three identical asphalt concrete specimens (S1–S3).
Applsci 09 02459 g009
Table 1. Basic properties of the 35/50 penetration grade bitumen.
Penetration (1/10 mm)37
Softening point (°C)54.3
Fraass breaking point (°C)−10
Table 2. Mixture composition (by aggregate mass).
Limestone 6.3/1439.8%
Limestone 2/6.314.0%
Limestone 0/230.0%
River sand 0/17.5%
Filler (filler 15)8.7%
Table 3. Healing parameters of three identical asphalt samples using the data acquired by the UTM and DIC.
UTMDIC
EIRIHT [min]H%SR [µε/min]
S10.860.993142.30.0028
S20.860.922318.870.0020
S30.940.993421.980.0018
Average0.890.9729.3327.720.0022
SD0.050.045.6912.720.0005