Article

Data Driven Leakage Detection and Classification of a Boiler Tube

School of IT Convergence, University of Ulsan, Ulsan 44610, Korea
*
Author to whom correspondence should be addressed.
Appl. Sci. 2019, 9(12), 2450; https://doi.org/10.3390/app9122450
Submission received: 7 May 2019 / Revised: 5 June 2019 / Accepted: 13 June 2019 / Published: 15 June 2019
(This article belongs to the Special Issue Machine Fault Diagnostics and Prognostics)

Abstract

:
Boiler heat exchange in thermal power plants involves tubes to transfer heat from the fuel to the water. Boiler tube leakage can cause outages and huge power generation loss. Therefore, early detection of leaks in boiler tubes is necessary to avoid such accidents. In this study, a boiler tube leak detection and classification mechanism was designed using wavelet packet transform (WPT) analysis of the acoustic emission (AE) signals acquired from the boiler tube and a fully connected deep neural network (FC-DNN). WPT analysis of the AE signals enabled the extraction of features associated with the different conditions of the boiler tube, that is, normal and leak conditions. The deep neural network (DNN) effectively explores the salient information from the wavelet packet features through a deep architecture instead of considering shallow networks, such as k-nearest neighbors (k-NN) and support vector machines (SVM). This enhances the classification performance of the leak identification and classification model developed. The proposed model yielded a 99.2 % average classification accuracy when tested with AE signals from the boiler tube. The experimental results prove the efficacy of the proposed model for boiler tube leak detection and classification.

1. Introduction

Thermal power plants generate electrical power from heat energy. The heat energy is converted to electrical power mostly through steam-driven turbines. Steam is produced by heating the water with the help of heating sources, such as fossil fuel, nuclear heat energy, and solar heat energy. The steam generated spins a steam turbine that drives an electrical generator, thus producing electrical power that is then added to the grid through the main transformer [1,2,3]. Thermal power plants are becoming more successful due to technological advancements, and demand for them is increasing [4]. One reason for their success and increasing demand is their low construction cost and reduced transmission cost [5,6].
The heat exchanger of the boiler in thermal power plants consists of thousands of tubes that transfer heat from one fluid to another [7]. Over the operation period, these tubes may develop defects that can cause fluid leakage. Leakage may be due to overheating, foreign matter flow, or tube wall deterioration due to machining. Such leakage affects power plant operation and can cause unexpected downtime of the plant with a longer outage and significant loss in power generation. In addition, such leakage can affect the adjacent components and sometime results in an explosion with the destruction of the whole boiler [8]. Moreover, with the failure of the system, other factors such as economic losses and safety risk are also possible. Thus, leakage detection is necessary to avoid all of the problems associated with it. One possible and efficient solution is to perform condition-based maintenance of the boiler tubes. This condition-based maintenance of the boiler tube is attained through data-driven condition maintenance (leakage detection) of the tubes. There are two main steps in the data-driven condition maintenance of an object: (1) data acquisition that contains valuable information about the condition of the object; and (2) preprocessing and classification of the data acquired. If there is recorded information about the boiler tube, then it can be categorized whether a certain record belonged to the boiler tube when it was working in a normal condition or in a leakage state. Thus, the leakage detection can be considered and solved as a classification problem. The data on the health states of the boiler tube can be recorded in the form of ultrasonic signals, electrical resistance measurement, and acoustic emissions [9,10,11,12,13,14,15]. Out of these techniques, acoustic emission (AE) collection is popularly used to acquire data from the deteriorated objects. AE sensors, due to their high sensitivity, can record activity generated due to slight variation in the physical state of an object [16]. Therefore, information collection with the help of AE sensors about the condition of boiler tubes is a good choice.
There is not enough research related to data-driven condition monitoring of the boiler tubes in thermal power plants. The existing works are mostly regard manual monitoring of the data collected from boiler tubes [17]. This is being done by visualizing the change in the collected data manually and then identifying the leakage manually. There is no intelligent process in place that can automatically identify when leaks appear in the tubes. The present study designed a system that can automatically identify whether a collected sample (AE signal) belongs to the normal or leakage state of the boiler tubes. The recorded AE signal from the boiler tube contains valuable salient information about the health sate of the boiler tube. When a leak appears on a tube, the characteristics of AE signals, that is, amplitude, frequency, and so on, also change accordingly. However, the signals recorded from the boiler tubes are highly complex and nonlinear. Therefore, leakage of the boiler tubes cannot be detected only by visualization of the AE waveforms. Furthermore, a classifier does not yield satisfactory results with raw AE signals as inputs. For this reason, a preprocessing setup is required that can extract features from the recorded AE signals. The extracted features act as descriptors of the health state of the boiler tubes. The better the descriptors are, the higher quality the classification results will be. Therefore, selection of an appropriate signal processing technique for feature extraction is very important. In this regard, wavelet packet decomposition of AE signals was carried out in the current study. The relative energy and the entropy of the subbands are used as the descriptors to describe the health state of the boiler tubes. The features extracted are classified into these classes using a deep neural network (DNN). A DNN is a variation of an artificial neural network with more than one hidden layer. Due to its deep architecture, a DNN can obtain high accuracy with satisfactory classification performance.
The remainder of this research article is as follows. Section 2 describes the boiler tube leakage detection model developed. In Section 3, the data acquisition and experimental setup are explained. In Section 4, the results of the current study are presented in detail. The conclusions are given in Section 5.

2. Methods and Procedures for Leakage Classification of the Boiler Tube

In Figure 1, the proposed boiler tube leakage classification model is given. The proposed model can be divided into three main steps: (1) feature extraction through wavelet packet transform (WPT) analysis; (2) deep neural network (DNN) implementation for higher level feature extraction, which is a reduced feature set that contains highly discriminant information; and (3) provision of the reduced feature set to the SoftMax classifier to complete boiler tube leakage classification (i.e., normal state and leak state classification of the Boiler tube data).

2.1. Wavelet Packet Decomposition

The acoustic emission (AE) signals acquired from the boiler tube are used to record information about the health state of the tube in the time domain. The signal waveform represents the signal amplitude values (voltage) recorded at specific time intervals. During the signal acquisition process, the signal amplitude values vary randomly. There is no clear pattern in the time domain waveform of the signals. Moreover, the inclusion of unwanted signals from the surrounding environment in the form of noise makes leak detection and classification more difficult just by observing the time domain values of the signals. To thoroughly analyze the signals for the extraction of descriptive features associated with different health states of the boiler tube, a sophisticated signal processing technique is required. There are several signal analysis techniques in the literature, like, traditional fast Fourier transform (FFT), short-time Fourier transform (STFT), empirical mode decomposition (EMD). All of these techniques have been implemented in the literature for different types of signal analysis in the fault diagnosis domain, but these techniques either have limited signal analysis capacity or have hectic computation procedures. For instance, the Fourier transform cannot provide time information of the analyzed signals. Similarly, STFT has the problem of fixed resolution [18]. Choosing an appropriate windowing function is a challenge in the STFT calculation. A narrow window provides good time resolution, whereas a wider window yields better frequency resolution. Always there will be a tradeoff while selecting the window size. In EMD, intrinsic mode functions (IMFs) are calculated and cannot be predicted before they are observed empirically. Moreover, the number of IMFs cannot be predicted before the decomposition. In EMD, oscillations in a signal are considered at the very local level. Their calculation involves detailed signal processing techniques like extrema identification, interpolation and residual calculation of a signal. Thus, EMD calculation depends on a number of options which need signal processing expertise from the user. Moreover, in EMD, the iterative calculation of the IMFs increases the latency of the algorithm. Therefore, it is not recommended to provide online solutions [19]. Therefore, in this study, a wavelet packet transform (WPT) based AE signal analysis was performed, which provided better time-frequency resolution and lower latency of the algorithm. WPT provides better time-frequency resolution compared to short-time Fourier transform (STFT). This turns out to be a promising tool to extract health state features from complex AE signals. WPT is a variant of a basic wavelet transform that divides the input signals into different subbands based on the high pass and low pass filters. In WPT, a signal is decomposed according to the criteria that at each level j the number of nodes is 2 j . In WPT, both detailed and approximated coefficients are decomposed to form a binary tree contrary to the discrete wavelet transform (DWT). In this way, WPT provides a more detailed time-frequency, on both lower and higher frequencies of the signals, than conventional DWT analysis. Each node in a specific level in DWT provides half the frequency resolution width of the preceding level and twice that of the next level. In this study, fourth-level decomposition of acoustic emission signals was carried out. Level 4 decomposition of the signals resulted in 2 4 = 16 nodes. Figure 2 shows the adopted 4-level WP tree structure.
After decomposition of the AE signals, the relative energy and entropy of each node were calculated. The wavelet values were used as input features to the subsequent DNN. The relative energy of a subband can be calculated as follows:
R E j i = E n j i E n T o t a l ,   i = 1 2 j ,
where E n j i is i t h node energy at the level j and E n T o t a l is the overall energy of a signal. E n j i and E n T o t a l can be calculated as presented in (2) and (3), respectively.
E n j i = τ = t 0 t ( f j i ( τ ) ) 2
E n T o t a l i = j E n j i ( τ )
The entropy of a wavelet packet node can be calculated as:
E T = j = 1 i s i log 2 s i .
The relative energy and entropy vectors at level 4 were used as input feature vectors for the DNN.

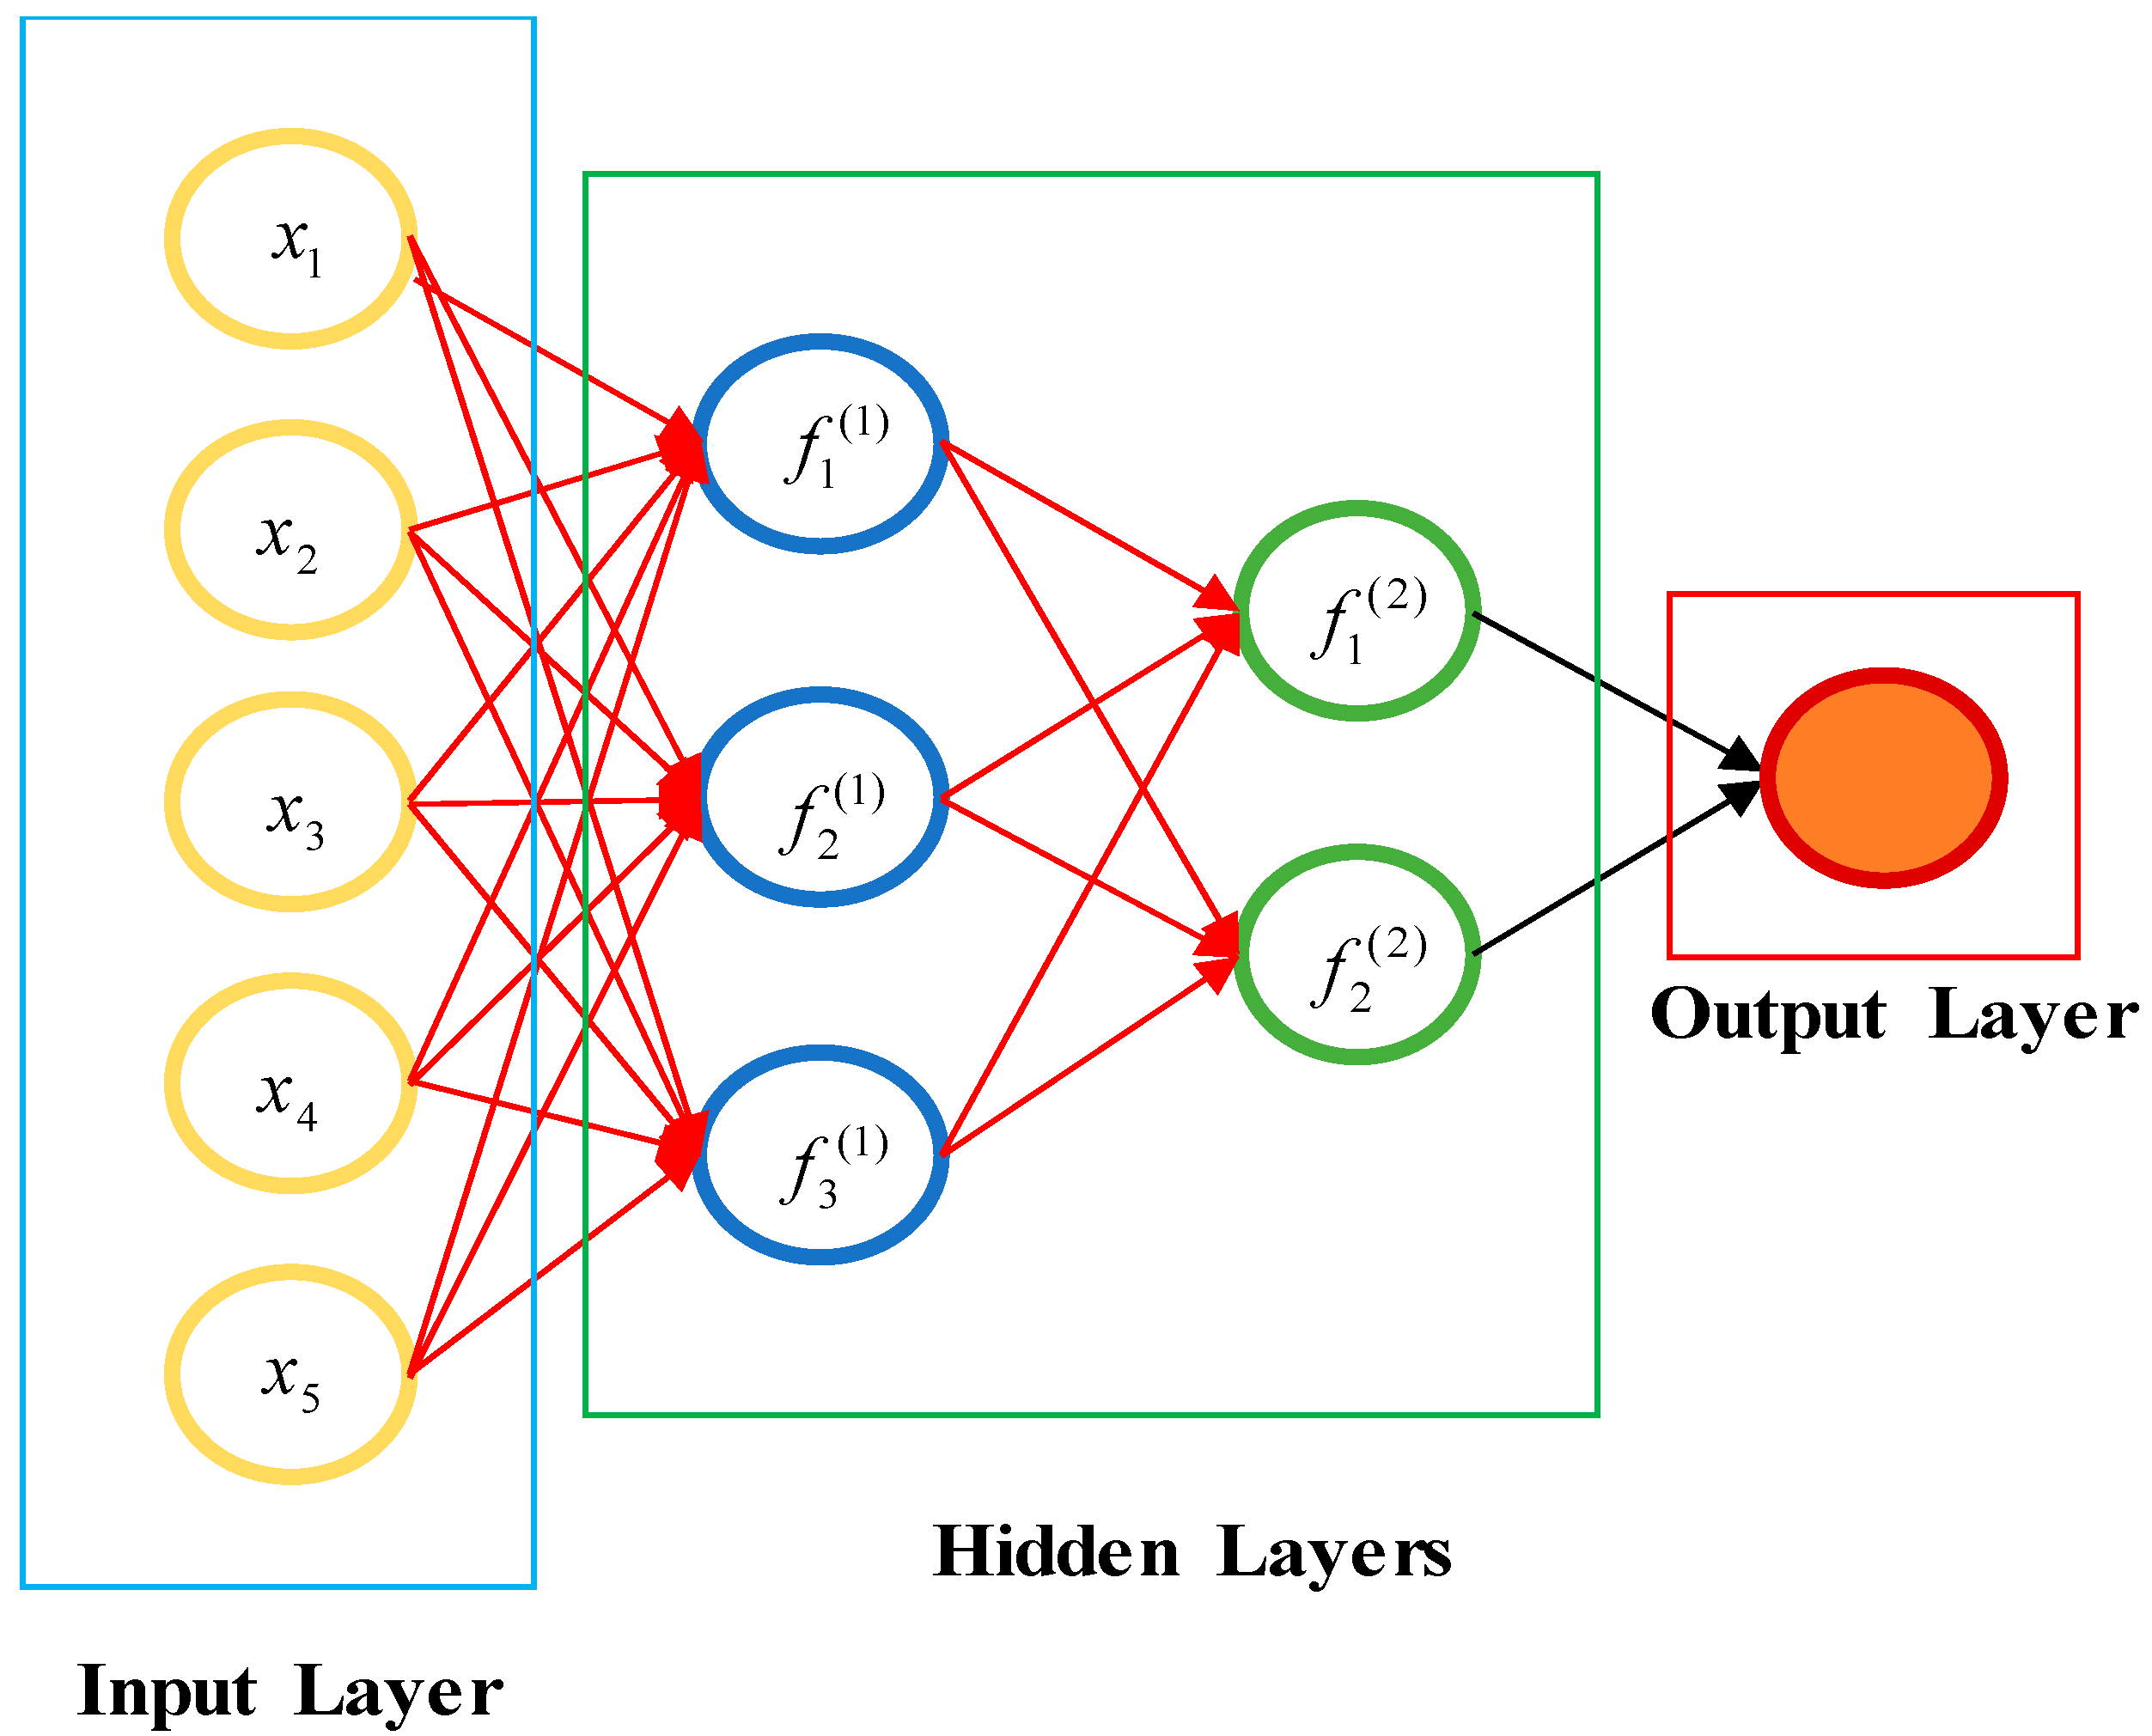
2.2. Deep Neural Network (DNN)

Recently, researchers have introduced deep learning or DNN techniques, which have been used in numerous fields, especially image processing. DNN can reduce the data dimensionality and effectively map the input to the outputs. Moreover, one interesting property of a deep network is that it can explore the salient information from the input data efficiently without expert knowledge in a specific field. Such networks are popular in fields that require nonlinear mapping. In the current work, a sophisticated signal processing method was adopted to analyze AE signals while not relying on traditional handmade features where in-depth domain expertise is needed.
In a DNN, multiple layers of units are stacked on each other to create a deep or hierarchical structure, as presented in Figure 3. There is connectivity between the layers of the DNN, but no connectivity among the units of the same layer. A typical DNN consists of one input layer, one output layer, and one or multiple hidden layers. The input and output layer dimensions of the DNN are selected according to the input data and output classes, respectively. There is no specific rule for hidden layer dimension selection. Normally, the number of units in the hidden layers is set to less than the preceding layer.
Backpropagation (BP) was applied to fine tune the DNN and reduce the cost function. The cost function was updated negatively to the gradients of the cost function. Once the training and fine tuning of the DNN were completed, the trained model was used to identify the samples that belong to the leakage of the boiler tube.

2.3. k-Nearest Neighbor (k-NN) Classifier

k-NN is the simplest and most frequently used classifier in the classification problems related to the fault diagnosis domain. It is a non-parametric classifier with no specific training step required for the algorithm. It does not make an assumption for the classification of the data; however, classification depends on the structure of the data by itself. Moreover, during classification, whole data resides in the memory, hence increasing the computational complexity in case of large datasets. In this study, the k-NN classifier was used as one of the algorithms for comparison purposes. The value of k was selected arbitrarily and through the cross validation process and turned out to be 5.

2.4. Support Vector Machine (SVM)
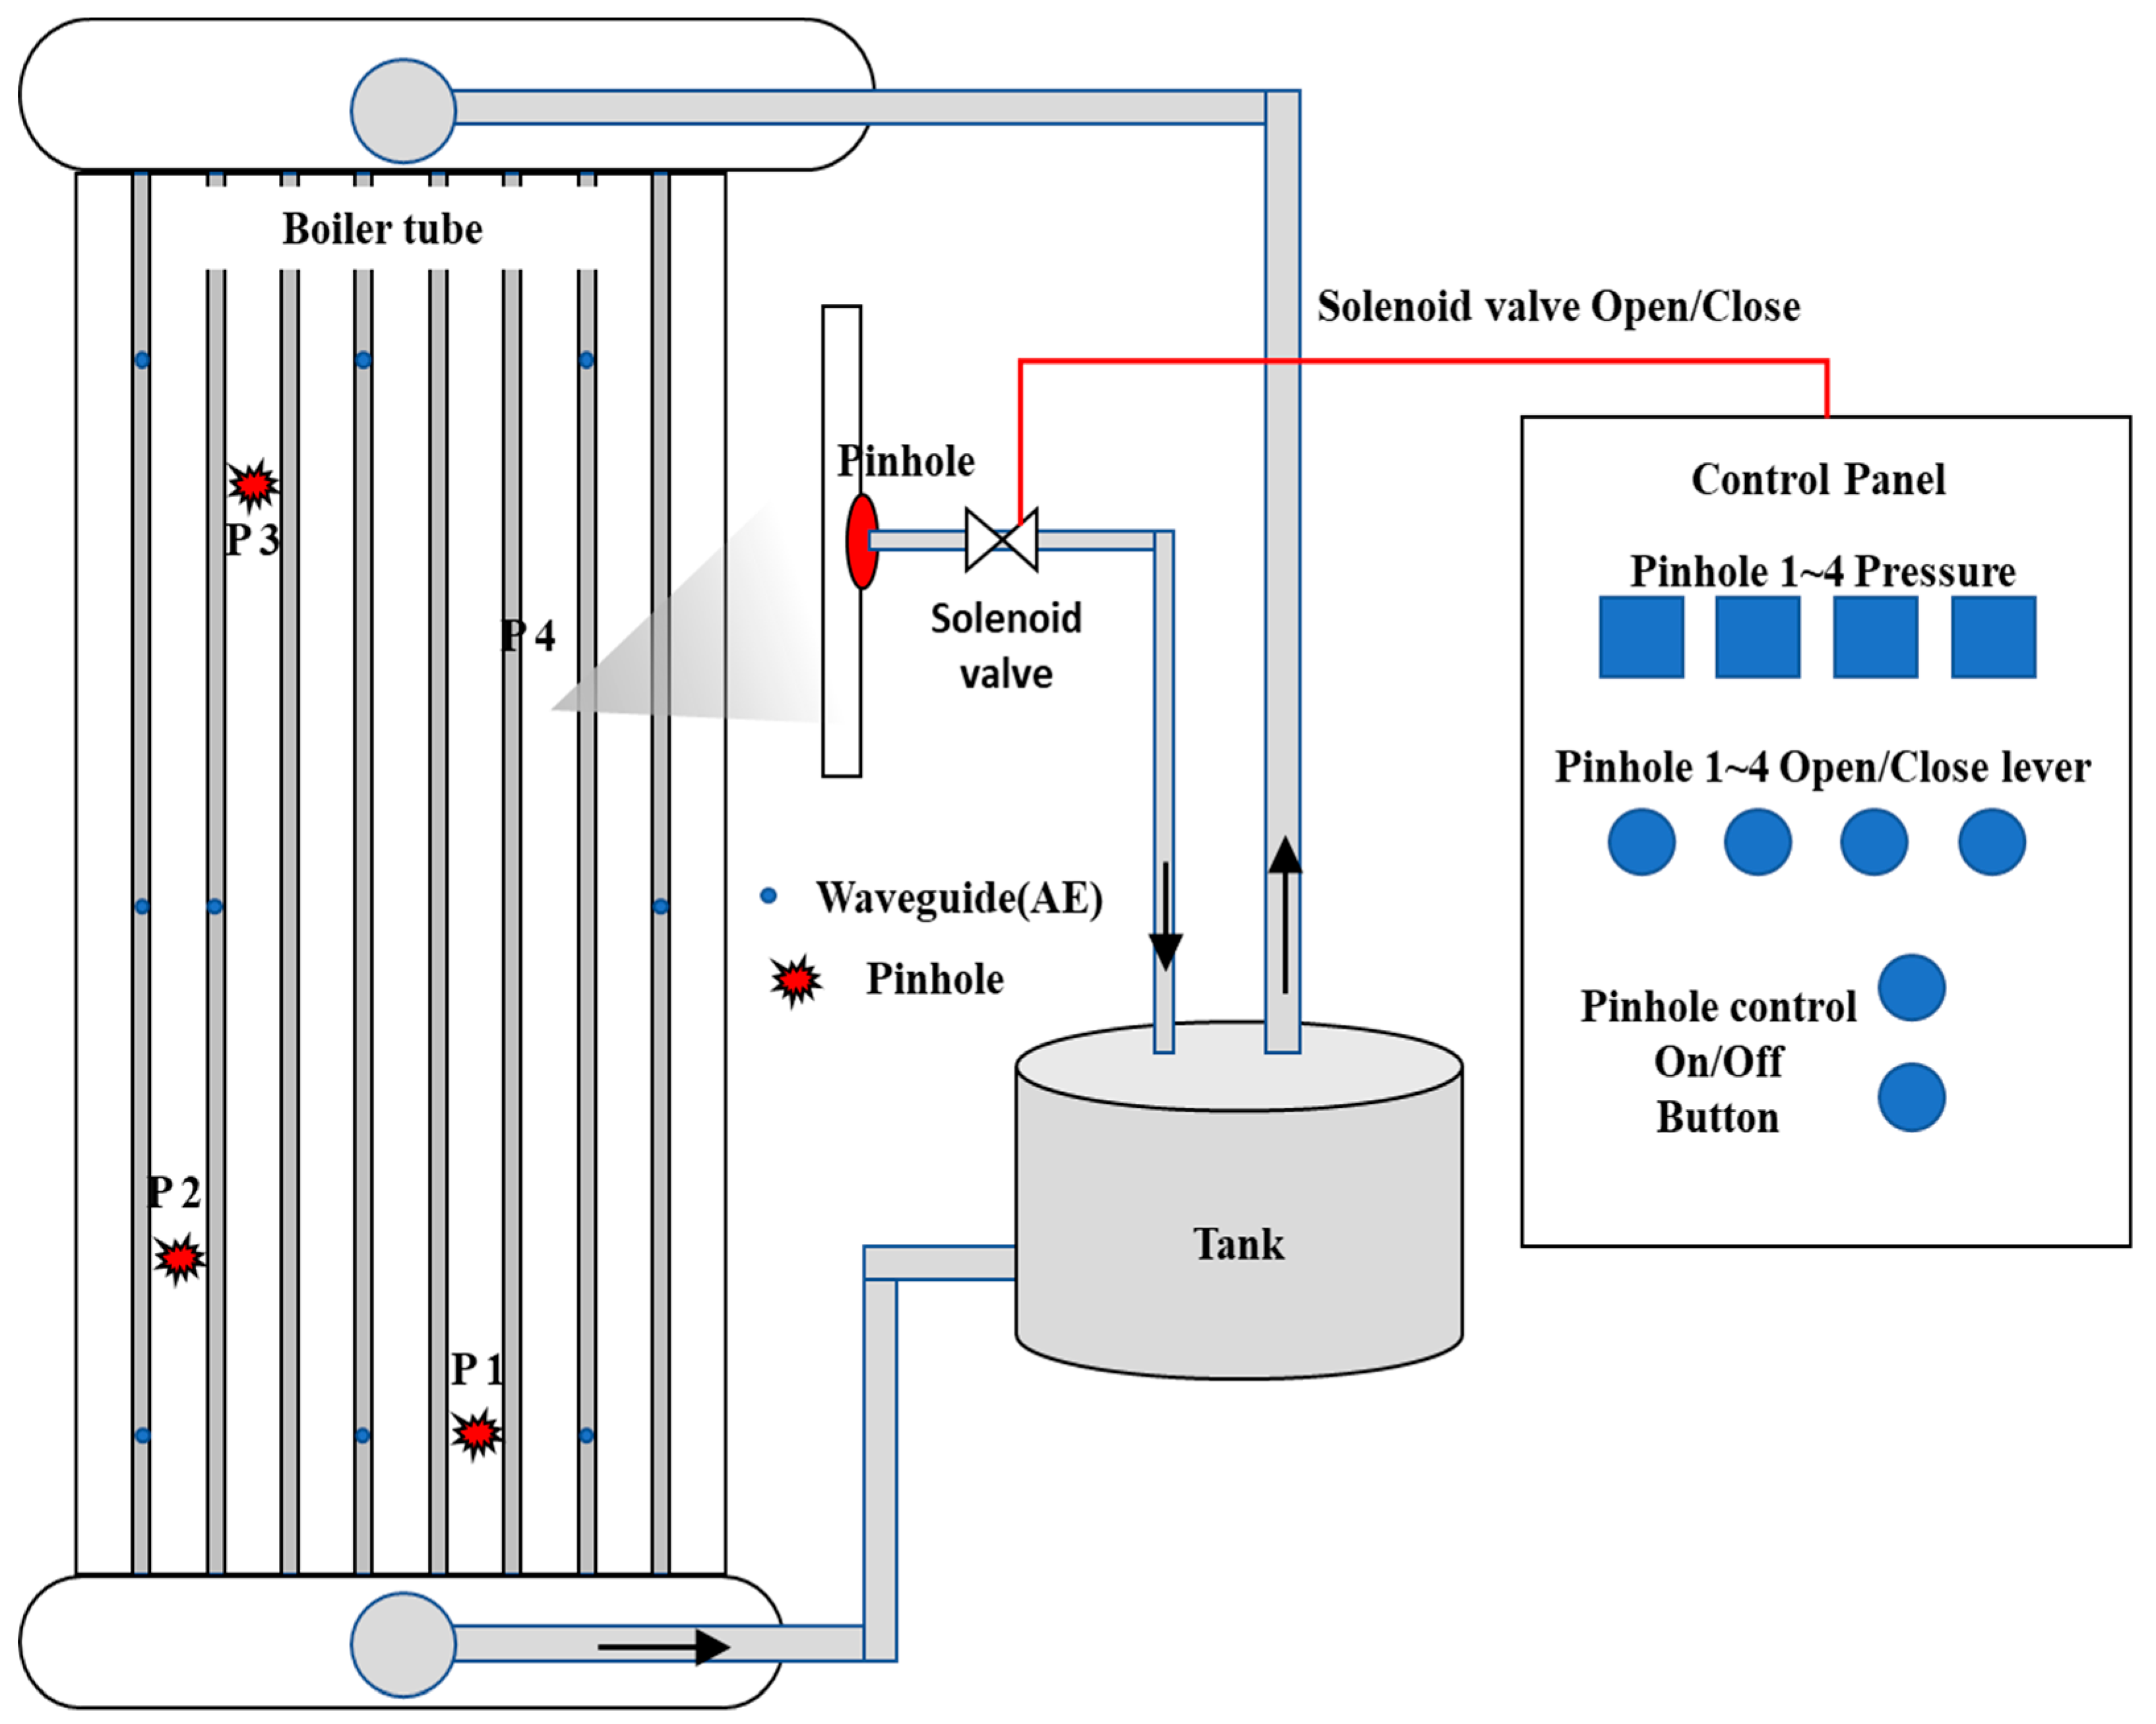
The support vector machine (SVM) belongs to the supervised learning models category of machine learning. SVM is a discriminative algorithm that separates the instances of different classes using a hyperplane. It calculates an optimal hyperplane that separates the label data in the best possible way. In this work, in addition to k-NN, SVM with a gaussian kernel was used as a second classifier for comparison purposes.

3. Dataset

This study presents leakage detection and classification of boiler tubes in a thermal power plant with the help of acoustic emission signals and machine learning. Boiler tubes used to collect AE signals for the experiment can be seen in Figure 4. Pinholes were seeded on the tube at four different locations. The pinholes were seeded to simulate leakage of the boiler tube. The locations of the seeded pinholes can be seen in Figure 5. The seeded pinholes were 0.6 mm, 1 mm, and 2 mm in diameter. Pinholes of different sizes were used in the experiment. A typical installation of a pinhole on a boiler tube is shown in Figure 6. Moreover, illustration of the testbed and control system developed for the experiment is given in Figure 7. Solenoid valves were attached to the pinhole so that they could be remotely controlled from the control room. The valves were needed to open and close the pinholes to simulate the boiler tube in different conditions, that is, normal and leak states. The schematic diagram of the whole testbed is given. First, the solenoid valves were kept closed so that AE signals for the normal condition of the boiler tube could be collected. For the normal state of the boiler tube, multiple 2 sec AE signals were recorded. Later, the valve was opened to record the signals related to the leak state of the boiler tube. Further, multiple 3 sec signals were recorded for the leak state. The AE signals were recorded with the help of wideband differential AE sensors (WDI-AST) and peripheral component interconnect (PCI-2)-based data acquisition devices. AE signals of variable length were collected, both for normal and leak states containing 50 samples for every pinhole size. The signals were segmented to produce enough dataset for the algorithm developed. The dataset description and the division into training and test sets are given in Table 1.

4. Performance Evaluation and Results

Acoustic emission signals recoded from the boiler tube under two different conditions (normal, leak) were used to evaluate the leakage identification model developed. The dataset consists of AE signals that were recorded under 0.6 mm, 1 mm, and 2 mm pinholes on the boiler tube. This study has two main parts: (1) wavelet packet decomposition of the AE signals to explore the salient information; and (2) deep neural network adoption for the classification of input data and to identify the samples belonging to the leakage. In Figure 8, AE signals associated with the two different conditions of the boiler tube are given. It can be observed that there are no visible differences between the signals belonging to the two different conditions. Signals under both conditions possess the same pattern of variation with respect to time. Thus, it is hard to identify the signals associated with the leak state of the boiler just by monitoring them. Therefore, in this work, 4-level wavelet packet decomposition was applied to the AE signals associated with both conditions. The 4-level wavelet decomposition resulted in 16 nodes in the last layer of the wavelet tree. The wavelet packet decomposes the signal into a sub-band that provides detailed information, both in the time and frequency domains. After the decomposition, the relative energy and entropy of each subband from the last level of the wavelet tree were computed. Each feature vector for a given sample is 14 points long. The distribution of the two wavelet features is presented in Figure 9. It is evident from the figure that both of the features form a fine cluster with no overlap among the features from different classes.
To classify the data, a deep neural network was used in the current study. The deep architecture of the DNN and the adaptation of the nonlinear activation function make the DNN very effective in learning salient information from the input data. The design parameters of the adopted DNN are given in Table 2. The design parameters were selected based on the cost function of the DNN. The parameters given in Table 2 yielded optimal values for the cost function. The results presented in this paper are according to this architecture.
The performance of the leakage classification and identification model developed was evaluated using the k-fold cross validation technique and is given in Figure 10. The dataset obtained was split among training, validation, and test datasets, with approximately 50, 20, and 30 percent of the data, respectively. In the figure, a confusion matrix and the class-wise accuracies of the proposed model are given. It can be observed that the average accuracy of the developed model is 99.2%. This means the proposed model could accurately classify most of the instances present in the test set. Specifically, the proposed model could correctly classify 99% of the samples in the normal class, whereas 99.4% of the samples associated with the leak state of the boiler tube were correctly classified. The model developed could yield enhanced classification performance because it was initially trained well on the wavelet features. Due to the deep architecture, the DNN could easily extract salient information from the distinct wavelet features. The features were already well clustered and had a non-overlapping distribution pattern that made the information extraction and classification task easy for the DNN.
To endorse the efficacy of the developed model, a comparison of the results was made with the traditional k-nearest neighbors algorithm (k-NN) and the support vector machine (SVM) algorithm. These two algorithms are very popular for developing intelligent systems and industrial equipment fault diagnosis. DNN in the model developed was swapped with the k-NN and SVM algorithms. Both models were provided with the same set of features used in the proposed study. The experiment was repeated multiple times for stable results. The results for the k-NN and SVM algorithms are also listed in Figure 10b. It can be perceived that the performance of the proposed model surpassed that of k-NN and SVM. The average accuracy of the model developed is 99.2%, compared to k-NN and SVM which have 69.35% and 81.85% accuracies, respectively.
Furthermore, the results of the proposed model were also compared with published studies on the fault diagnosis of different objects using AE signals. One of the comparisons was based on a study in which a hybrid feature pool, principal component analysis (PCA) and k-NN classifier were used for fault classification of a mechanical system [20]. Similarly, in another published study, genetic algorithm (GA)-based feature selection and DNN were applied for the classification of AE signals obtained from a pressure vessel [21]. The third study consisted of a statistical feature pool (SFP) and support vector machine (SVM) for leakage detection of a spherical tank using AE signals [22]. The comparison results in terms of average classification accuracy and execution time are presented in Table 3. The proposed model had a longer execution time (11.8 seconds) to yield the desired result compared to the other algorithms. However, it is evident from the comparison results that the proposed model outperformed all of the other algorithms. The average classification accuracies of PCA + KNN, GA + DNN, SFP + SVM, and the proposed model are 91.65%, 94.67%, 95%, and 99.2%, respectively. Thus, the improvement in classification performance using the proposed model is at least 4.25% compared to the rest of the algorithms. Therefore, it is obvious that the proposed model is superior for detecting and classifying leaks in a boiler tube.

5. Conclusions

In this paper, a leak detection and classification model of a boiler tube was presented. The main objective of this work was to perform data-driven health assessment of boiler tubes that are normally used in thermal power plants. To achieve this, acoustic emission signals were recorded for normal and leaked states (0.63 mm, 1 mm, 2 mm) of a boiler tube. To explore the salient information of the AE signals, wavelet packet decomposition of the signal was carried out. The relative wavelet packet energy and entropy of the nodes were considered as features for leakage detection and the classification model. The wavelet packet decomposition provides a unique pattern for the feature distribution that could easily help differentiate between the health states of a boiler tube. The wavelet features extracted were provided to a deep neural network (DNN). Stacked autoencoders could easily extract salient information from the well clustered input data. The results of the proposed model were superior compared to the other state-of-the-art fault diagnosis algorithms. The proposed model yielded an average classification accuracy of 99.25%, which is at least 4.25% better than any of the state-of-the-art fault diagnosis algorithms to which it was compared. Therefore, it can be concluded that the proposed model can be used to effectively detect and classify leaks in a boiler tube.

Author Contributions

All of the authors contributed equally to the conception of the idea, the design of experiments, the analysis and interpretation of the results, and the writing of the manuscript.

Funding

This work was supported by the Korea Institute of Energy Technology Evaluation and Planning (KETEP) and the Ministry of Trade, Industry & Energy (MOTIE) of the Republic of Korea (No. 20161120100350).

Conflicts of Interest

The authors declare no conflicts of interest.

References

  1. Lee, S.B.; Roh, S.M. Developing an early leakage detection system for thermal power plant boiler tubes by using acoustic emission technology. J. Korean Soc. Nondestruct. Test. 2016, 36, 181–187. [Google Scholar] [CrossRef]
  2. Kapooria, R.K.; Kumar, S.; Kasana, K.S. An analysis of a thermal power plant working on a Rankine cycle: A theoretical investigation. J. Energy South. Afr. 2008, 19, 77–83. [Google Scholar] [CrossRef]
  3. Walls, F.M. Thermal Power Plant Utilizing Compressed Gas as Working Medium in a Closed Circuit including a Booster Compressor. U.S. Patent 2,829,501, 8 April 1958. [Google Scholar]
  4. Kaushik, S.C.; Reddy, V.S.; Tyagi, S.K. Energy and exergy analyses of thermal power plants: A review. Renew. Sustain. Energy Rev. 2011, 15, 1857–1872. [Google Scholar] [CrossRef]
  5. Kim, Y.-H.; Jeong, I.-K.; Kim, J.-Y.; Ban, J.-K.; Kim, J.-M. Development of an Intelligent Diagnosis System for Detecting Leakage of Circulating Fluidized Bed Boiler Tubes. In Proceedings of the International Conference on Hybrid Intelligent Systems, Porto, Portugal, 13–15 December 2018; Springer: Cham, Switzerland, 2018; pp. 311–320. [Google Scholar]
  6. Powell, K.M.; Edgar, T.F. Modeling and control of a solar thermal power plant with thermal energy storage. Chem. Eng. Sci. 2012, 71, 138–145. [Google Scholar] [CrossRef]
  7. Shah, R.K.; Sekulic, D.P. Fundamentals of Heat Exchanger Design; John Wiley & Sons: Hoboken, NJ, USA, 2003; ISBN 0471321710. [Google Scholar]
  8. Widarsson, B.; Dotzauer, E. Bayesian network-based early-warning for leakage in recovery boilers. Appl. Therm. Eng. 2008, 28, 754–760. [Google Scholar] [CrossRef] [Green Version]
  9. Blitz, J. Electrical and Magnetic Methods of Non-Destructive Testing; Springer Science & Business Media: Dordrecht, The Netherlands, 1997; ISBN 978-94-010-6457-6. [Google Scholar]
  10. Guyott, C.C.; Cawley, P.; Adams, R.D. The Non-destructive Testing of Adhesively Bonded Structure: A Review. J. Adhes. 1986, 20, 129–159. [Google Scholar] [CrossRef]
  11. Pollock, A.A. Acoustic emission-2. Acoustic emission amplitudes. Non-Destr. Test. 1973, 6, 264–269. [Google Scholar] [CrossRef]
  12. Niccolini, G.; Durin, G.; Carpinteri, A.; Lacidogna, G.; Manuello, A. Crackling noise and universality in fracture systems. J. Stat. Mech. Theory Exp. 2009, 2009, P01023. [Google Scholar] [CrossRef] [Green Version]
  13. Bontea, D.-M.; Chung, D.D.L.; Lee, G.C. Damage in carbon fiber-reinforced concrete, monitored by electrical resistance measurement. Cem. Concr. Res. 2000, 30, 651–659. [Google Scholar] [CrossRef]
  14. Niccolini, G.; Borla, O.; Accornero, F.; Lacidogna, G.; Carpinteri, A. Scaling in damage by electrical resistance measurements: An application to the terracotta statues of the Sacred Mountain of Varallo Renaissance Complex (Italy). Rend. Lincei 2015, 26, 203–209. [Google Scholar] [CrossRef]
  15. Hasan, J.; Islam, M.M.M.; Kim, J.-M. Acoustic Spectral Imaging and Transfer Learning for Reliable Bearing Fault Diagnosis under Variable Speed Conditions. Measurement 2019, 138, 620–631. [Google Scholar] [CrossRef]
  16. Li, Z.; Shah, S.P. Localization of microcracking in concrete under uniaxial tension. ACI Mater. J. 1994, 91, 372–381. [Google Scholar]
  17. Herzog, J.P. Kernel-Based Method for Detecting Boiler Tube Leaks. U.S. Patent 8,275,577, 25 September 2012. [Google Scholar]
  18. Mehala, N.; Dahiya, R. A comparative study of FFT, STFT and wavelet techniques for induction machine fault diagnostic analysis. In Proceedings of the 7th WSEAS International Conference on Computational Intelligence, Man-Machine Systems and Cybernetics, Cairo, Egypt, 29–31 December 2008. [Google Scholar]
  19. Rilling, G.; Flandrin, P.; Gonçalves, P. On empirical mode decomposition and its algorithms. In Proceedings of the 2003 IEEE-EURASIP Workshop on Nonlinear Signal and Image Processing, Grado, Italy, 8–11 June 2003. [Google Scholar]
  20. Kang, M.; Kim, J.; Wills, L.M.; Kim, J. Time-Varying and Multiresolution Envelope Analysis and Discriminative Feature Analysis for Bearing Fault Diagnosis. IEEE Trans. Ind. Electron. 2015, 62, 7749–7761. [Google Scholar] [CrossRef]
  21. Islam, M.; Sohaib, M.; Kim, J.; Kim, J.-M. Crack Classification of a Pressure Vessel Using Feature Selection and Deep Learning Methods. Sensors 2018, 18, 4379. [Google Scholar] [CrossRef] [PubMed]
  22. Sohaib, M.; Islam, M.; Kim, J.; Jeon, D.-C.; Kim, J.-M. Leakage Detection of a Spherical Water Storage Tank in a Chemical Industry Using Acoustic Emissions. Appl. Sci. 2019, 9, 196. [Google Scholar] [CrossRef]
Figure 1. The proposed boiler tube leakage detection model.
Applsci 09 02450 g001
Figure 2. A 4-level wavelet packet tree having 24 nodes.
Applsci 09 02450 g002
Figure 3. Schematic diagram of a deep neural network with multiple hidden layers.
Applsci 09 02450 g003
Figure 4. The boiler tube used to collect the acoustic emission signals for the experiment.
Applsci 09 02450 g004
Figure 5. Locations of the pinholes and waveguides.
Applsci 09 02450 g005
Figure 6. (a) Pinholes of different sizes used in the experiments; (b) a typical installation of a pinhole on the boiler tube.
Applsci 09 02450 g006
Figure 7. Testbed used for the experiment.
Applsci 09 02450 g007
Figure 8. (a) Normal condition signal; (b) signal from the leak state of the boiler tube.
Applsci 09 02450 g008
Figure 9. Wavelet features distribution.
Applsci 09 02450 g009
Figure 10. (a) Confusion Matrix of the proposed model; (b) Results (accuracy (%)) comparison of the proposed boiler tube leakage classification model with other state-of-the-art fault diagnosis models.
Applsci 09 02450 g010
Table 1. Dataset description.
Type of Signals Pinhole Size (mm)Training Samples Validation Samples Test Samples Number of Channels
Normal09003005004
Leak0.6, 1, 2900300500
Table 2. Structure of the adopted deep neural network (DNN).
Length of Each InputTotal Number of LayersNumber of Nodes in Each Layer
32315, 10, 5
Table 3. Comparison results of different algorithms.
MethodAverage Classification Accuracy (%)Execution Time (Seconds)
PCA + KNN [20]91.659.11
GA + DNN [21]94.6715.3
SFP + SVM [22]956.5
Proposed99.2511.8

