An Evaluation Framework to Support Optimisation of Scenarios for Energy Efficient Retrofitting of Buildings at the District Level
Abstract
Featured Application
Abstract
1. Introduction
- Assessment at district scale: the tool considers the interaction among buildings and analysis the potential existing when considering the district as a whole and analyses the inter-building interaction both in terms of passive and active relationships. This is done through the implementation of tools that can enrich the models through adding the shadows that affect the buildings under study [9] in order to perform an appropriate evaluation at district level. At the same time, technologies are proposed at district level, exploiting the synergies among buildings in terms of sharing energy systems and energy production [10].
- Use of Multiple-Criteria Decision Analysis: the evaluation framework is based on evaluating the performance of the candidate scenarios against a set of criteria in different fields, offering a more comprehensive evaluation and more informed decision making.
- Energy Conservation Measures (ECMs) catalogue: the tool provides a wide catalogue of existing technologies that can be implemented at different scales (zone, building, district) and different fields (passive, active, RES or control).
- Interoperability: the use of standards and the generation of a District Data Model ensure the interoperability among the tools that have been integrated for the processes of generating, evaluating and optimising the candidate retrofitting scenarios.
- Use of Integrated Project Delivery (IPD): the tool fosters the implementation of more collaborative approaches as IPD towards ensuring more informed decisions and improved processes compared to business-as-usual [7].
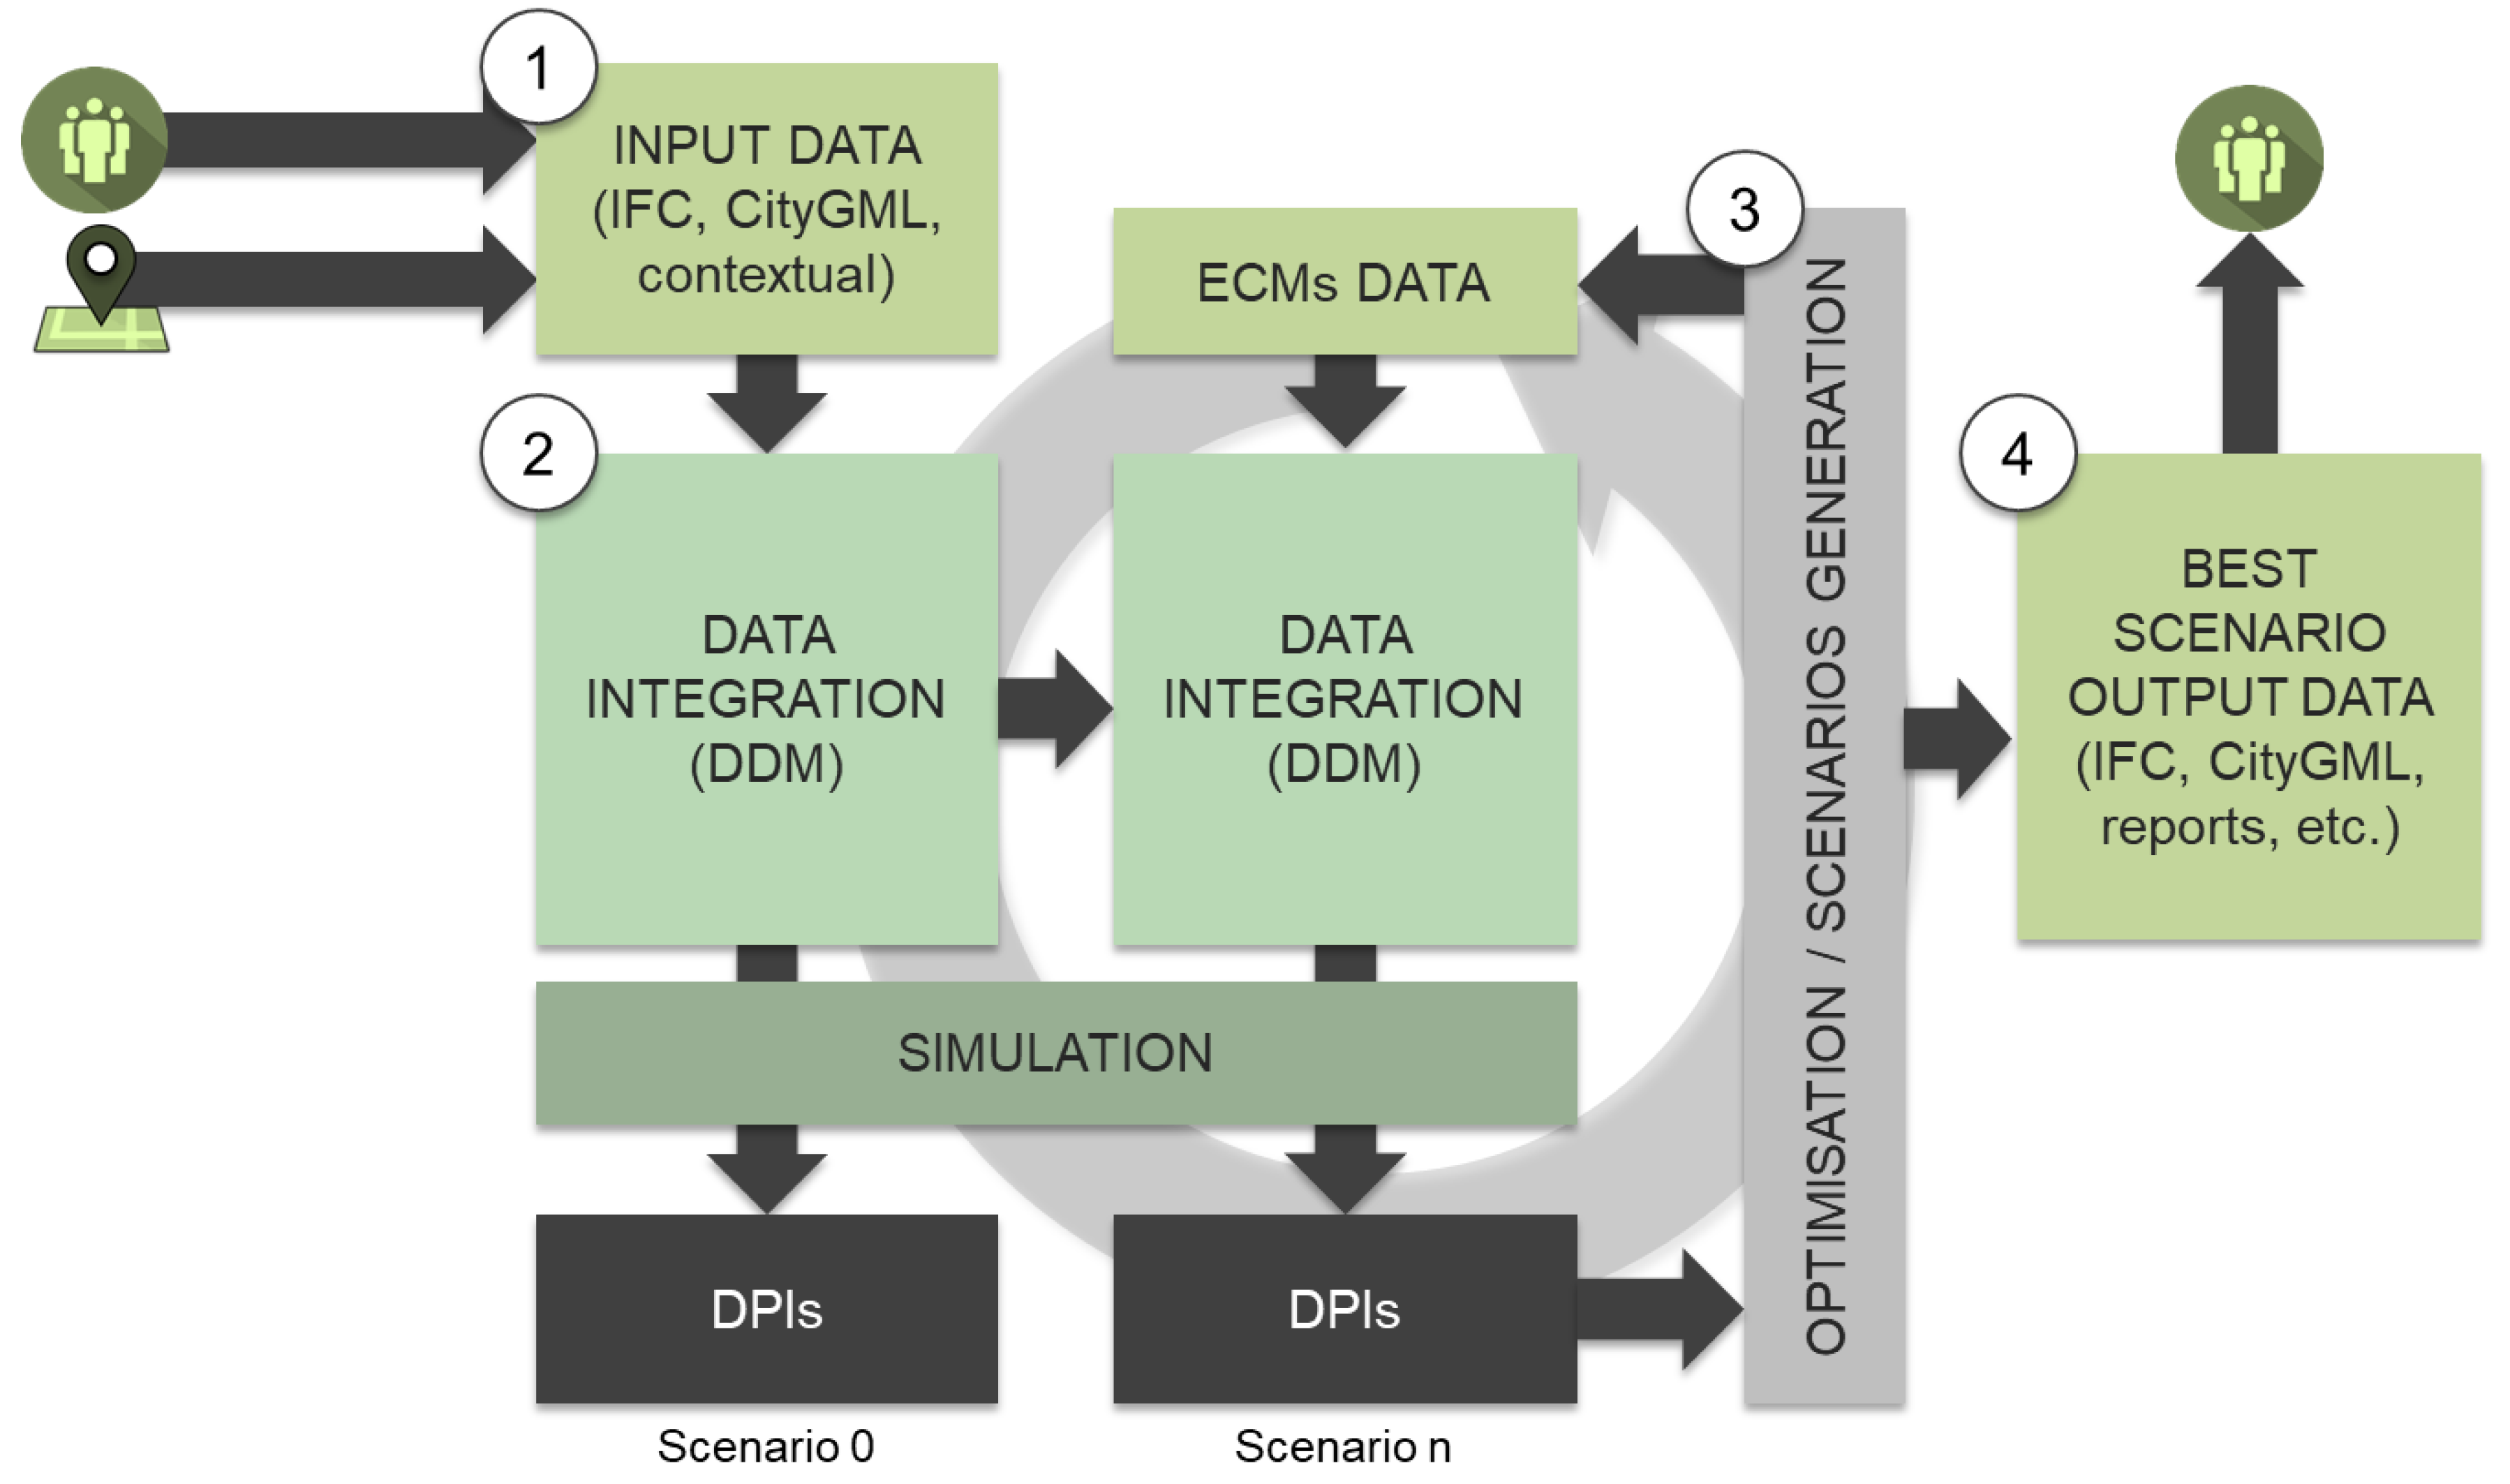
- Data insertion (1). Users insert the required data into the tool to perform the evaluation of the baseline and to create the candidate retrofitting alternatives.
- Data integration and baseline calculation (2). After the users have inserted the data, the OptEEmAL tool creates the first instance of the data model (baseline) and calculates the values of the relevant indicators to characterise its performance. For this, a set of simulation models are created and processed through simulation tools to retrieve and post-process these indicators which are calculated at district level.
- Scenarios generation and optimisation process (3). Once the baseline is calculated, the tool generates a set of candidate retrofitting scenarios based on implementing Energy Conservation Measures to the baseline model. These models are then calculated through the simulation tools integrated into the tool and provide the indicators that characterise their performance. Groups of scenarios are generated and evaluated until the stopping criteria are met.
- Outcomes exportation (4). After calculating the best scenarios, these are presented to the users of the tool who can select the most suitable and export all data that has been produced for it.
2. Platform Approach
2.1. Problem Definition
2.2. Simulation and District Performance Indicators (DPI) Calculation for the Baseline
2.3. Scenarios Generation Through an ECMs Catalogue
2.4. Evaluation and Optimisation
2.5. Finding the Best Results
3. Methodology: Development of the Evaluation Framework
3.1. Evaluation Criteria Selection
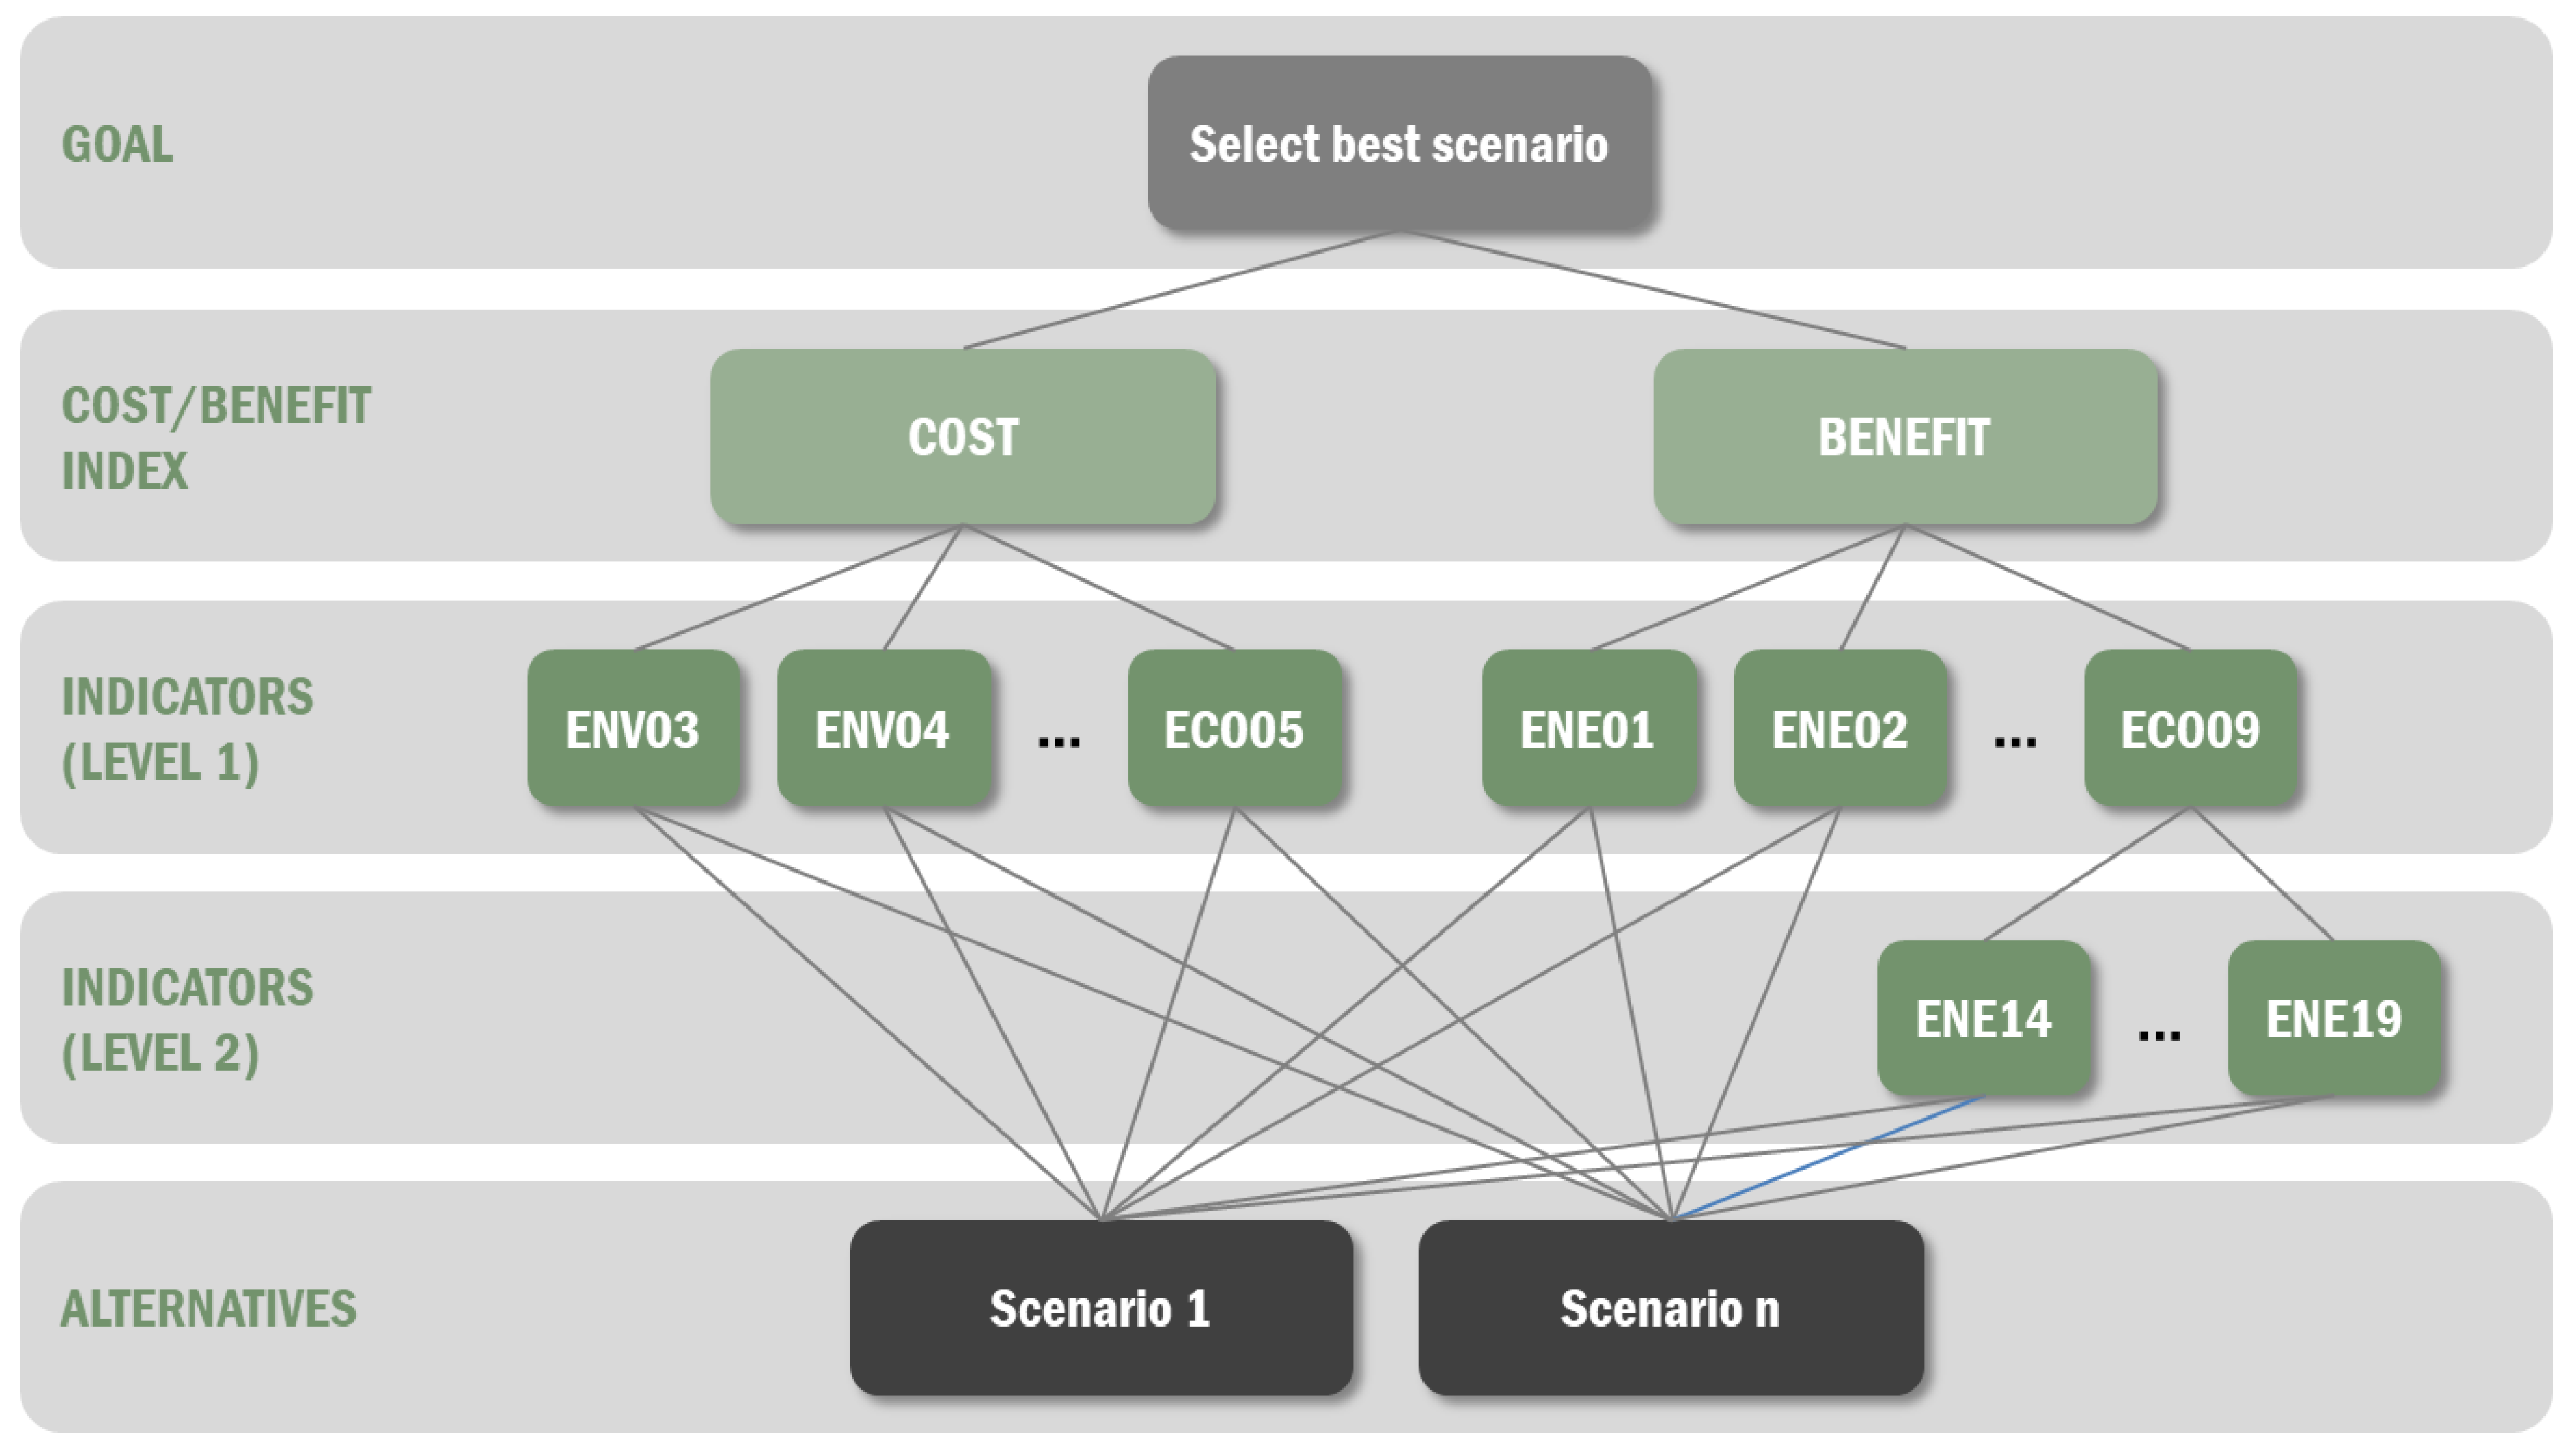
- Cost Group: This group contains the DPIs that indicate the cost for the scenario (environmental or economic cost).
- Benefit 1 Group: This group involves the DPIs that could show a benefit for the scenario (reduction of energy demand or consumption, increase of the energy demand covered by renewable sources, increase of comfort…).
- Benefit 2 Group: This group takes into consideration the benefits obtained when increasing the contribution of renewable energies: photovoltaics, solar thermal, hydraulic, mini-eolic, geothermal and biomass. It is a sub-group of the Benefit 1 Group, since it represents a disaggregation of the indicator that measures the Energy demand covered by renewable sources (ENE09), where the energy demand covered by renewable sources can be further analysed.
3.2. Definition of the Optimization Problem
3.3. Building the Cost–Benefit Function
3.3.1. Establishing a Weighting Method
3.3.2. Normalisation and Scaling
3.3.3. Building a Panel Method Scheme: Analytic Hierarchy Process
- Pairwise comparison matrix of the six environmental and economic criteria with respect to cost.
- Pairwise comparison matrix of the six energy and comfort criteria with respect to the benefit.
- Pairwise comparison matrix of the six criteria for the renewables with respect to ENE09.
- The matrix has to be raised to powers squared successively each time.
- The sum of the rows is calculated and then normalised.
- Once the difference between the sums of two consecutive calculations is lower than a value that has been defined, then the calculation stops.
3.3.4. Cost–Benefit Function
4. Case Study: Validation of the Evaluation Approach in a Controlled Environment
- The ECMs selected to create the scenarios were obtained from the ECMs catalogue developed for the platform.
- The scenarios considered were generated following the intelligence implemented in the scenario generator described at the beginning of this paper, considering the constraints established by the user.
- The calculation of the baseline and scenario DPIs were retrieved following the normal and operational process of the platform (that is, with the evaluator integrated within it), and therefore queried to the corresponding repositories of the tool.
- Also the weighting schemes, targets and barriers were obtained from the corresponding repositories, that is, the pre-defined weighting schemes were already available within them.
4.1. Description of the Case Study
- 4 types of external wall insulation with different thicknesses of insulation (50-100-150-200 mm)
- 4 types of internal wall insulation with different thicknesses of insulation (40-60-80-100 mm)
- 4 types of roof insulation with different thicknesses of insulation (40-60-80-100 mm)
- Replacement of the existing energy system with the installation of a natural gas boiler
- Installation of PV panels on roof
4.2. Calculation of the Baseline and Scenario DPIs
4.3. Definition of Weighting Schemes, Targets, Boundaries and Calculation of Cost and Benefit Values
- Boundaries:
- -
- ENV06 (maximum): 50
- -
- ECO02.2 (maximum): 15.000€
- -
- ECO05 (maximum): 30
- -
- ENV01 (maximum): 50
- Targets:
- -
- ENV06 (minimise): 25
- -
- ECO05 (minimise): 20
- -
- ENE09 (maximise): 50
- Scheme 1: Priority to achieve a nearly zero energy district
- Scheme 1A: Priority to achieve a nearly zero energy district + economic aspects
- Scheme 2: Priority to achieve a carbon neutral district
- Scheme 2A: Priority to achieve a carbon neutral district + economic aspects
- Scheme 3: Priority to energy generation through renewables
- Scheme 3A: Priority to energy generation through renewables + economic aspects
- Scheme 4: Priority to energy generation through renewables (solar thermal and photovoltaic)
- Scheme 4A: Priority to energy generation through renewables (solar thermal and photovoltaic) + economic aspects
- Scheme 5: Priority to energy generation through the district heating network
- Scheme 5A: Priority to energy generation through the district heating network + economic aspects
- Scheme 6: Priority to environmental issues
- Scheme 6A: Priority to environmental issues + economic aspects
- Scheme 7: Priority to reduce operational energy costs
- Scheme 7A: Priority to reduce operational energy costs + economic aspects
5. Results and Discussion
5.1. Cost and Benefit Graphs Observation
5.2. Pareto Front Observation
6. Conclusions
6.1. Validation of the Evaluation Method
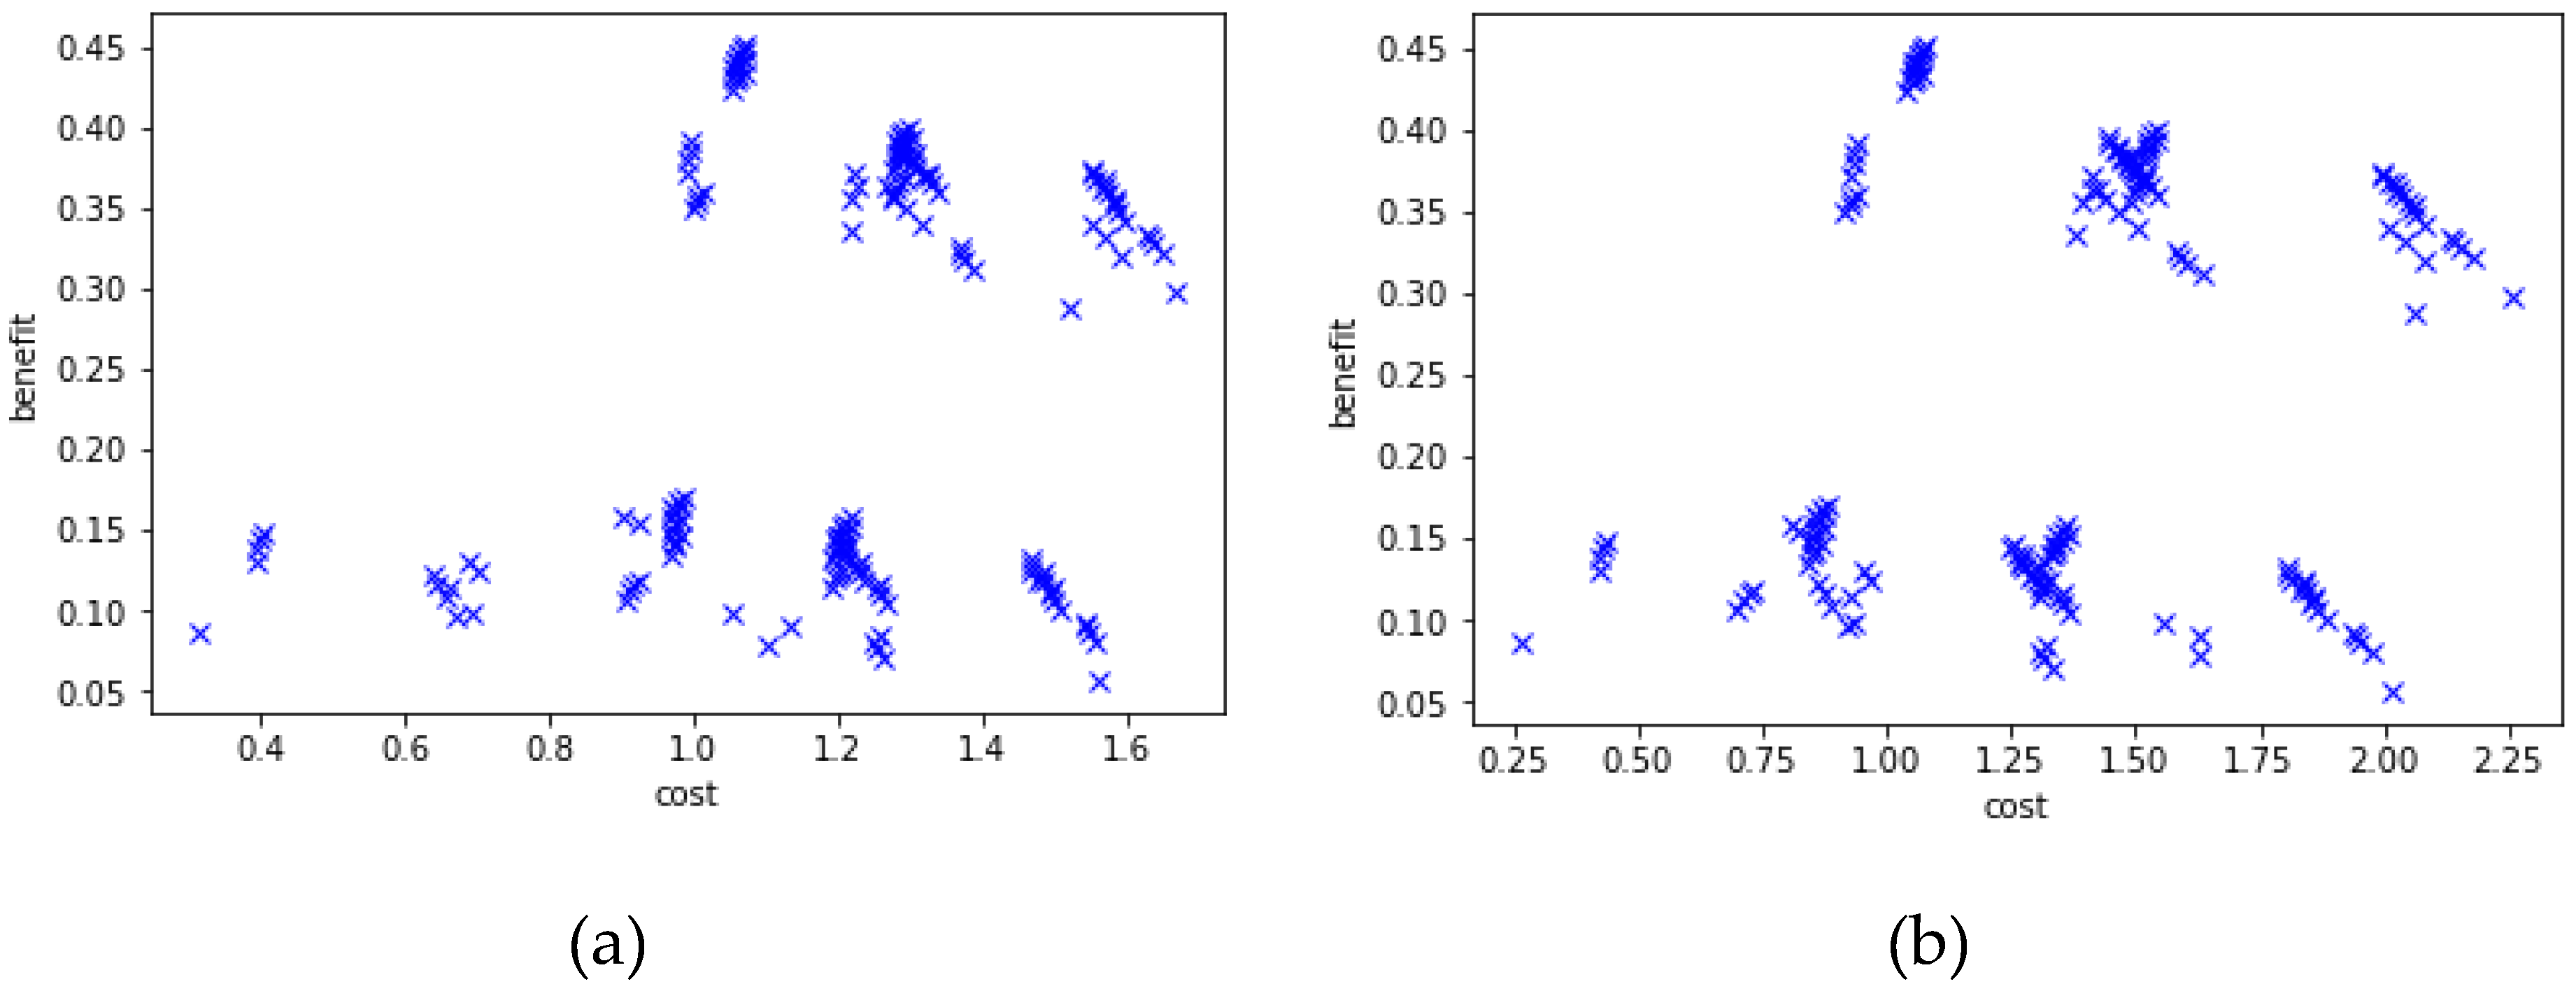
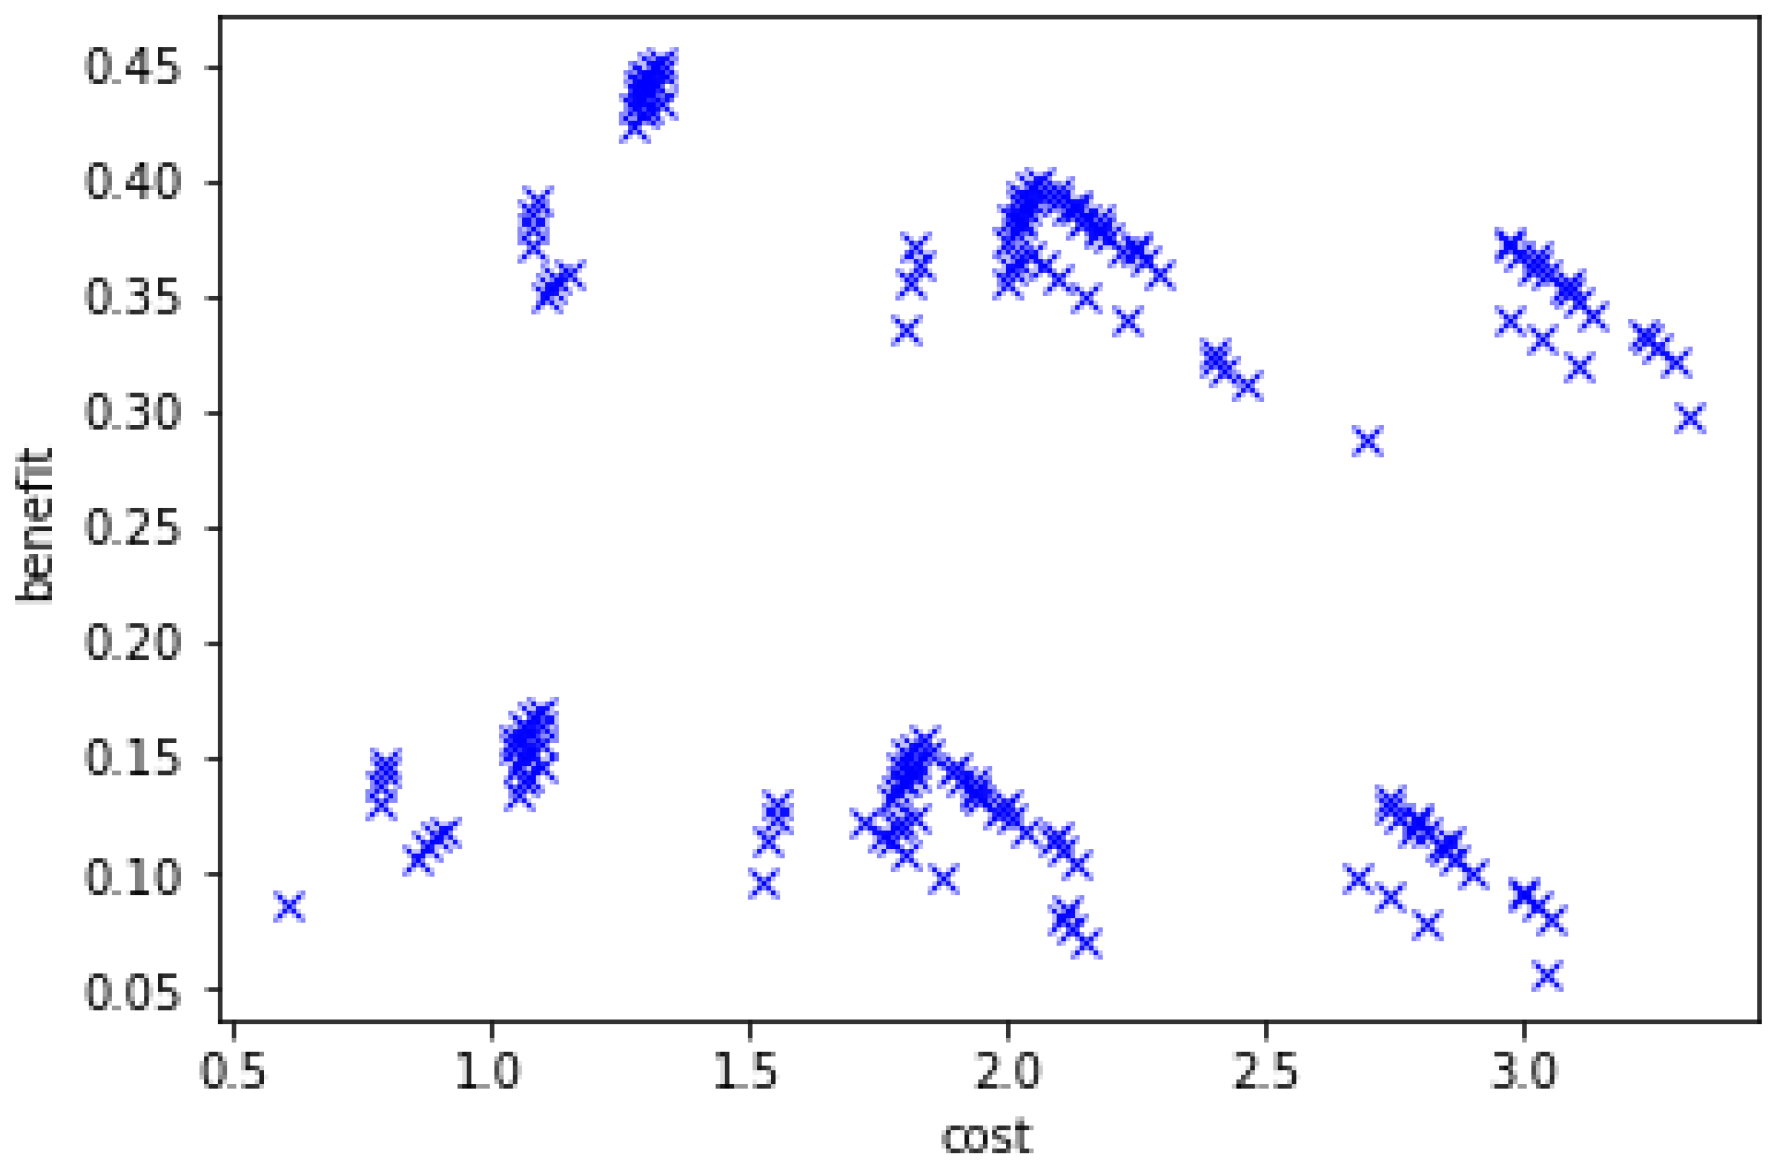
- The cost and benefit functions obtained after evaluating the candidate scenarios with the pre-defined weighting schemes are reasonable.
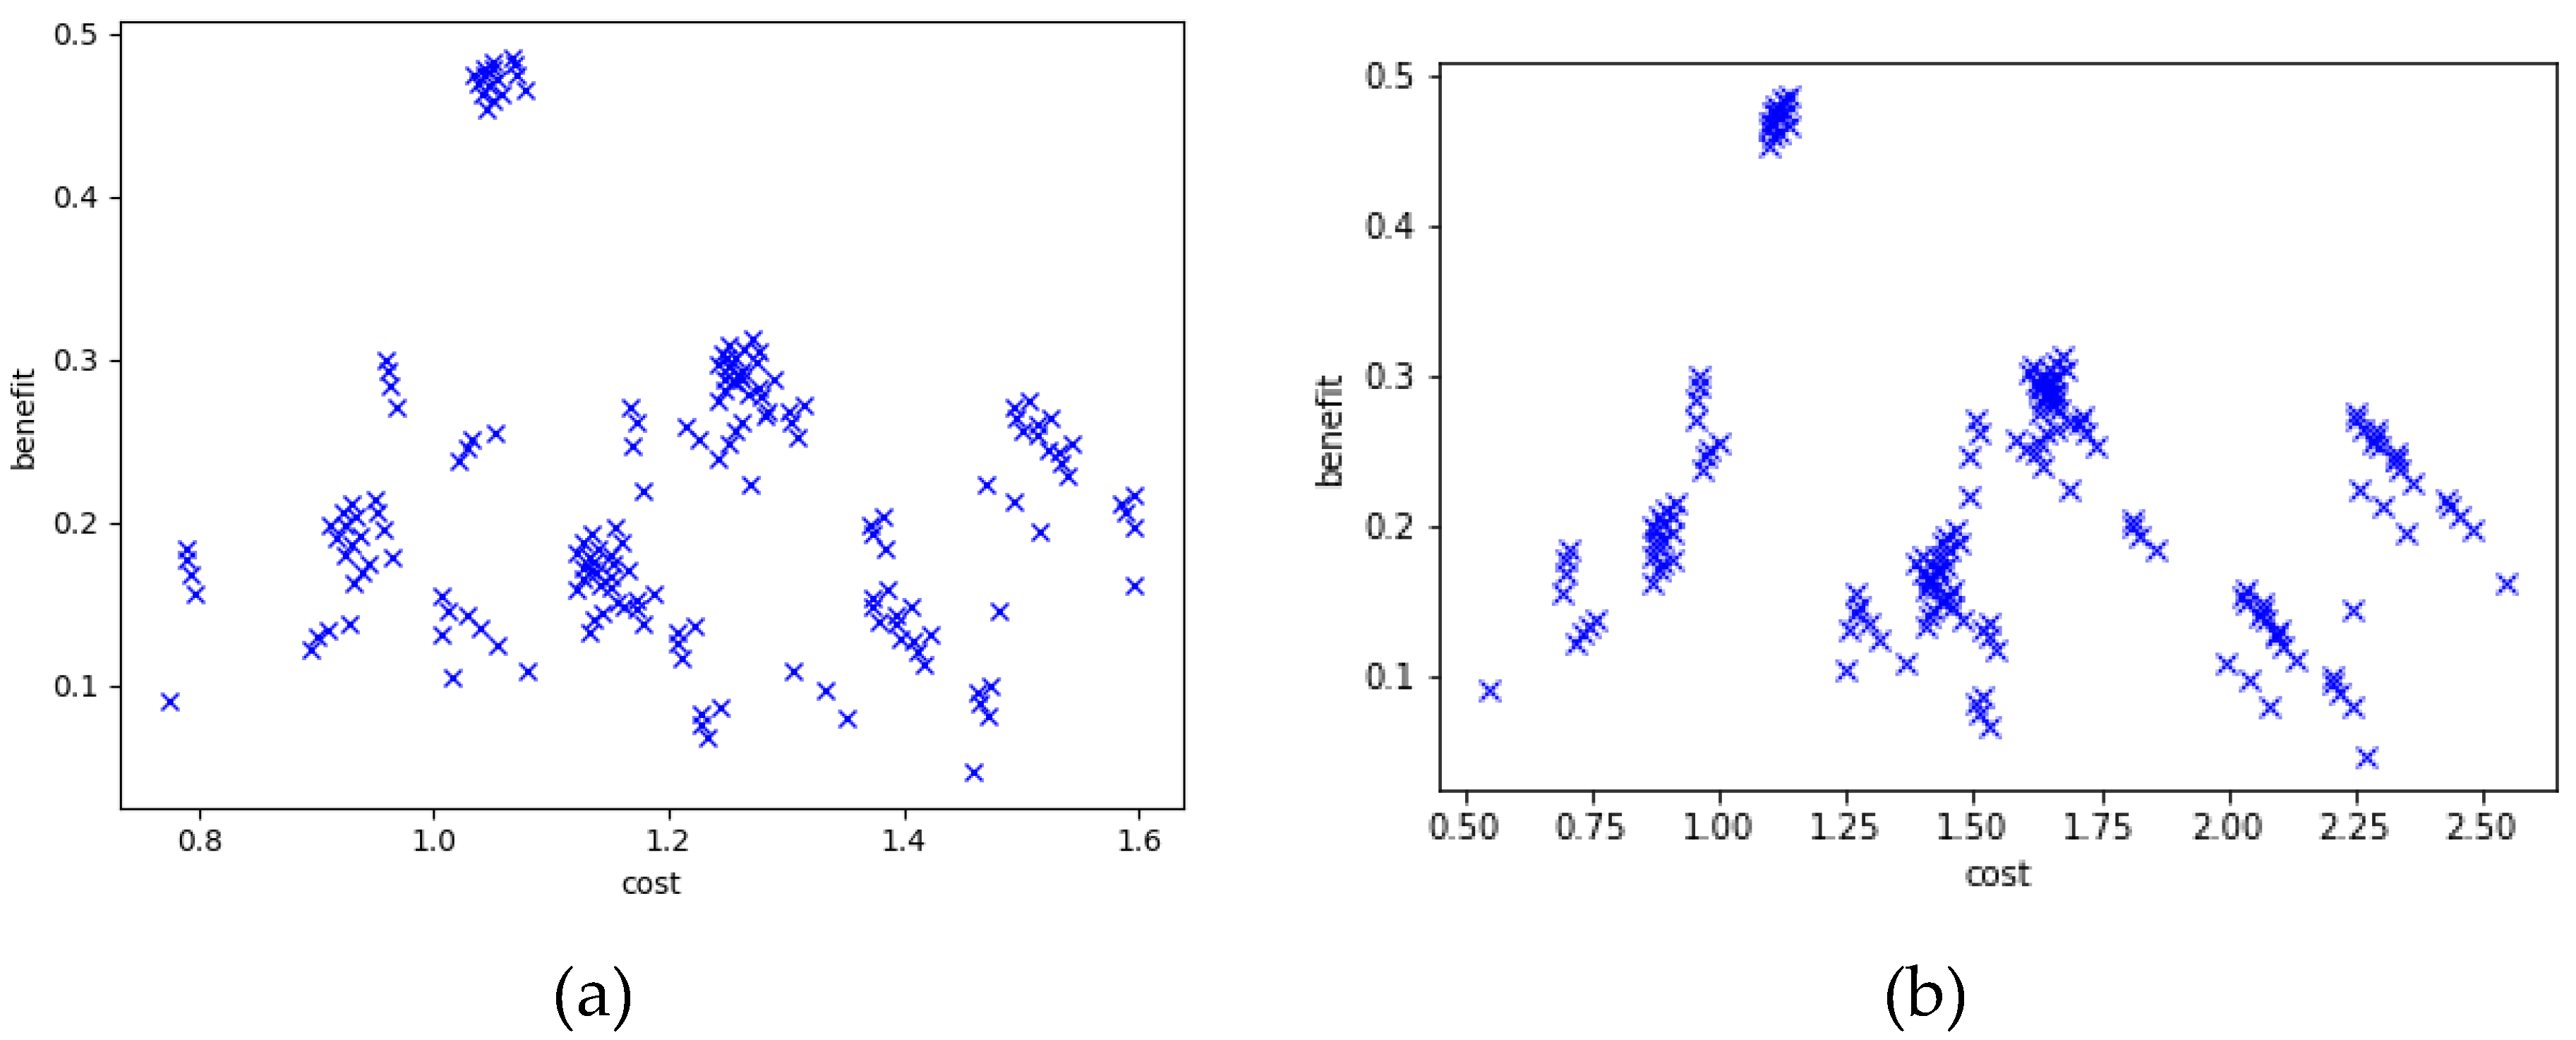
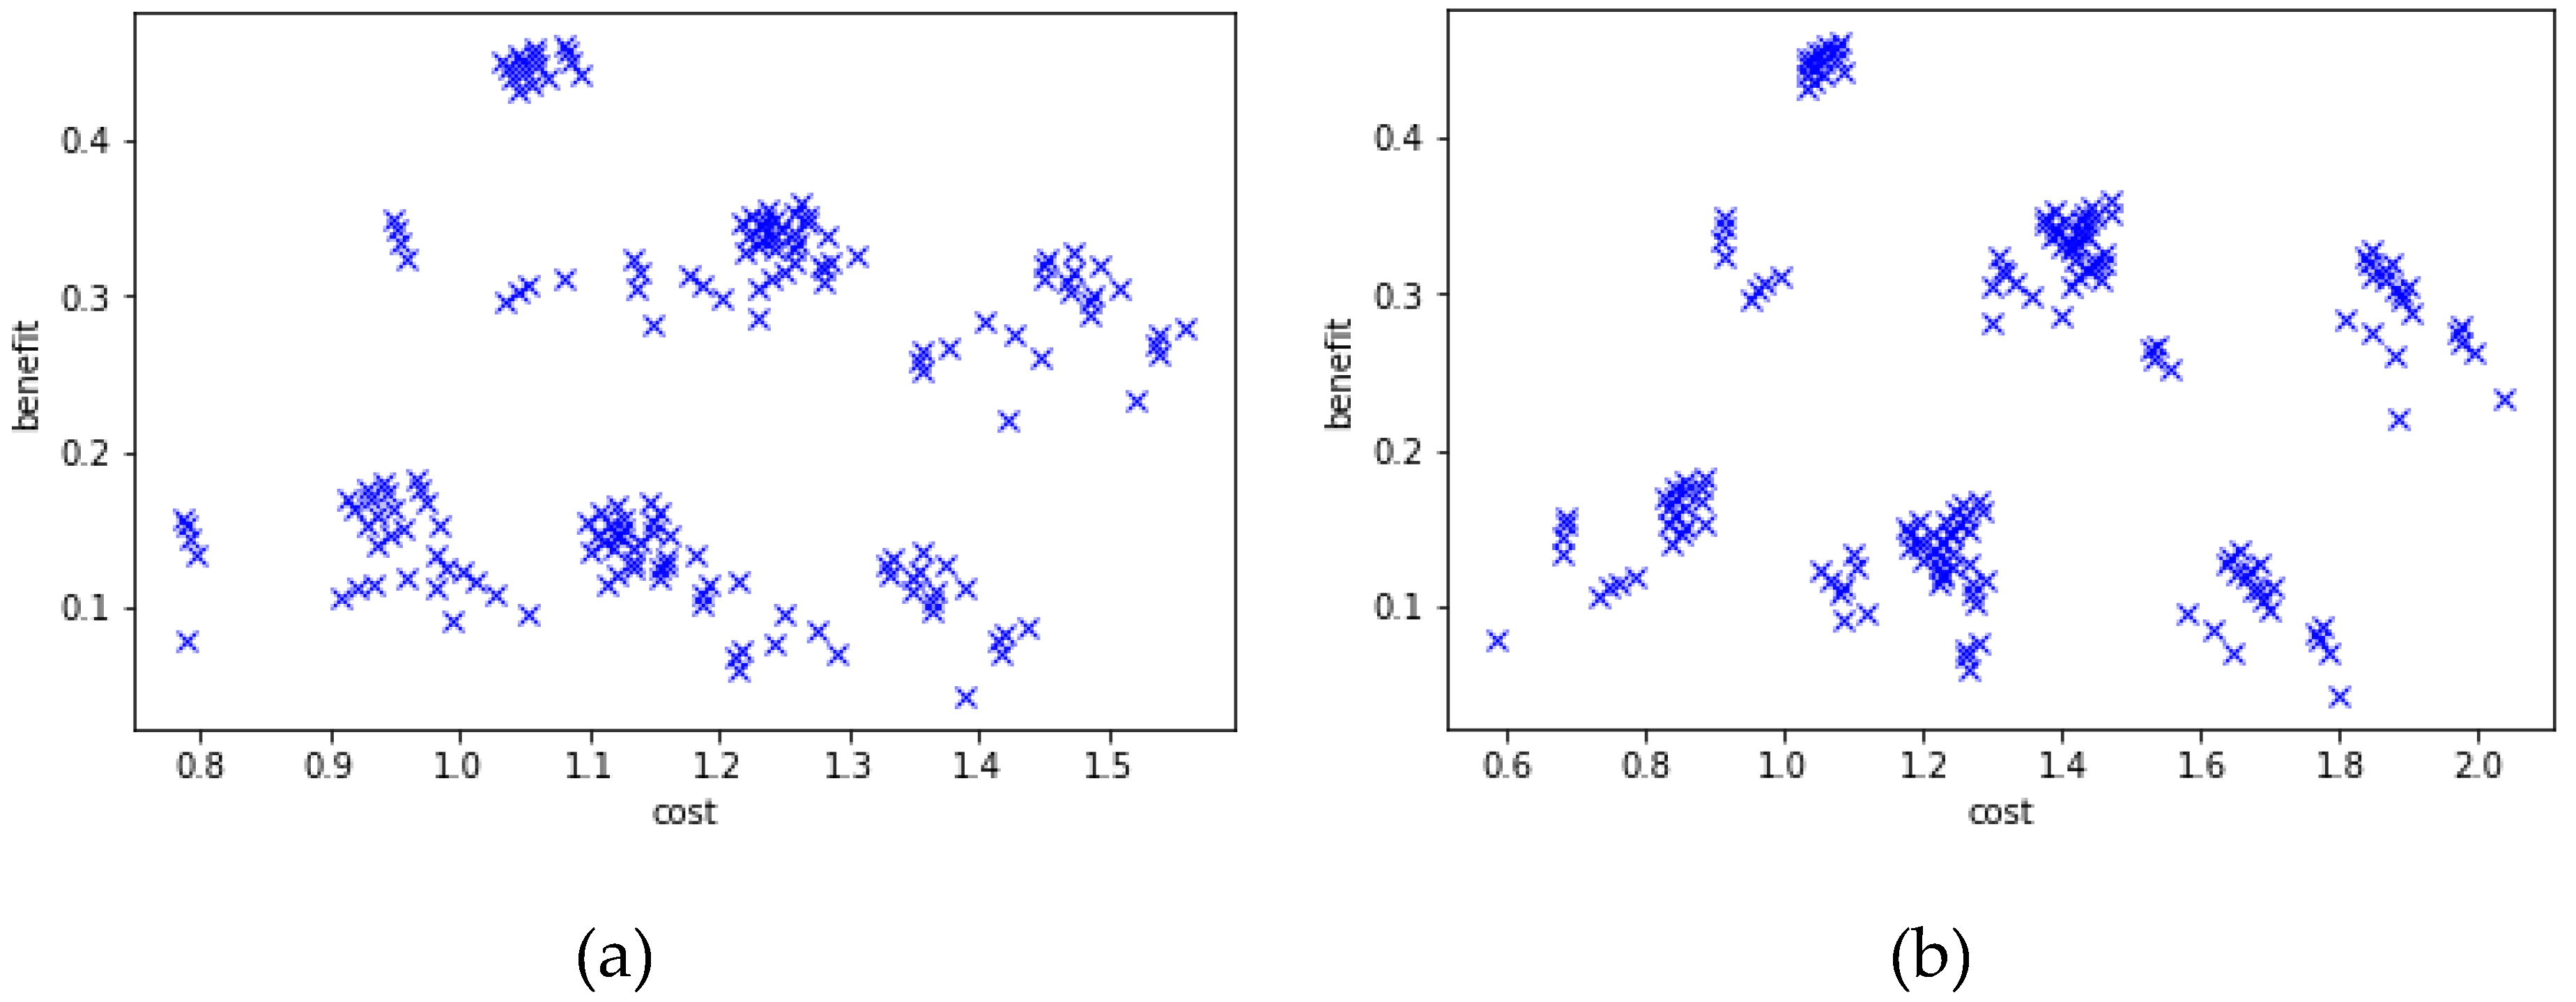
- While some pre-defined schemes presented graphs where the point distribution was more spread it is to be highlighted that in schemes such as 3 or 3A (those schemes related to energy generation through renewables) points corresponding to sets of scenarios where the same type of ECM was implemented were more concentrated, indicating that these schemes left little space to appreciate the differences among the same type of ECM.
- Also noticeable was the great difference between the schemes where renewables were favoured (as schemes 3 or 3A) and the rest. In these first schemes it can be observed that the scenarios where renewables have been applied have greater benefits. This was the main intention of the configuration of the scheme. However, it might be advisable to make the user aware of these facts when applying the pre-defined schemes.
- For the economically driven prioritisation schemes (1A, or 3A) a higher number of scenarios appear in the Pareto front. It can be deducted that the use of these schemes makes possible to better discriminate scenarios with similar measures by intensifying their main differences.
6.2. Limitations and Considerations
6.3. Future Research Work
Author Contributions
Funding
Acknowledgments
Conflicts of Interest
Nomenclature
| BIM | Building Information Modelling | MCDA | Multi-criteria Decision Analysis |
| IPD | Integrated Project Delivery | AHP | Analytic Hierarchy Process |
| ECM | Energy Conservation Measure | ENE | Energy indicators |
| DPI | District Performance Indicator | COM | Comfort indicators |
| IFC | Industry Foundation Classes | ECO | Economic indicators |
| GUI | Graphical User Interface | ENV | Environmental indicators |
References
- Directive on the Energy Performance of Buildings (EPBD). Directive 2002/91/EC of the European Parliament and Council on Energy Efficiency of Buildings. Off. J. Eur. Communities 2002, 1, 65–71. [Google Scholar]
- Europe’s Buildings under the Microscope; Buildings Performance Institute Europe (BPIE): Bruxelles, Belgium, 2011; ISBN 9789491143014.
- Laponche, B.; López, J.; Raoust, M.; Novel, A.; Devernois, N. Energy Efficiency Retrofitting of Buildings: Challenges and Methods; Agence Française de Développement: Paris, France, 2012. [Google Scholar]
- Lilis, G.N.; Giannakis KKatsigarakis, K.; Rovas, D.; Costa, G.; Sicilia, A.; García-Fuentes, M. Simulation model generation combining IFC and CityGML data. In Proceedings of the ECCPPM 2016 11th European Conference on Product and Process Modelling, Limassol, Cyprus, 7–9 September 2016. [Google Scholar]
- García-Fuentes, M.A.; Pujols, C.; García-Pajares, R.; Vasallo, A.; Martín, A. Metodología de Rehabilitación Energética hacia Distritos Residenciales de Energía Casi Nula. Aplicación al barrio del Cuatro de Marzo (Valladolid). In Proceedings of the II Congreso EECN, Madrid, Spain, 6–7 May 2014. [Google Scholar]
- Bryde, D.; Broquetas, M.; Volm, J.M. The project benefits of Building Information Modelling (BIM). Int. J. Proj. Manag. 2013, 31, 971–980. [Google Scholar] [CrossRef]
- The American Institute of Architects (AIA) National. Integrated Project Delivery: A Guide; Report; American Institute of Architects, AIA California Council: Sacramento, CA, USA, 2014. [Google Scholar]
- OptEEmAL. Available online: www.opteemal-project.eu (accessed on 13 June 2019).
- Lilis, G.N.; Giannakis, G.; Rovas, D.V. Inter-building shading calculations based on CityGML geometric data. In Proceedings of the 15th IBPSA Conference, San Francisco, CA, USA, 7–9 August 2017; pp. 370–379. [Google Scholar]
- OptEEmAL Partners. D3.1: Requirements and Specification of the ECMs Catalogue. 2016. Available online: https://www.opteemal-project.eu/files/opteemal_d3.1_requirementsspecificationecmscatalogue.pdf (accessed on 9 May 2019).
- Industry Foundation Classes (IFC) for Data Sharing in the Construction and Facility Management Industries; ISO 16739; International Organization for Standardization: Geneva, Switzerland, 2013.
- Kolbe, T.H.; Gröger, G.; Plümer, L. CityGML: Interoperable Access to 3D City Models. In Geo-Information for Disaster Management; Springer: Berlin/Heiidelberg, Germany, 2005; pp. 883–899. [Google Scholar]
- Lilis, G.N.; Giannalis, G.; Rovas, D. District-aware Building Energy Performance simulation model generation from GIS and BIM data. In Proceedings of the BSO 2018 4th Building Simulation and Optimisation Conference, Cambridge, UK, 11–12 September 2018. [Google Scholar]
- Bazjanac, V. Space boundary requirements for modeling of building geometry for energy and other performance simulation. In Proceedings of the CIB W78, Cairo, Egypt, 16–19 November 2010. [Google Scholar]
- Giannakis, G.; Lilis, G.N.; Garcia-Fuentes, M.A.; Kontes, G.; Valmaseda, C.; Rovas, D. A methodology to automatically generate geometry inputs for energy performance simulation from IFC BIM models. In Proceedings of the Building Simulation IBPSA Conference, Hyderabad, India, 7–9 December 2015; pp. 504–511. [Google Scholar]
- Hernández, G.; Serna, V.; García-Fuentes, M.Á. Design of energy efficiency retrofitting projects for districts based on performance optimization of District Performance Indicators calculated through simulation models. Energy Procedia 2017, 122, 721–726. [Google Scholar] [CrossRef]
- García-Fuentes, M.Á.; García-Pajares, R.; Sanz, C.; Meiss, A. Novel Design Support Methodology Based on a Multi-Criteria Decision Analysis Approach for Energy Efficient District Retrofitting Projects. Energies 2018, 11, 2368. [Google Scholar] [CrossRef]
- Crawley, D.; Lawrie, L.; Pedersen, C.; Winkelmann, F. EnergyPlus: Energy Simulation Program. ASHRAE J. 2000, 42, 49–56. [Google Scholar]
- De Tommasi, L.; Ridouane, H.; Giannakis, G.; Katsigarakis, K.; Lilis, G.N.; Rovas, D.; Tommasi, L. Model-Based Comparative Evaluation of Building and District Control-Oriented Energy Retrofit Scenarios. Buildings 2018, 8, 91. [Google Scholar] [CrossRef]
- Peyser, A.; Sinha, A.; Vennemo, S.B.; Ippen, T.; Jordan, J.; Graber, S.; Morrison, A.; Trensch, G.; Fardet, T.; Mørk, H.; et al. NEST 2.14.0. Zenodo 2017. [Google Scholar] [CrossRef]
- Valderrama-Ulloa, C.; Puiggali, J.R. User requirements in building translated in a methodology of decision support. Inf. Constr. 2014, 66, e022. [Google Scholar] [CrossRef]
- Dodgson, J.; Spackman, M.; Pearman, A.; Phillips, L. Multi-Criteria Analysis: A Manual; Communities and Local Government Publications: Wetherby, UK, 2009.
- Environmental Management—Lifecycle Assessment: Principles and Framework; ISO14040; International Organization for Standardization: Geneva, Switzerland, 2006.
- Pohekar, S.D.; Ramachandran, M. Application of multi-criteria decision making to sustainable energy planning—A review. Renew. Sustain. Energy Rev. 2004, 8, 365–381. [Google Scholar] [CrossRef]
- Manjarres, D.; Mabe, L.; Oregi, X.; Landa-Torres, I.; Arrizabalaga, E. A Multi-objective Harmony Search Algorithm for Optimal Energy and Environmental Refurbishment at District Level Scale. In Proceedings of the 3rd International Conference on Harmony Search Algorithm (ICHSA 2017), Bilbao, Spain, 22–24 February 2017; Springer: Berlin/Heidelberg, Germany, 2017. [Google Scholar]
- Nemhauser, G.; Rinnooy, A.; Todd, M. (Eds.) Optimization. Handbooks in Operations Research and Management Science; Elsevier: Amsterdam, The Netherlands, 1989; Volume 1. [Google Scholar]
- Rowley, H.V.; Peters, G.M.; Lundie, S.; Moore, S.J. Aggregating sustainability indicators: Beyond the weighted sum. J. Environ. Manag. 2012, 111, 24–33. [Google Scholar] [CrossRef] [PubMed]
- Coello, C. A Short Tutorial on Evolutionary Multiobjective Optimization; Lecture Notes in Computer Science book series; Springer Nature: Basel, Switzerland, 1993; Volume 1993. [Google Scholar]
- Engel, A. Verification, Validation and Testing of Engineered Systems; Wiley Series in Systems Engineering and Management; Wiley: Hoboken, NJ, USA, 2010. [Google Scholar]
- Ebert, U.; Welsch, H. Meaningful environmental indices: A social choice approach. J. Environ. Econ. Manag. 2004, 47, 270–283. [Google Scholar] [CrossRef]
- Barba-Romero, S.; Pomerol, J.C. Decisiones Multicriterio: Fundamentos Teóricos y Utilización Práctica; Universidad de Alcalà: Madrid, Spain, 1995. [Google Scholar]
- Kima, D.O.; Ramina, M.; Chenga, V.; Javeda, A.; Kaluskara, S.; Kellya, N.; Kobilirisa, D.; Neumanna, A.; Nia, F.; Pellera, T.; et al. An integrative methodological framework for setting environmental criteria: Evaluation of stakeholder perceptions. Ecol. Inform. 2018. [Google Scholar] [CrossRef]
- Boyssou, D.; Marchant, T.; Pirlot, M.; Tsoukiàs, A.; Vincke, P. Evaluation and Decision Models with Multiple Criteria: Stepping Stones for the Analyst; Springer: New York, NY, USA, 2006. [Google Scholar]
- Song, B.; Kang, S. A Method of Assigning Weights Using a Ranking and Nonhierarchy Comparison. Adv. Decis. Sci. 2016, 2016, 1–9. [Google Scholar] [CrossRef]
- Saaty, T.L. Decision making with the analytic hierarchy process. Int. J. Serv. Sci. 2008, 1, 83. [Google Scholar] [CrossRef]
- Klutho, S. Mathematical Decision Making: An Overview of the Analytic Hierarchy Process. 2013. Available online: https://www.whitman.edu/Documents/Academics/Mathematics/Klutho.pdf (accessed on 13 June 2019).
- OptEEmAL Partners. D4.4: Requirements and Design of the Simulation Model Input Generator, 2016.
- García-Fuentes, M.; Serna, V.; Hernández, G. Evaluation and optimisation of energy efficient retrofitting scenarios for districts based on district performance indicators and stakeholders’ priorities. In Proceedings of the Building Simulation and Optimisation 2018, Cambridge, UK, 11–12 September 2018. [Google Scholar]
- OptEEmAL Partners. D4.3: Validation of the Optimisation Module, 2017.

| Group 1—Cost | Group 2—Benefit 1 | Group 3—Benefit 2 |
|---|---|---|
| ENV01.Global Warming Potential - GWP (kg CO2) | ENE 01.Energy demand | ENE 14.Energy use from Biomass |
| ENV04.Primary energy consumption | ENE02.Final energy consumption | ENE 15.Energy use from PV |
| ENV06.Energy payback time | ENE 06.Net fossil energy consumed | ENE 16.Energy use from Solar Thermal |
| ECO02.2 Investments (in €) | ENE 09.Energy demand covered by renewable sources | ENE 17.Energy use from Hydraulic |
| ECO03.Life cycle cost | ENE 13.Energy use from District Heating | ENE 18.Energy use from Mini-Eolic |
| ECO05.Payback Period | COM01.Local thermal comfort | ENE 19.Energy use from Geothermal |
| Intensity of Importance | Definition | Explanation |
|---|---|---|
| 1 | Equal importance | The two criteria present the same importance for the participants |
| 3 | Moderate importance | The criteria is slightly more important than the one against it is compared |
| 5 | Strong importance | The criteria is strongly more important than the one against it is compared |
| 7 | Very strong importance | The criteria is very strongly more important than the one against it is compared |
| 9 | Extreme importance | The criteria reaches the highest importance, leaving the one against it is compared with negligible importance |
| Reciprocals of above | When comparing one criteria with a second, the importance of the second over the first is the reciprocal value of the first over the second | |
| MATRIX 1: COST | ENV03 | ENV04 | ENV06 | ECO02 | ECO03 | ECO05 |
|---|---|---|---|---|---|---|
| ENV03 | 1 | ENV03/ENV04 | ENV03/ENV06 | ENV03/ECO02 | ENV03/ECO03 | ENV03/ECO05 |
| ENV04 | ENV04/ENV03 | 1 | ENV04/ENV06 | ENV04/ECO02 | ENV04/ECO03 | ENV04/ECO05 |
| ENV06 | ENV06/ENV03 | ENV06/ENV04 | 1 | ENV06/ECO02 | ENV06/ECO03 | ENV06/ECO05 |
| ECO02 | ECO02/ENV03 | ECO02/ENV04 | ECO02/ENV06 | 1 | ECO02/ECO03 | ECO02/ECO05 |
| ECO03 | ECO03/ENV03 | ECO03/ENV04 | ECO03/ENV06 | ECO03/ECO02 | 1 | ECO03/ECO05 |
| ECO05 | ECO05/ENV03 | ECO05/ENV04 | ECO05/ENV06 | ECO05/ECO02 | ECO05/ECO03 | 1 |
| MATRIX 2: BENEFITS 1 | ENE01 | ENE02 | ENE06 | ENE09 | ENE13 | COM01 |
|---|---|---|---|---|---|---|
| ENE01 | 1 | ENE01/ENE02 | ENE01/ENE06 | ENE01/ENE09 | ENE01/ENE13 | ENE01/COM01 |
| ENE02 | ENE02/ENE01 | 1 | ENE02/ENE06 | ENE02/ENE09 | ENE02/ENE13 | ENE02/COM01 |
| ENE06 | ENE06/ENE01 | ENE06/ENE02 | 1 | ENE06/ENE09 | ENE06/ENE13 | ENE06/COM01 |
| ENE09 | ENE09/ENE01 | ENE09/ENE02 | ENE09/ENE06 | 1 | ENE09/ENE13 | ENE09/COM01 |
| ENE13 | ENE13/ENE01 | ENE13/ENE02 | ENE13/ENE06 | ENE13/ENE09 | 1 | ENE13/COM01 |
| COM01 | COM01/ENE01 | COM01/ENE02 | COM01/ENE06 | COM01/ENE09 | COM01/ENE13 | 1 |
| MATRIX 3: BENEFITS 2 | ENE14 | ENE15 | ENE16 | ENE17 | ENE18 | ENE19 |
|---|---|---|---|---|---|---|
| ENE14 | 1 | ENE14/ENE15 | ENE14/ENE16 | ENE14/ENE17 | ENE14/ENE18 | ENE14/ENE19 |
| ENE15 | ENE15/ENE14 | 1 | ENE15/ENE16 | ENE15/ENE17 | ENE15/ENE18 | ENE15/ENE19 |
| ENE16 | ENE16/ENE14 | ENE16/ENE15 | 1 | ENE16/ENE17 | ENE16/ENE18 | ENE16/ENE19 |
| ENE17 | ENE17/ENE14 | ENE17/ENE15 | ENE17/ENE16 | 1 | ENE17/ENE18 | ENE17/ENE19 |
| ENE18 | ENE18/ENE14 | ENE18/ENE15 | ENE18/ENE16 | ENE18/ENE17 | 1 | ENE18/ENE19 |
| ENE19 | ENE19/ENE14 | ENE19/ENE15 | ENE19/ENE16 | ENE19/ENE17 | ENE19/ENE18 | 1 |
| DPI Code | Weight (wi) | Range | Objective | DPI for Scenario x fi(x) | Normalised DPI for Scenario x Ii(x) | Weighted and Normalised DPI | |
|---|---|---|---|---|---|---|---|
| min (fi_min) | max (fi_max) | ||||||
| ENEi | 100 | 1 | |||||
| COMi | 100 | 1 | |||||
| ECOi | 0 | 0 | |||||
| ENVi | 0 | 100 | 1 | ||||
| Property | Value | Picture |
|---|---|---|
| Surface | Wall surface: 75.60 m2 |  |
| Roof surface: 48.00 m2 | ||
| Spaces | 1 | |
| Elements | 4 walls | |
| 1 roof | ||
| 0 windows |
| Scenarios | Number | Concept | |
|---|---|---|---|
| 1 | 1 | R | Each renewable (R) measure separately |
| 2 | 1 | A | Each active (A) measure separately |
| 3–14 | 12 | P | Each passive (P) measure separately |
| 15–26 | 12 | P + R | Each passive measure separately + renewable |
| 27–38 | 12 | P + A | Each passive measure separately + active |
| 39–50 | 12 | P + A + R | Each passive measure separately + renewable + active |
| 51–66 | 16 | (P ext) + (P roof) | External passive measure (P ext) + roof insulation (P roof) |
| 67–82 | 16 | (P ext) + (P roof) + R | External passive measure + roof insulation + renewable |
| 83–98 | 16 | (P ext) + (P roof) + A | External passive measure + roof insulation + active |
| 99–114 | 16 | (P ext) + (P roof) + A + R | External passive measure + roof insulation + active + renewable |
| 115–130 | 16 | (P int) + (P roof) | Internal passive measure (P int) + roof insulation |
| 131–146 | 16 | (P int) + (P roof) + R | Internal passive measure + roof insulation + renewable |
| 147–162 | 16 | (P int) + (P roof) + A | Internal passive measure + roof insulation + active |
| 163–178 | 16 | (P int) + (P roof) + A + R | Internal passive measure + roof insulation + active + renewable |
| Type | Name | Tool |
|---|---|---|
| C | ENV01: Global Warming Potential | NEST |
| C | ENV04: Primary energy consumption | |
| C | ENV06: Energy payback time | |
| C | ECO02.2: Investments | Ad-hoc developed tool for economic assessment |
| C | ECO03: Life cycle cost | |
| C | ECOO05: Payback period | |
| B (1) | ENE01: Energy demand | Energy Plus and Ad-hoc developed tool for HVAC and control simulation |
| B (1) | ENE02.0: Final energy consumption | |
| B (1) | ENE06: Net fossil energy consumed | |
| B (1) | ENE09: Energy demand covered by renewable sources | |
| B (1) | ENE13: Energy use from District Heating | |
| B (1) | COM01: Local thermal comfort | |
| B (2) | ENE14: Energy use from biomass | |
| B (2) | ENE15: Energy use from PV | |
| B (2) | ENE16: Energy use from Solar Thermal | |
| B (2) | ENE17: Energy use from hydraulic | |
| B (2) | ENE18: Energy use from mini-eolic | |
| B (2) | ENE19: Energy use from geothermal |
| Scheme | Number of Scenarios | Min. Benefit Value | Max. Benefit Value | Min. Cost Value | Max. Cost Value |
|---|---|---|---|---|---|
| 1 | 11 | 0,047 | 0,486 | 0,774 | 1,597 |
| 1A | 20 | 0,047 | 0,486 | 0,549 | 2,545 |
| 2 | 9 | 0,043 | 0,460 | 0,788 | 1,558 |
| 2A | 19 | 0,043 | 0,460 | 0,586 | 2,035 |
| 3 | 20 | 0,057 | 0,451 | 0,314 | 1,669 |
| 3A | 24 | 0,057 | 0,451 | 0,265 | 2,259 |
| 4 | 20 | 0,057 | 0,533 | 0,314 | 1,669 |
| 4A | 24 | 0,057 | 0,533 | 0,265 | 2,259 |
| 6A | 20 | 0,057 | 0,451 | 0,604 | 3,323 |
© 2019 by the authors. Licensee MDPI, Basel, Switzerland. This article is an open access article distributed under the terms and conditions of the Creative Commons Attribution (CC BY) license (http://creativecommons.org/licenses/by/4.0/).
Share and Cite
García-Fuentes, M.Á.; Serna, V.; Hernández, G.; Meiss, A. An Evaluation Framework to Support Optimisation of Scenarios for Energy Efficient Retrofitting of Buildings at the District Level. Appl. Sci. 2019, 9, 2448. https://doi.org/10.3390/app9122448
García-Fuentes MÁ, Serna V, Hernández G, Meiss A. An Evaluation Framework to Support Optimisation of Scenarios for Energy Efficient Retrofitting of Buildings at the District Level. Applied Sciences. 2019; 9(12):2448. https://doi.org/10.3390/app9122448
Chicago/Turabian StyleGarcía-Fuentes, Miguel Á., Víctor Serna, Gema Hernández, and Alberto Meiss. 2019. "An Evaluation Framework to Support Optimisation of Scenarios for Energy Efficient Retrofitting of Buildings at the District Level" Applied Sciences 9, no. 12: 2448. https://doi.org/10.3390/app9122448
APA StyleGarcía-Fuentes, M. Á., Serna, V., Hernández, G., & Meiss, A. (2019). An Evaluation Framework to Support Optimisation of Scenarios for Energy Efficient Retrofitting of Buildings at the District Level. Applied Sciences, 9(12), 2448. https://doi.org/10.3390/app9122448


