Article

Lipid and Carotenoid Production by Rhodotorula glutinis with a Combined Cultivation Mode of Nitrogen, Sulfur, and Aluminium Stress

1
School of Life Science and Biotechnology, Dalian University of Technology, Dalian 116024, Liaoning, China
2
School of Food and Environment Science and Engineering, Dalian University of Technology, Panjin 12422, Liaoning, China
3
Faculty of science, Botany Department, Menoufia University, Shebin El-koom 32511, Egypt
*
Author to whom correspondence should be addressed.
Appl. Sci. 2019, 9(12), 2444; https://doi.org/10.3390/app9122444
Submission received: 5 May 2019 / Revised: 5 June 2019 / Accepted: 7 June 2019 / Published: 14 June 2019

Abstract

:
Torulene is a promising pink pigment, produced only by yeasts and fungi, and its production is still in a developing stage due to the low production rate. Accordingly, this study focuses on maximizing torulene production by Rhodotorula glutinis using shaken flask fermentation. The effect of different nitrogen sources, and C/N and C/S ratios on lipid and carotenoid production by R. glutinis was studied using 60 g/L glucose. The largest cells filled with golden fluorescence lipid bodies were observed using fluorescence microscopy when peptone was used as a nitrogen source. The highest total pigment (0.947 mg/L) and carotenoid relative productivity (Car-RP) (89.04 µg/g) were obtained at C/N 146 and C/S 120, and with ammonium sulfate as a nitrogen source, with 62% torulene domination using High Performance Liquid Chromatography (HPLC) for identification. Under a high C/N ratio, regardless of the C/S ratio, the carotenoid synthesis rate decreased after three days while the lipid synthesis rate kept increasing to the sixth day. Interestingly, after adding 0.7 mM Al2(SO4)3 to the optimized medium, the total pigment and Car-RP (2.2 mg/L and 212.9 µg/g) sharply increased, producing around 2.16 mg/L torulene (98%) with around 50% decrease in lipid yield. This is the first report on the role of Al2(SO4)3 for enhancing torulene production under lipogenesis condition, which could be used as a potential tool for torulene production.

1. Introduction

Carotenoids are one of the most common classes of pigments that occur in nature. The carotenoids market has grown significantly in the past few years due to increasing end-use applications in animal feed, dietary supplements, pharmaceuticals, food, beverages, and cosmetics industries. The global market for carotenoids reached $1.5 billion in 2017 and should reach $2.0 billion by 2022 at a compound annual growth rate (CAGR) of 5.7% for the period of 2017–2022 [1]. To satisfy the increasing demand for carotenoids, they can be produced easily via chemical synthesis. However, due to general consumer concern against synthetic pigments, the biotechnological production of carotenoids (via de novo microbial synthesis) is becoming an appealing alternative to the synthetic route [2].
Microbial fermentation is a promising alternative source of natural carotenoids. High yields of carotenoids can be produced by coloured microorganisms using economic substrates during a short period when the process parameters were efficiently controlled. Among the carotenoid producing microorganisms are algae, bacteria, filamentous fungi, and yeasts, such as Streptomyces chrestomyceticus, Blakeslea trispora, Phycomyces blakesleeanus, Flavobacterium sp., Phaffia sp., and Rhodotorula sp., have been described as highly carotenoid-producing microorganisms [3,4].
Rhodotorula glutinis (R. glutinis) is capable of synthesizing numerous valuable compounds with a wide industrial usage. This yeast is a red oleaginous yeast that produces a significant amount of both lipids and carotenoids. R. glutinis, as a potential alternative candidate for lipid production, can accumulate a significant amount of lipids in cells (especially in lipid droplets) up to 70% of dry cell weight [5,6,7,8]. The lipid profile produced by R. glutinis has confirmed the dominance of oleic acid, which was considered an excellent substitute for vegetable oil for biodiesel production [9,10].
Meanwhile, the carotenoid profile produced by R. glutinis mainly consists of β-carotene, γ-carotene, torulene, and torularhodin, but the proportion of different carotenoid fractions varies significantly among different strains [11], culture conditions, C/N ratio [12], salt stress [13], metal stress [14], and nitrogen deficiency [15]. Carotenoid torulene has 13 double bonds, one β-ionone, and a longer polyene chain than β-carotene. Torulene exhibits properties of provitamin A and anti-prostate cancer activity, and is a safe food additive [16,17]. Despite the benefits of torulene, its production does not upgrade to industrial scale due to its low production rate and the shortage of knowledge regarding the regulation of its biosynthesis and the optimized culture condition, in comparison with another yeast carotenoid like astaxanthin and β-carotene [13].
Although several studies have been conducted to optimize the production of lipids and carotenoids by R. glutinis [18,19], only a few studies were tried to co-produce both products together [20,21,22,23]. It has been known that nutrient-limitation, especially nitrogen and sulfur with high glucose concentration, can induce lipid accumulation from R. glutinis [24,25,26]. While the production of carotenoids is usually carried out in R. glutinis under a low C/N ratio, in constrast to normal lipid production, even though it shares acetyl-CoA as a precursor for lipogenesis and carotenogenesis pathway, which was suggested the reverse relationship [10,23].
Our initial results indicated that γ-carotene was detected as the dominant carotenoid with a 59% ratio produced by R. glutinis under a low C/N ratio, but the carotenogenesis pathway was shifted significantly toward torulene and the total carotenoid production was decreased when increasing the C/N ratio for lipid production (data not shown). As a result, optimizing torulene production by R. glutinis under a lipogenesis condition needs to be upgraded to industrial scale.
Metal toxicity is the consequence of several effects on the cellular and organismal level, including oxidative stress [27], alteration of enzyme and protein function [28,29,30,31], lipid peroxidation, and DNA damage [32,33,34,35]. The aluminium ion, Al3+, is toxic to both plant and animal cells [36], and it has been suggested that Al3+ enhances the peroxidation of phospholipids and proteins in cell membranes, and induces oxidative stress on the cells [37,38]. Only two studies reported the stimulatory role of the aluminium ion on carotenoid production by red yeasts [14,19]. Nevertheless, there is no paper so far investigating the effect of aluminium ions on lipid accumulation by oleaginous microorganisms.
As a result, this study aims to maximize the production of torulene by R. glutinis using two different strategies, First, controlling the culture conditions was attempted to enhance the carotenoid production in lipid production under a high C/N ratio through optimizing the C/S ratio, C/N ratio, and nitrogen sources. Second, the effect of different concentrations of Al2(SO4)3 was explored as a stress factor on lipid and carotenoid production.

2. Materials and Methods

2.1. The Microorganism, Media Preparation, and Cultivation

The oleaginous red yeast Rhodotorula glutinis (AS 2.703), obtained from the China General Microbiological Culture Collection Center (CGMCC)(Beijin China), was recultivated on Yeast extract peptone dextrose media (YPD) slants (glucose 20 g/L, peptone 10 g/L, yeast extract 10 g/L, and agar 15 g/L, pH 5) at 30 °C for three days, then preserved at 4 °C until used. For the production of lipids and carotenoids, the described method was used with slight modification [12]. Briefly, two steps were needed: First, seed culture preparation, during which, the 2-day pre-culture yeast cells were cultivated in sterilized 250 mL flasks containing 50 mL YPD broth, then incubated on a rotatory-incubator HZQ-F100 ( Taicang, Jiangsu Province, China) at 28 °C and 180 rpm for 48 h. Second, the fermentation step involved preparation of the basal fermentation media, which contained (per litre) glucose (60 g), (NH4)2SO4 (0.5 g), yeast extract (0.75 g), KH2PO4 (1.5 g), and MgSO4●7H2O (1 g). This media was used during our initial experiments.
For studying effect of different nitrogen sources—peptone (PEP), yeast extract (YE), and ammonium sulfate (Amm)—on lipid and carotenoid production, the nitrogen sources in the basal media were replaced with the selected nitrogen source. Also, three different C/N ratios were prepared using the different nitrogen sources as shown in Table 1. Using ammonium sulfate as a nitrogen source led to changes in both C/S and C/N ratios, so the C/S ratio was calculated and is shown in Table 1. Also, different concentrations of MgSO4 were added to prepare different C/S ratios using the basal medium as a control (Table 2).
The seed cells were centrifuged at 10,000× g for 15 min, then washed twice using sterilized 0.9% NaCl solution (same volume) followed by inoculation (10% v/v) in 250 mL flasks containing 100 mL of fermentation media. Finally, the cells were incubated under the same condition for six days. Fifty milliliters was withdrawn every three days under the complete aseptic condition and used for dry cell weight, lipid, and carotenoid measurements. All experiments were carried out in three replicas; the mean and the standard deviation were calculated.

2.2. Effect of Different Al2(SO4)3 Concentration on Growth, and Lipid and Carotenoid Production

After establishing the best conditions for carotenoid enhancement production, a new fermentation medium was prepared (optimized media), and a different amount of Al2(SO4)3 was added after sterilization to prepare the following final concentrations: 0.1 mM, 0.3 mM, 0.5 mM, 0.7 mM, 1 mM, 2 mM, 4 mM, 6 mM, 8 mM, and 10 mM, and then were treated with the same above-described method.

2.3. Detection of Dry Cell Weight and Residual Sugar in Culture Media

Five milliliters from the withdrawn samples were centrifuged at 10,000 rpm for 10 min; the cells were washed twice with the same volume of sterilised distilled water, then freeze-dried and weighted for the determination of dry cell weight (DCW). The supernatant was used for measuring residual sugar using the 3,5-dinitrosalicylic acid method [39].

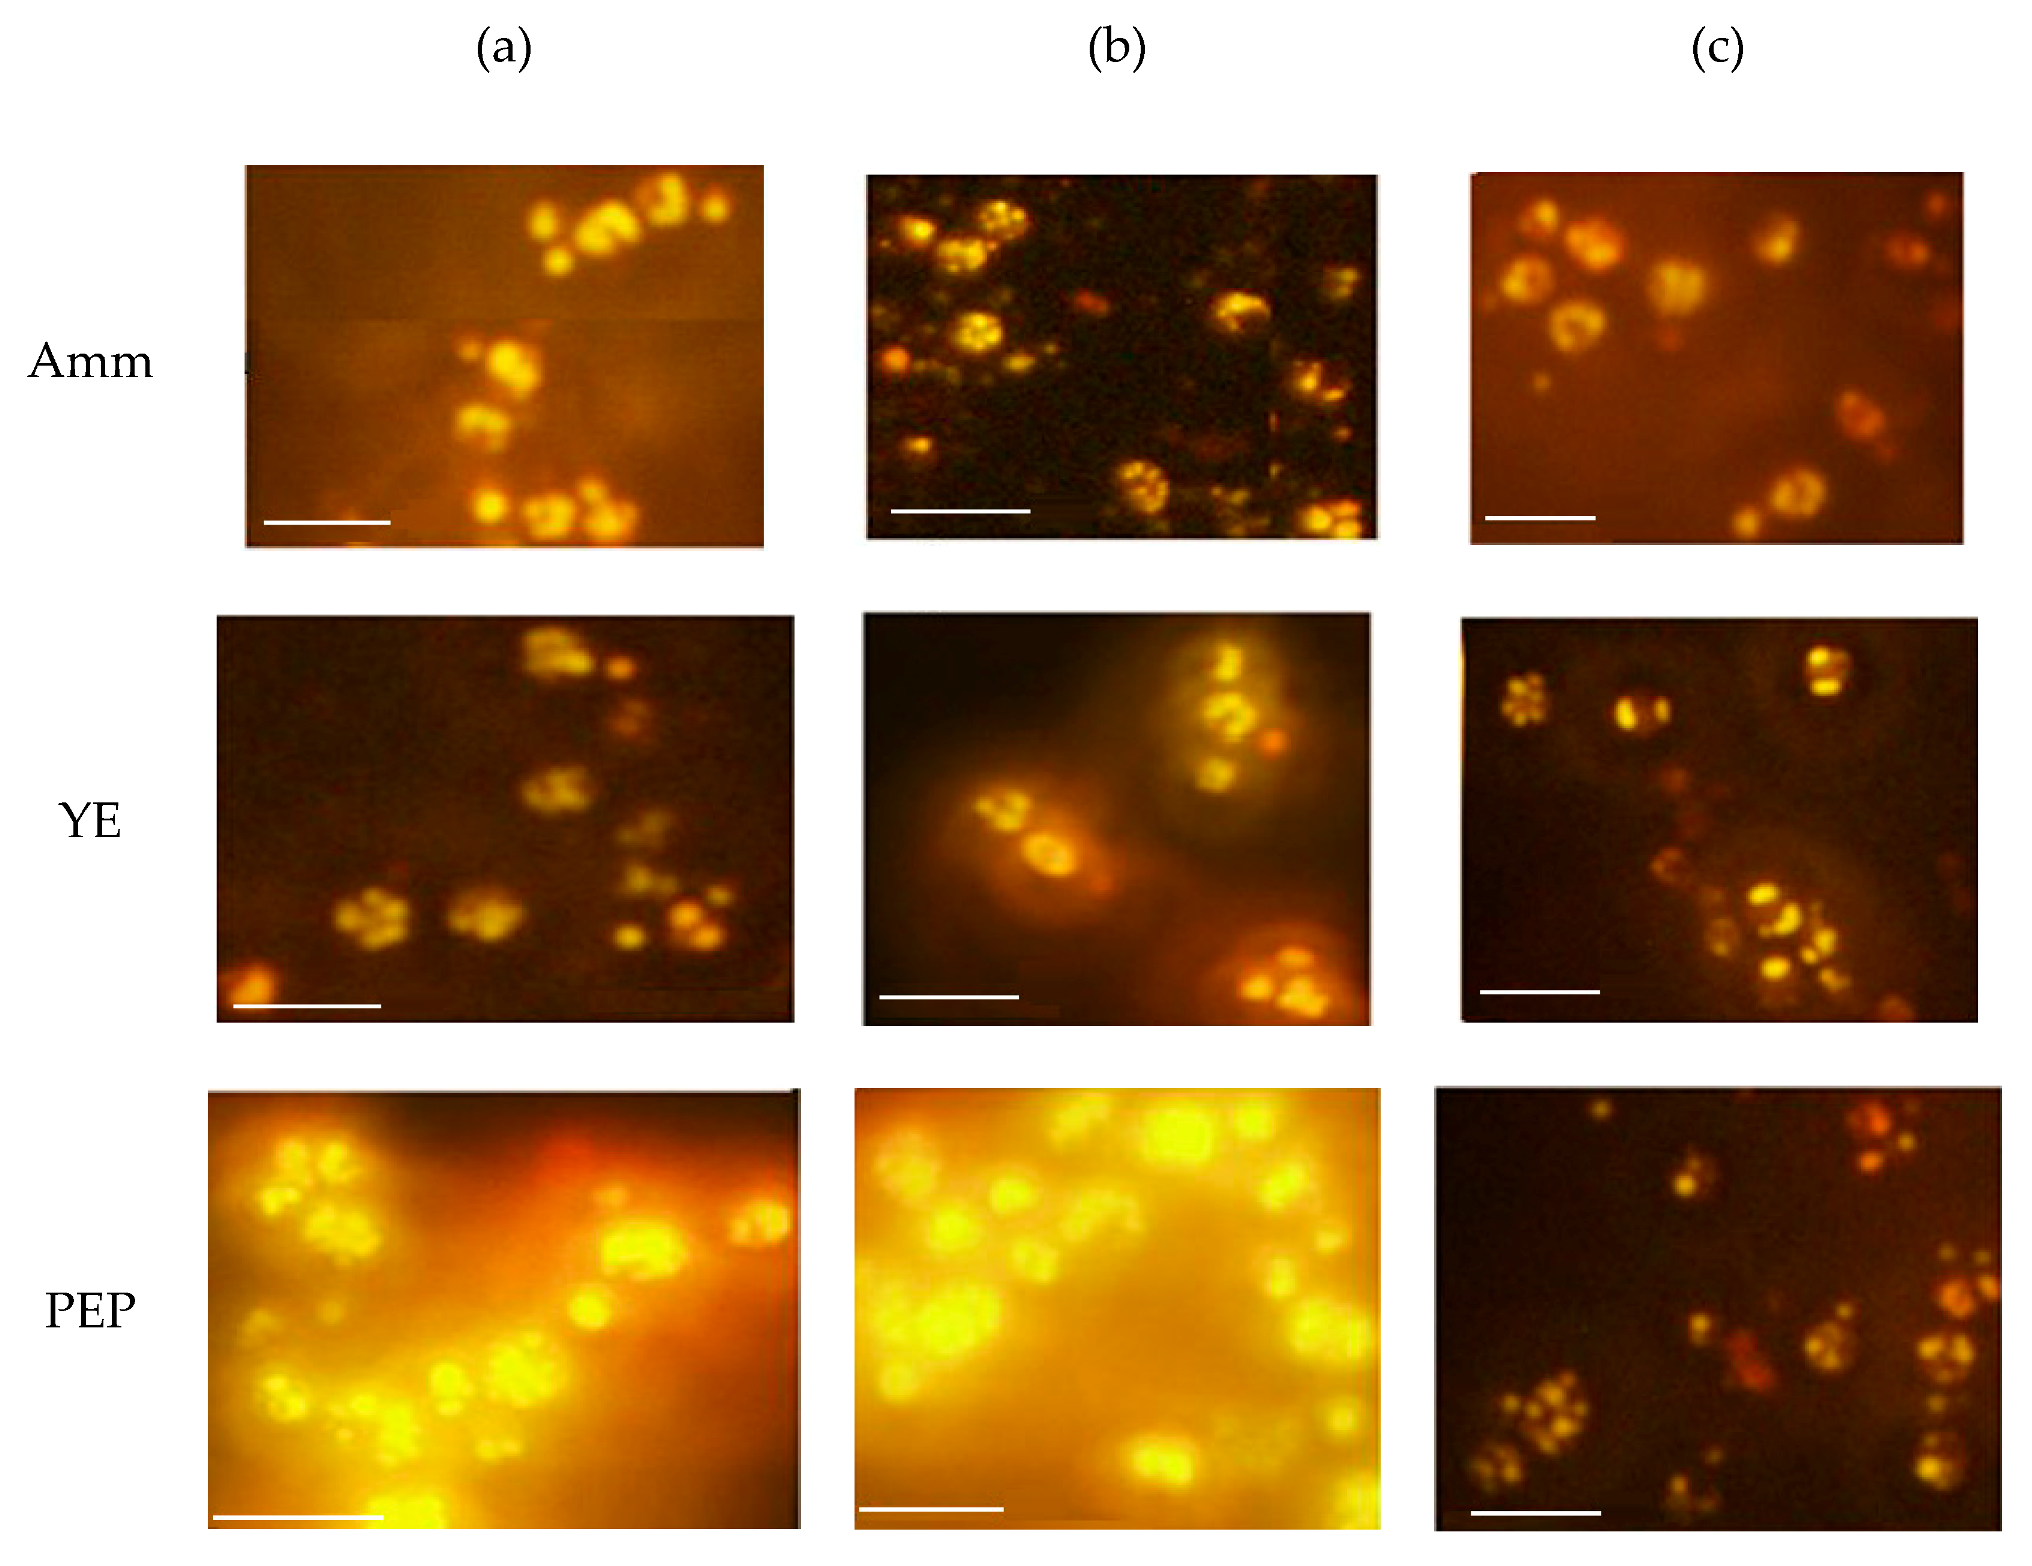
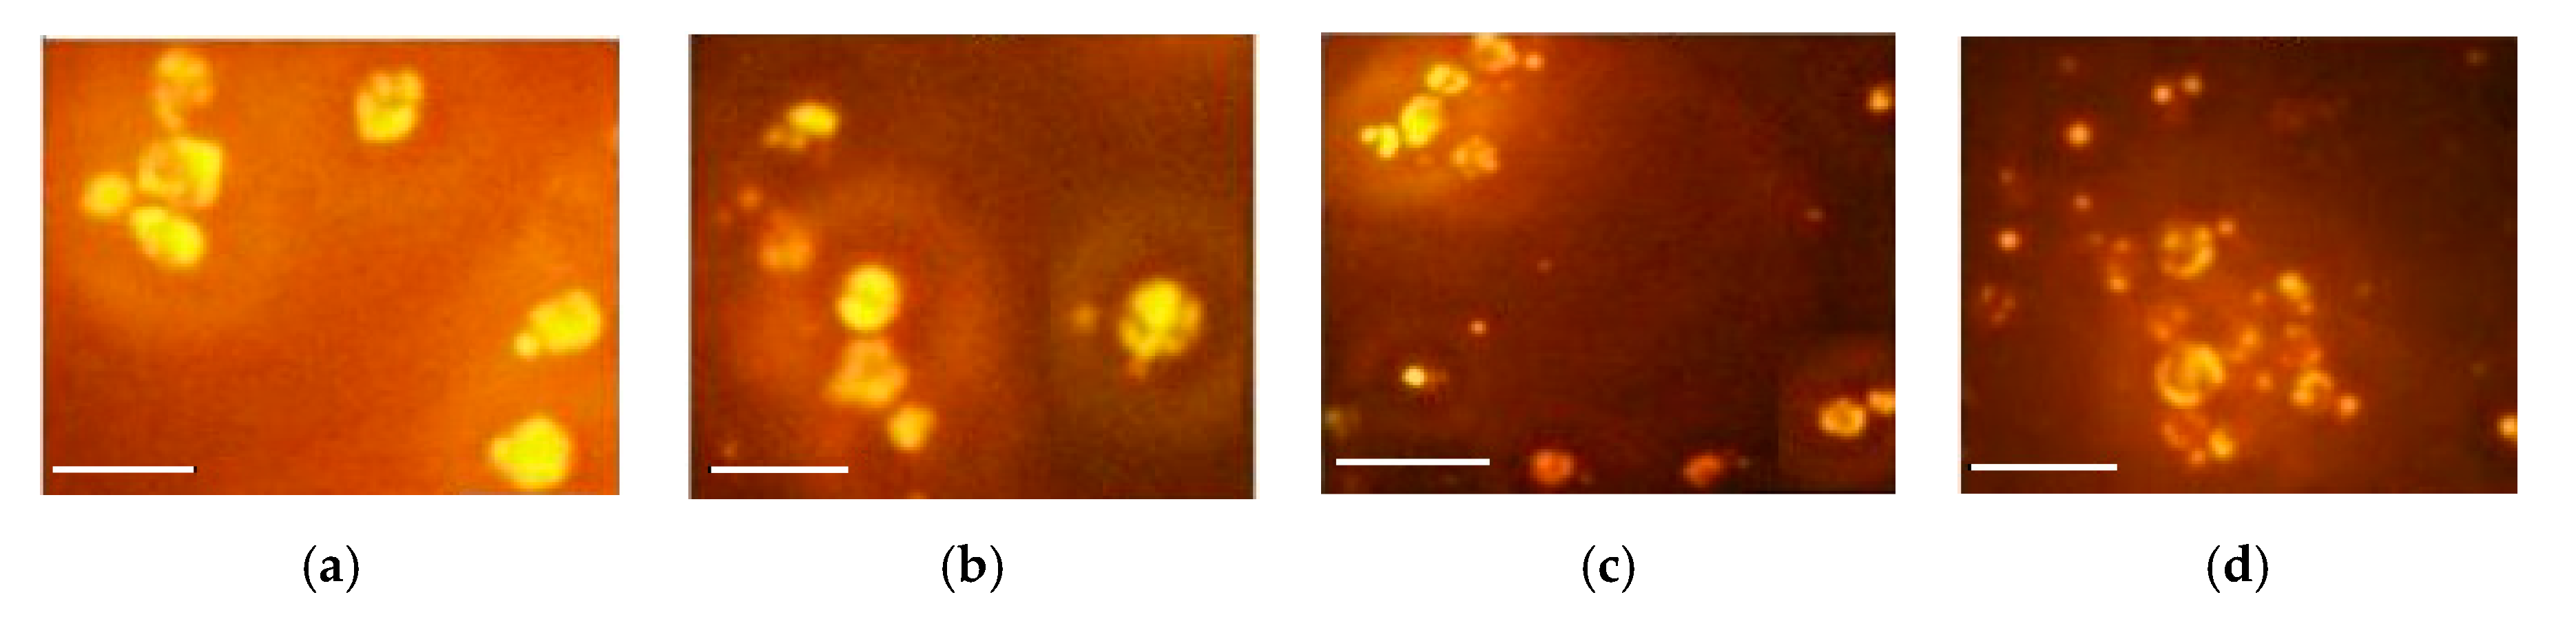
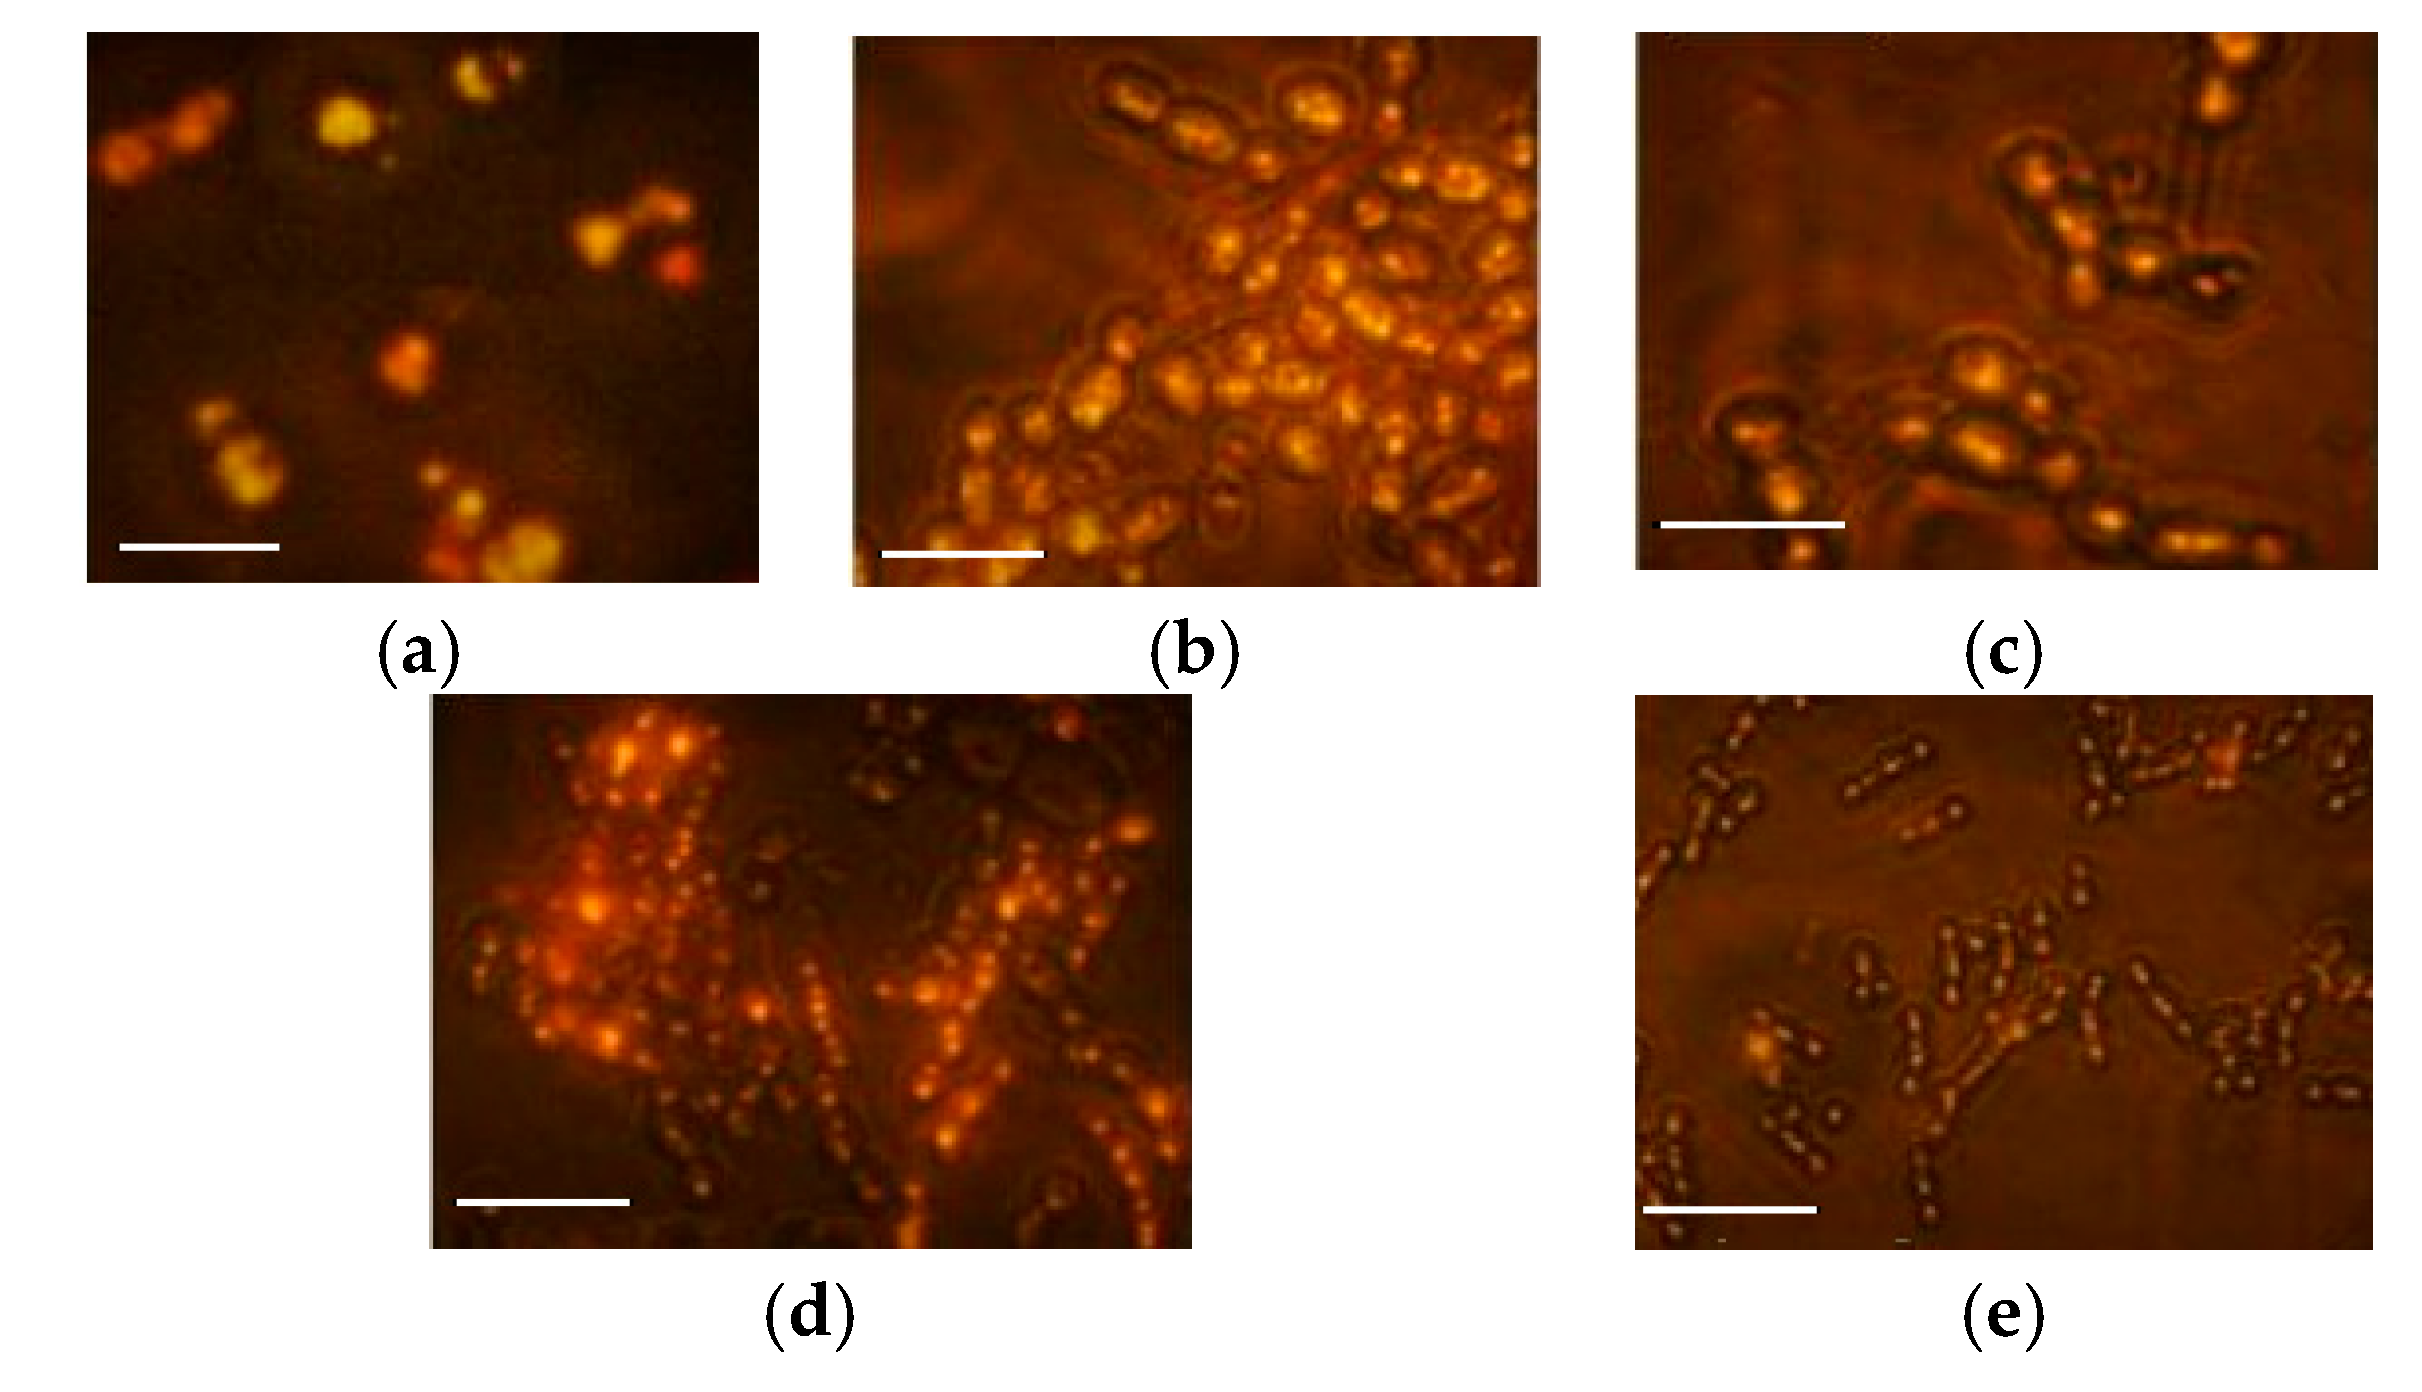
2.4. Nile Red Staining and Fluorescence Microscopy of Cultured R. glutinis

Lipid bodies in yeast cells were visualized after staining with Nile red fluorescence dye as described in Kimura et al. [40]. Briefly, 100 µL of yeast suspension was centrifuged at 10,000 rpm and 25 °C for 2 min. Then, the supernatant was discarded and the cell precipitate was washed twice with a 10 mM phosphate buffer. After centrifugation under the same conditions, the cell precipitate was suspended in 100 µL of a 10 mM potassium phosphate buffer with 0.15 M potassium hydroxide, pH 7, and mixed with 10 µL of Nile red solution (1 mg of Nile red in 1 mL of acetone and kept in the dark at 4 °C). After 5 min in the dark, the cells were viewed using a Olympus IX71 fluorescence microscope equipped with a blue fluorescence cube and IX71 frame camera port (Tokyo, Japan).

2.5. Total Lipid Detection of Cultured R. glutinis

The total lipids in the yeast cells were detected using the sulfo-phospho vanillin method [41]. Briefly, fresh cells were collected from 200 µL of a yeast suspension culture mixed with 2 mL of concentrated H2SO4 and 100 µL distilled water. The mixture was heated at 100 °C for 10 min, then cooled for 5 min in an ice bath. After that, 5 mL of freshly prepared PVR (phospho-vanillin reagent) was added, and the mixture was incubated at 37 °C and 200 rpm for 15 min. The samples were kept in the dark for 40 min, and then the optical density (OD) was measured at 530 nm. The calibration was carried out by treating different concentrations of olive oil with the same method as the sample.

2.6. Extraction and Assay of Carotenoid

Freeze-dried cells from a 10 mL culture were hydrolyzed by boiling with 1 mL of 1 M HCl for 5 min, followed by centrifugation at 8000× g for 5 min, then were washed with pure H2O to neutral pH. The hydrolyzed cells were gradually mixed with 1 mL acetone, then 0.5 mL ethyl acetate and 0.5 mL petroleum ether, with the gradual adding of solvent leading to a better carotenoid extraction yield than adding the solvent mixture together. Finally, the mixture was washed with 5 mL water, then centrifuged, and the upper colour phase was collected; the last step was repeated till complete carotenoid extraction. The collected solvent mixture was dried under vacuum, then dissolved in 1 mL hexane. The dissolved carotenoid was filtrated through a 0.45 µm microfilter for further analysis. All the above operations were performed under subdued light to avoid pigment degradation. The total carotenoid was determined by measuring the optical density using a spectrophotometer (Spectra Max M2, USA) at 485 nm [42]. The total carotenoid content of the yeast cells was calculated and expressed as carotenoid relative productivity (Car-RP) µgpigment/DCW and volumetric carotenoids (TP) mg/L of culture. The extinction coefficient ( E 1 c m 1 % ) 2680 was used.
Individual carotenoids were separated using reversed-phase High performane liquid chromatography (HPLC, Agilent 1100 series, USA) with a UV detector using a column (C18, 5 µm, 250 × 4.6 mm, Diamonsil plus, Cat# 99403). The mobile phases were acetonitrile and H2O (9:1, v/v) as eluent A, and ethyl acetate with 1% formic acid as eluent B. The flow rate was 0.5 mL/min, and the UV-visible absorption spectra was at 501 nm. The column temperature was set at 25°C, and the injection volume for the samples was 40 µL. A gradient program was performed: 0–5 min, 100% A; 5–15 min, 100% B; 15–20 min, 100% A, according to the reported method with slight modification [43]. β-carotene and γ-carotene were identified through commercial standards (Sigma-Aldrich, St. Louis, MO, USA), while torulene and torularhodin were prepared and used as a standard for HPLC analysis [43].

2.7. The Kinetics of Lipid and Carotenoid Biosynthesis

According to Certik and Shimizu [44], the primary parameters were determined in this study to be dry cell weight (DCW) g/L, total lipid (TL) g/L, and total pigment (TP) mg/L. The relative productivity (RP) represents the cellular lipid (L-RP) and carotenoid ((gLipid/gDCW × 100)% and mgpigment/100gDCW, respectively). The yield of product (Y) represents the entire amount of DCW (DCW-Y), TL (TL-Y), and TP (TP-Y) formation from the total consumed substrate gDCW/100gglucose, glipid/100gglucose, and mgpigment/100gglucose, respectively. The rate of product synthesis (P-SR) is the average speed of total production of TL (L-SR) g/L·day and TP (Car-SR) µg/L·day and calculated using the following equation:
L SR   ( lipid   synthesis   rate ) = dL dt = L 2 L 1 t 2 t 1
Car SR   ( Carotenoid   synthesis   rate ) = dC dt = C 2 C 1 t 2 t 1
where L1 and L2 are the lipid concentrations (g/L) at times t1 and t2, respectively, and C1 and C2 are the carotenoid concentrations (µg/L) at time t1 and t2., respectively.

2.8. Statistical Analysis

All experiments were repeated three times. The data are expressed as the mean ± SD. Statistical analysis was carried out using Origin 8.6 (Northampton, Massachusetts, USA), and comparisons of each group were evaluated using one-way analysis of variance (ANOVA) in SPSS 19 software (IBM, USA). The results were considered statistically significant at p < 0.05.

3. Results

3.1. Effect of Different Nitrogen Sources and Different C/N Ratios on Cell Biomass, and Lipid and Carotenoid Production by R. glutinis

The effect of different nitrogen sources PEP, YE, and Amm with different concentrations (C/N ratios 146, 94, and 70) was studied. Those ratios were selected in accordance with our previous work, which showed the best range for the highest lipid and carotenoid production using a mixture of Amm and YE as a nitrogen source (data not shown).
At the end of incubation, the cells were collected and examined under a fluorescence microscope after staining with Nile red fluorescence dye. The differences in the cells size and golden fluorescence lipid bodies were shown in Figure 1. The largest cells with highly accumulated lipid bodies were observed with PEP at a C/N ratio of 146 and a C/N ratio of 94 (Figure 1a,b with PEP). The number of lipid bodies inside the cells was reduced when the C/N ratio decreased. This qualitative result indicated that when using peptone with a high C/N as a nitrogen source for yeast cultivation, lipid production was dramatically increased compared with other nitrogen sources.
As shown in Table 3, the lower C/N ratios with an organic nitrogen source were more favourable for biomass production; the highest biomass was 12.2 g/L after six days, which was achieved with YE. The enhancement of biomass production with YE may be related to the high vitamin content in the yeast extract compared with PEP as organic nitrogen sources. In contrast, increasing the C/N ratio from 70 to 146 was accompanied by the increase of lipid accumulation in yeast cells whatever nitrogen source was used. Similarly, the rapid stimulation of lipogenesis in R. glacialis and Rhodotorula kratochvilovae was achieved when the yeast was cultivated on a medium with high C/N ratios of 160 and 120, respectively [45,46]. On the other hand, an increase of C/N ratio in medium from 20 to 70 was accompanied by a lipid accumulation increase in R. glutinis [10,12], but had a negative effect on lipid accumulation was found [10], and also no effect on lipid accumulation [12], when the C/N ratio was further increased to 100. The reasons for the lipid accumulation increase with a high C/N ratio, even at 146 (Table 3) and 160 [45], could be related to the ability of the yeast strain to resist a high sugar concentration, where the R. glutinis used in this study is able to grow at a high 30% glucose concentration (data not shown).
PEP was considered the best nitrogen source for lipid accumulation from R. glutinis, and L-RP was highest at the C/N ratios of 146, 96, and 70 with 54.2%, 51.5%, and 46.9%, respectively, after 6 days of cultivation. This is consistent with reported data from Trichosporon fermentans [47]. Comparing with other nitrogen sources, the highest L-SR was recorded with YE because of the high biomass production (Table 3).
For carotenoid production in R. glutinis, the total volumetric pigment increased with decreasing C/N ratio, recording 0.53, 0.852, and 0.881 mg/L with PEP, YE, and Amm after six days, respectively, which was mainly due to the high biomass production. Whatever the nitrogen sources, cellular carotenoid accumulation was enhanced significantly in a high C/N ratio compared to a low C/N ratio, as an approximately 1-fold increase was observed when Amm-C/N 146 was compared with Amm-C/N 70; this result is similar to Braunwald et al [12]. On the other hand, there was no effect of C/N ratio change on carotenogenesis in R. mucilaginosa and cellular pigment accumulation in R. glutinis [19,48]. It was also reported that pigment accumulation was reduced dramaticly under a high C/N ratio due to lipid production [10,23]. We believe that the enhancement of carotenoid production in R. glutinis during the first period of cultivation (3 days) could be the reason for the high C/N ratio and high starter glucose concentration, which is considered as an unusual condition for growth; the same result was reported where carotenoid production is commonly increased under unfavourable growth condition [49]. With lipogenesis starting and after nitrogen exhaustion, the cells came out from lipid production and started to shift the carotenoid pathway partially toward torulene as a better antioxidant than β-carotene and γ-carotene to protect the cell from oxidative damage [15]. However, with the further incubation of yeast, the culture condition changed to a low pH and there was a shortage of nutrient, which became more favourable for lipid overaccumulation instead of carotenoid accumulation, leading to decreasing carotenoid production.
Amm showed the highest cellular carotenoid production of 84.6 µg/g at 146 C/N after three days, while YE and PEP at 94 C/N were 70.7 and 58.5 µg/g, respectively. The differences in the cellular carotenoid production when different nitrogen sources were used may be related to the C/S ratios as illustrated in Table 1, which suggested the stimulatory role of sulfate concentration for the enhancement carotenoid production. Similarly, the higher cellular carotenoid with Amm but followed by peptone under C/N 10 was observed to have a torulene dominancy at ratios of 58% and 80% [50], while another study observed the higher growth and carotenoid accumulation with an organic nitrogen source rather than an inorganic nitrogen source [19].
The highest cellular carotenoid (Car-RP) and carotenoid synthesis rates (Car-SR) were observed on the third day and decreased with further incubation. Additionally, the increase of Car-RP after three days with increasing C/N ratio indicated that the effect of the starter nitrogen concentration on stimulating carotenoid production was significant. The low starter nitrogen concentration in media enhanced carotenoid production in a short time compared with the higher concentration, but due to the lipogenesis condition (sharing Acetyl-CoA as precursor with lipid), the Car-RP was sharply decreased with further incubation contrary to the higher starter nitrogen concentration where the conditions may be still not ideal for lipid production (Table 3).
Kinetically, the reversed relationship between carotenoid and lipid production was observed when the yield and synthesis rate of both products were compared. As the highest carotenoid yield and synthesis rate was observed on the third day, while the highest lipid yield and synthesis rate were observed on the sixth date. The reverse relationship between lipid and carotenoid production by red oleaginous yeasts was also reported in References [10,23].
When the effect of nitrogen sources and the C/N ratio were statistically analyzed using SPSS with a multivariate test, nitrogen sources were found to be more highly significant with TP, TL, and DCW than the C/N ratio. The combination of nitrogen source and C/N ratio was only highly significant with TP (Supplementary Data S1).

3.2. Effect of Different C/S Ratios on Biomass, Lipid, and Carotenoid Production

Based on a previous experiment, although the C/N ratio and the starter glucose concentration were fixed, there were apparent differences between lipid and carotenoid production when using different nitrogen sources. The reason may be attributed to the sulfate concentration. As shown in Table 1, the C/S ratio decreased with an increasing ammonium sulfate concentration in the culture media. As a result, a further experiment was designed to adjust the C/S ratio using MgSO4.
The effect of different sulfate concentrations on the cell morphology and lipid bodies is shown in Figure 2, where the largest cells with more lipid bodies were observed at 0.5 g/L of MgSO4 (C/S 254) followed by 1 g/L (C/S 166).
DCW was increased slightly to 10.91 g/L at C/S 98 with a gradual decreasing of the C/S ratio after the sixth day (Table 4). The DCW of the C/S ratio 254 treatment was statistically significant with C/S ratio 123 treatment at the third day, while on the sixth day, the DCW of the C/S ratio 254 treatment was highly significant with C/S 123 and C/S 98.
For lipid production, the result was similar to the above-described experiment as the highest C/S ratio 254 enhanced total lipids and cellular lipids greatly to be 5.1 g/L and 53.4%, respectively. C/S ratio was significantly affected lipid production on the sixth day, as the TL of C/S ratio 98 was statistically significant with C/S 254 and C/S 166. This result is similar to the previous study, which demonstrated that sulfate limitation was effective at promoting the accumulation of substantial amounts of intracellular lipids by the oleaginous yeast Rhodosporidium toruloides Y4. When the yeast strain was cultivated on a medium with an initial carbon-to-sulfur (C/S) molar ratio of 46,750, the cellular lipid content reached up to 58.3% [26].
In contrast to lipids, TP production increased with decreasing C/S ratios to be 0.875 mg/L at C/S 98 compared with 0.528 mg/L at C/S 254, which represents around a 1.7-fold increase. Also, the total pigment of C/S ratio 254 was statistically significant with TP of C/S 98 and highly significant with C/S 123 after three days, and was statistically significant with C/S 166, C/S 123, and C/S 98 after six days. Additionally, Car-RP kept increasing with the gradual decreasing of the C/S ratio to be almost the same—85.9 µg/g and 86 µg/g at C/S ratio 123 and C/S ratio 98, respectively—compared with 70.7 µg/g at C/S 254 after three days, which represented around a 1.2-fold increase. The reports on the effect of the C/S ratio on carotenoid production by yeast are still few in number. An earlier study reported the effect of MgSO4 on carotenoid production by mutant 32 of R. glutinis, where the total pigment reduced by about 1.9-fold due to the low growth rate compared with the control, but the cellular carotenoid increased around 1.1-fold with around 77% β-carotene [19]. Also, a recent report observed around a 2.1-fold increase in volumetric carotenoid produced by R. glutinis when MgSO4 was added to the basal media to shift the carotene profile from β-carotene dominancy to torulene [50]. Remarkably, this result revealed that keeping the C/S ratio lower than the C/N ratio stimulated the carotenoid production over lipid production, which should be considered during carotenoid production under a high C/N ratio.

3.3. The Carotenoid Profile from Different C/N, C/S Ratios and Nitrogen Sources Treatments

Ratios of different individual carotenoids from different treatments using HPLC for separation and identification are shown in Table 5. Generally, the torulene percentage increased with increasing C/N ratios, whatever nitrogen source was used. Torulene predominance with Amm was recorded around 62%, followed by 57.3% with PEP, while yeast extract showed the highest γ-carotene ratio (52.3%) at C/N ratio 70. Similarly, when different C/N ratios were affected on Rhodotorula glutinis, torularhodin and torulene was the dominant carotenoid in all C/N ratios treatments, but the highest β-carotene was observed with low C/N ratio [12]. In another study, the maximum production of β-carotene occurred when R. glutinis was grown in a medium with a low C/N ratio containing a high concentration of both carbon (glycerol, 80 g/L) and nitrogen [51]. Also, shifting the metabolism of carotenoids in Sporidiobolus pararoseus to torulene (up to 58% of total pigments) was observed when the strain was cultivated through a fed-batch fermentation with constant feeding of glucose under a low nitrogen condition [15].
In contrast, the dominance of β-carotene was observed before glucose consumption under C/N 50, while after glucose depletion, the torularhodin was reported as the predominant carotenoid (1.2 mg/L and 1.1 mg/L, respectively), while torulene represented 30% over the total carotenoid at C/N 50 [10].
The effect of different C/S ratios showed no significant effect on the torulene ratio; the torulene ratio was slightly increased with decreasing C/S ratio from 254 to 98 with 50.1% and 54.8%, respectively. Meanwhile, the γ-carotene increased with a decreasing C/S ratio, providing around a 20% increase at the C/S ratio 98 than the C/S ratio 254.

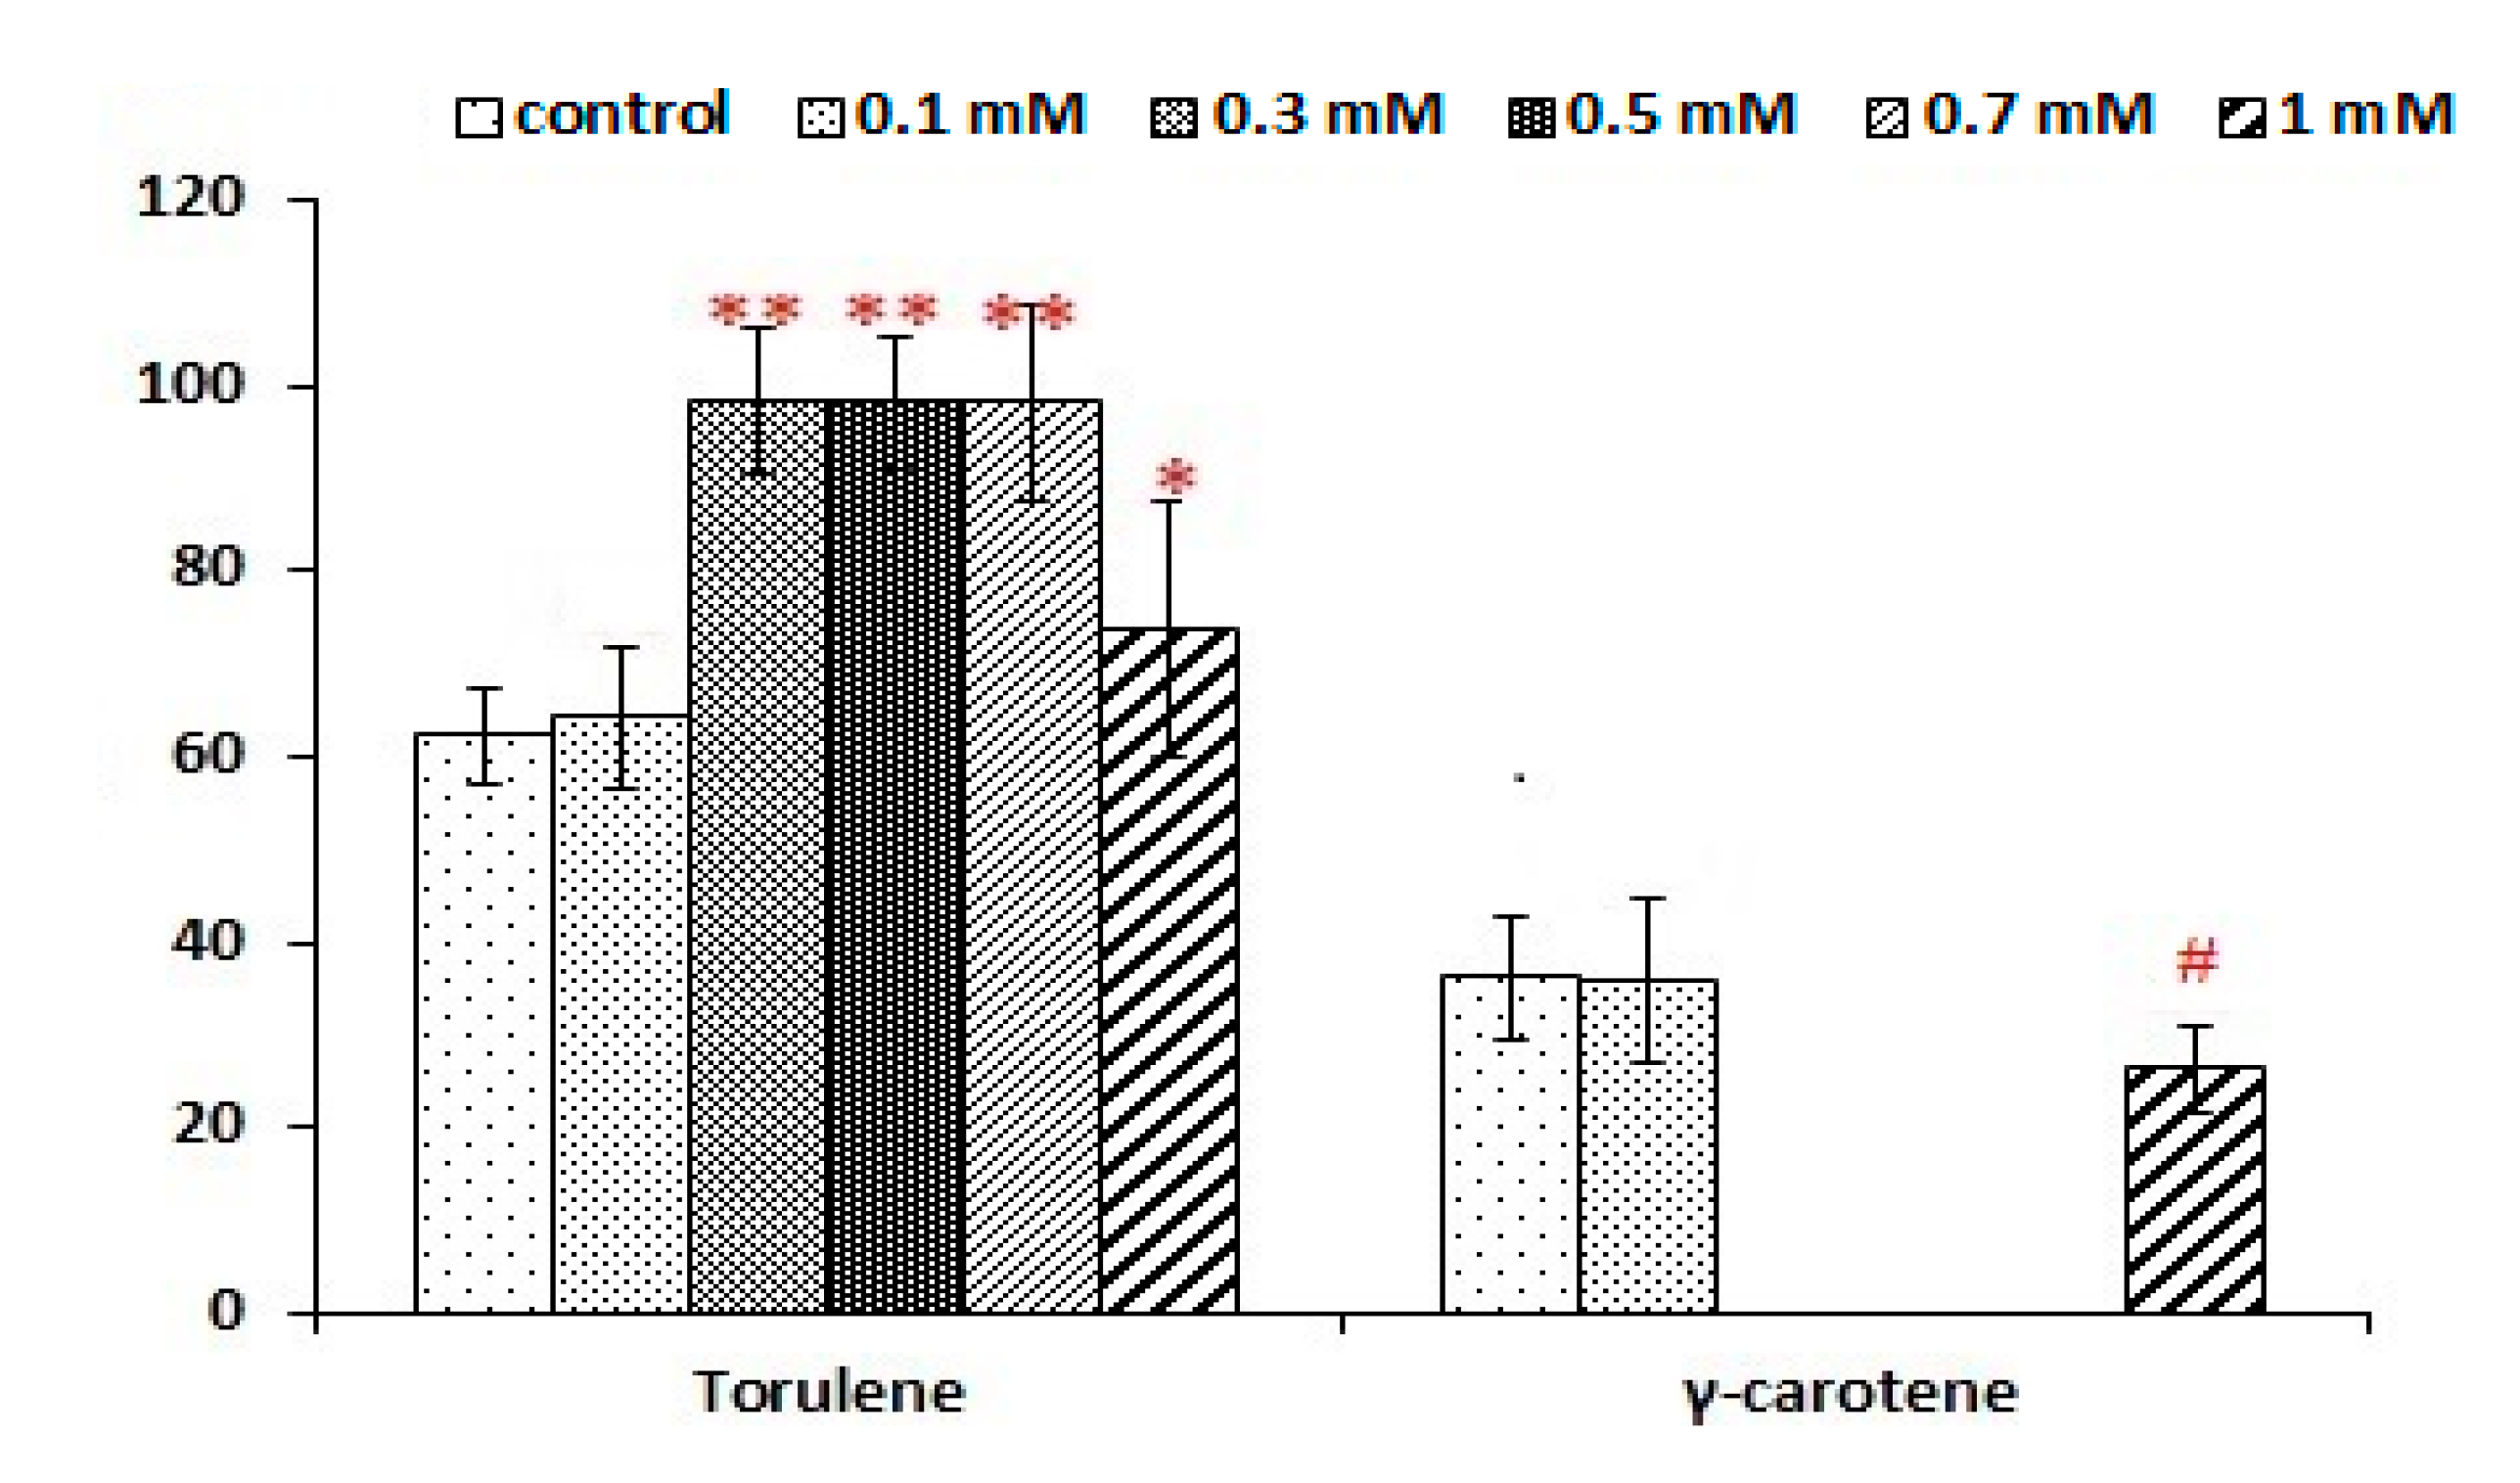
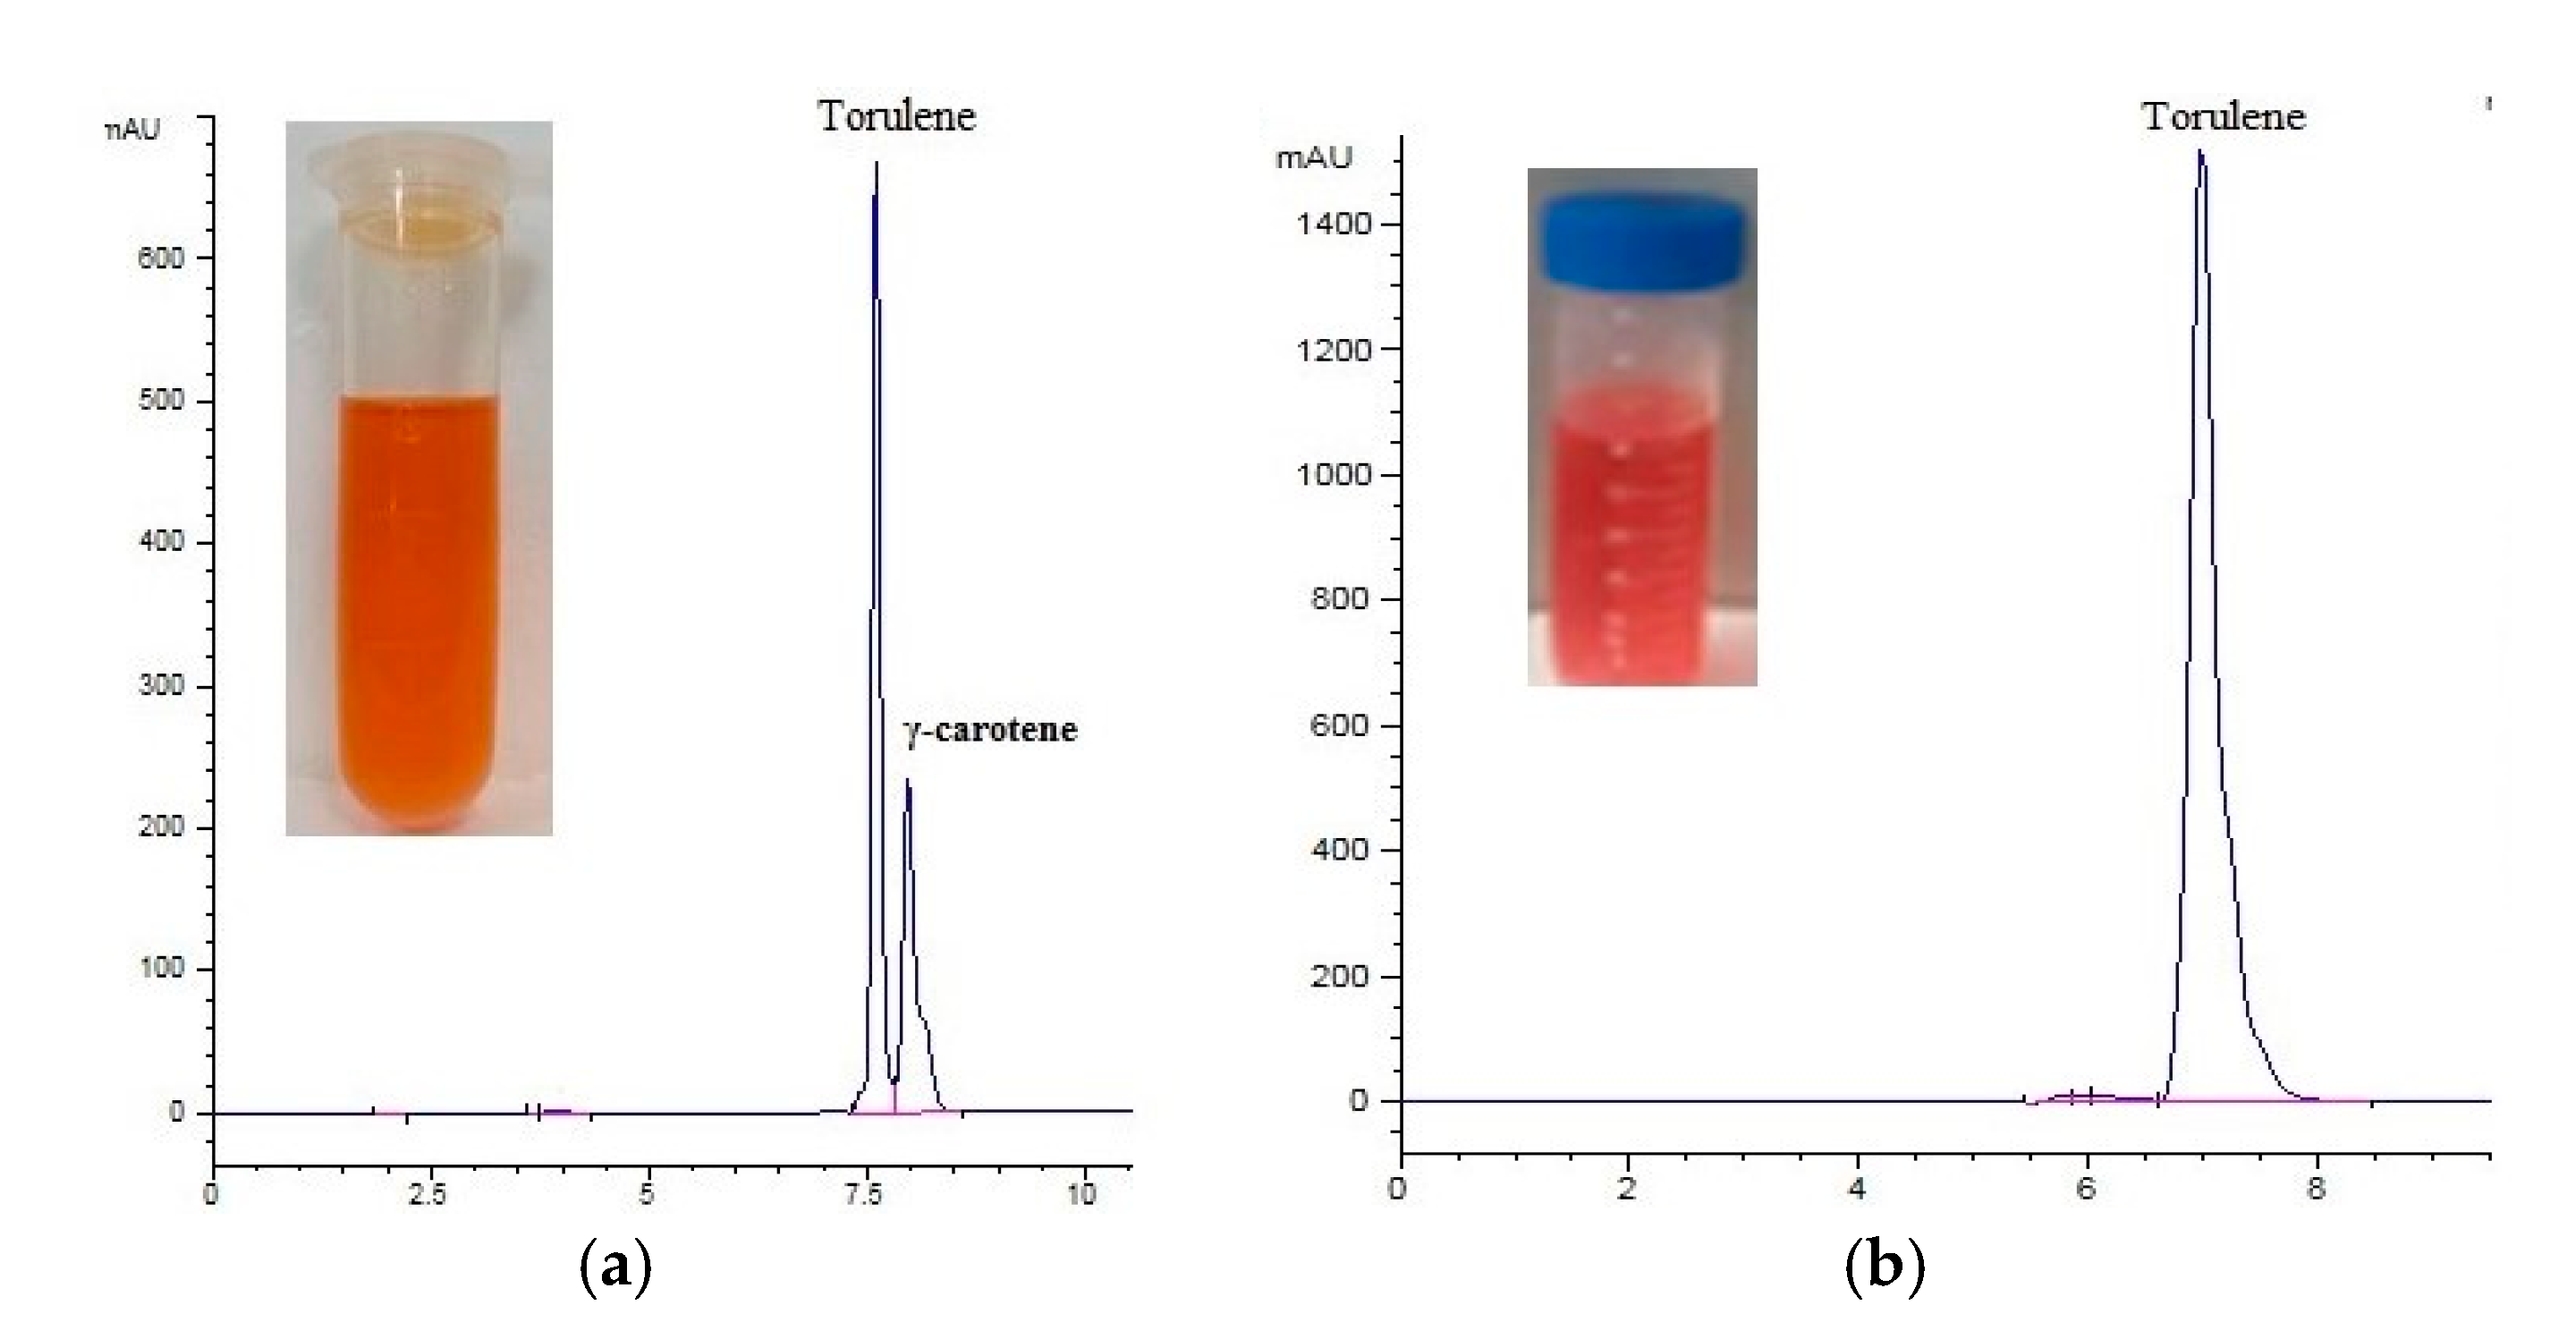
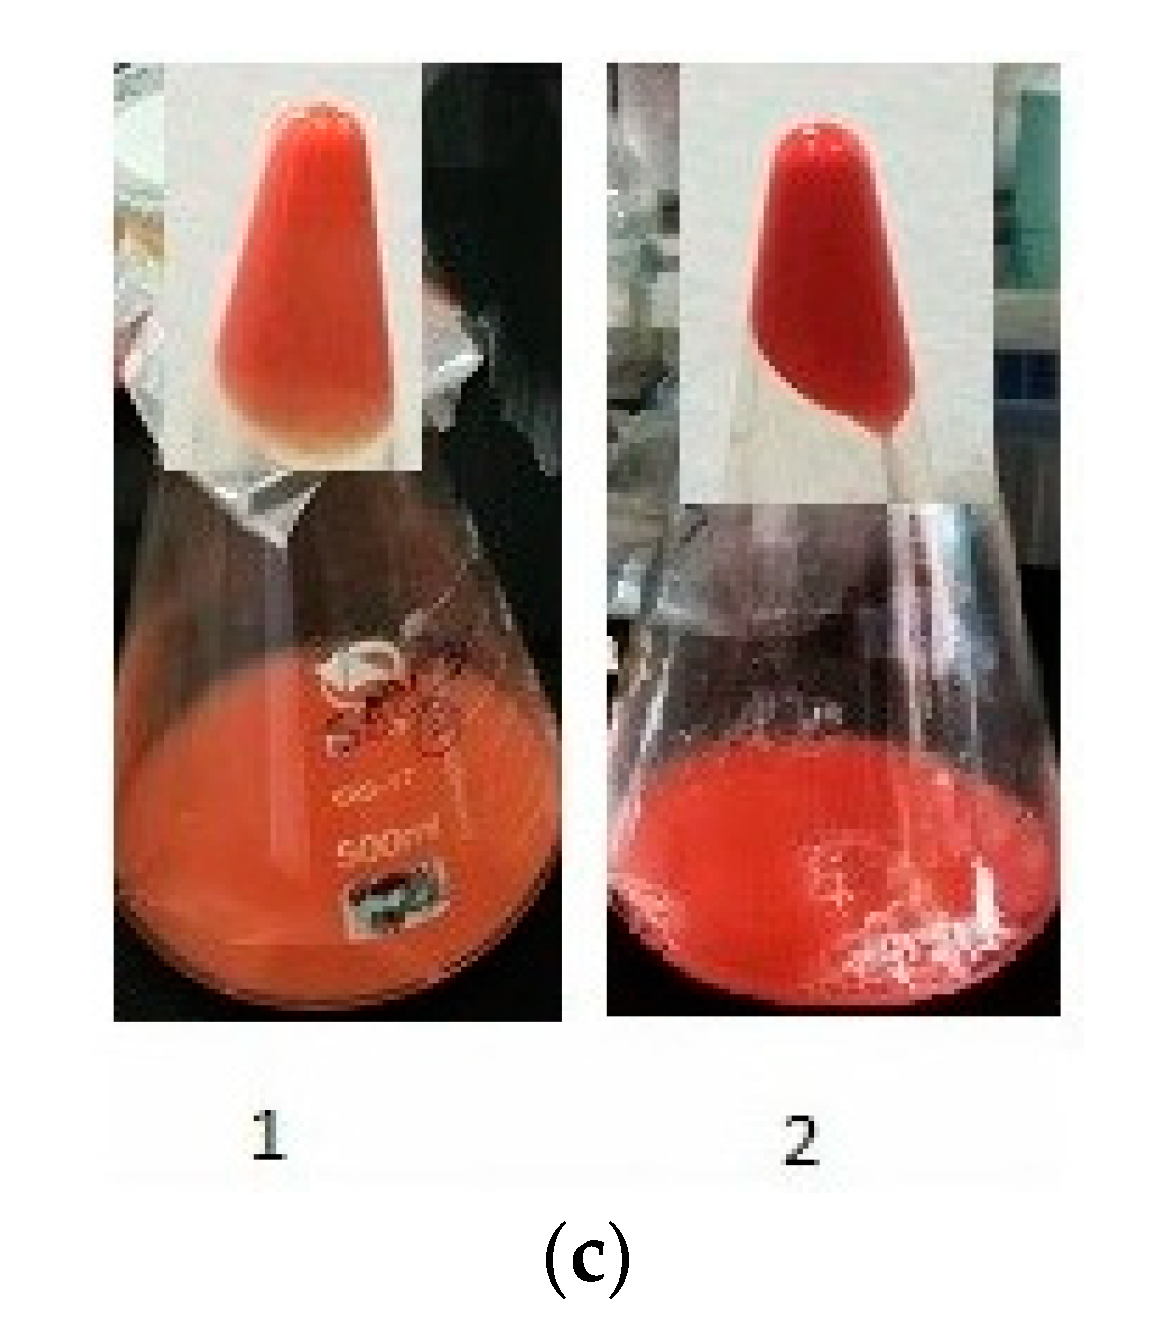
3.4. Impact of Aluminium Sulfate on Lipogenesis and Carotenoid Production

Herein, a new optimized medium was prepared to maximize the carotenoid production under a high C/N ratio, and its effect on the growth and lipid production was also investigated. The optimum conditions can be summarised as follows: using Amm as a sole nitrogen source, keeping the C/N ratio at 149, and adjust the C/S ratio with MgSO4 to 120. By using this medium as a control, different Al2(SO4)3 concentrations were added after medium sterilization then its effects on growth, lipid, and carotenoid production by R. glutinis were studied.
First, the Nile red treated cells were examined under fluorescence microscopy, as shown in Figure 3. In the optimized media (control group), the size of the cell was reduced, and the number of golden fluorescent lipid bodies was also reduced compared with the same C/N ratio using Amm as a nitrogen source (C/S ratio 133); this indicated that reducing the C/S ratio led to a slight decrease in lipid production. When adding 0.1 mM Al2(SO4)3, no significant difference was observed between this treatment and the control one. The lipid bodies were obviously decreased, starting from 0.3 mM while the cells remained enlarged. With a higher concentration of Al2(SO4)3, the lipid bodies were greatly reduced to be scarcely observed at 1 mM.
The effect of different Al2(SO4)3 on DCW, TL, and TP production by R. glutinis after six days is described in Figure 4. First, the growth in the control was around 10.6 g/L and remained almost steady above 10 g/L till 0.7 mM, after which, the growth gradually decreased with increasing Al2(SO4)3 concentrations up to 10 mM, at which no growth was observed, and the effect of aluminium was statistically significant at 4 mM and highly significant at 6 and 8 mM compared with the control (Figure 4a). Contrary to the studied yeast strain, another study carried out on Rhodotorula taiwanensis RS1 found that RS1 is a high-aluminium (Al)-tolerant yeast that can survive in Al concentrations up to 200 mM [52].
Total lipid and L-RP of the control reached 4.68 g/L and 44.1%, respectively (decreased by around 8.2% compared with Amm at C/N 146 and C/S ratio 133). After adding 0.1 mM from Al2(SO4)3, the lipid production was slightly enhanced to 4.74 g/L and 44.55%, respectively. However, gradually increasing Al2(SO4)3 in the growth medium sharply reduced TL and L-RP to 2.6 g/L and 24.8%, respectively, at 0.7 mM, which is an approximately 50% decrease compared to the control, respectively. The further increasing of Al2(SO4)3 concentrations in the growth medium kept reducing the lipid accumulation inside the cells to being scarcely produced at 8 mM (0.61 g/L and 13.2%, respectively). The statistical analysis showed the significant difference of lipid production at 0.3 mM aluminium and there was a highly significance difference with further higher concentrations of aluminium sulfate compared with the control (Figure 4b). The remarkable reduction in lipid production after adding aluminium sulfate to the medium may be related to its effect on the phospholipid pathway and increased lipid peroxidation, as reported in References [37,38], when the effect of aluminium ions studied regarding lipid peroxidation in the root tips of soybean and on ox-brain phospholipid liposomes after inducing by iron(II) salts at acidic pH values. On the other hand, recent studies that were carried out on algae point to the role of metal stress in enhancing lipid production by algae for iron, magnesium, and calcium under dark condition [53], and copper and cadmium ions under heterotrophic culture conditions [54].
In contrast to lipids, carotenoid production was stimulated with the new optimized medium to 0.95 mg/L with cellular carotenoids around 89.04 µg/g, compared with Amm with C/N 146 and C/S 133 (increased around 1.2- and 1.1-fold, respectively). Surprisingly, the gradual adding of Al2(SO4)3 to the growth medium led to a dramatic increase of total pigment and cellular carotenoid to 2.21 mg/L and 212.9 µg/g, respectively, at 0.7 mM, which is an increase of around 2.3- and 2.4-fold, respectively, compared with the control (Figure 4c). Aluminium sulfate showed statistical significance regarding pigment production by R. glutinis at 0.3 and 4 mM, and was highly significant at the in-between studied concentrations. All the reports studying the effect of metal on carotenoid production confirmed its stimulatory role on carotenoid production, which is explained by hypothesising a possible activation or inhibition mechanism of selected metal ions on specific carotenogenic enzymes, in particular, on specific desaturase involved in carotenoid biosynthesis [14].
In contrast to lipids, carotenoid production was stimulated with the new optimized medium to 0.95 mg/L with cellular carotenoids around 89.04 µg/g, compared with Amm at C/N 146 and C/S 133 (increased around 1.2- and 1.1-fold, respectively). Surprisingly, the gradual adding of Al2(SO4)3 to the growth medium led to a dramatic increase of total pigment and cellular carotenoid to 2.21 mg/L and 212.9 µg/g, respectively, at 0.7 mM, which was an increase of around 2.3- and 2.4-fold, respectively, compared with the control (Figure 4c). Aluminium sulfate showed statistical significance on pigment production by R. glutinis at 0.3 and 4 mM, and was highly significant at the in-between studied concentrations. All the reports that have studied the effect of metal on carotenoid production confirmed its stimulatory role on carotenoid production, explaining this by hypothesising a possible activation or inhibition mechanism of selected metal ions on specific carotenogenic enzymes, in particular, on a specific desaturase involved in carotenoid biosynthesis [14]. Elsewhere, it was noted that the determination of physiological and biochemical changes of Rhodotorula mucilaginosa AN5 after progressive copper treatment stated a significant increase in the antioxidative reagents content and enzymes activity, which quenched the active oxygen species to maintain the intercellular balance of the redox state and ensure the cellular fission and growth [55]. Another recent study implemented multi-omics metabolism analysis to investigate the mechanisms involved in irradiation-induced stress resistance in R. glutinis. The results confirmed the significant upregulation of the carotenoid biosynthetic pathway, which revealed that increased carotenoid content is a cellular defence mechanism against oxidative stress generated by irradiation [56]. Focusing mainly on aluminium, there is a study that reported that most divalent cation salts increase cellular carotenoid accumulation, and observed an around 1.6-fold increase in both volumetric and cellular carotenoids compared with the control, as well as an around 9% torulene increase when AlNO3 was tested as a stress factor [18].
The carotenoid fractions showed a 62% domination of torulene in the control treatment, which had around the same ratio compared with Amm-146 C/N (C/S 133). The torulene ratio was increased to 65% with 0.1 mM Al2(SO4)3, then increased to 98% with the further higher concentrations till 0.7 mM, followed by decreasing again to 73% with 1 mM (Figure 5). The retention times of γ-carotene and torulene with the control and 0.5mM Al2(SO4)3 treatment is shown in Figure 6a,b.
Memorably, after adding aluminium sulfate into the optimized medium, a characteristic intense red pigmentation of yeast pellets was observed, which indicated the effect of the new conditions on both the carotenoid composition and concentration (Figure 6c).
Finally, comparing the production of carotenoid and torulene from this study with the previously reported studies that used glucose as carbon sources under flask fermentation conditions is shown in Table 6. Most of the previous literature used low C/N ratios for optimizing carotenoid production [12,19,50,57], while other studies also conducted the experiments under a high C/N ratio, and a high yield of carotenoid was produced [10,11,12]. The differences in the yield of carotenoid production under different C/N ratios may be mainly related to different yeast strains, as each strain responds differently under different culture conditions. The highest carotenoid producing Rhodotorula strain was R. glutinis JMT 21978, which accumulated around 1.6 mgpigment/gdcw cellular carotenoid with around 30% torulene when the yeast strain cultivated on growth medium was supplied with glucose and yeast extract as the carbon and nitrogen source, respectively (C/N ratio 50:1) [10]. Although the studied yeast strain Rhodotorula glutinis can be classified as a moderate carotenoid-producing strain, our strategy could improve the production of torulene to be one of the highest reported Rhodotorula species until now.
It is noteworthy that other studies have produced a significant yield of both lipids and carotenoids by growing oleaginous red yeasts on different wastes, such as waste glycerol and deproteinized potato water, potato wastewater with glycerol, brewery effluents, and palm oil mill effluent [9,22,58,59], which is considered as an economic and friendly environment approach to produce highly valuable pigments and oil.

4. Conclusions

To date, mainly β-carotene and astaxanthin have gained commercial interest, while torulene and torularhodin suitable for a commercial applications are still rare. As an attempt to enhance torulene production from R. glutinis under high C/N ratios, adjustments of both the culture conditions and stress exposure were tested to assess changes in the pigments’ abundance profile as compared to the production of lipids. This study showed that carotenoids could be enhanced over lipid production under a high C/N ratio when ammonium sulfate was used as a nitrogen source in combination with a low C/S ratio (120). Moreover, supplying aluminium sulfate in the growth medium (0.7 mM) led to an enhancement in the synthesis of the total pigment, thus of torulene as well, which confirmed the role of metal stress on the accumulation of carotenoids. This study provides a valid and potential strategy for optimizing yeast cultivation conditions to improve the production of carotenoid compounds, specifically torulene, with possibly broad biotechnological applications.

Supplementary Materials

The following are available online at https://www.mdpi.com/2076-3417/9/12/2444/s1, Figure S1: The multivariate tests (SPSS) was used to detect the statistically significant differences between C/N ratio and different nitrogen sources treatments on DCW, TL, and TP after three and sixth days.

Author Contributions

Conceptualization, Y.B.; Experimentation and Writing—Original Draft Preparation, N.E.; Data analysis and Investigation, N.E., Y.Z., J.G.; Review and Editing, Y.B., M.E.

Funding

This research received no external funding.

Acknowledgments

The authors are grateful to Zong-Bao K. Zhao from the Dalian Institute of Chemical Physics for donating the yeast strain Rhodotorula glutinis (AS 2.703).

Conflicts of Interest

The authors declare no conflict of interest.

References

  1. BCC Research. The Global Market for Carotenoids. Available online: https www.bccresearch.com/market-research/food-and-beverage/the-global-market-for-carotenoids.html (accessed on 13 June 2018).
  2. Mannazzu, I.; Landolfo, S.; Lopes, T.; Buzzini, P. Red yeasts and carotenoid production: Outlining a future for non-conventional yeasts of biotechnological interest. World J. Microbiol. Biotechnol. 2015, 31, 1665–1673. [Google Scholar] [CrossRef]
  3. Mussagy, C.U.; Winterburn, J.; Santos-Ebinuma, V.C.; Pereira, J.F.B. Production and extraction of carotenoids produced by microorganisms. Appl. Microbiol. Biotechnol. 2019, 103, 1095–1114. [Google Scholar] [CrossRef] [PubMed]
  4. Lee, P.; Schmidt-Dannert, C. Metabolic engineering towards biotechnological production of carotenoids in microorganisms. Appl. Microbiol. Biotechnol. 2002, 60, 1–11. [Google Scholar] [CrossRef] [PubMed]
  5. Kot, A.M.; Błażejak, S.; Kurcz, A.; Gientka, I.; Kieliszek, M. Rhodotorula glutinis—Potential source of lipids, carotenoids, and enzymes for use in industries. Appl. Microbiol. Biotechnol. 2016, 100, 6103–6117. [Google Scholar] [CrossRef] [PubMed]
  6. Zhu, Z.; Ding, Y.; Gong, Z.; Yang, L.; Zhang, S.; Zhang, C.; Lin, X.; Shen, H.; Zou, H.; Xie, Z.; et al. Dynamics of the lipid droplet proteome of the oleaginous yeast Rhodosporidium Toruloides. Eukaryot. Cell 2015, 14, 252–264. [Google Scholar] [CrossRef] [PubMed]
  7. Sawangkeaw, R.; Ngamprasertsith, S. A review of lipid-based bio-masses as feedstocks for biofuels production. Renew. Sustain. Energy Rev. 2013, 25, 97–108. [Google Scholar] [CrossRef]
  8. Liu, M.; Zhang, X.; Tan, T. The effect of amino acids on lipid production and nutrient removal by Rhodotorula glutinis cultivation in starch wastewater. Bioresour. Technol. 2016, 218, 712–717. [Google Scholar] [CrossRef]
  9. Schneider, T.; Graeff-Hönninger, S.; French, W.T.; Hernandez, R.; Merkt, N.; Claupein, W.; Pham, P. Lipid and carotenoid production by oleaginous red yeast Rhodotorula glutinis cultivated on brewery effluents. Energy 2013, 61, 34–43. [Google Scholar] [CrossRef]
  10. Tkáčová, J.; Čaplová, J.; Klempová, T.; Čertík, M. Correlation between lipid and carotenoid synthesis in torularhodin-producing Rhodotorula glutinis. Ann. Microbiol. 2017, 67, 541–551. [Google Scholar] [CrossRef]
  11. Buzzini, P.; Innocenti, M.; Turchetti, B.; Libkind, D.; Broock, M.; Mulinacci, N. Carotenoid profiles of yeasts belonging to the genera Rhodotorula, Rhodosporidium, Sporobolomyces, and Sporidiobolus. Can. J. Microbiol. 2007, 1031, 1024–1031. [Google Scholar] [CrossRef]
  12. Braunwald, T.; Schwemmlein, L.; Graeff-Hönninger, S.; French, W.T.; Hernandez, R.; Holmes, W.E.; Claupein, W. Effect of different C/N ratios on carotenoid and lipid production by Rhodotorula glutinis. Appl. Microbiol. Biotechnol. 2013, 97, 6581–6588. [Google Scholar] [CrossRef] [PubMed]
  13. Li, C.; Zhang, N.; Li, B.; Xu, Q.; Song, J.; Wei, N. Increased torulene accumulation in red yeast Sporidiobolus pararoseus NGR as stress response to high salt conditions. Food Chem. 2017, 15, 1041–1047. [Google Scholar] [CrossRef] [PubMed]
  14. Buzzini, P.; Martini, A.; Gaetani, M.; Turchetti, B.; Maria, U.; Davoli, P.; Emilia, R. Optimisation of carotenoid production by Rhodotorula graminis DBVPG 7021 as a function of trace element concentration by means of response surface analysis. Enzyme Microb. Technol. 2005, 36, 687–692. [Google Scholar] [CrossRef]
  15. Han, M.; Xu, Z.; Du, C.; Qian, H. Effects of nitrogen on the lipid and carotenoid accumulation of oleaginous yeast Sporidiobolus pararoseus. Bioprocess Biosyst. Eng. 2016, 39, 1425–1433. [Google Scholar] [CrossRef]
  16. Zoz, L.; Carvalho, J.C.; Soccol, V.T.; Casagrande, T.C.; Cardoso, L. Torularhodin and torulene: Bioproduction, properties and prospective applications in food and cosmetics–A review. Braz. Arch. Biol. Technol. 2015, 58, 278–288. [Google Scholar] [CrossRef]
  17. Kot, A.M.; Błażejak, S.; Gientka, I.; Kieliszek, M.; Bryś, J. Torulene and torularhodin: “new’’ fungal carotenoids for industry? Microbl. Cell Fact. 2018, 100, 6103–6117. [Google Scholar] [CrossRef] [PubMed]
  18. Marova, I.; Carnecka, M.; Halienova, A.; Breierova, E.; Koci, R. Production of carotenoid-ergosterol-supplemented biomass by red yeast Rhodotorula glutinis grown under external stress. Food Technol. Biotechnol. 2010, 48, 56–61. [Google Scholar]
  19. Bhosale, P.B.; Gadre, R.V. Production of β-carotene by a mutant of Rhodotorula glutinis. Appl. Microbiol. Biotechnol. 2001, 55, 423–427. [Google Scholar] [CrossRef]
  20. Dias, C.; Sousa, S.; Caldeira, J.; Reis, A.; Lopes da Silva, T. New dual-stage pH control fed-batch cultivation strategy for the improvement of lipids and carotenoids production by the red yeast Rhodosporidium toruloides NCYC 921. Bioresour. Technol. 2015, 189, 309–318. [Google Scholar] [CrossRef] [Green Version]
  21. Zhang, Z.; Zhang, X.; Tan, T. Lipid and carotenoid production by Rhodotorula glutinis under irradiation/high-temperature and dark/low-temperature cultivation. Bioresour. Technol. 2014, 157, 149–153. [Google Scholar] [CrossRef]
  22. Kot, A.M.; Błażejak, S.; Kieliszek, M.; Gientka, I.; Bryś, J. Simultaneous Production of Lipids and Carotenoids by the Red Yeast Rhodotorula from Waste Glycerol Fraction and Potato Wastewater. Appl. Biochem. Biotechnol. 2019, 1–19. [Google Scholar] [CrossRef] [PubMed]
  23. Somashekar, D.; Joseph, R. Inverse relationship between carotenoid and lipid formation in Rhodotorula gracilis according to the C/N ratio of the growth medium. World J. Microbiol. Biotechnol. 2000, 16, 491–493. [Google Scholar] [CrossRef]
  24. Ratledge, C.; Wynn, J.P. The biochemistry and molecular biology of lipid accumulation in oleaginous microorganisms. Adv. Appl. Microbiol. 2002, 51, 1–51. [Google Scholar] [PubMed]
  25. Zhu, Z.; Zhang, S.; Liu, H.; Shen, H.; Lin, X.; Yang, F.; Zhou, Y.J.; Jin, G.; Ye, M.; Zou, H.; et al. A multi-omic map of the lipid-producing yeast Rhodosporidium toruloides. Nat. Commun. 2012, 3, 1112. [Google Scholar] [CrossRef] [PubMed] [Green Version]
  26. Wu, S.; Zhao, X.; Shen, H.; Wang, Q.; Zhao, Z.K. Microbial lipid production by Rhodosporidium toruloides under sulfate-limited conditions. Bioresour. Technol. 2011, 102, 1803–1807. [Google Scholar] [CrossRef] [PubMed]
  27. Valko, M.; Morris, H.; Cronin, M.T. Metals, toxicity and oxidative stress. Curr. Med. Chem. 2005, 12, 1161–1208. [Google Scholar] [CrossRef]
  28. Porwol, T.; Ehleben, W.; Zierold, K.; Fandrey, J.; Acker, H. The influence of nickel and cobalt on putative members of the oxygen-sensing pathway of erythropoietin-producing HepG2 cells. Eur. J. Biochem. 1998, 256, 16–23. [Google Scholar] [CrossRef] [PubMed]
  29. Rainbow, P.; Black, W. Cadmium, zinc and the uptake of calcium by two crabs, Carcinus maenasandEriocheir sinensis. Aquat. Toxicol. 2005, 72, 45–65. [Google Scholar] [CrossRef]
  30. Qiu, J.; Xie, Z.; Wang, W. Effects of calcium on the uptake and elimination of cadmium and zinc in Asiatic clams. Arch. Environ. Contam. Toxicol. 2005, 48, 278–287. [Google Scholar] [CrossRef]
  31. Belcastro, M.; Marino, T.; Russo, N.; Toscano, M. Interaction of cysteine with Cu2+ and group IIb (Zn2+,Cd2+,Hg2+) metal cations: A theoretical study. J. Mass Spectrom. 2005, 40, 300–306. [Google Scholar] [CrossRef] [PubMed]
  32. Stohs, S.J. The role of free radicals in toxicity and disease. J. Basic Clin. Physiol. Pharmacol. 1995, 6, 205–228. [Google Scholar] [CrossRef] [PubMed]
  33. Chen, F.; Shi, X. Intracellular signal transduction of cells in response to carcinogenic metals. Crit. Rev. Oncol. Hematol. 2002, 42, 105–121. [Google Scholar] [CrossRef]
  34. Dandrea, T.; Hellmold, H.; Jonsson, C.; Zhivotovsky, B.; Hofer, T.; Wärngård, L.; Cotgreave, I. The transcriptosomal response of human A549 lung cells to a hydrogen peroxide-generating system: Relationship to DNA damage, cell cycle arrest, and caspase activation. Free Radic. Biol. Med. 2004, 36, 881–896. [Google Scholar] [CrossRef]
  35. Beyersmann, D.; Hartwig, A. Carcinogenic metal compounds: Recent insight into molecular and cellular mechanisms. Arch. Toxicol. 2008, 82, 493–512. [Google Scholar] [CrossRef]
  36. Kochian, L.V. Cellular mechanisms of aluminium toxicity and resistance in plants. Annu. Rev. Plant Physiol. Plant Mol. Biol. 1995, 46, 237–260. [Google Scholar] [CrossRef]
  37. Cakmak, I.; Horst, W. Effect of aluminium on lipid peroxidation, superoxide dismutase, catalase, and peroxidase activities in root tips of soybean (Glycine max). Physiol. Plant. 1991, 83, 463–468. [Google Scholar] [CrossRef]
  38. Gutteridge, J.; Quinlan, G.; Clark, I.; Halliwall, B. Aluminium salts accelerate peroxidation of membrane lipids stimulated by iron salts. Biochim. Biophys. Acta 1985, 835, 441–447. [Google Scholar] [CrossRef]
  39. Miller, G.L. Use of dinitrosalicylic acid reagent for determination of reducing sugar. Anal. Chem. 1959, 31, 426–428. [Google Scholar] [CrossRef]
  40. Kimura, K.; Yamaoka, M.; Kamisaka, Y. Rapid estimation of lipids in oleaginous fungi and yeasts using Nile red fluorescence. J. Microbiol. Methods 2004, 56, 331–338. [Google Scholar] [CrossRef]
  41. Mishra, S.; Suh, W.; Farooq, W.; Moon, M.; Shrivastav, A.; Park, M.S.; Yang, J. Rapid quantification of microalgal lipids in aqueous medium by a simple colorimetric method. Bioresour. Technol. 2014, 155, 330–333. [Google Scholar] [CrossRef]
  42. Frengova, G.; Sirnova, E.; Pavlova, K.; Beshkova, D. Formation of Carotenoids by Rhodotorula glutinis in whey ultrafiltrate. Biotechnol. Bioeng. 1994, 44, 888–894. [Google Scholar] [CrossRef] [PubMed]
  43. Weber, R.W.; Anke, H.; Davoli, P. Simple method for the extraction and reversed-phase high-performance liquid chromatographic analysis of carotenoid pigments from red yeasts (Basidiomycota, Fungi). J. Chromatogr. A 2007, 1145, 118–122. [Google Scholar] [CrossRef] [PubMed]
  44. Certik, M.; Shimizu, S. Kinetic analysis of oil biosynthesis by an arachidonic acid-producing fungus, Mortierella alpina 1S-4. Appl. Microbiol. Biotechnol. 2000, 54, 224–230. [Google Scholar] [CrossRef] [PubMed]
  45. Amaretti, A.; Raimondi, S.; Sala, M.; Roncaglia, L.; De Lucia, M.; Leonardi, A.; Rossi, M. Single cell oils ofthe cold-adapted oleaginous yeast Rhodotorula glacialis DBVPG 4785. Microb. Cell Fact. 2010, 9, 73. [Google Scholar] [CrossRef]
  46. Jiru, T.M.; Groenewald, M.; Pohl, C.; Steyn, L.; Kiggundu, N.; Abate, D. Optimization of cultivation conditions for biotechnological production of lipid by Rhodotorula kratochvilovae(syn, Rhodosporidium kratochvilovae) SY89 for biodiesel preparation. 3 Biotech 2017, 7, 145. [Google Scholar] [CrossRef]
  47. Zhu, L.; Zong, M.; Wu, H. Efficient lipid production with Trichosporon fermentans and its use for biodiesel preparation. Bioresour. Technol. 2008, 99, 7881–7885. [Google Scholar] [CrossRef] [PubMed]
  48. Libkind, D.; Brizzio, S.; Van Broock, M. Rhodotorula mucilaginosa, a carotenoid producing yeast strain from a Patagonian high-altitude Lake. Folia Microbiol. 2004, 49, 19–25. [Google Scholar] [CrossRef]
  49. Bhosale, P. Environmental and cultural stimulants in the production of carotenoids from microorganisms. Appl. Microbiol. Biotechnol. 2004, 63, 351–361. [Google Scholar] [CrossRef]
  50. El-Banna, A.; Abd El-Razek, A.; El-Mahdy, A. Some Factors Affecting the Production of Carotenoids by Rhodotorula glutinis var. glutinis. Food Nutr. Sci. 2012, 3, 64–71. [Google Scholar] [CrossRef] [Green Version]
  51. Cutzu, R.; Clemente, A.; Reis, A.; Lopes, T. Assessment of β-carotene content, cell physiology and morphology of the yellow yeast Rhodotorula glutinis mutant 400A15 using flow cytometry. J. Ind. Microbiol. Biotechnol. 2013, 40, 865–875. [Google Scholar] [CrossRef]
  52. Wang, C.; WanG, C.I.; Zhao, X.Q.; Chen, F.; Lan, P.; Shen, R.F. Proteomic analysis of a high aluminum tolerant yeast Rhodotorula taiwanensis RS1 in response to aluminum stress. Biochim. Biophys. Acta 2013, 1834, 1969–1975. [Google Scholar] [CrossRef]
  53. Ren, H.; Liu, B.; Kong, F.; Zhao, L.; Xie, G.; Ren, N. Enhanced lipid accumulation of green microalga Scenedesmus sp. by metal ions and EDTA addition. Bioresour. Technol. 2014, 169, 763–767. [Google Scholar] [CrossRef] [PubMed]
  54. Yang, J.; Cao, J.; Xing, G.; Yuan, H. Lipid production combined with biosorption and bioaccumulation of cadmium, copper, manganese and zinc by oleaginous microalgae Chlorella minutissima UTEX2341. Bioresour. Technol. 2015, 175, 537–544. [Google Scholar] [CrossRef]
  55. Kan, G.; Wang, X.; Jiang, J.; Zhang, C.; Chi, M.; Ju, M.; Shi, C. Copper stress response in yeast Rhodotorula mucilaginosaAN5 isolated from sea ice. Antarctic. Microbiol. Open 2018, 8, e657. [Google Scholar] [CrossRef]
  56. Gong, G.; Liu, L.; Zhang, X.; Tan, T. Multi-omics metabolism analysis on irradiation-induced oxidative stress to Rhodotorula glutinis. Appl. Microbiol. Biotechnol. 2019, 103, 361–374. [Google Scholar] [CrossRef] [PubMed]
  57. Maldonade, I.; Rodriguez-Amaya, D.; Scamparini, A. Carotenoids of yeasts isolated from the Brazilian ecosystem. Food Chem. 2008, 107, 145–150. [Google Scholar] [CrossRef]
  58. Kot, A.M.; Błażejak, S.; Kurcz, A.; Bryś, J.; Gientka, I.; Bzducha-Wróbel, A.; Maliszewska, M.; Reczek, L. Effect of initial pH of medium with potato wastewater and glycerol on protein, lipid and carotenoid biosynthesis by Rhodotorula glutinis. Electron. J. Biotechnol. 2017, 27, 25–31. [Google Scholar] [CrossRef]
  59. Saenge, C.; Cheirslip, B.; Suksaroge, T.T.; Bourtoom, T. Efficient concomitant production of lipids and carotenoids by oleaginous red yeast Rhodotorula glutinis cultured in palm oil mill effluent and application of lipids for biodiesel production. Biotechnol. Bioprocess. Eng. 2011, 16, 23–33. [Google Scholar] [CrossRef]
Figure 1. Microscopic examination of yeast cells stained with Nile red fluorescence dye. Yeast cells were grown in different nitrogen sources, Ammonium sulfate (Amm), yeast extract (YE), and peptone (PEP) with different C/N ratios: (a) 146, (b) 94, and (c) 70 for six days. The magnification bar is equal to 10 µm.
Applsci 09 02444 g001
Figure 2. Microscopic examination of yeast cells stained with Nile red fluorescence dye. Yeast cells were grown in a shaken flask under different C/S ratios and a C/N equal to 146, using ammonium sulfate and yeast extract as a nitrogen source for six days. The C/S ratios used were: (a) 254, (b) 166, (c) 123, and (d) 98. The magnification bar is equal to 10 µm.
Applsci 09 02444 g002
Figure 3. Microscopic examination of yeast cells stained with Nile red fluorescence dye. Yeast cells were grown in a shaken flask under different Al2(SO4)3 concentrations using the optimized medium as a control, with C/N equal to 146 (using ammonium sulfate as a sole nitrogen source) and C/S equal to 120, at 180 rpm and at 28 °C for six days. (a) Control. The Al2(SO4)3 concentrations were (b) 0.1 mM, (c) 0.3 mM, (d) 0.7 mM, and (e) 1 mM. The magnification bar is equal to 10 µm.
Applsci 09 02444 g003
Figure 4. Influence of different Al2(SO4)3 concentrations on growth, and lipid and carotenoid production by Rhodotorula glutinis. Yeast cells were grown in the shaken flask using the optimised medium as a control with C/N equal to 146 (using ammonium sulfate as a sole nitrogen source) and C/S equal to 120, and incubated at180 rpm and 28 °C for six days: (a) dry cell weight (DCW) (g/L), (b) total lipid (TL (g/L)) and lipid relative productivity (LRP = (glipid/gDCW) × 100), and (c) total pigment (TP mg/L) and carotenoid relative productivity (Car-RP mgpigment/100 gDCW). The data are the mean of three repeated tests, and the standard deviation was calculated and represented as an error bar. Asterisks ** represent a statistically significant difference between the single-Al-treated group and the control at p ≤ 0.01, and asterisk * represents a statistically significant difference between single-Al-treated group and control at 0.01 < p ≤ 0.05.
Applsci 09 02444 g004
Figure 5. The percentage of individual carotenoids, γ-carotene and torulene, in the carotenoid profile extracted from Rhodotorula glutinis. Yeast cells were grown in a shaken flask under different Al2(SO4)3 concentrations in the optimised media using optimised media as a control. The data are the mean of two repeat tests, and the standard deviation was calculated and represented as an error bar. Asterisks ** represent a statistically significant difference between the single-Al-treated group and control at p ≤ 0.01 in the case of torulene, and hash # represents a statistically significant difference between the single-Al- treated group and control at 0.01 < p ≤ 0.05 in the case of γ-carotene.
Applsci 09 02444 g005
Figure 6. HPLC chromatography: (a) optimized media (control), (b) 0.5 mM treatment of Al2(SO4)3, and (c) the colour variance of the grown yeast for six days on YPD (1) and after optimization with adding 0.7 mM Al2(SO4)3 (2).
Applsci 09 02444 g006aApplsci 09 02444 g006b
Table 1. Different nitrogen sources and its calculated carbon to nitrogen ratio (C/N) and carbon to sulfur ratio (C/S).
C/NN-Sourcesg/LC/SC/S − C/N
146* PEP1.524094
* YE1.724094
(NH4)2SO40.9133−13
94PEP2.4240146
YE2.7240146
(NH4)2SO41.411622
70PEP3.2240170
YE3.6240170
(NH4)2SO41.98919
* PEP: peptone.* YE: yeast extract.
Table 2. Different MgSO4 concentrations and their calculated carbon to nitrogen ratio (C/N) and carbon to sulfur ratio (C/S).
C/NMgSO4 (g/L)C/SC/S − C/N
1460.5245108
116620
1.5123−23
298−48
Table 3. Effect of different C/N ratios and different nitrogen sources on dry cell weight (DCW), lipid (TL), and carotenoid (TP) produced by R. glutinis after three and six days.
C/NNDCW (g/L)TL (g/L)TP (mg/L)DCW-Y (%)TL-Y (%)TP-Y L-RP (%)Car-RPCar-SR L-SR (g/L·d)
3 d6 d3 d6 d3 d6 d3 d6 d3 d6 d3 d6 d3 d6 d3 d6 d3 d6 d3 d6 d
146PEP6.23 ± 0.259.3 ± 0.12.49 ± 0.525.04 ± 0.190.31 ± 0.160.36 ± 0.0046.223.618.519.623.21.840.154.250.238.810416.20.830.85
YE6.62 ± 0.5610.43 ± 0.492.47 ± 0.155.2 ± 0.180.44 ± 0.070.64 ± 0.0346.724.917.517.931.314.537.450.067.061.614866.30.820.92
AMM6.22 ± 0.1710.17 ± 0.472.07 ± 0.844.81 ± 0.4050.53 ± 0.040.79 ± 0.0344.323.014.71637.415.333.347.484.677.517587.50.690.91
96PEP7.77 ± 0.349.63 ± 0.252.50 ± 0.354.96 ± 0.370.48 ± 0.040.50 ± 0.0347.521.315.328.027.82.032.251.558.552.415216.70.830.82
YE7.98 ± 0.2311.68 ± 0.582.50 ± 0.185.4 ± 0.610.56 ± 0.030.79 ± 0.0747.824.014.719.334.214.540.046.670.767.518874.50.820.99
AMM6.90 ± 0.2110.78 ± 0.111.90 ± 0.434.31 ± 0.570.56 ± 0.080.85 ± 0.104620.512.612.837.015.427.540..080.578.618596.90.630.8
70PEP8.02 ± 0.1810.14 ± 0.312.33 ± 0.514.75 ± 0.370.48 ± 0.060.53 ± 0.1248.519.514.122.329.11.729.146.960.052.316016.20.780.81
YE8.32 ± 0.1412.2 ± 0.22.20 ± 0.174.98 ± 0.140.57 ± 0.040.85 ± 0.2550.024.713.317.533.717.926.740.868.469.719094.10.740.92
AMM7.23 ± 0.4711.09 ± 0.381.62 ± 0.33.87 ± 0.650.58 ± 0.020.88 ± 0.0245.119.210.111.235.815.222.534.979.579.41921020.540.75
PEP: peptone. YE: yeast extract. Amm: ammonium sulfate. DCW-Y: dry cell weight. TL-Y: total lipid yield. TP-Y: total pigment yield (mgpigment/100 gglucose). L-RP: lipid relative productivity. Car-RP: carotenoid relative productivity (mgpigment/100gdcw). Car-SR: carotenoid synthesis rate (µg/L·d). L-SR: lipid synthesis rate. C/N: carbon nitrogen ratio. N: nitrogen. d: days.
Table 4. Effect of different C/S ratios on dry cell weight (DCW), lipid (TL), and carotenoid (TP) produced by R. glutinis after three days and six days.
TC/SDCW (g/L)DCW-Y (%)TL (g/L)TL-Y (%)TL-RP (%)TL-SR (g/L·d)TP (mg/L)TP-YCar-RP Car-SR (µg/L·d)
3 d2546.49 ± 0.38 a48.72.5 ± 0.118.6438.30.830.457 ± 0.0534.470.7152.9
1666.79 ± 0.448.12.4 ± 0.517.2835.40.810.565 ± 0.140.383.7188.5
1237.26 ± 0.4 a48.92.4 ± 0.3216.3433.40.810.624 ± 0.01 d42.0385.9208.1
987.11 ± 0.1641.82.2 ± 0.2213.231.60.750.612 ± 0.05 d35.986203.86
6 d2549.59 ± 0.25 b22.45.1 ± 0.4 c19.0253.40.880.528 ± 0.35.02655.123.2
16610.45 ± 0.3922.85.1 ± 0.29 c16.5548.850.890.807 ± 0.08 e14.977.280.6
12310.74+0.06 b25.64.8 ± 0.1817.744.980.80.865 ± 0.01 e17.780.580.4
9810.91 ± 0.5622.94.5 ± 0.1813.8441.680.770.875 ± 0.01 e15.980.287.89
CW-Y: dry cell weight yield. TL-Y: total lipid yield. TP-Y: total pigment yield. TL-RP: total lipid relative productivity (mgpigment/100 gglucose). Car-RP: carotenoid relative productivity (mgpigment/ 100 gglucose). TL-SR: total lipid synthesis rate. Car-SR: carotenoid synthesis rate. d: days. The data are the mean of three repeat tests, and the standard deviation represents ± SD. The significance of the C/S ratio on DCW, TL, and TP after three and six days were detected by using a one-way ANOVA test in SPSS. a represents each of the DCW-3d significant differences with DCW-98-3d (p < 0.05). b represents each of the DCW-6d significant differences with DCW-98-6d (p < 0.01). c represents each of the TL-6d significant differences with TL-98-6d (p < 0.05). d represents each of the TP-3d significant differences with TL-254-3d (p < 0.01). e represents each of the TP-6d significant differences with TL-254-6d (p < 0.05).
Table 5. The percentage of individual carotenoids, γ-carotene, β-carotene, torulene, and torularhodene in the carotenoid profile extracted from Rhodotorula glutinis.
YE-146YE-94YE-70PEP-146PEP-94PEP-70Amm-146Amm-94Amm-70C/S-254C/S-166C/S-123C/S-98
Torh3.3 ± 3.36.7 ± 2.85.3 ± 4.96.2 ± 2.112.05 ± 3.963.6 ± 1.910.5 ± 0.497.1 ± 6.80.78 ± 50000
Toru52.5 ± 6.152.4 ± 3.037.5 ± 1057.3 ± 7.455.4 ± 9.750.5 ± 3.562 ± 8.561.1 ± 5.457.4 ± 6.950.1 ± 0.7153.4 ± 5.954.7 ± 3.854.8 ± 1
γ-car44.2 ± 4.238.6 ± 2.552.3 ± 8.833.6 ± 3.628.3 ± 3.644.4 ± 5.611.1 ± 424 ± 1032.1 ± 3.121.4 ± 2.333.6 ± 4.540.3 ± 4.341.5 ± 3.2
β- car0000005.4 ± 4.87.6 ± 2.98.9 ± 4.112.2 ± 4.2000
Torh: torularhodene. Toru: torulene. γ-car: γ-carotene. β- car: β- carotene. Yeast cells were grown under different nitrogen sources—peptone (PEP), yeast extract (YE), and ammonium sulfate (Amm)—with different C/N ratios (146, 94, and 7), and different C/S ratios (254, 166, 123, and 98) with the same C/N ratio (146). HPLC was used for separation and identification. The data are the mean of two replicate tests, and the standard deviation was calculated and represented as (±SD).
Table 6. Comparative studies from previous reports detecting the total pigment (mg/L) and torulene(mg/L) and carotenoid relative productivity (Car-RP)(µgP/gDCW) production by different red yeast strains under different C/N ratio, C/S, nitrogen sources and some stress condition.
Stress ConditionYeast strainsTP (mg/L)Torulene (mg/L)Car-RP (µgP/gDCW)C/NNSCarbon SourceC/SRef
NoneR.glutinis0.8810.261133SCYE, ME, &PEPGlucose & maltoseNC[57]
R. graminis0.5940.18670
R. mucilaginosa-1370.590.35269
R. mucilaginosa-1080.5620.30768
R. mucilaginosa-1350.5450.35676
R. minuta0.16833
Sporobolomyces roseus0.2370.07172
NoneR. glutinis DBVPG60810.6310.136112.257YEGlucose319SC[11]
NoneR. glutinis DBVPG70211.50.213162.7
NoneR. sp. nov CRUB10321.20.95138.6
NoneSporidiobolus CRUB10441.991.9184
NoneRhod. toruloides DBVPG67391.3110.68122.6
NoneR. glutinis NCIM33532.21.1612010YEGlucose
NoneR. glutinis var.glutinis2.41.433310AMMGlucose199SC[19,50]
None2.3227310PEP
0.1 g/L MnSO41.641.330410AMM
0.1 g/L ZnSO42.811.663810AMM
NoneR. glutinis JMT 21978183.5sc160050YEGlucose
NoneR. glutinis ATCC 15125)1.2120120YE:AmmGlucose919SC[10]
NoneSporidiobolus pararoseus NGR1.6360.2513.6YE:PEPGlucose[12]
0.75 M NaCl3.9522.13.6
UnoptimizedR. glutinis AS 2.7030.7890.49877.5146AmmGlucose133This study
Optimized media0.950.58989.05120
Optimized media + 0.7 mM Al2(SO4)32.22.16212.9120
TP: total pigment. Car-RP: carotenoid relative productivity. Amm: ammonium sulfate. YE: yeast extract. PEP: peptone. ME: malt extract. SC: self-calculated. NC: non-calculated. –: not mentioned.

