Article

Experimental Study on Deformation Monitoring of Bored Pile Based on BOTDR

Key Laboratory of Ministry of Education for Geomechanics and Embankment Engineering, Hohai University, Nanjing 210098, China
*
Author to whom correspondence should be addressed.
Appl. Sci. 2019, 9(12), 2435; https://doi.org/10.3390/app9122435
Submission received: 30 April 2019 / Revised: 7 June 2019 / Accepted: 10 June 2019 / Published: 14 June 2019
(This article belongs to the Special Issue Recent Progress in Fiber Optic Sensors: Bringing Light to Measurement)

Abstract

:

Featured Application

This paper present the method of monitoring the deformation of bored cast-in-place pile by BOTDR, and the most ideal data processing method is given. It is helpful for the popularization and application of BOTDR technology in the field of pile foundation monitoring.

Abstract

In order to study the deformation of bored pile, it is necessary to monitor the strain of the pile. The distributed optical fiber sensing technology realizes the integration of sensing and transmission, which is incomparable with traditional point monitoring method. In this paper, the Brillouin optical time domain reflectometer (BOTDR) distributed optical fiber sensing technology is used to monitor the deformation of the bored pile. The raw data monitored by BOTDR is processed by the wavelet basis function, that can perform noise removal processing. Three different methods of noise removal are chosen. Through the processing, the db5 wavelet is used to decompose the deformation data of bored pile monitored by BOTDR into two layers. The decomposed high-frequency signal is denoised by the Stein-based unbiased risk threshold, rigrsure. The decomposed data is smoothed by the translational mean method, and the final data after denoising and smoothing processing is real and reliable. The results of this study will provide data support for the deformation characteristics of bored pile, and also show the advantages of distributed optical fiber sensing technology.

1. Introduction

The bored pile is formed at the project site using a pile hole in the soil by means of mechanical drilling, placing a steel cage and pouring concrete therein. It uses the bottom of the pile to cross the soil layer, the upper load from the top of pile is carried by the soil or rock body. In recent years, due to the advantages of relatively simple and mature construction, high bearing capacity, small deformation, stable performance and relatively low cost, bored piles have been widely used in the fields of transportation, high-rise buildings, water conservancy and hydropower [1].
In order to study the deformation characteristics of bored piles, it is necessary to monitor the strain of bored piles.
The traditional strain sensors such as strain gauges were placed at different sections of the pile in order to monitor the internal force and deformation of the bored pile. However, with the development of research, the traditional strain sensors are more and more difficult to meet the monitoring needs. During the construction of bored piles, there are some problems such as neck shrinkage, mud-sludge and hole wall collapse, which affects the accurate acquisition of pile strain information. At the same time, due to the characteristics of the traditional point sensor, it is difficult to obtain comprehensive and accurate pile strain information [2]. The traditional sensors are prone to rust damage, insufficient data representation, severe electromagnetic interference, and are easily destroyed in complex geotechnical environments. It is difficult to realize real-time multi-point automatic monitoring. Therefore, a higher requirement is put forward for the development of monitoring technology [3].
The distributed fiber optic sensing technology is a new type of sensing and monitoring technology that can be used to monitor the strain of pile foundation in real time and efficiently. The optical fiber used is small in size, light in weight, and good in flexibility, so it is easy to carry, install, and not easy to damage [4]. In addition, the optical fiber is developed from quartz glass and has the characteristics of flame resistance, explosion protection and electromagnetic interference resistance; thus, it is more vulnerable to electromagnetic interference and damage than the traditional strain gauge sensor. The advantages of optical fiber are superior, and it is more suitable for pile strain monitoring in complex environments [5]. The Brillouin optical time domain reflectometer (BOTDR) as one of the distributed optical fiber sensing technologies is used in the bored pile monitoring field experiment, the strain of pile is obtained, and the different way of processing the noise and smooth implementation of data are used to make the strain information more reasonable and reliable.

2. Principle of BOTDR

BOTDR is the distributed optical fiber sensing technology which based on Brillouin optical time domain reflectometry [6,7]. The technology uses back Brillouin scattering frequency to react quickly to the temperature and strain received by the optical fiber; there is a linear relationship between the two to perform real-time distributed monitoring of the object. Its working principle is: the pulsed light of a certain frequency is injected into the optical fiber medium, and the pulse light entering the inside of the optical fiber interacts with the elastic acoustic wave therein to generate back Brillouin scattering, which causes Brillouin scattering due to the temperature and the stress received. Brillouin scattering occurs in the optical fiber, and the brillouin backlight generates a frequency shift. By measuring the frequency shift, the relationship of the frequency shift with the temperature and strain of the optical fiber can be used to obtain the external information of the optical fiber [8]. When one end of the optical fiber receives the pulsed light of the specified frequency, the pulsed light interacts with the elastic acoustic wave in the optical fiber to form Brillouin scattering, then the back Brillouin scattered light returns through the original path of the optical fiber and enters the BOTDR light receiving part and the signal processing unit. The conversion of the optical signal and electrical signal is completed in the receiving part, the electrical signal is transmitted to the receiver through the broadband amplifier. The digital signal processor is used to perform the average processing, the specific distribution of Brillouin scattering light power in each sampling point of the fiber is obtained.
By using the frequency shift of Brillouin scattered light in a linear relationship with the temperature and strain received, the temperature and strain of the object can be monitored by BOTDR technology. Equation (1) is the relationship of Brillouin frequency shift with temperature and strain [9,10,11,12,13]:
Δ υ B ( Δ T , Δ ε ) = υ B ( ε , T ) υ B ( 0 , T 0 ) = C T ( T T 0 ) + C ε ( ε ε 0 )
Among them:
  • Δ υ B ( Δ T , Δ ε ) —the amount of change in Brillouin frequency shift.
  • υ B ( T , ε ) —the Brillouin frequency shift corresponding to the ambient temperature T and the strain ε.
  • υ B ( 0 , T 0 ) —the Brillouin frequency shift corresponding to the initial temperature T0 and the strain is 0.
  • CT—the temperature coefficient, C T = υ B ( T ) T .
  • C ε —the strain coefficient, C ε = υ B ( ε ) ε .
  • T0—the initial temperature.
  • ε —the actual amount strain of the optical fiber.
  • ε 0 —the initial strain of the optical fiber.
It is seen from the formula (1) that there is a linear relationship of the frequency shift with the temperature and strain [14,15,16]. When the temperature change is less than 5 °C, the influence of temperature on the Brillouin frequency drift can be neglected, then the formula (1) can be changed to [17,18]:
υ B ( ε ) = υ B ( 0 ) + C ε Δ ε
where:
  • υ B ( ε ) —frequency shift of fiber when the strain is ε ;
  • υ B ( 0 ) —the ambient temperature around the optical fiber under the same condition, the corresponding Brillouin frequency shift amount when the optical fiber strain is 0.
It can be seen that the temperature and strain change of measured object can be obtained by the distributed real-time monitoring method based on BOTDR [19,20,21].

3. Bored Pile Field Test

3.1. Engineering and Geological Conditions

This paper is based on the project of business office building in Suzhou City, Jiangsu Province, on the alluvial and lake plains on the southern margin of the Yangtze River Delta. According to the regional geological data, the crustal movement since the Quaternary has been mainly sedimentary, accepting accumulation and forming a broad accumulation of plain landforms. The maximum exploration depth under the natural ground of the site is 60 m. Except for surface filling, the rest are lake facies-shallow marine facies sediment, mainly composed of cohesive soil and silt. The physical and mechanical properties of soil are shown in Table 1.

3.2. Monitoring the Deformation of Pile

The following is the process of monitoring the bored pile deformation using the distributed optical fiber technology:
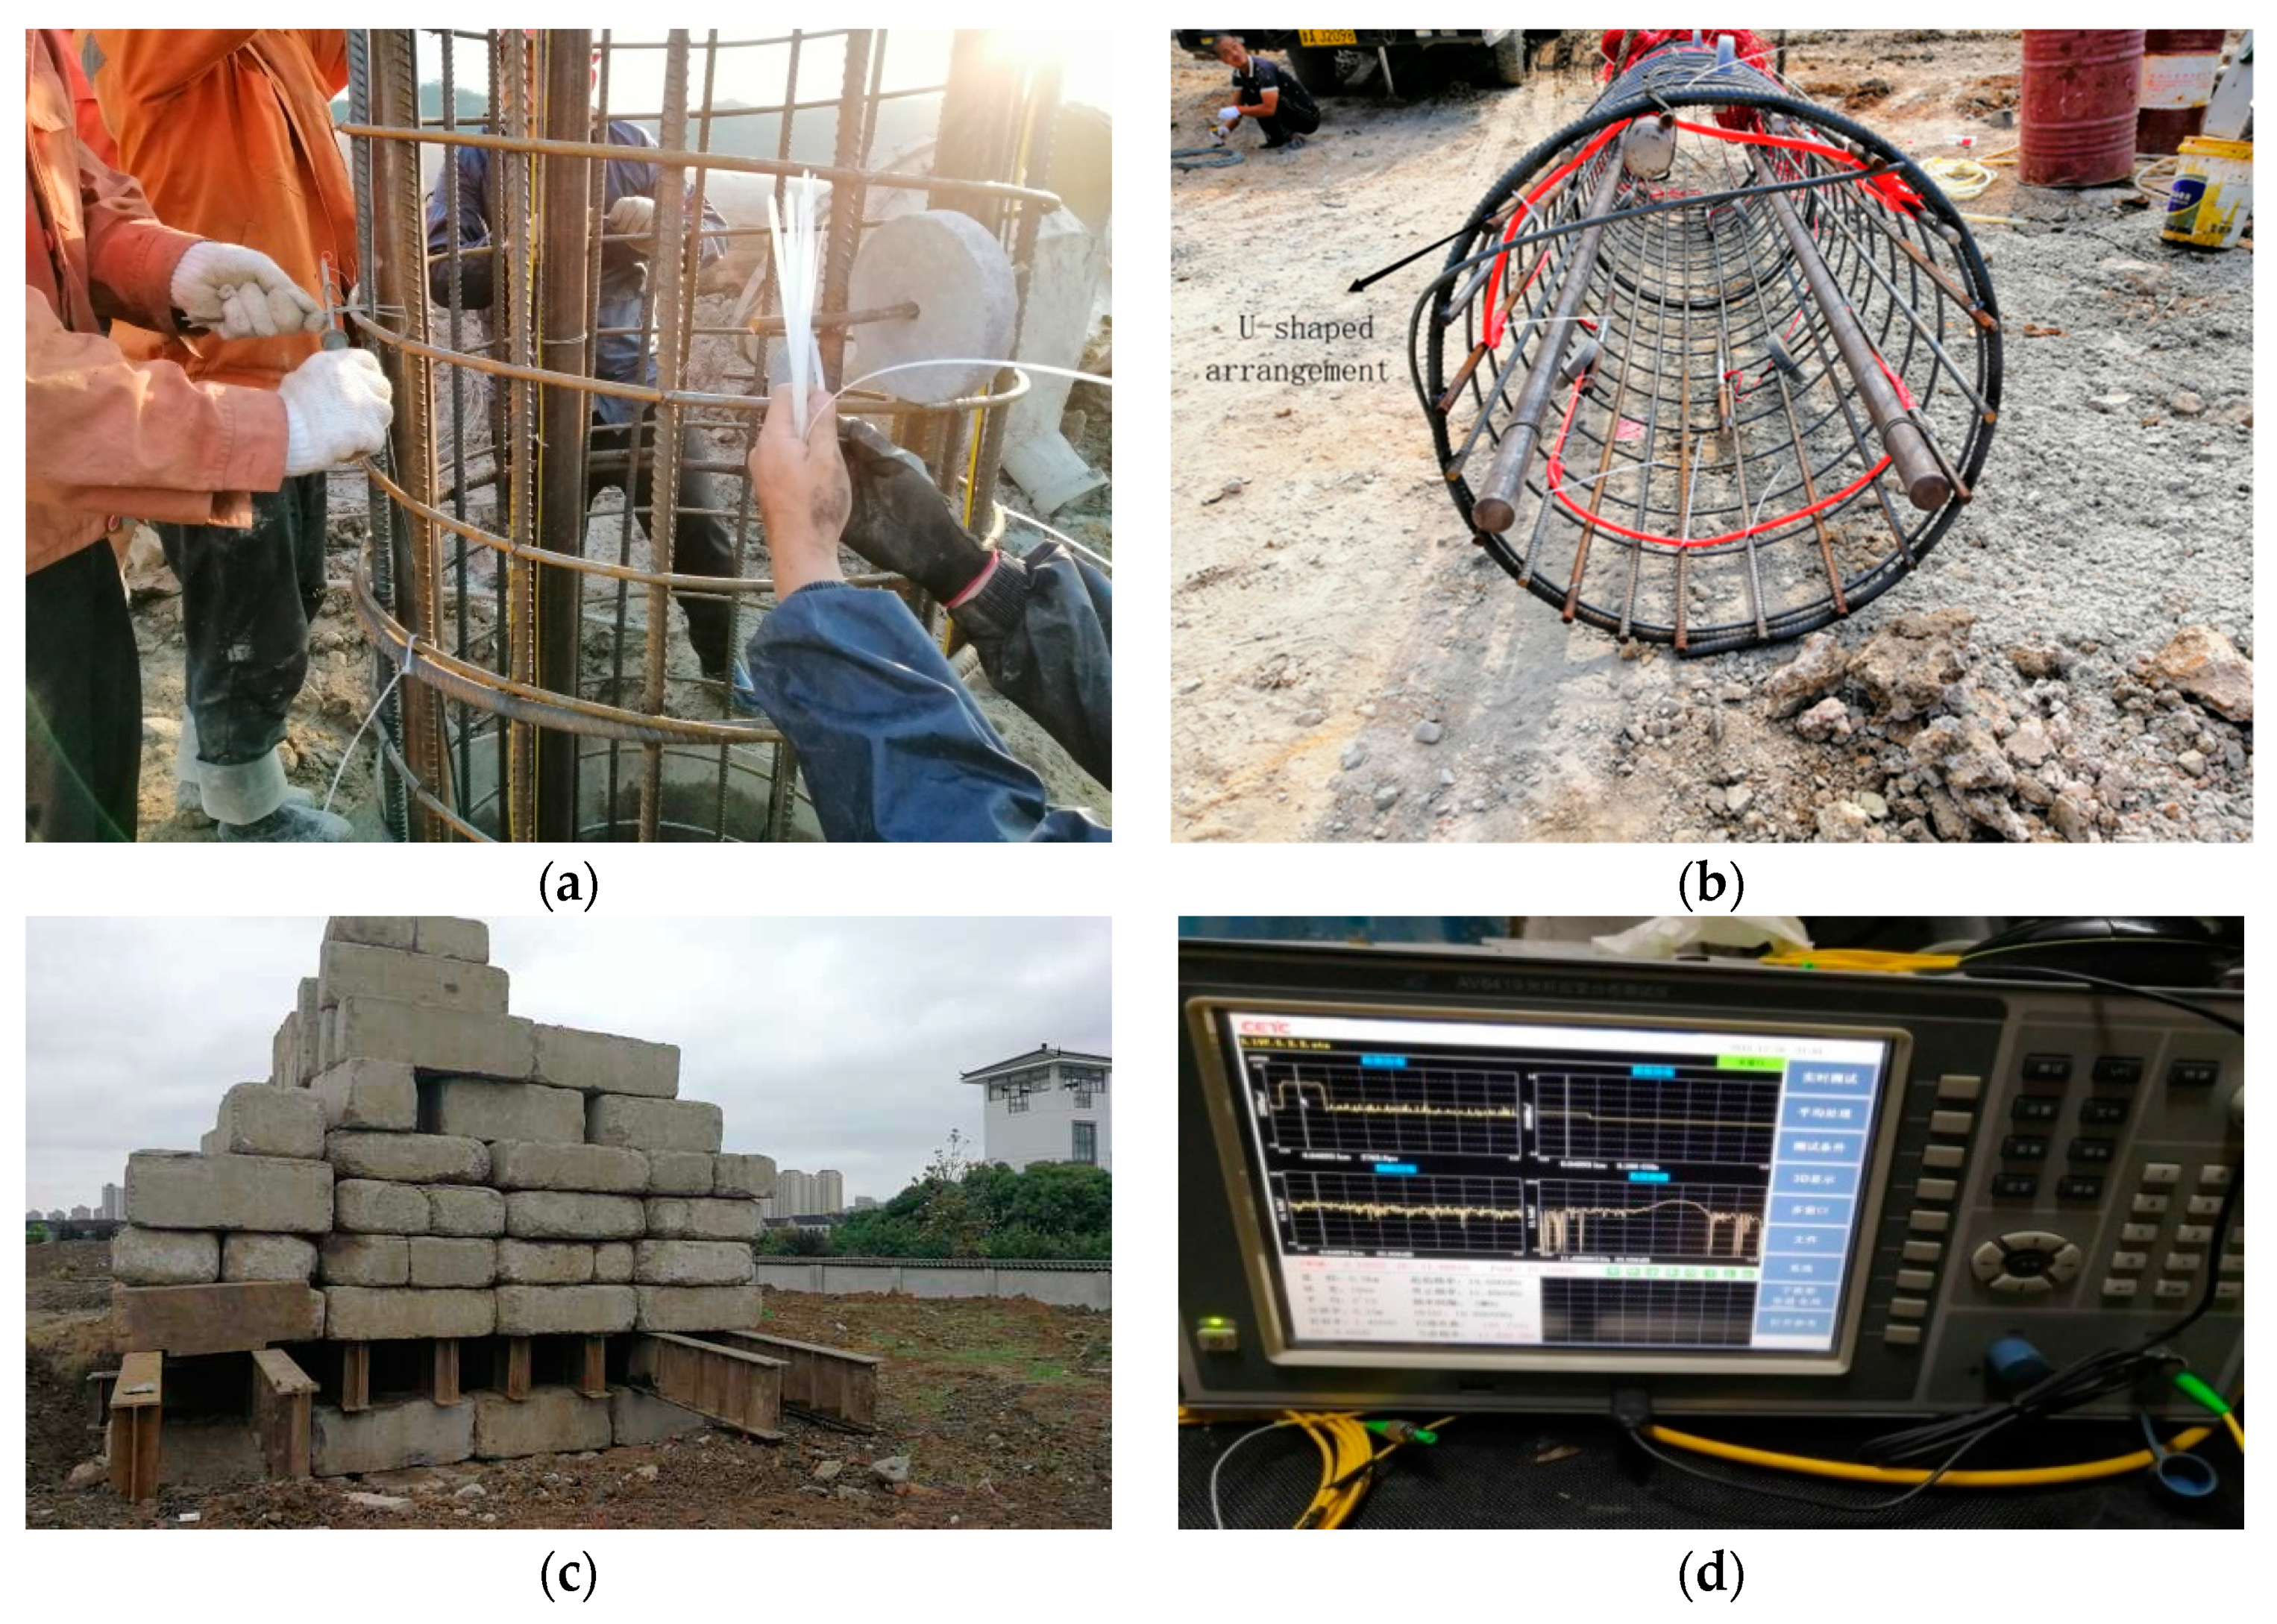
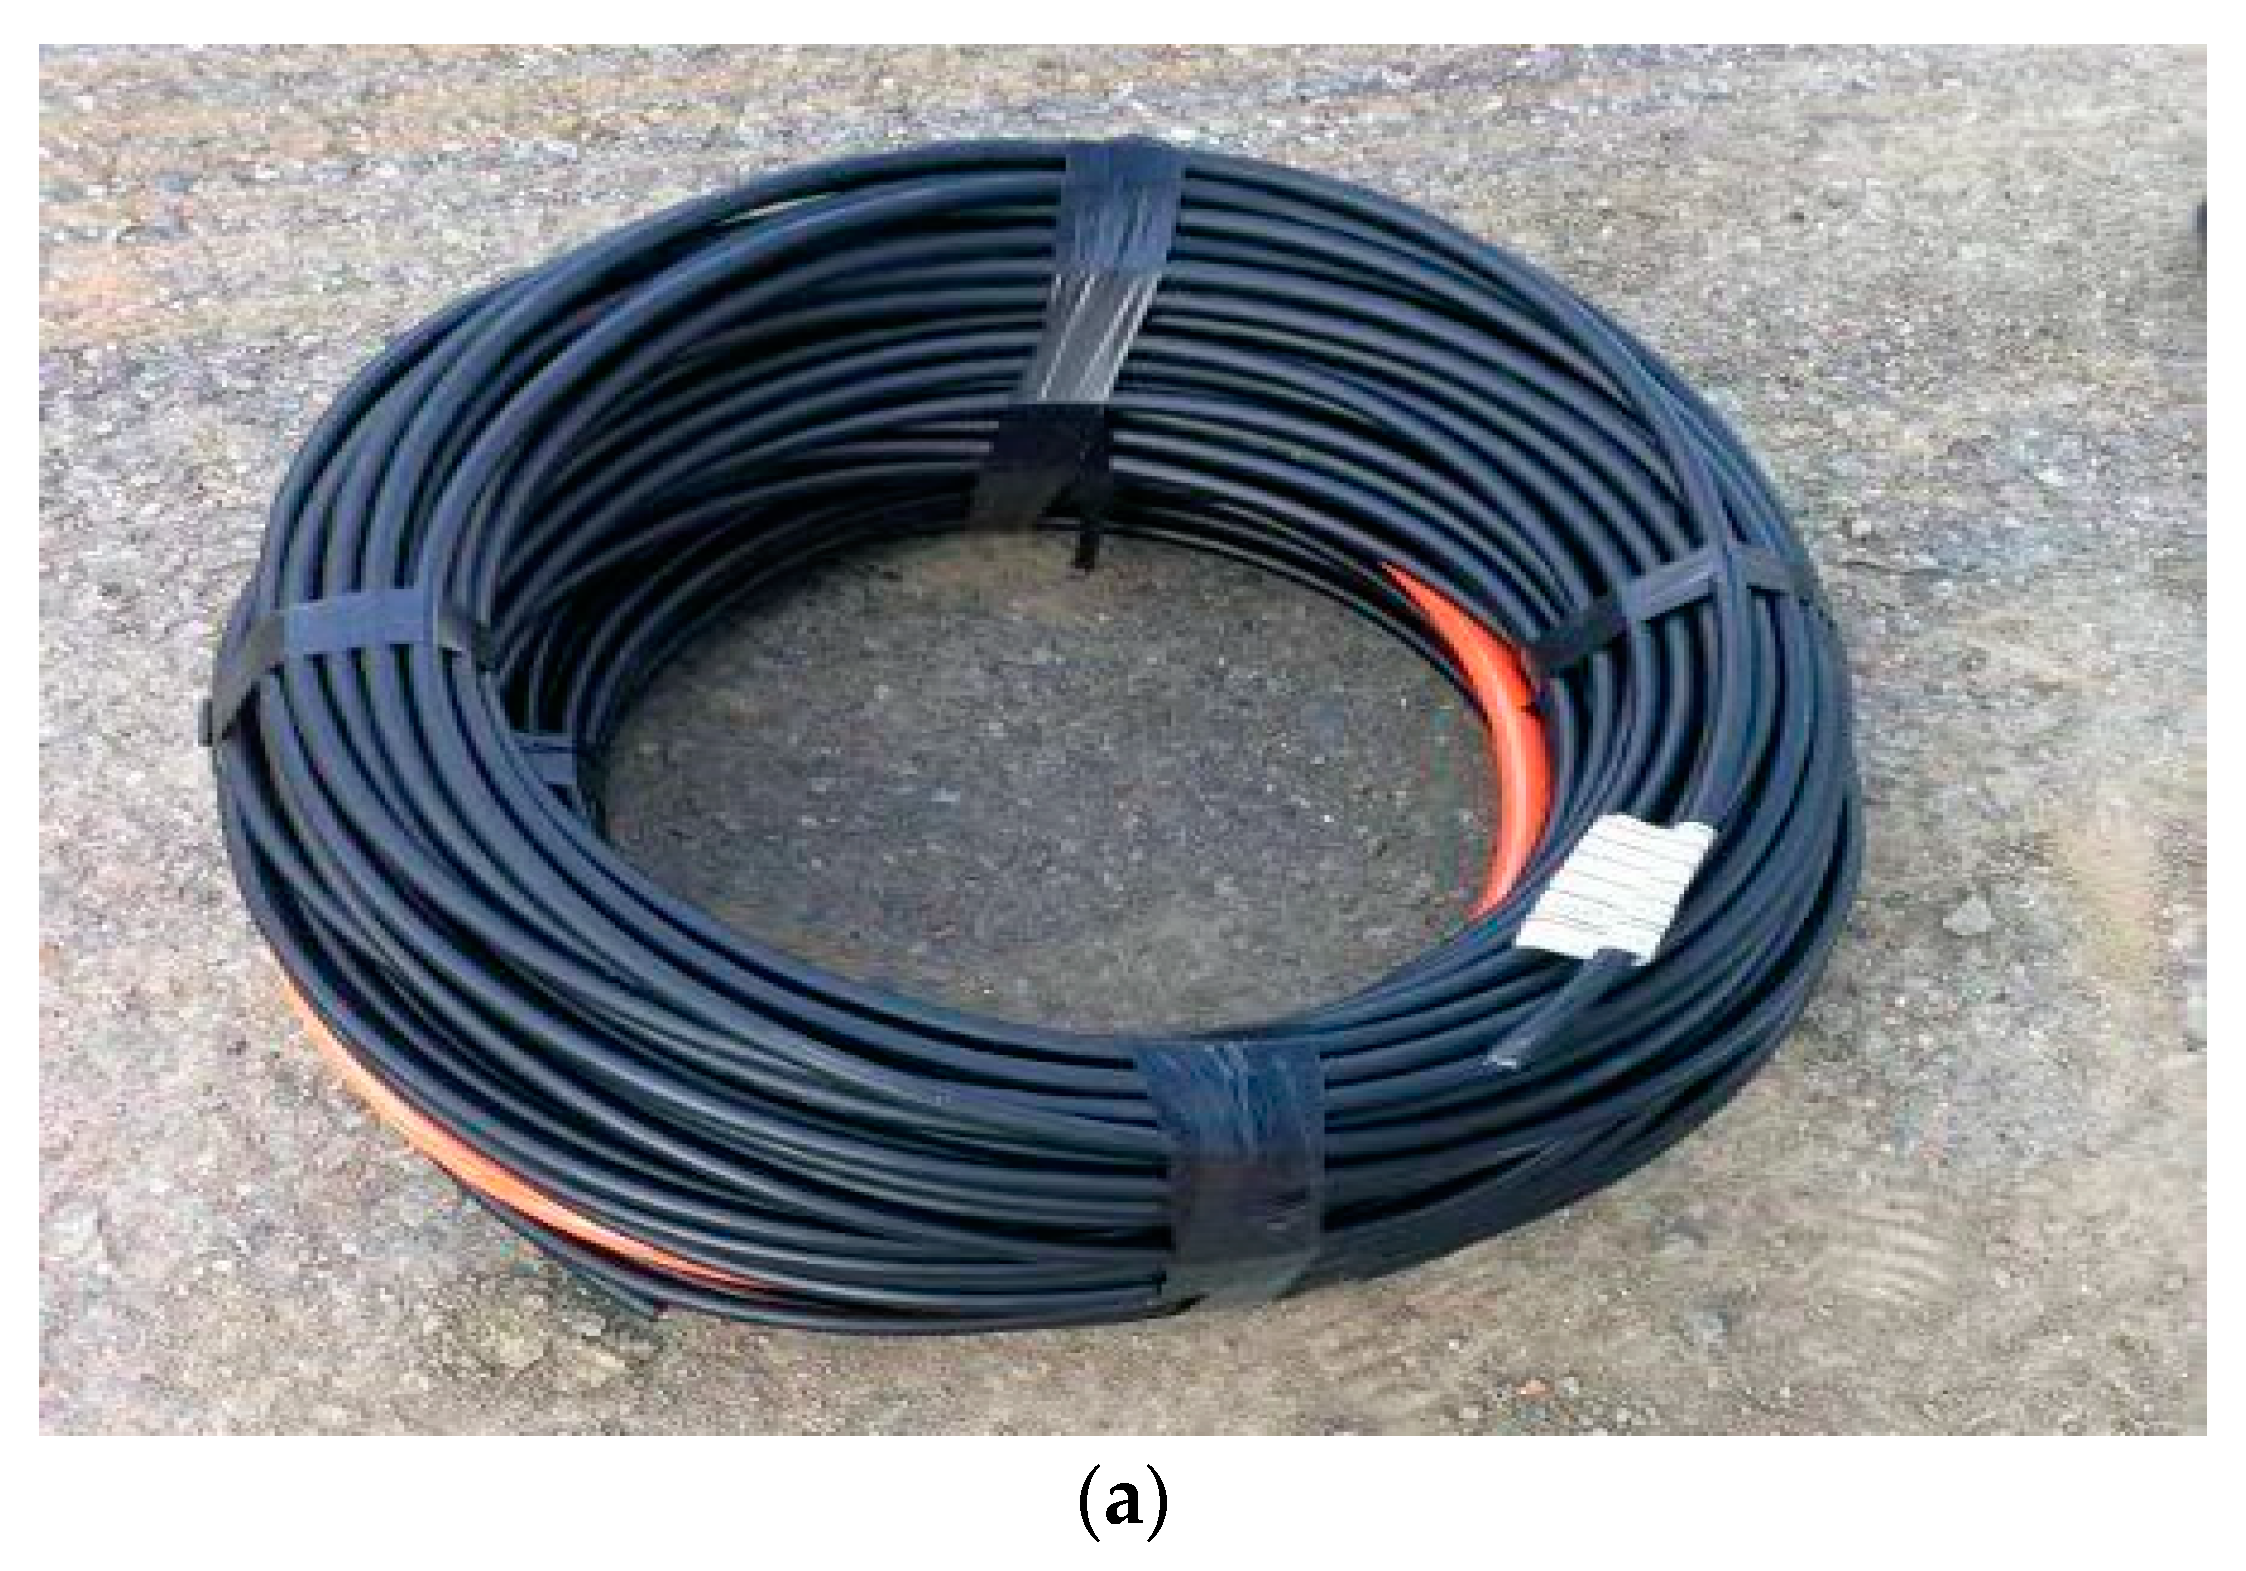
  • Optical fiber selection. There are two kinds of optical fiber to choose from: single-mode optical fiber and GFRP optical fiber. Although the single-mode optical fiber has the best coordination effect with the measured object’s deformation, it is easy to be wound and broken. The GFRP optical fiber is not only good in coordination with deformation of the measured object, but also not easy to damage and easy to layout. It can be seen that the single-mode optical fiber is relatively fragile, with poor internal protection effect and easy to damage. Since it is difficult to arrange it into the measured object, it is not suitable for field application practice. It can only be used for scientific research and surface monitoring of some simple structures without too many protective measures. Designated paste can be well bonded GFRP fiber by reinforcing cage in piles in the main steel profiles, through the prestress can well reflect the deformation of the pile body; its reinforcement structure can have a very good protection effect on the fiber core, and it can greatly improve the optical fiber tensile, bending, bending capacity. The fiber at the joint of bored piles and pile head is not easily damaged, and the convenience of fiber has great applicability in engineering practice. Therefore, GFRP fiber was used for monitoring in this test.
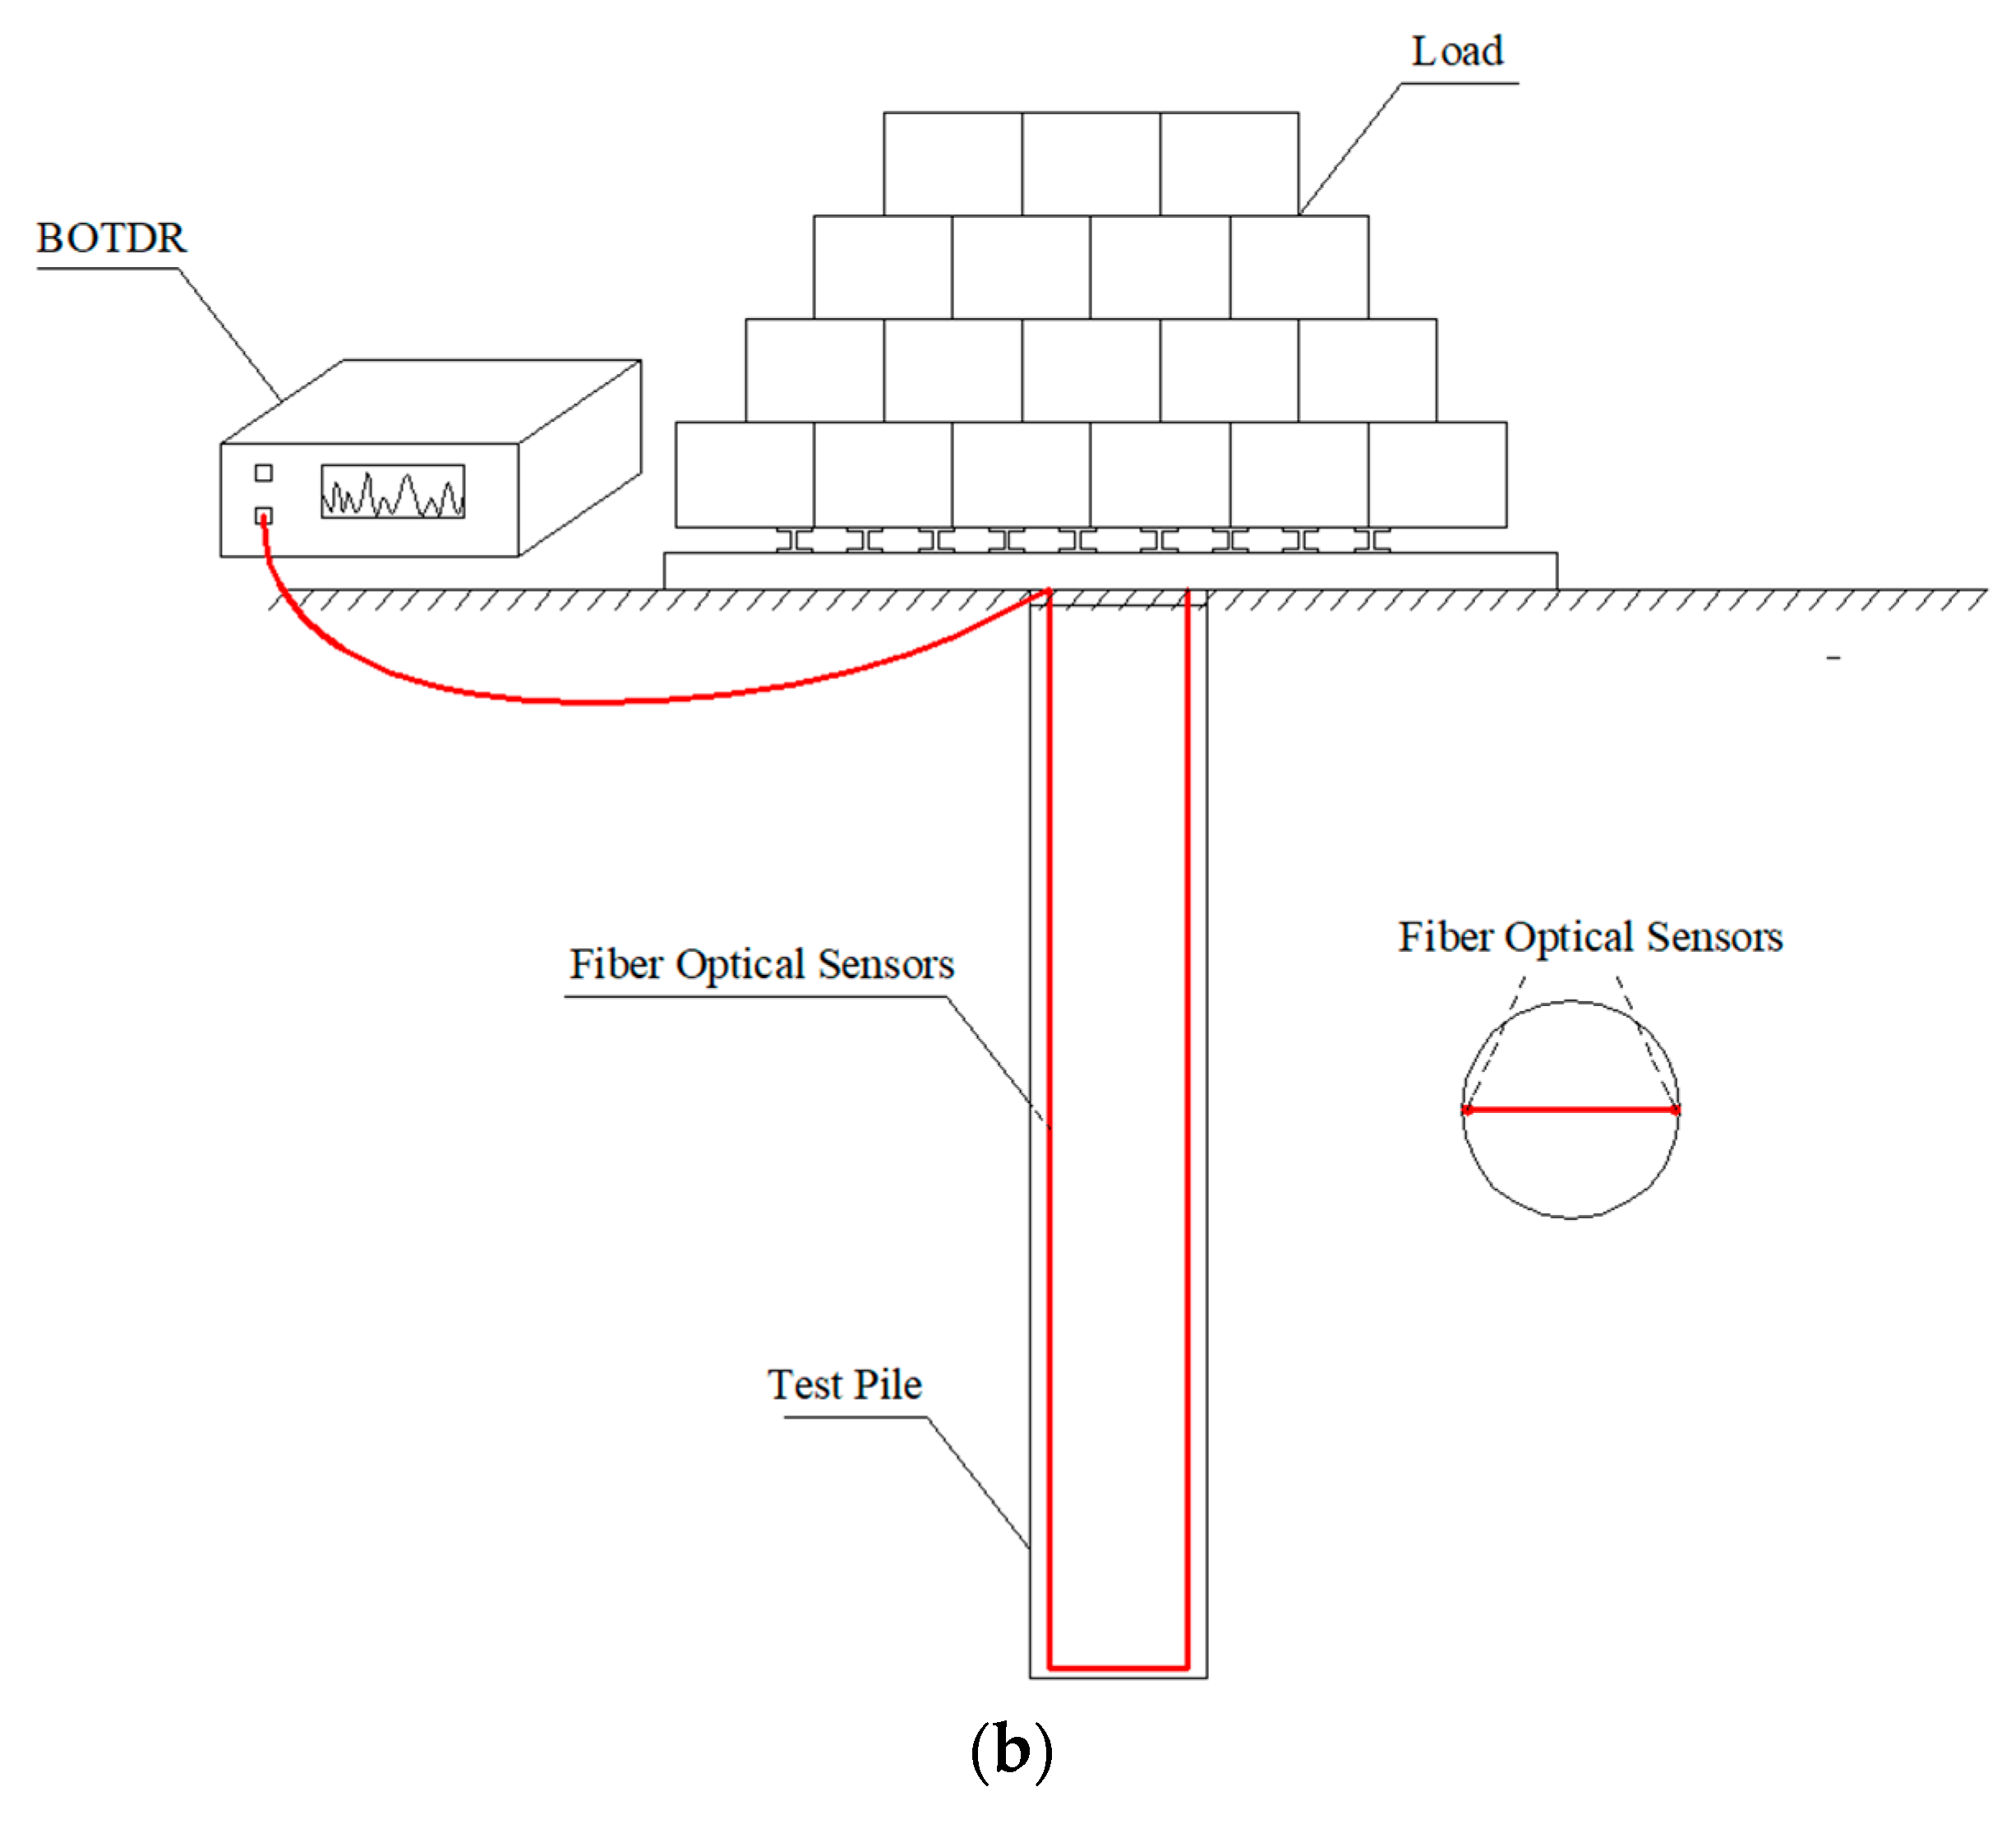
  • Optical fiber layout. Figure 1 is the schematic diagram of optical fiber and field test. Glass fiber reinforced plastic (GFRP) optical fiber can be seen from Figure 1(a). The layout of optical fiber is shown in Figure 1(b). The main parameters of the optical time domain strain measuring instrument are that: Optical fiber type is GFRP, Maximum dynamic range is 15 dB, Strain distance resolution is 1 m. Strain measurement accuracy is ±50 με; strain test range is −15,000~+15,000 με. The test range is 1 km, and maximum sampling resolution is 0.05 m.
  • For the laying of optical fiber sensor, the symmetrical U-shaped layout is fixed, and the optical fiber sensor can be laid on the main reinforcement of the steel cage before the optical fiber can be connected to the bored pile through concrete pouring. The steel cages are lowered and welded in turn.
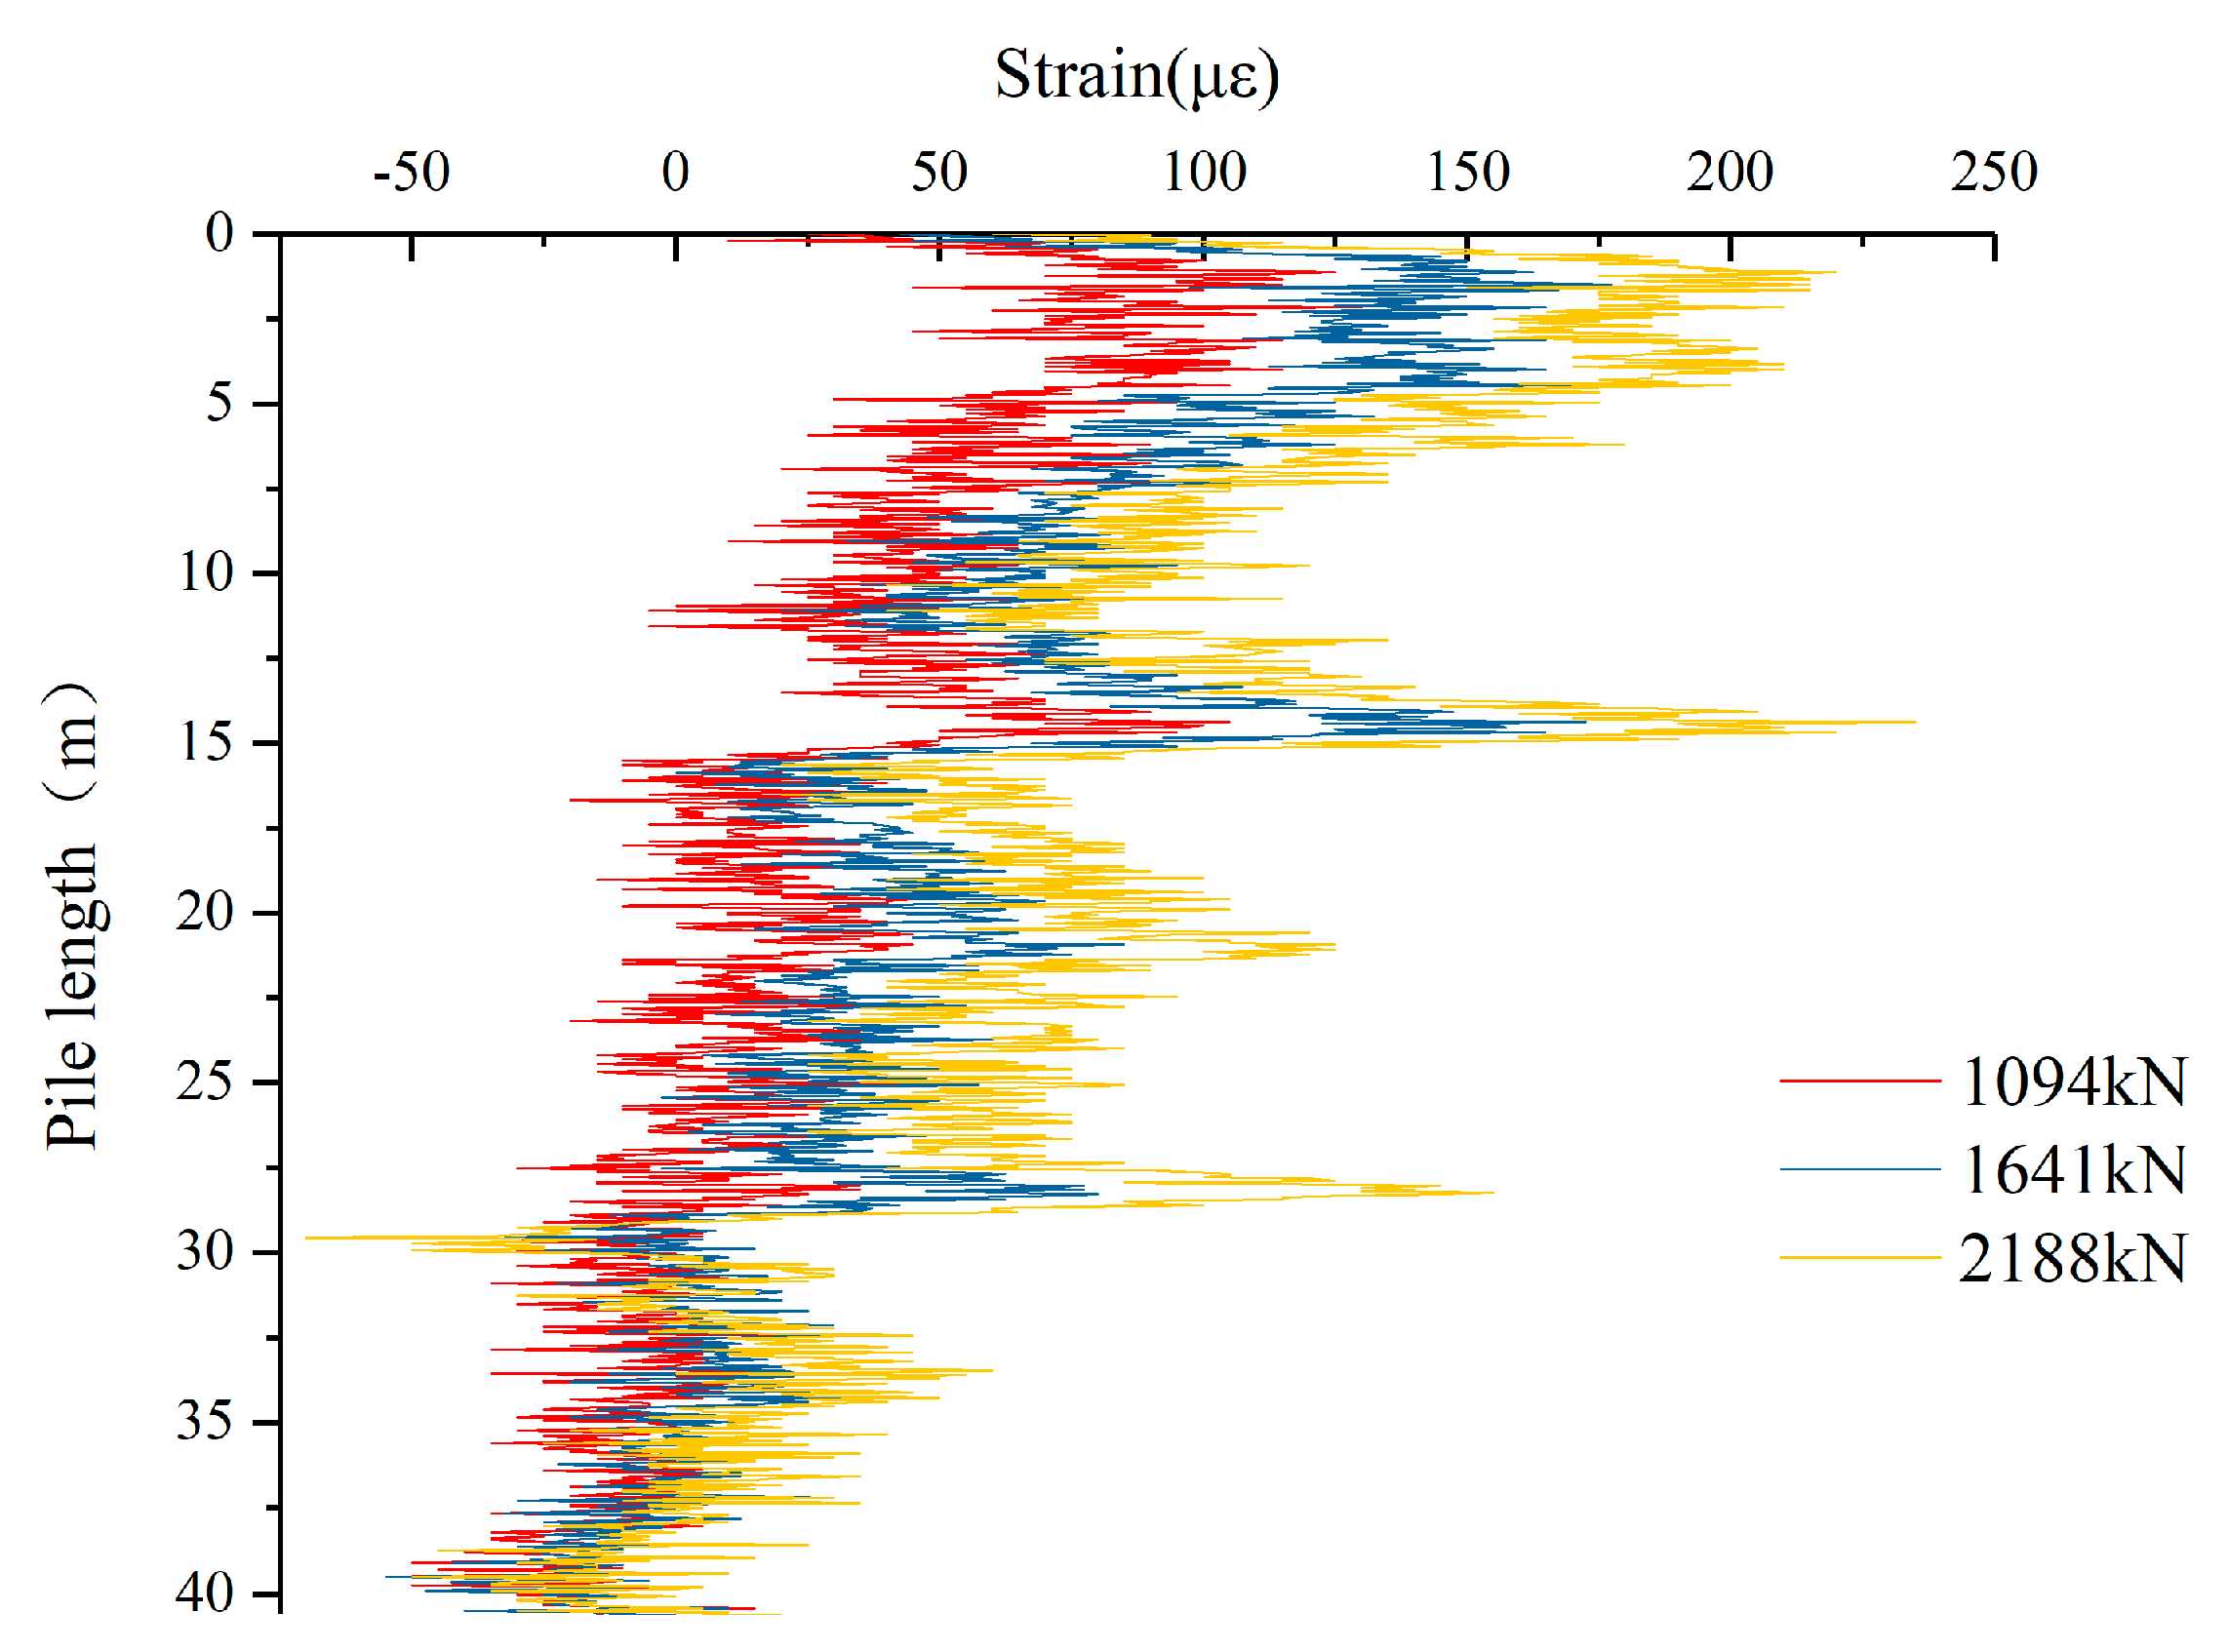
  • Loading and monitoring. After 30 days, the top of the pile is subjected to the loading stages, the loading and unloading conditions are shown in Table 2, including 1094 kN, 1641 kN, 2188 kN, which are selected as processing objects.
The photos of field test are shown in Figure 2. Figure 2a is the process of fixing the optical fiber, Figure 2b is the U-shaped layout diagram of the optical fiber, Figure 2c is the field static load diagram, and Figure 2d is BOTDR instrument.

4. Results

4.1. Raw Data

The strain monitoring data on the entire optical fiber was obtained during the static load test. Since the optical fiber on the pile is only a part of the entire fiber, the monitoring data belonging to the pile body should first be judged and extracted. The monitoring data of the three levels of loading are taken as an example, and the extraction data is shown in Figure 3.
It can be seen from Figure 3 that there is a large fluctuation in the original data and it is difficult to see the specific trend. This is mainly because a large amount of noise signals is present in the original data, thus it is necessary to deal with certain denoising and smoothing on the original data. It should be noted that because part of the pile head is exposed to the ground and the shallow depth of the pile head is highly susceptible to environmental influence. Additionally, the data trend of the first 1~2 m part of pile head is unreasonable, and attention should be paid to the data analysis.

4.2. Data Denoising

In practical application, when the structure system uses the optical fiber sensor monitoring, the sensor monitoring instrument due to systematic error, Brillouin signal characteristics, and ambient environment (e.g., atmosphere, temperature, pressure, etc.) among other factors make the field monitoring data more or less mixed with noise signals inside the useful signal. The noise signal data gives a false judgment on the deformation of the monitored structure, and these noise signals should be analyzed and denoised. In order to eliminate or reduce the impact of noise on the monitoring data, the monitoring data is generally regarded as a digital signal sequence composed of several different frequencies, and the original data is denoised by an effective signal processing method. There are many methods for signal denoising, such as wavelet analysis, fast Fourier transform (FFT) and so on. The wavelet analysis method is adopted to remove the noise signal, the relatively ideal data are obtained.
The original signal collected by BOTDR data acquisition instrument was decomposed into two layers by db5 wavelet function, the different threshold processing methods were used to process high-frequency signals of all levels, and then the noise signal was eliminated by wavelet reconstruction. The stein-based unbiased risk threshold rigrsure processing method is used [22]. According to the characteristics and applicability of soft and hard thresholds, soft thresholds are selected to process high-frequency signals at all levels, the processed signals and low-frequency signals are reconstructed to obtain the denoised signals. The denoised signal is shown in Figure 4.
Through analysis, the change rule of signals processed by Stein-based unbiased risk threshold rigrsure method is the same as the original monitoring signal. While removing most of the noise, the retaining signal is useful, it achieves the purpose of denoising the monitoring signal.

4.3. Data Smoothing

4.3.1. Smoothing

It can be seen from the curve in Figure 4, the fluctuation range of the signal after denoising is still obvious, thus it is necessary to smooth and trim the real curve (denoising signal) in order to make a correct judgment on the deformation law of the pile. The translational mean method, Savitzky-Goiay method and percentile-filter method are used to smooth and trim the signal denoised by Stein’s unbiased risk threshold rigrsure processing method. The lines in Figure 5, Figure 6 and Figure 7 are the smoothed results. Because of the large amount of field monitoring data, it should ensure that the trend of the smoothed curve is consistent with the original signal. The number of items taken by the translation mean method is the average of the values corresponding to each 40 points before and after the data of the intermediate point is obtained; while the Savitzky-Goiay method is a polynomial curve fitting method, which is also a commonly used data fitting method, the formula coefficients are generally quadratic.

4.3.2. Comparison of Smoothing Methods

Through the comparative analysis of Figure 5, Figure 6 and Figure 7, it is found that the general change trend of the curves after denoised and smoothing, the trend of processing signals is basically the same original signals. Compared with the denoised signals without smoothing treatment, the fluctuation amplitude of the curves is reduced to a large extent, making the curves smoother and better reflecting the deformation trend of bored pile. In treatment effect, the Percentile-filter method is relatively unsatisfactory in smoothing effect, and there are some uneven places. At the same time, it compared with the translation mean method and binomial curve fitting method, the curve smoothed by percentile-filter method deviates more from the original signal, and it cannot reflect the change trend of the deformation of bored pile well in large fluctuations. The Savitzky-Goiay method smooths the signal after denoising this time. During processing, the signal still appears to be slightly tortuous after smoothing of the signal, and the overall smoothing effect is worse than the translational mean method while the smoothing of the curve by the translational mean method is smoother; as it is gentler at the node, the treatment effect is relatively better, and it can effectively reflect the deformation trend of the pile.

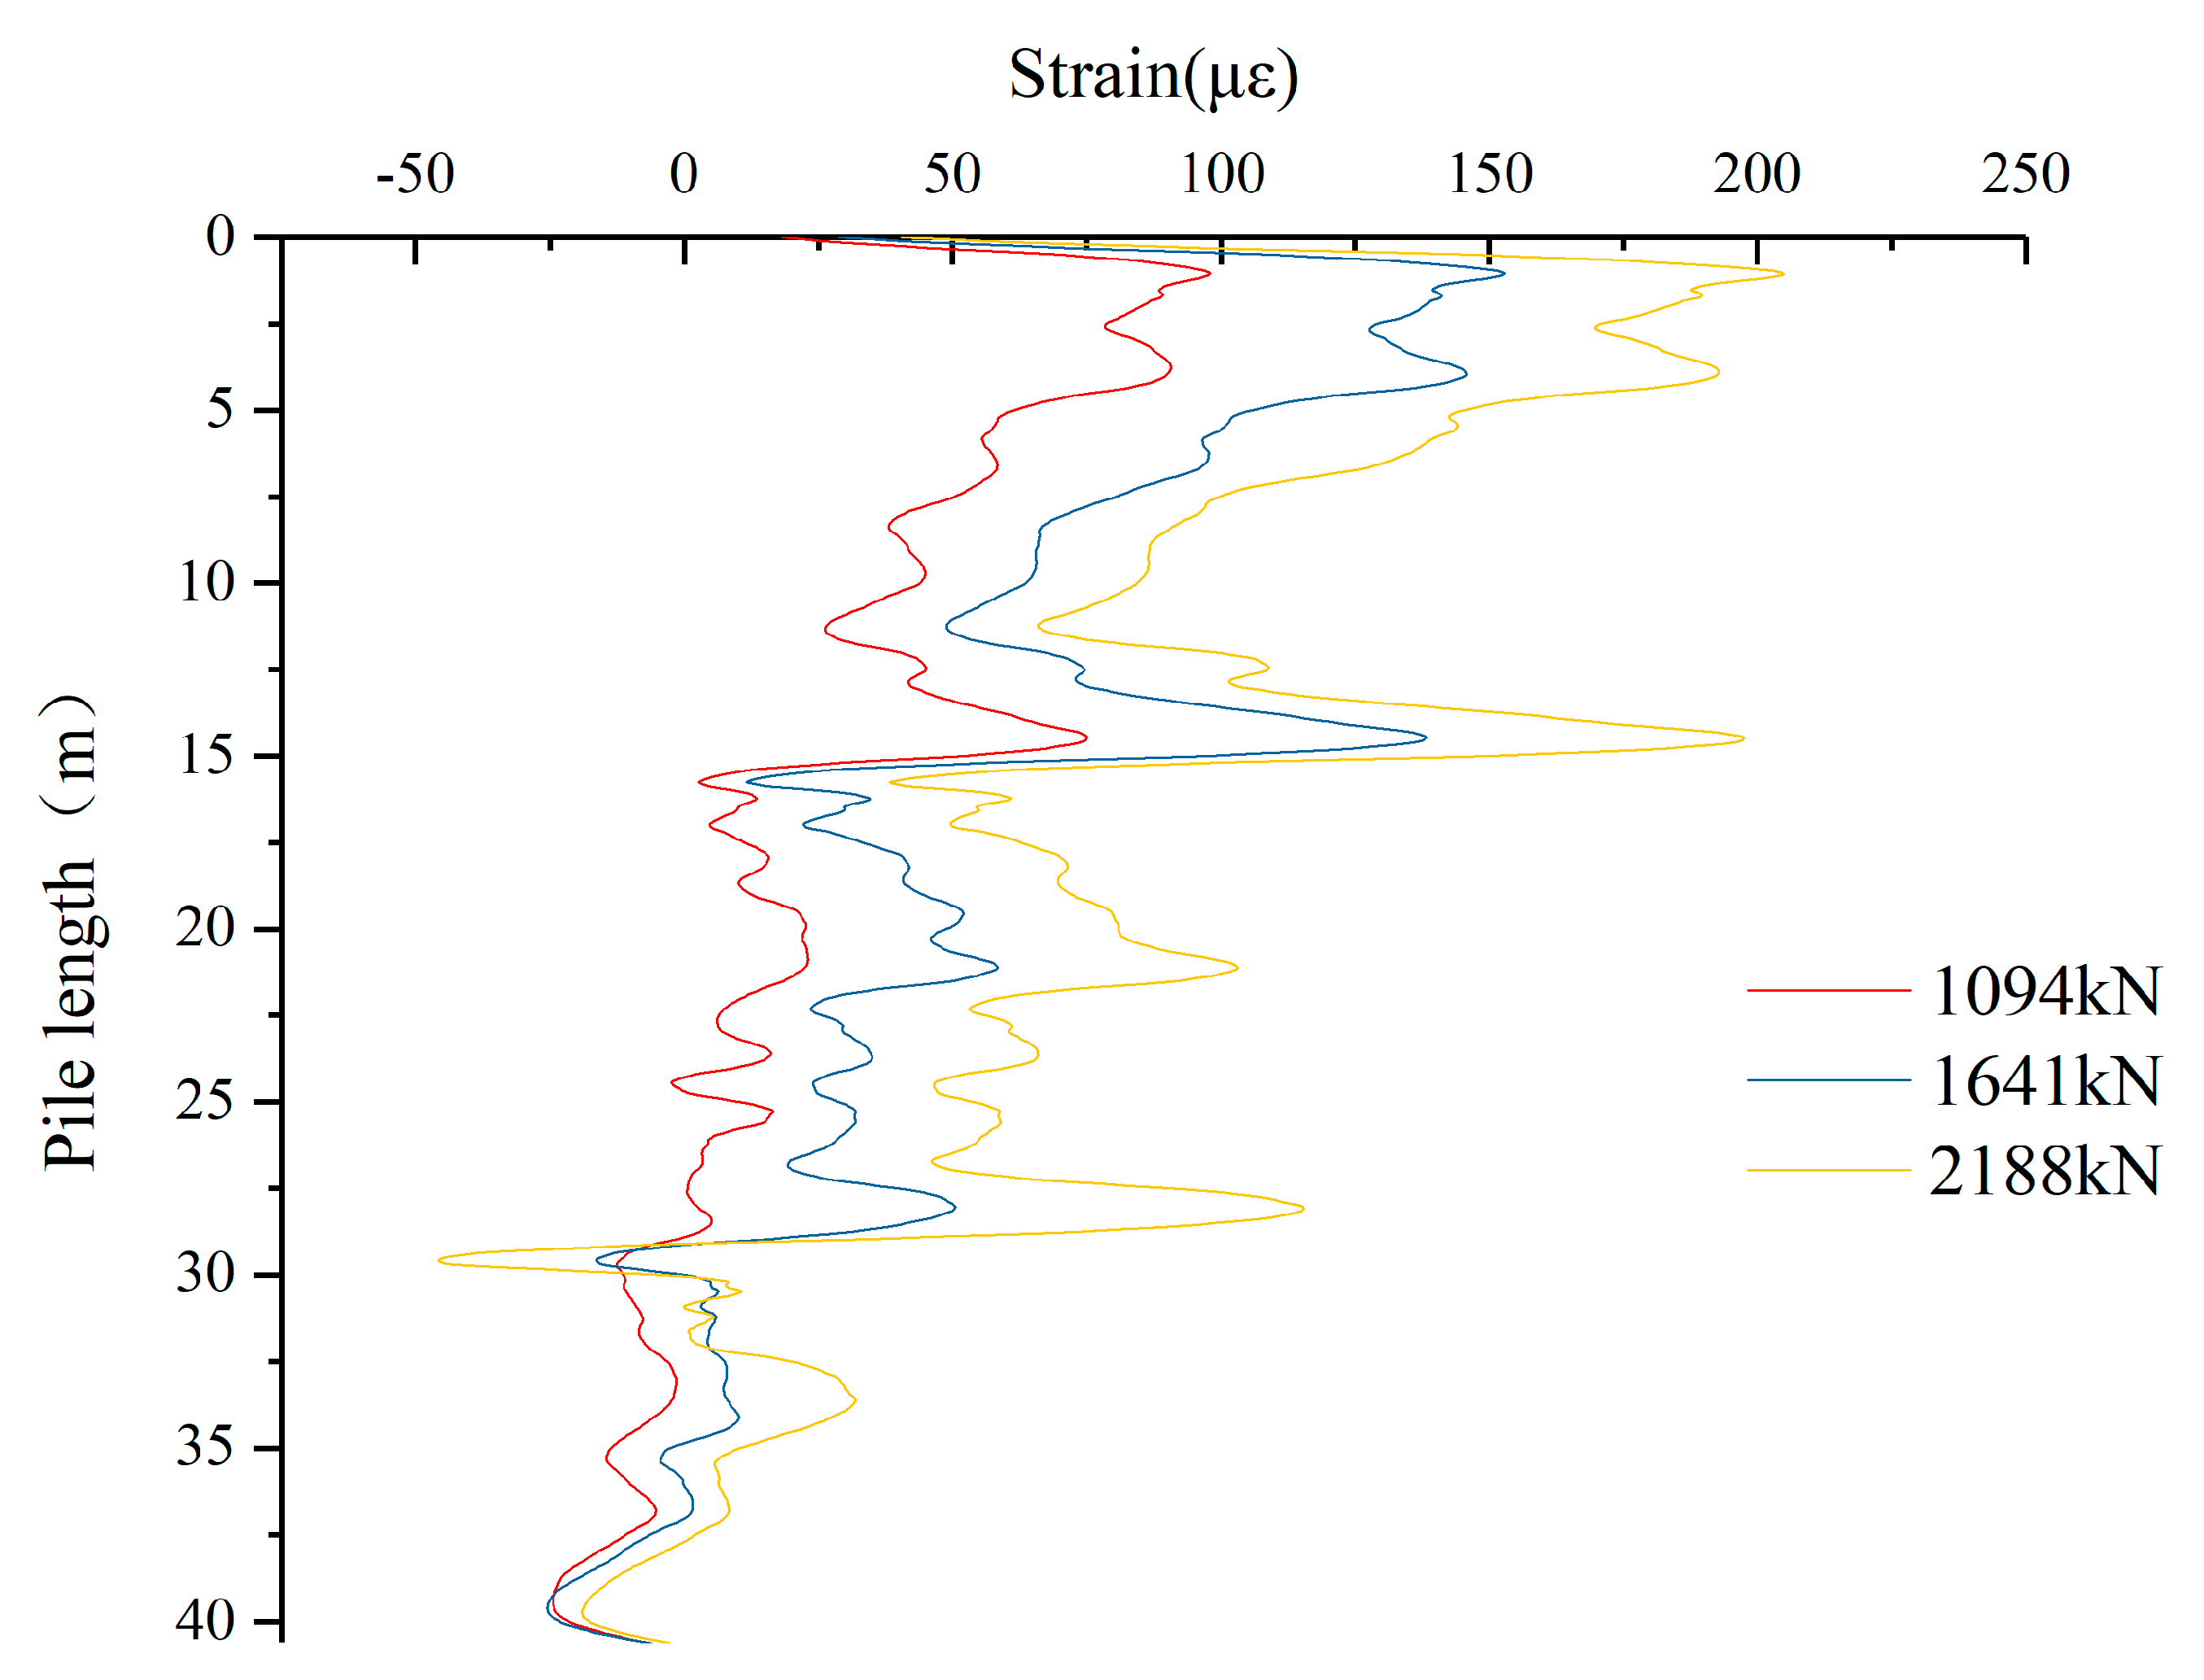
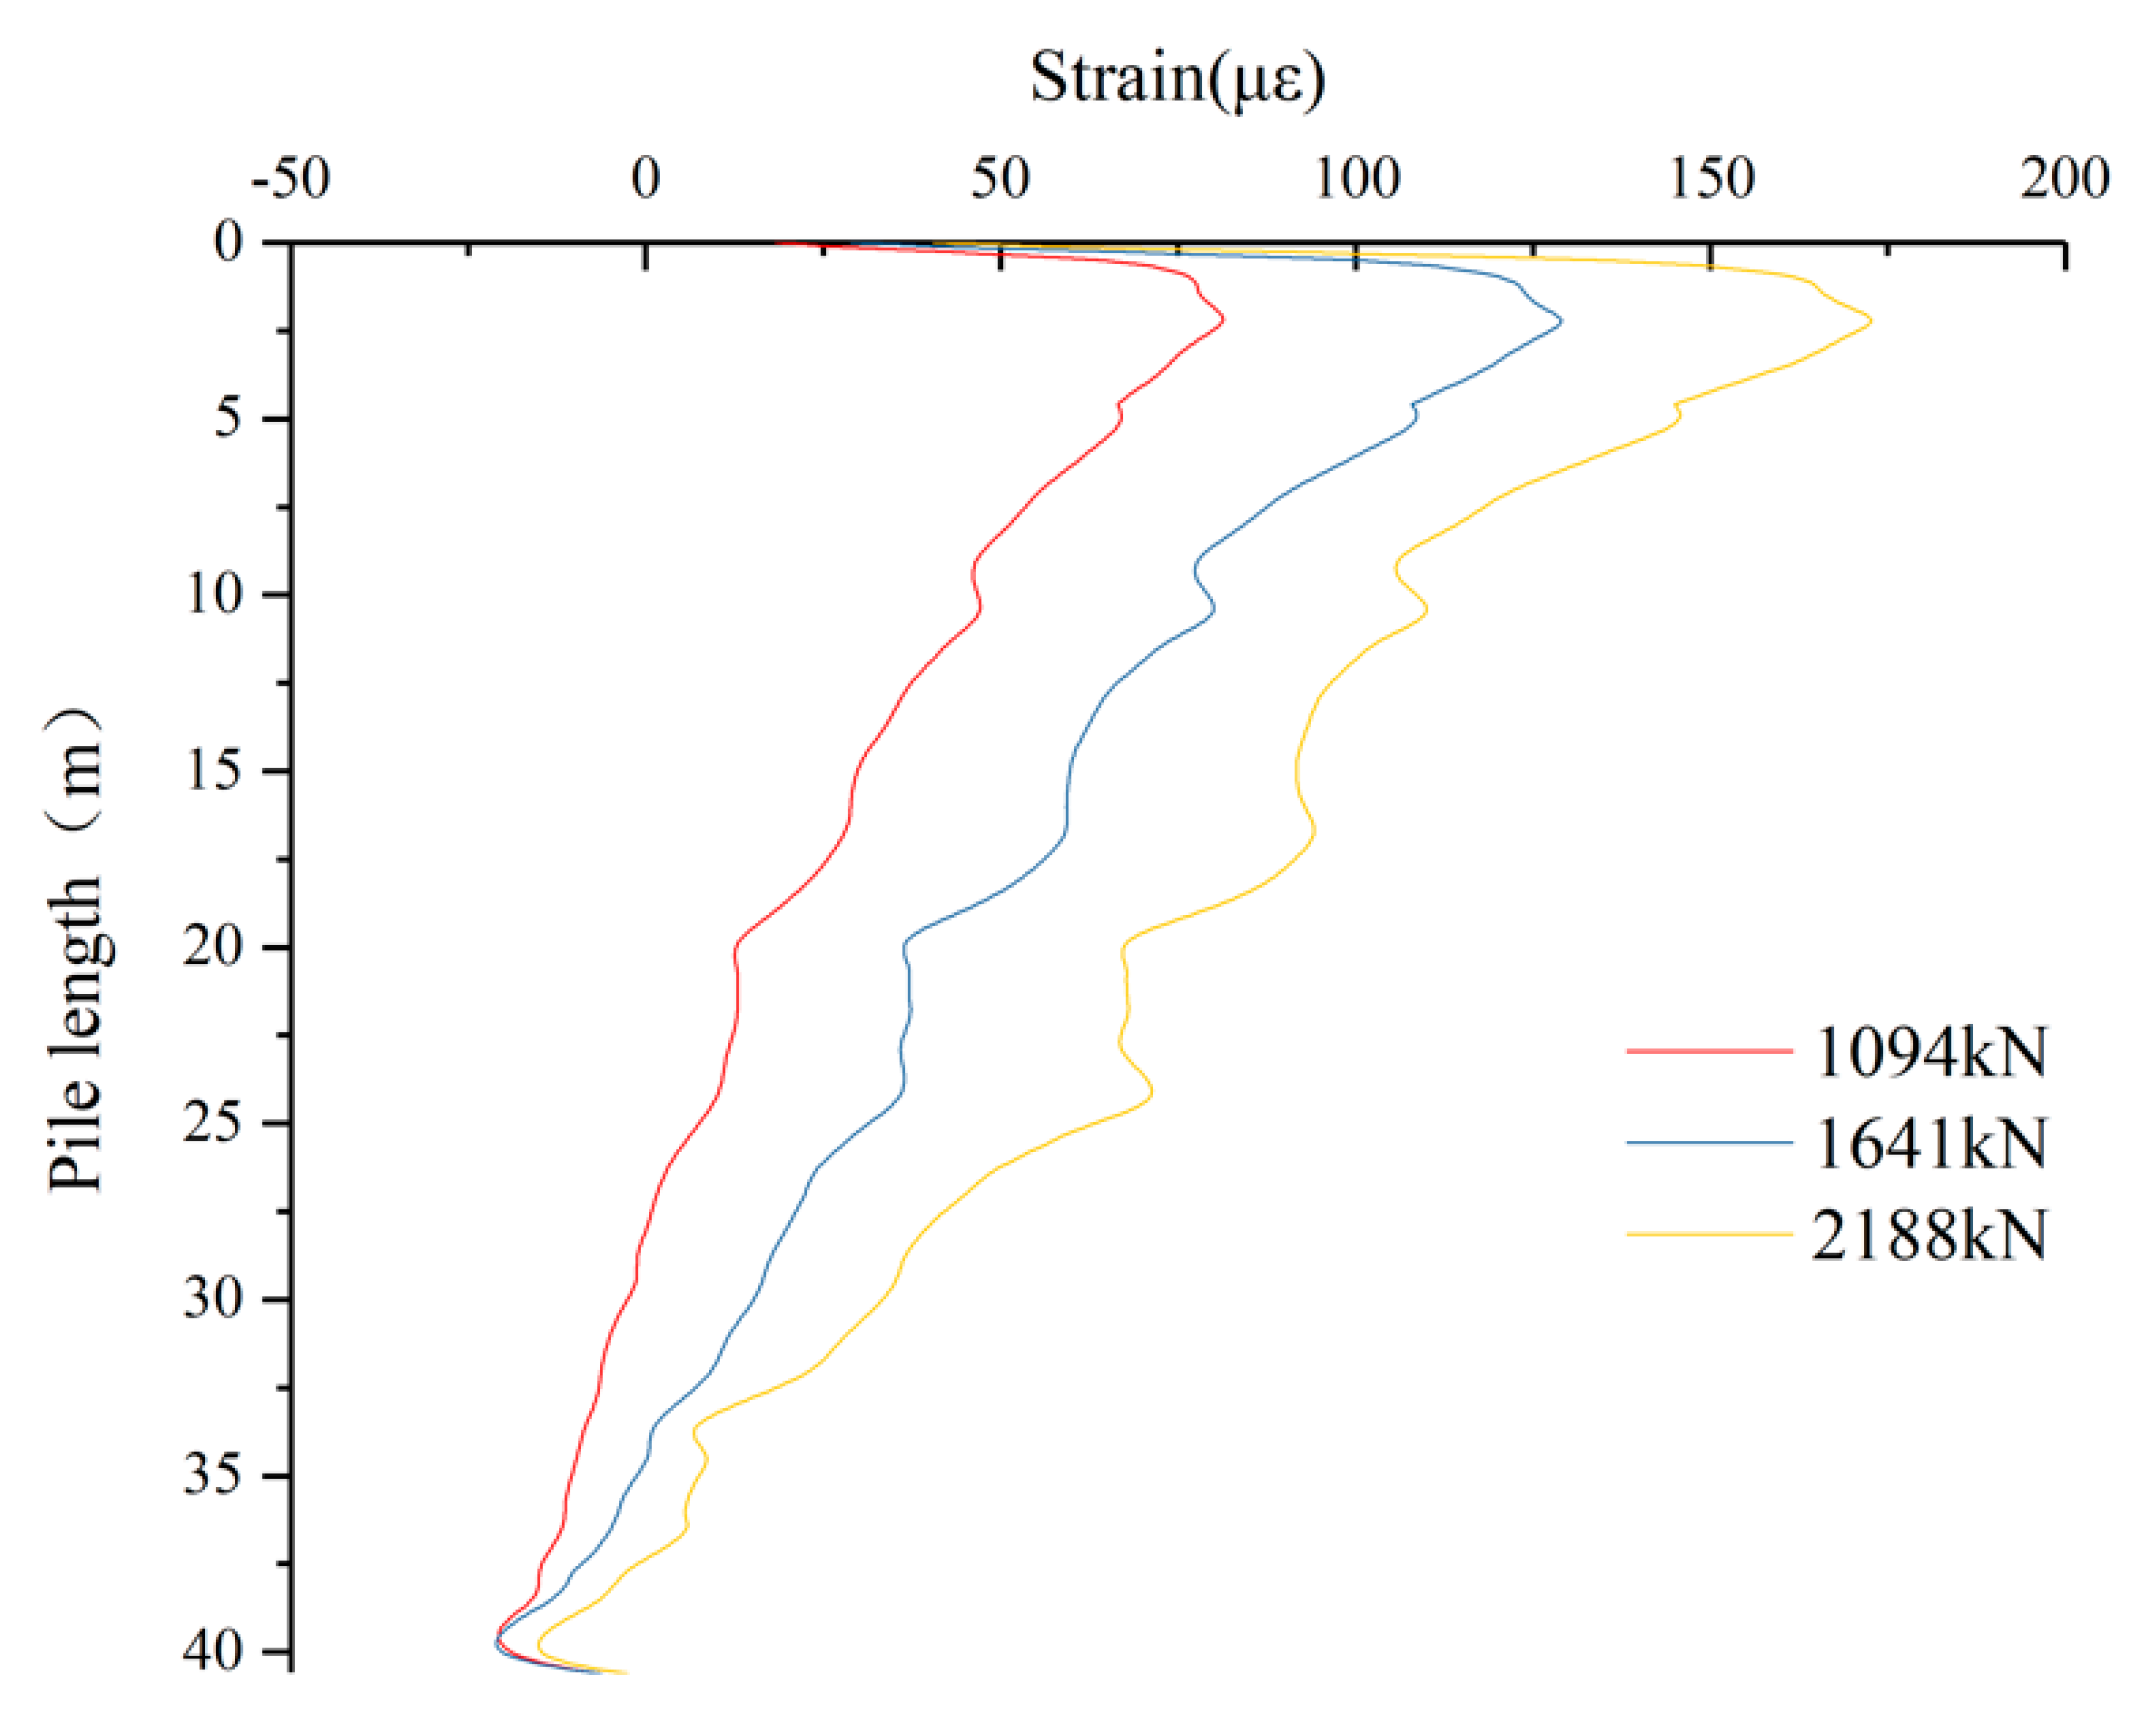
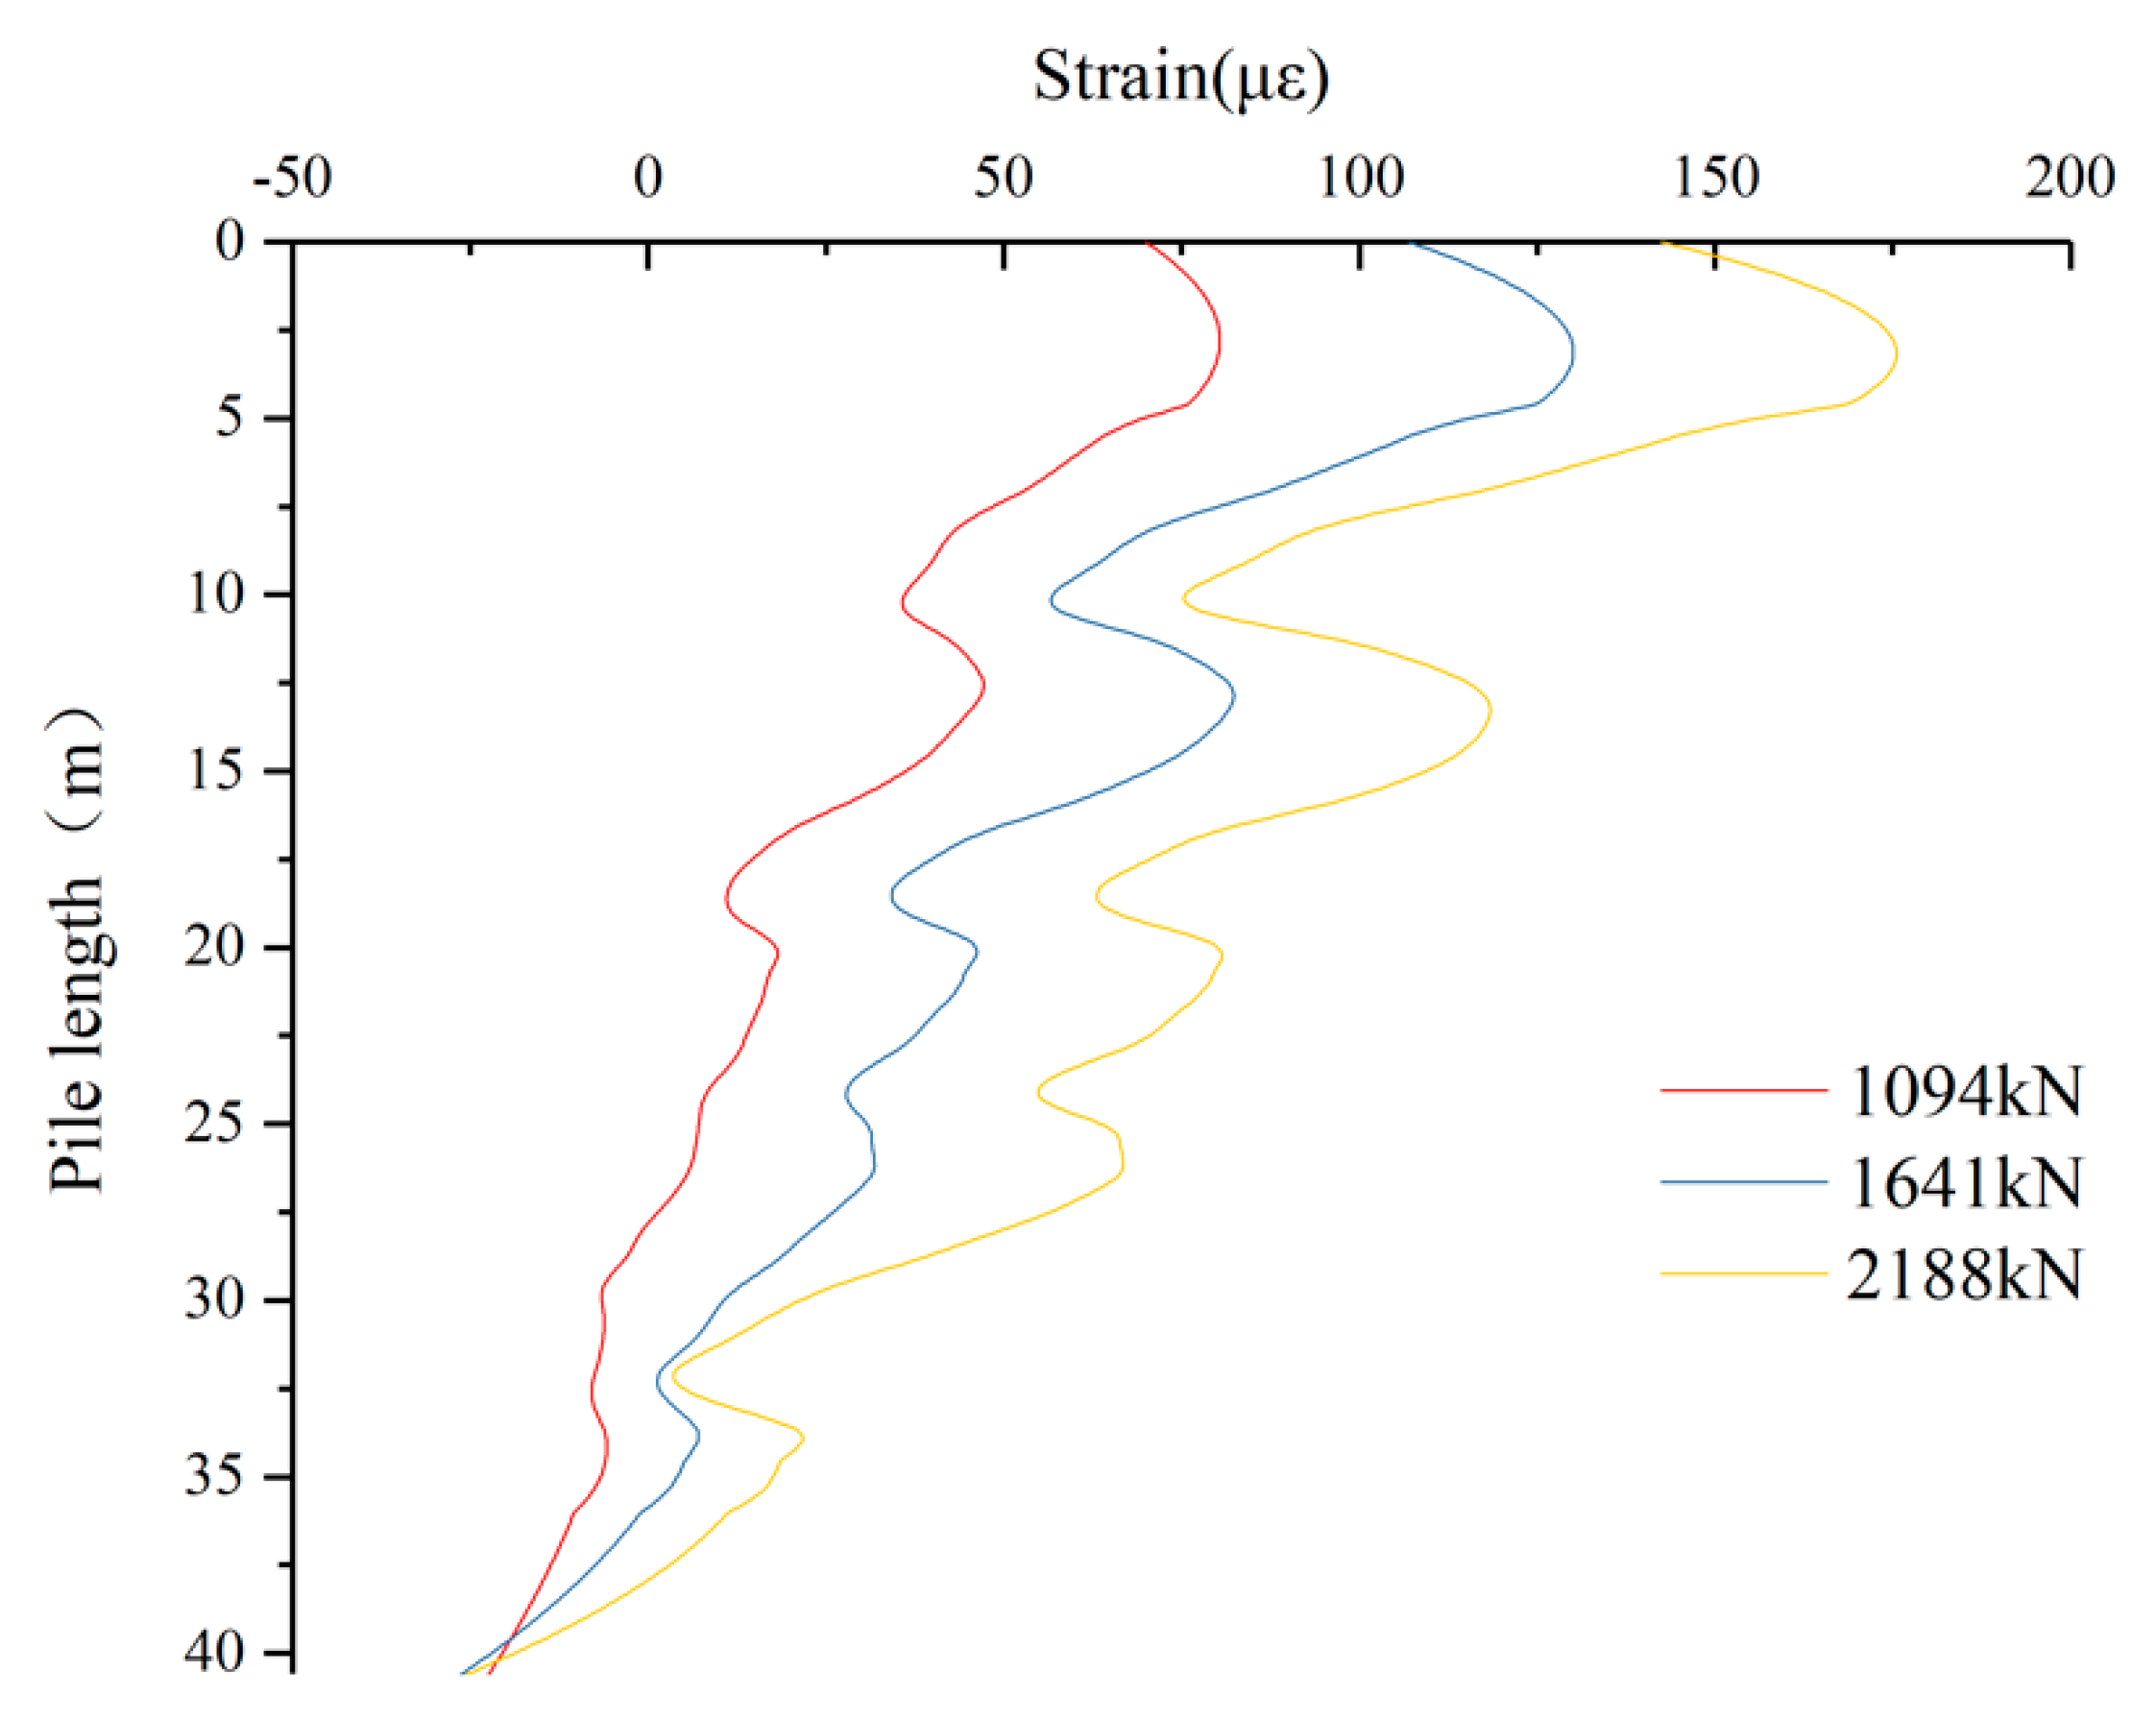
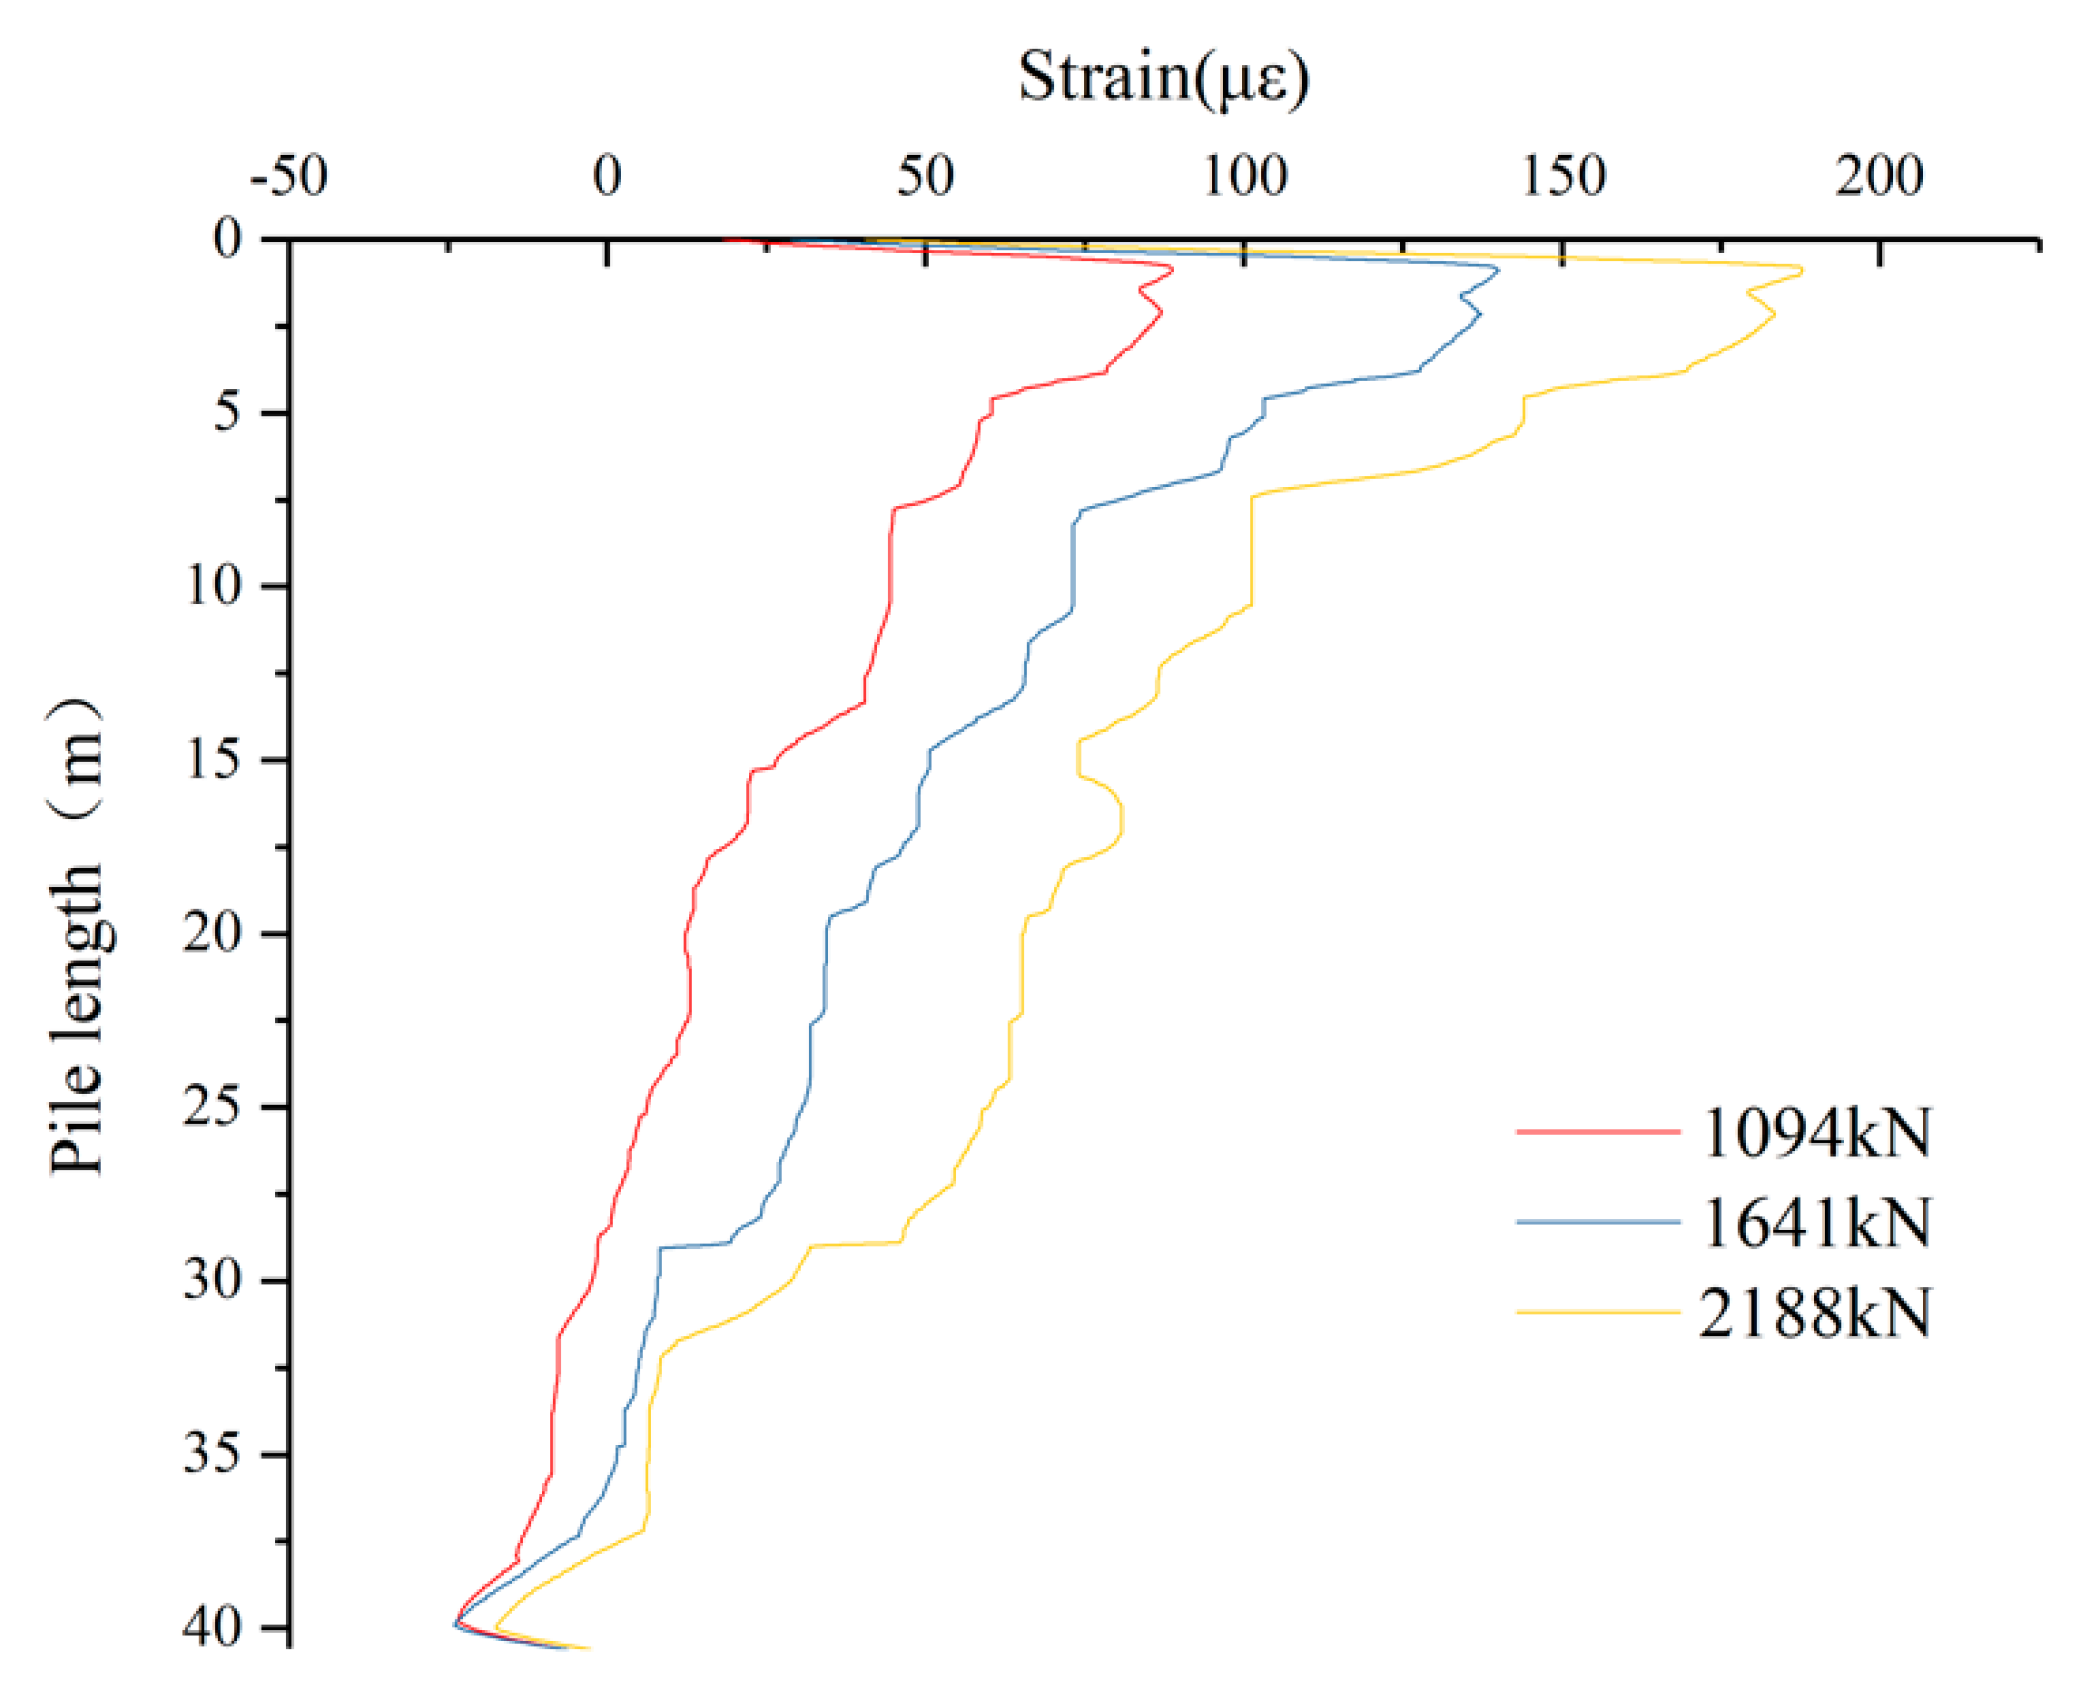
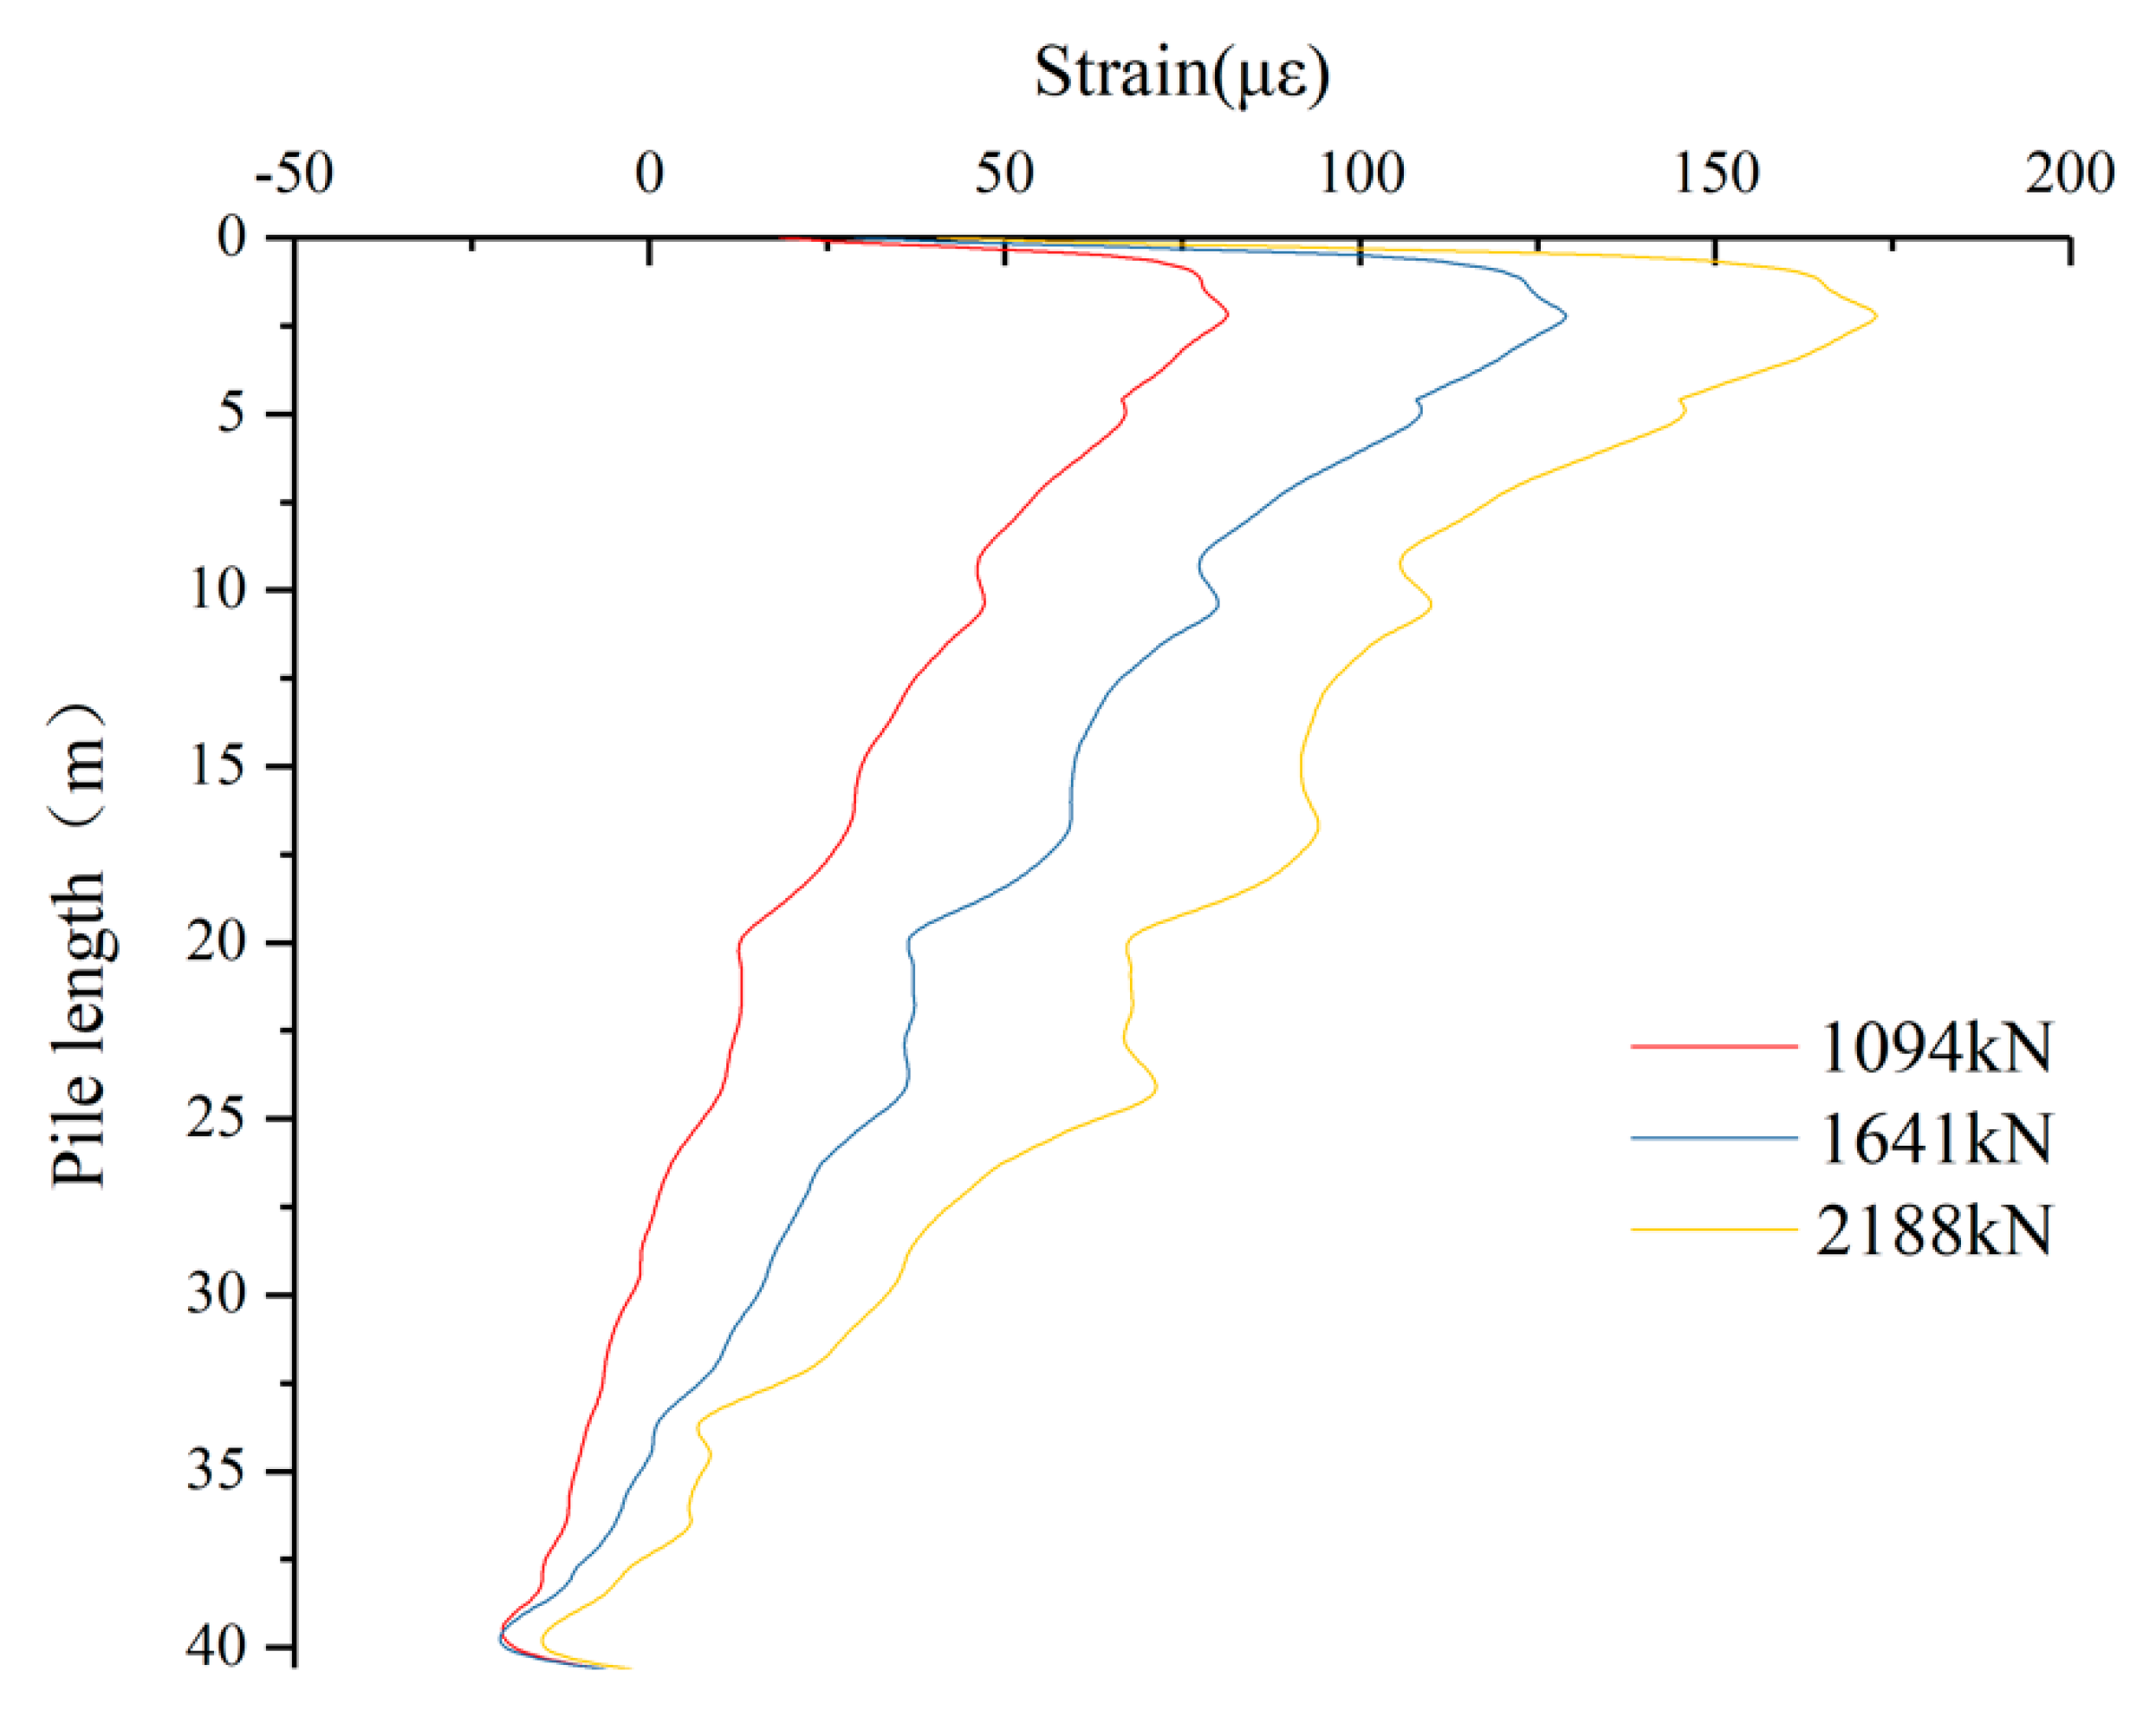
4.4. Data Processing Results

The ideal data processing method is as follows: the pile strain data is decomposed into two layers by using db5 wavelet function. The high frequency coefficients at all levels are processed by stein-based unbiased risk threshold rigrsure method and reconstructed with the second-order low frequency signal, it achieves the effect of denoising for the original signal. The denoised signal is smoothed by the translation mean value method, and the strain variation trend of the pile can reflect the vertical load. The strain of pile under vertical load of 1094 kN, 1641 kN and 2188 kN are obtained by BOTDR distributed optical fiber sensing technology. As a typical example, the db5 wavelet basis function for the noise data is used, the rigrsure Stein’s unbiased risk threshold method based on two layers of the quantized treatment is applied, and the high frequency signal at all levels is decomposed. Thus, the results by secondary low frequency signal reconstruction and translation mean method are obtained. The final strain curves are shown in Figure 8.
According to the analysis of Figure 4, Figure 5, Figure 6, Figure 7 and Figure 8, the main trend of strain for bored pile is gradually decreasing from top to bottom, the data is fluctuation due to the interference in the range of 1~2 m of the head of pile. There are three peaks at the pile length of 13 m, 27 m, and 32 m which may be caused by many factors such as pile defects, soft soil, and water. The data process method used in this paper can reduce this peak effect.

5. Conclusions

In this paper, a series of work on the deformation characteristics of bored pile is carried out by using BOTDR distributed optical fiber sensing technology. The following conclusions are obtained:
(1).
The field loading test is carried out. The BOTDR distributed optical fiber sensing technology is used to monitor the deformation of pile, and the strain of the pile is obtained to provide a basis of data for studying the deformation characteristics of bored pile. It shows the advantages of distributed optical fiber sensing technology in the deformation of pile monitoring.
(2).
The wavelet function is chosen to decompose the strain monitoring data of the pile. The Stein based unbiased risk threshold rigrsure processing method is used to process the signal and obtain the denoised signal. The ideal result is obtained.
(3).
Using the translation mean method, the Savitzky-Goiay method, percentile-filter method and Stein’s unbiased risk threshold Rigrsure processing method, the optical fiber data is processed. By comparing the smoothing results, the percentile-filter method cannot well reflect the change trend of the deformation of bored pile in large fluctuations, the overall smoothing effect of the Savitzky-Goiay method is worse than that of the translation average method, and the smoothing degree of the curve after smoothing by the translation average method is higher, which can effectively reflect the deformation change trend of the bored pile.

Author Contributions

L.G. designed the project. C.H. and Z.X. performed the experiment. Y.J. and J.Y. analyzed the data and prepared the manuscript.

Funding

Financial support comes from the National Natural Science Foundation of China (Grant No. 51508159), the Fundamental Research Funds for the Central Universities of Hohai University (No. 2019B12914, No. 2019B44114), the Key Laboratory of Ministry of Education for Geomechanics and Embankment Engineering, Hohai University (No. GHXN201904) are gratefully appreciated.

Conflicts of Interest

The authors declare no conflict of interest.

References

  1. Gao, L.; Gong, Y.H.; Liu, H.L.; Ji, B.Q.; Xuan, Y.N.; Ma, Y. Experiment and Numerical Study on Deformation Measurement of Cast-in-Place Concrete Large-Diameter Pipe Pile Using Optical Frequency Domain Reflectometer Technology. Appl. Sci. 2018, 8, 1450. [Google Scholar] [CrossRef]
  2. Barrias, A.; Casas, J.R.; Villalba, S. A Review of Distributed Optical Fiber Sensors for Civil Engineering Applications. Sensors 2016, 16, 748. [Google Scholar] [CrossRef] [PubMed]
  3. Zhu, H.H.; Shi, B.; Zhang, C.C. FBG-based monitoring of geohazards: Current status and trends. Sensors 2017, 17, 452. [Google Scholar] [CrossRef] [PubMed]
  4. Byoungho, L. Review of the present status of optical fiber sensors. Opt. Fiber Technol. 2003, 9, 57–79. [Google Scholar]
  5. Zhao, Y.; Deng, Z.Q.; Wang, Q. Fiber optic SPR sensor for liquid concentration measurement. Sens. Actuators B Chem. 2014, 192, 229–233. [Google Scholar] [CrossRef]
  6. Weng, Y.; Ip, E.; Pan, Z.; Wang, T. Singlend simultaneous temperature and strain sensing techniques based on Brillouin opticaltime domain reflectometry in fewmode fibers. Opt. Express 2015, 23, 9024–9039. [Google Scholar] [CrossRef] [PubMed]
  7. Fabien, R.; Bao, X.; Li, Y.; Yu, Q.; Yale, A.; Kalosha, V.P.; Chen, L. Signal processing technique for distributed Brillouin sensing at centimeter spatial resolution. Lightwave Technol. 2007, 25, 3610–3618. [Google Scholar]
  8. Lu, Y.; Shi, B.; Wei, G.Q.; Chen, S.E.; Zhang, D. Application of a distributed optical fiber sensing technique in monitoring the stress of precastpiles. Smart Mater. Struct. 2012, 11, 115011. [Google Scholar] [CrossRef]
  9. Sakairi, Y.; Uchiyama, H.; Li, Z.X.; Adachi, S. System for measuring temperature and strain separately by BOTDR and OTDR. Proc. SPIE 2002, 4920, 274–284. [Google Scholar]
  10. Horiguchi, T.; Shimizu, K.; Kurashima, T.; Tateda, M.; Koyamada, Y. Development of a Distributed Sensing Technique Using Brillouin Scattering. J. Lightwave Technol. 1995, 13, 1296–1302. [Google Scholar] [CrossRef]
  11. Hong, C.Y.; Zhang, Y.F.; Li, G.W.; Zhang, M.X.; Liu, Z.X. Recent progress of using Brillouin distributed fiber optic sensors for geotechnical health monitoring. Sens. Actuators A Phys. 2017, 258, 131–145. [Google Scholar] [CrossRef]
  12. Kee, H.H.; Lees, G.P.; Newson, T.P. All-fiber system for simultaneous interrogation of distributed strain and temperature sensing by spontaneous Brillouin scattering. Opt. Lett. 2000, 25, 695–697. [Google Scholar] [CrossRef]
  13. Klar, A.; Dromy, I.; Linker, R. Monitoring tunneling induced ground displacements using distributed fiber-optic sensing. Tunn. Undergr. Space Technol. 2014, 40, 141–150. [Google Scholar] [CrossRef]
  14. Monsberger, C.; Woschitz, H.; Hayden, M. Deformation measurement of a driven pile using distributed fibre-optic sensing. J. Appl. Geod. 2016, 10, 61–69. [Google Scholar] [CrossRef]
  15. Klar, A.; Uchida, S.; Levenberg, E. In Situ Profiling of Soil Stiffness Parameters Using High-Resolution Fiber-Optic Distributed Sensing. J. Geotech. Geoenviron. Eng. 2016, 142, 04016032. [Google Scholar] [CrossRef]
  16. Simpson, B.; Hoult, N.A.; Moore, I.D. Distributed sensing of circumferential strain using fiber optics during full-scale buried pipe experiments. J. Pipeline Syst. Eng. Pract. 2015, 6, 04015002. [Google Scholar] [CrossRef]
  17. Zhu, H.-H.; Shi, B.; Yan, J.F.; Zhang, J.; Wang, J. Investigation of the evolutionary process of a reinforced model slope using a fiber-optic monitoring network. Eng. Geol. 2015, 186, 34–43. [Google Scholar] [CrossRef]
  18. Shangguan, M.; Wang, C.; Xia, H.; Shentu, G.; Dou, X.; Zhang, Q.; Pan, J.W. Brillouin optical time domain reflectometry for fast detection of dynamic strain incorporating double-edge technique. Opt. Commun. 2016, 398, 95–100. [Google Scholar] [CrossRef]
  19. Villalban, S.; Casas, J.R. Application of optical fiber distributed sensing to health monitoring of concrete structures. Mech. Syst. Signal Process. 2013, 39, 441–451. [Google Scholar] [CrossRef]
  20. Sierra-Pérez, J.; Torres-Arredondo, M.A.; Güemes, A. Damage and nonlinearities detection in wind turbine blades basedon strain field pattern recognition. FBGs, OBR and strain gauges comparison. Compos. Struct. 2016, 135, 156–166. [Google Scholar]
  21. Zhang, C.-C.; Zhu, H.-H.; Liu, S.P.; Shi, B.; Zhang, D. A kinematic method for calculating shear displacements of landslides using distributed fiber optic strain measurements. Eng. Geol. 2018, 234, 83–96. [Google Scholar] [CrossRef]
  22. Valencia, D.; Orejuela, D.; Salazar, J.; Valencia, J. Comparison analysis between rigrsure, sqtwolog, heursure and minimaxi techniques using hard and soft thresholding methods. In Proceedings of the 2016 XXI Symposium on Signal Processing, Images and Artificial Vision (STSIVA) IEEE, Bucaramanga, Colombia, 31 August–2 September 2016. [Google Scholar]
Figure 1. Optical fiber and schematic diagram of field test. (a) GFRP optical fiber; (b) Schematic diagram of field test.
Applsci 09 02435 g001aApplsci 09 02435 g001b
Figure 2. Photos of field test. (a) Fixing optical fiber; (b) U-shaped wiring; (c) Field loading; (d) BOTDR instrument.
Applsci 09 02435 g002
Figure 3. Raw data.
Figure 3. Raw data.
Applsci 09 02435 g003
Figure 4. Signal reconstruction after denoising.
Applsci 09 02435 g004
Figure 5. Translation mean method smoothing signal.
Applsci 09 02435 g005
Figure 6. Savitzky-goiay method smoothing signal.
Applsci 09 02435 g006
Figure 7. Percentile-filter smoothing signal.
Applsci 09 02435 g007
Figure 8. Final strain curves under three loads.
Applsci 09 02435 g008
Table 1. Physical and mechanical properties of soil.
Soil Layer
Numbering
Soil NameThickness (m)Density
ρ (g/cm3)
Elastic Modulus
E (MPa)
Cohesion
C (kPa)
Internal Friction Angle
φ (°)
(1)Plain fill3.551.9018.530.924.6
(2)Clay2.581.9738.546.616.6
(3)Silty clay2.891.8929.531.121.6
(4)Silt3.451.8841.06.226.8
(5)Silty sand4.911.9343.03.829.4
(6)Silty clay6.441.8923.030.920.4
(7)-1Silty clay3.081.8821.53019.7
(7)-2Silty clay and silt interbed3.551.9141.03.928.2
(8)Silty sand1.9342.03.829.4
Table 2. Classification table of pile loading and unloading test.
Level0123456789
Loading grading (kN)0109416412188273532823829437649235470
Unloading grading (kN)43763288218810940

