Article

Authenticity and Concentration Analysis of Extra Virgin Olive Oil Using Spontaneous Raman Spectroscopy and Multivariate Data Analysis

Danish Fundamental Metrology, Kogle Alle 5, 2970 Hørsholm, Denmark
*
Author to whom correspondence should be addressed.
Appl. Sci. 2019, 9(12), 2433; https://doi.org/10.3390/app9122433
Submission received: 8 May 2019 / Revised: 6 June 2019 / Accepted: 12 June 2019 / Published: 14 June 2019
(This article belongs to the Special Issue Novel Insights to Raman Spectroscopy: Advances and Prospects)

Abstract

:

Featured Application

This work uses Raman spectroscopy for determining the quality of olive oil when one or more adulterants are added.

Abstract

Adulteration of extra virgin olive oil (EVOO) with cheaper edible oils is of considerable concern in the olive oil industry. The potential of Raman spectroscopy combined with multivariate statistics has been investigated for evaluating the authenticity (or purity) and concentration of EVOO irrespective of it being adulterated with one or more adulterants. The adulterated oil samples were prepared by blending different concentrations of EVOO (10–100% v/v) randomly with cheaper edible oils such as corn, soybean and rapeseed oil. As a result, a Raman spectral database of oil samples (n = 214 spectra) was obtained from 11 binary mixtures (EVOO and rapeseed oil), 16 ternary mixtures (EVOO, rapeseed and corn oil) and 44 quaternary mixtures (EVOO, rapeseed, corn and soybean oil). Partial least squares (PLS) calibration models with 10-fold cross validation were constructed for binary, ternary and quaternary oil mixtures to determine the purity of spiked EVOO. The PLS model on the complex dataset (binary + ternary + quaternary) where the spectra obtained with different measurement parameters and sample conditions can able to determine the purity of spiked EVOO inspite of being blended with one or more cheaper oils. As a proof of concept, in this study, we used single batch of commercial oil bottles for estimating the purity of EVOO. The developed method is not only limited to EVOO, but can be applied to clean EVOO obtained from the production site and other types of food.

Graphical Abstract

1. Introduction

The ability to deliver safe and authentic food is of high priority for manufacturers. However, often due to complex network of suppliers, the potential of unintentional contamination of food exists considerably. The deliberate contamination driven by economic gain has also become harder to detect and track. As a result, the vulnerability of products and the risks inherent to food fraud is of considerable concern. An example is fake or diluted extra virgin olive oil (EVOO). In the worst-case and illegal scenario, EVOO is diluted with cheap vegetable/seed oils or lower-grade, refined olive oils. The authenticity or purity of EVOO has a direct impact on consumers’ trust and attitude towards the product and may even pose health risks to the consumer when it is adulterated. EVOO is a fruit oil obtained by cold pressing the pulp of olives. It is one of the main ingredients in the Mediterranean diet, and the consumption of EVOO has spread worldwide due to its nutritional properties and health benefits [1]. The rising global consumer need for EVOO commands premium prices, counterfeiting of EVOO with other cheaper oils including vegetable oils, seed oils, refined olive oils, etc. In a study, researchers from the University of California, Davis and the Australian Oils Research Laboratory concluded that as much as 69% of imported European olive oil sold as extra virgin in the delicatessens and grocery stores on the US west coast was not extra virgin at all [2]. An ongoing global debate is setting quality grades for olive oil (e.g., EVOO is the highest grade of olive oil) and its labelling to avoid producers labelling refined or adulterated olive oil as EVOO. The scientific community is increasingly addressing the issues related to adulteration of EVOO [3,4,5,6,7,8,9] in order to ensure its quality for both economic and health reasons.
Food authenticity (or purity of food) is not a new concept [3,10,11,12,13]. Sensory evaluation carried out by a panel of trained tasters is one of the most important evaluations for determining the quality of EVOO [14]. However, the sensory analysis may not be sensitive enough to detect the purity of EVOO or sophisticated adulterations or mislabeling. Several techniques have been applied to detect the authenticity of EVOO including mass spectrometry, gas chromatography, high-performance liquid chromatography, capillary gas chromatography and nuclear magnetic resonance spectroscopy [4,5,11,12,15,16]. Although these methods are very powerful and provide very low detection limits, they are time consuming and expensive, requiring dedicated laboratories and trained professionals. Hence there is an increasing demand to develop a quick, sensitive, portable, easy-to-use and cost-effective online analytical approach for quantifying either the purity or adulteration of EVOO and potentially the additives.
EVOO is composed mainly of mixed triglyceride esters of oleic acid and palmitic acid and of other fatty acids, along with traces of squalene and sterols, which all can be identified with vibrational spectroscopy techniques. The general chemical structure of EVOO is shown in Figure 1. Vibrational spectroscopy including infrared, near-infrared and Raman spectroscopy in combination with chemometrics are useful techniques for determining the authenticity of EVOO [6,8,13,17,18,19,20,21,22,23]. Raman spectra occurs as a result of a molecular vibration causing a change in polarizability of the molecule. The molecular vibrations reflect the molecular structure and are therefore used as a spectroscopic fingerprint for detection, identification, and imaging of molecules. The Raman scattered (Stokes) signal can be obtained both via a spontaneous process as well as a stimulated process using two lasers having a frequency difference corresponding to the energy difference in the Raman transition involved [24,25,26]. Recently Raman spectroscopy has increasingly been recognized as a reliable quality control tool due to its ability to non-destructively probe adulteration related changes in olive oil with high chemical specificity and without requiring any reagents or sample preparation. Several studies have explored the potential of Raman spectroscopy to identify the nature of adulterants and their concentrations in spiked EVOO (i.e., EVOO spiked with edible oils such as sunflower, corn, soya, rapeseed, hazelnut and olive pomace oil) [6,8,13,17,18,19,20].
However, the studies so far have focused on diluting the EVOO with just one component [6,8,13,17,18,19,20,21,22,23]. In a real-world scenario, the possibilities for diluting EVOO are in principle infinite and the authenticity has to be investigated without having any prior knowledge about how many adulterants have been added and the nature of them. Hence determination of adulteration of olive oils regardless of adulterant vegetable oils (i.e., binary, ternary and quaternary mixtures) was carried out using near-infrared spectroscopy in conjunction with genetic inverse least squares multivariate calibration method [22]. Rather than quantifying each adulterant, quantification of adulteration (i.e., amount of any cheaper oil blended with EVOO) is important and has been accomplished from a mixed group of oil samples (i.e., binary mixture of EVOO with three different edible oils) using Raman spectroscopy together with Bayesian least squares support vector machines [8]. As a consumer, quantification of purity is the primary interest (how much real EVOO is present in the bottle of oil labelled as EVOO). It is also much easier and practical to develop cheap and fast tools that can quantify the purity (the amount of EVOO) regardless of the number of adulterants that have been added. In this study, we explored the potential of Raman spectroscopy with a simple partial least squares (PLS) method to quantify the purity of olive oil from up to four different kinds of dilutions at the same time i.e., quaternary mixtures (EVOO + rapeseed + corn + soybean oil). Raman spectroscopy in combination with a simple PLS model is able to quantify the purity of olive oil regardless of number of adulterants that has been added (binary + ternary + quaternary mixtures). Note that the spectral library was obtained with different measurement parameters (power levels and acquisition times). As we know the nature of the adulterants in this study, non-negative least squares method [27] was implemented to quantify the concentrations of EVOO and each adulterant in the spiked EVOO. As this study focused on determining the purity of olive oil irrespective of blended with one or more adulterants, the potential variations in the chemical composition of EVOO associated with cultivar, region, altitude, time of harvest, soil conditions, extraction process, as well as ageing and oxidation associated with storage conditions such as exposure to oxygen, light, and temperature will be incorporated in the future study.

2. Materials and Methods

2.1. Samples

EVOO, sunflower oil, corn oil and soybean oil have been purchased from local grocery stores. EVOO with volume percentage ranging from 0 to 100% was blended with cheaper edible oils. Consequently, 11 binary mixtures (EVOO and rapeseed oil), 16 ternary mixtures (EVOO, rapeseed and corn oil) and 44 quaternary mixtures (EVOO, rapeseed, corn and soybean oil) were obtained for Raman spectroscopy measurements. The oil samples were gently vortexed just before the Raman measurements to ensure complete homogenization. It should be noted that the Raman measurements were made on a single batch of samples and the olive oil is considered as pure (i.e., EVOO) as stated by the supplier. For real-life applications, our method for the analysis of the purity of EVOO needs to be verified by other means, for example, mass spectrometers.

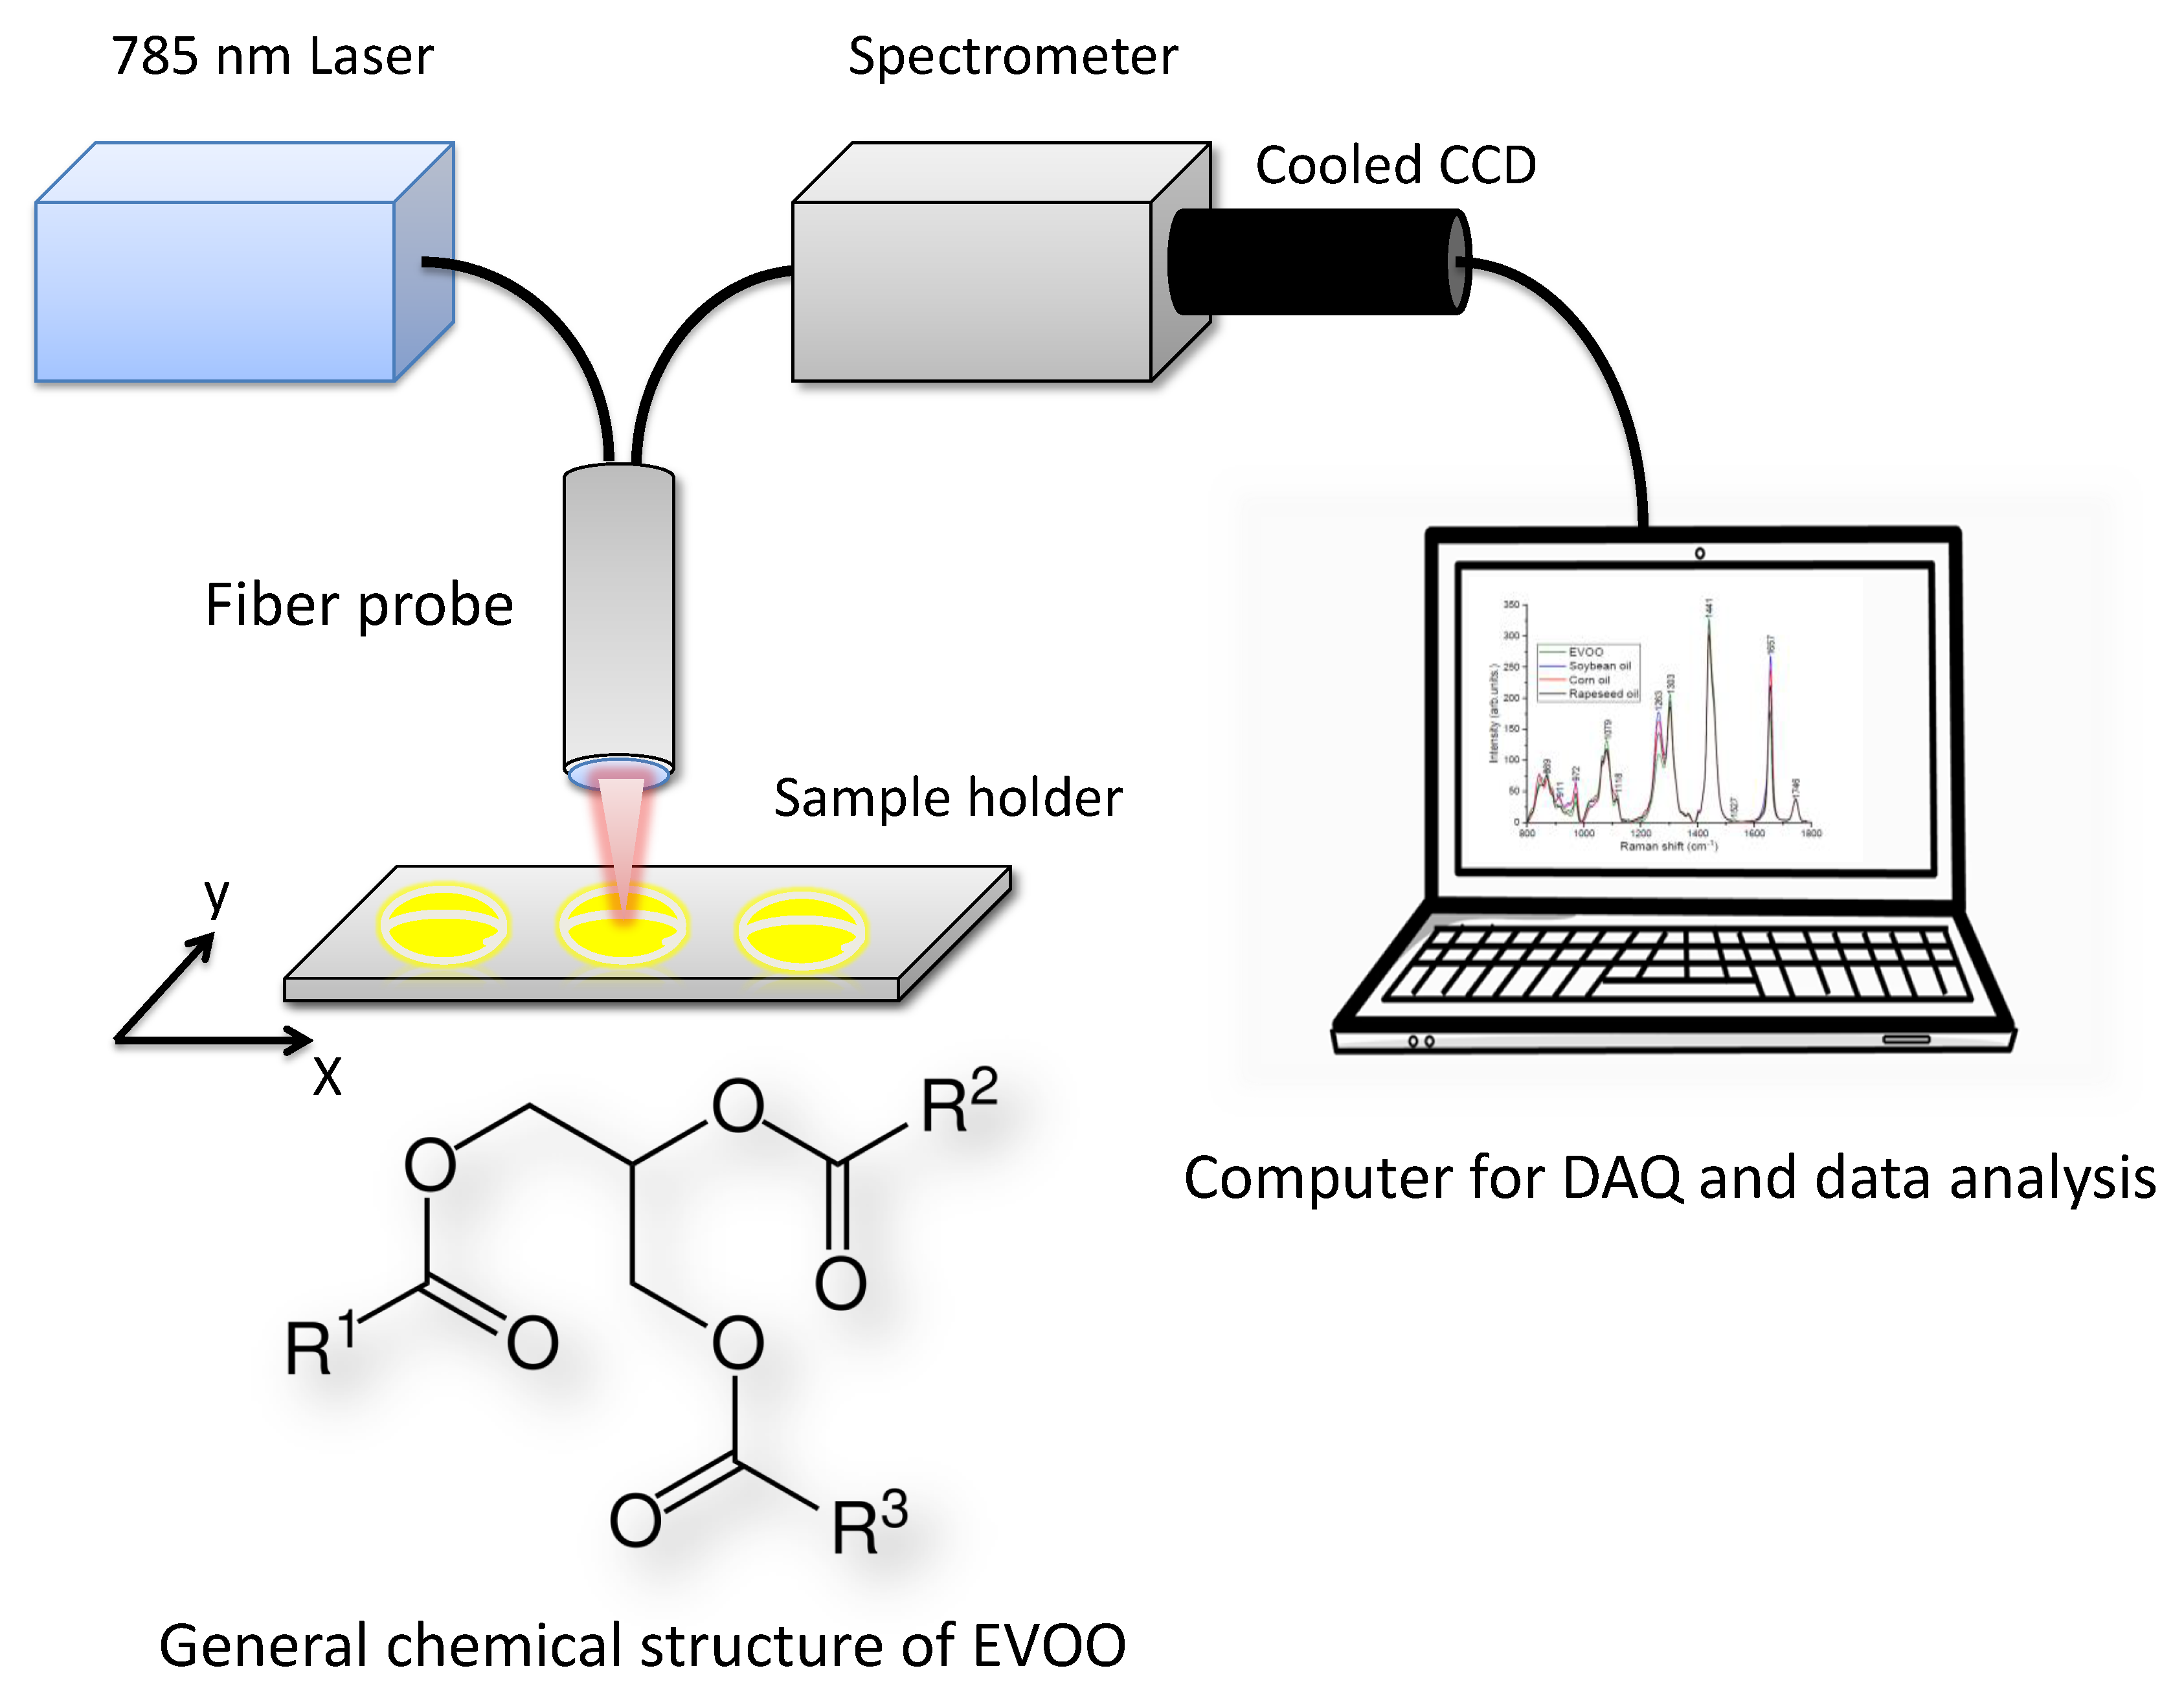
2.2. Data Collection

Fiber optic Raman spectroscopy (Figure 1) equipped with 785 nm laser (TA pro, Toptica, Germany), a bifurcated fiber-optic probe (N.A. = 0.22, InPhotonics, USA) with an integrated filtering and steering micro-optics, a spectrometer with an adjustable reflection type grating (iHR320, line density of 1200 L/mm, Horiba Scientific, UK), and a thermoelectrically cooled charge-coupled device (CCD) detector (Synapse, 1024 × 256 with each pixel size of 26 μ m, Horiba Scientific, UK) was utilized for measuring the oil samples. The laser light was focused onto 25 μ L of sample dropped in Al multi-well plate and multiple Raman measurements (n = 3) were taken on each sample. Each Raman spectrum was acquired in the fingerprint region from 800 to 1800 cm−1. The spectral resolution of the system is 1.7 cm−1. The Raman measurements on all mixtures were performed in a time span of two months with different power levels (80–150 mW) and integration times (10–30 s). Each spectrum is an average of 2 scans.

2.3. Data Analysis

The Raman spectra were smoothed using a Savitzky-Golay filter [28] and the baseline was subtracted to remove the fluorescence. As the spectral measurements were performed with different laser power levels and integration times, the spectra were mean centered for the inter-experiment variabilities and for the Raman features to obtain a good PLS model. As the nature of the adulterants in the sample mixtures were known, non-negative least squares fitting was used to estimate the relative concentration of EVOO, rapeseed, corn and soybean oil. The samples were randomly split into 80% for calibration (i.e., training) and 20% for the test set. PLS analysis together with 10-fold cross validation was used to build the calibration model on the binary, ternary, quaternary and combined (binary + ternary + quaternary) training dataset. The performance of the calibration model to quantify the purity of oil samples was assessed using the test set. All the above analyses were performed in the Python environment.

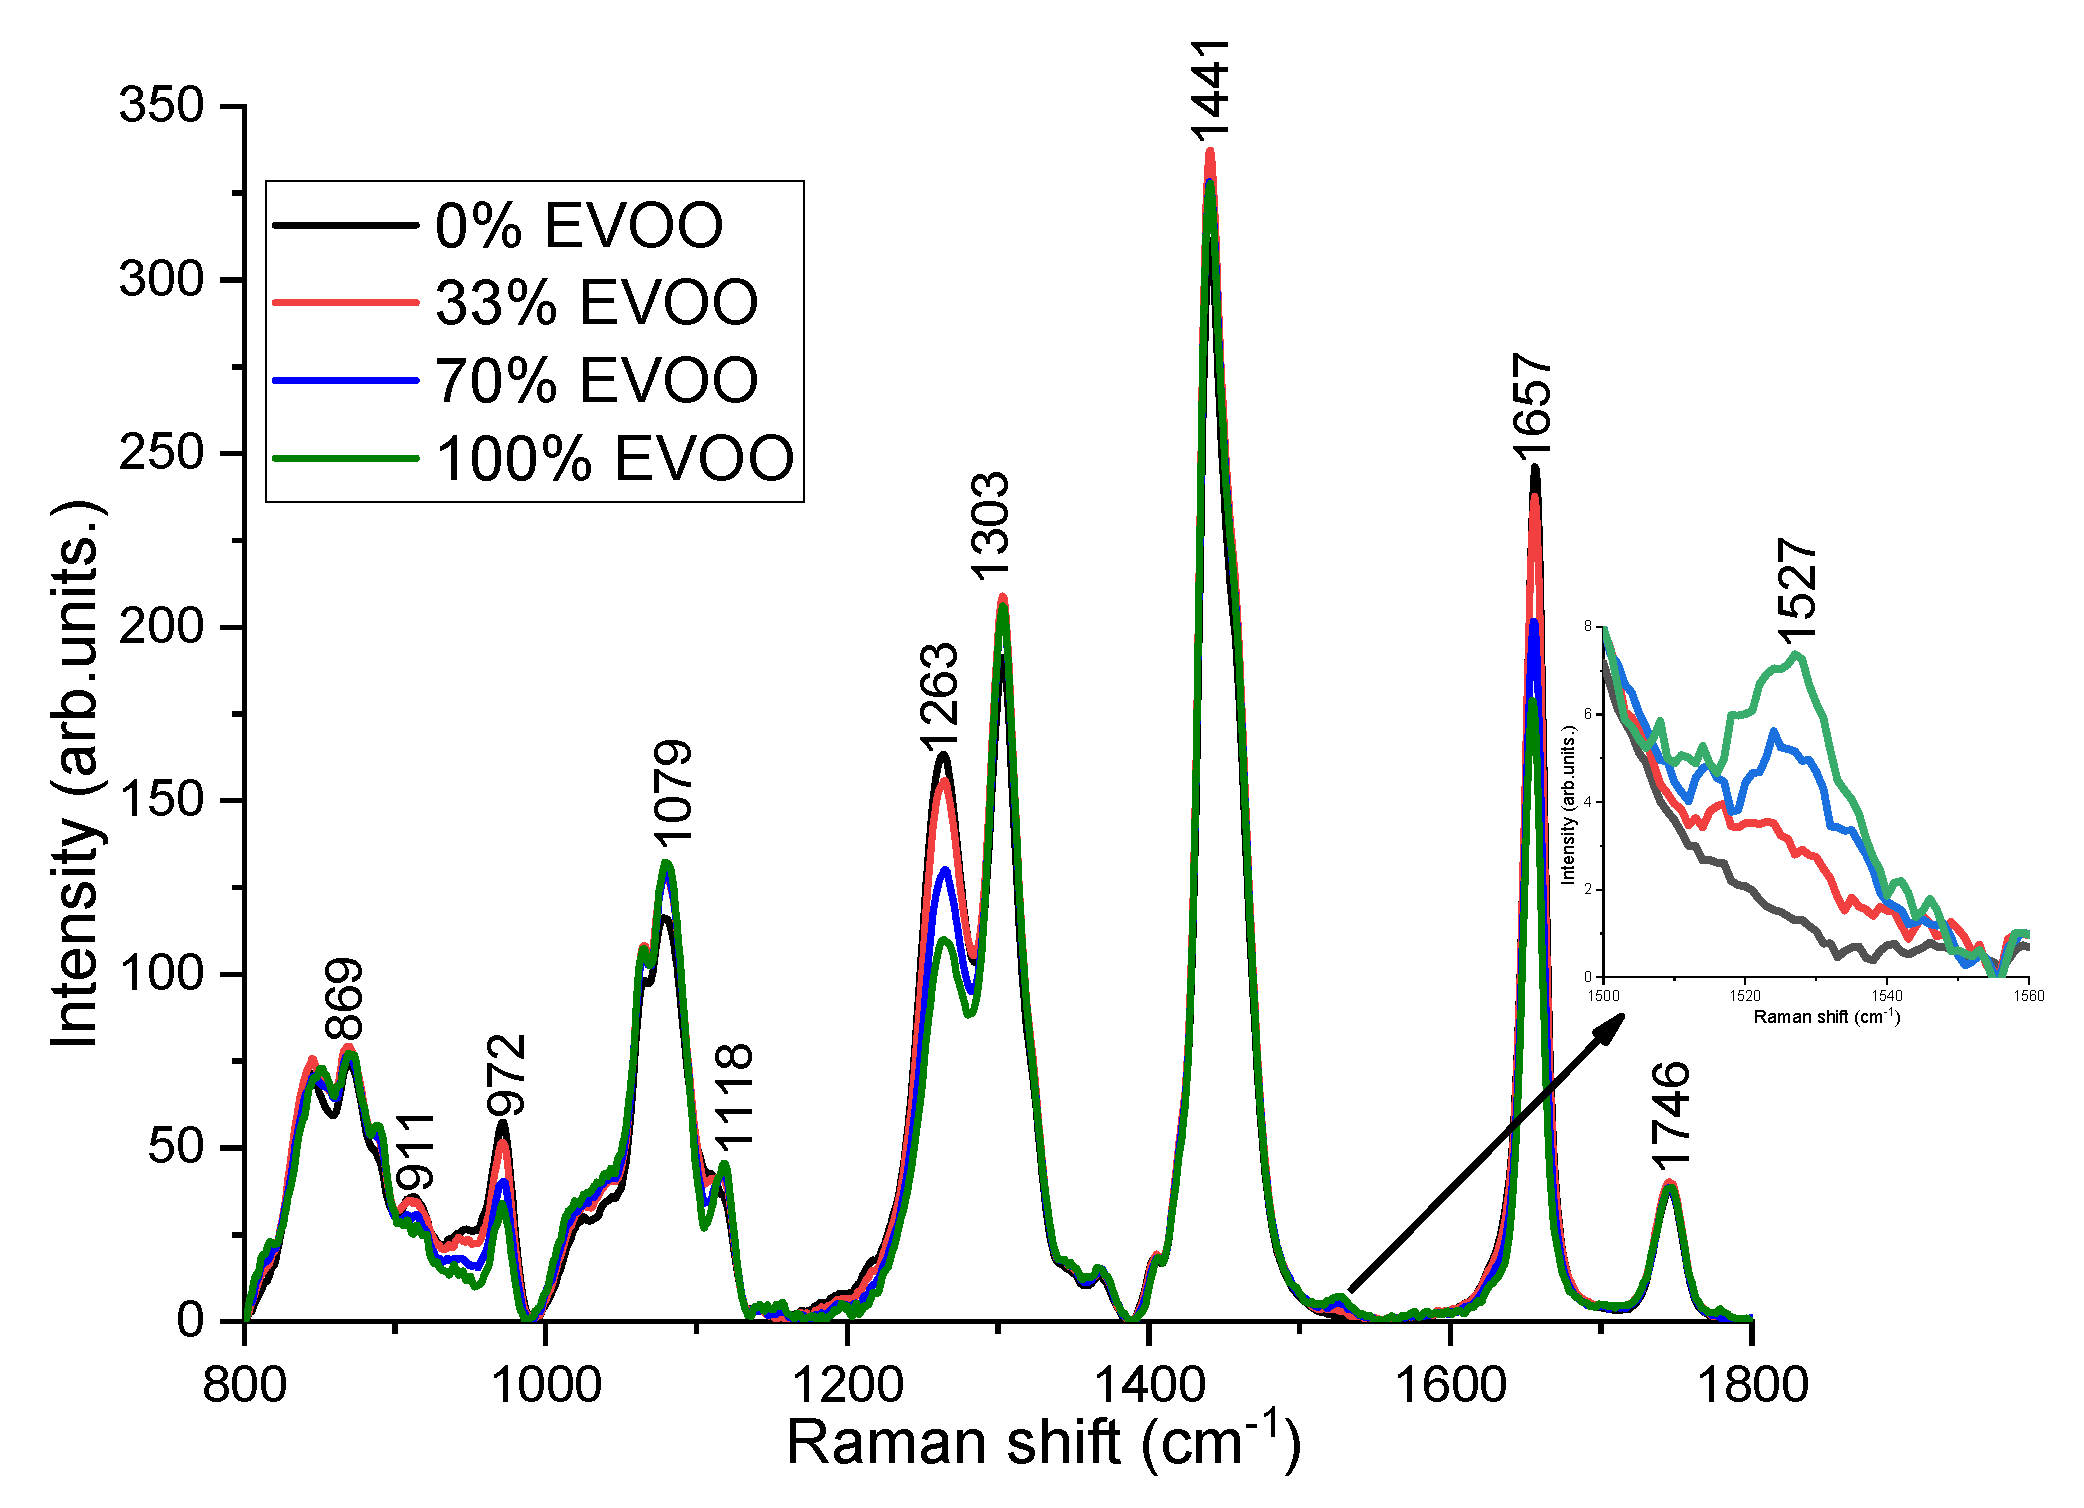
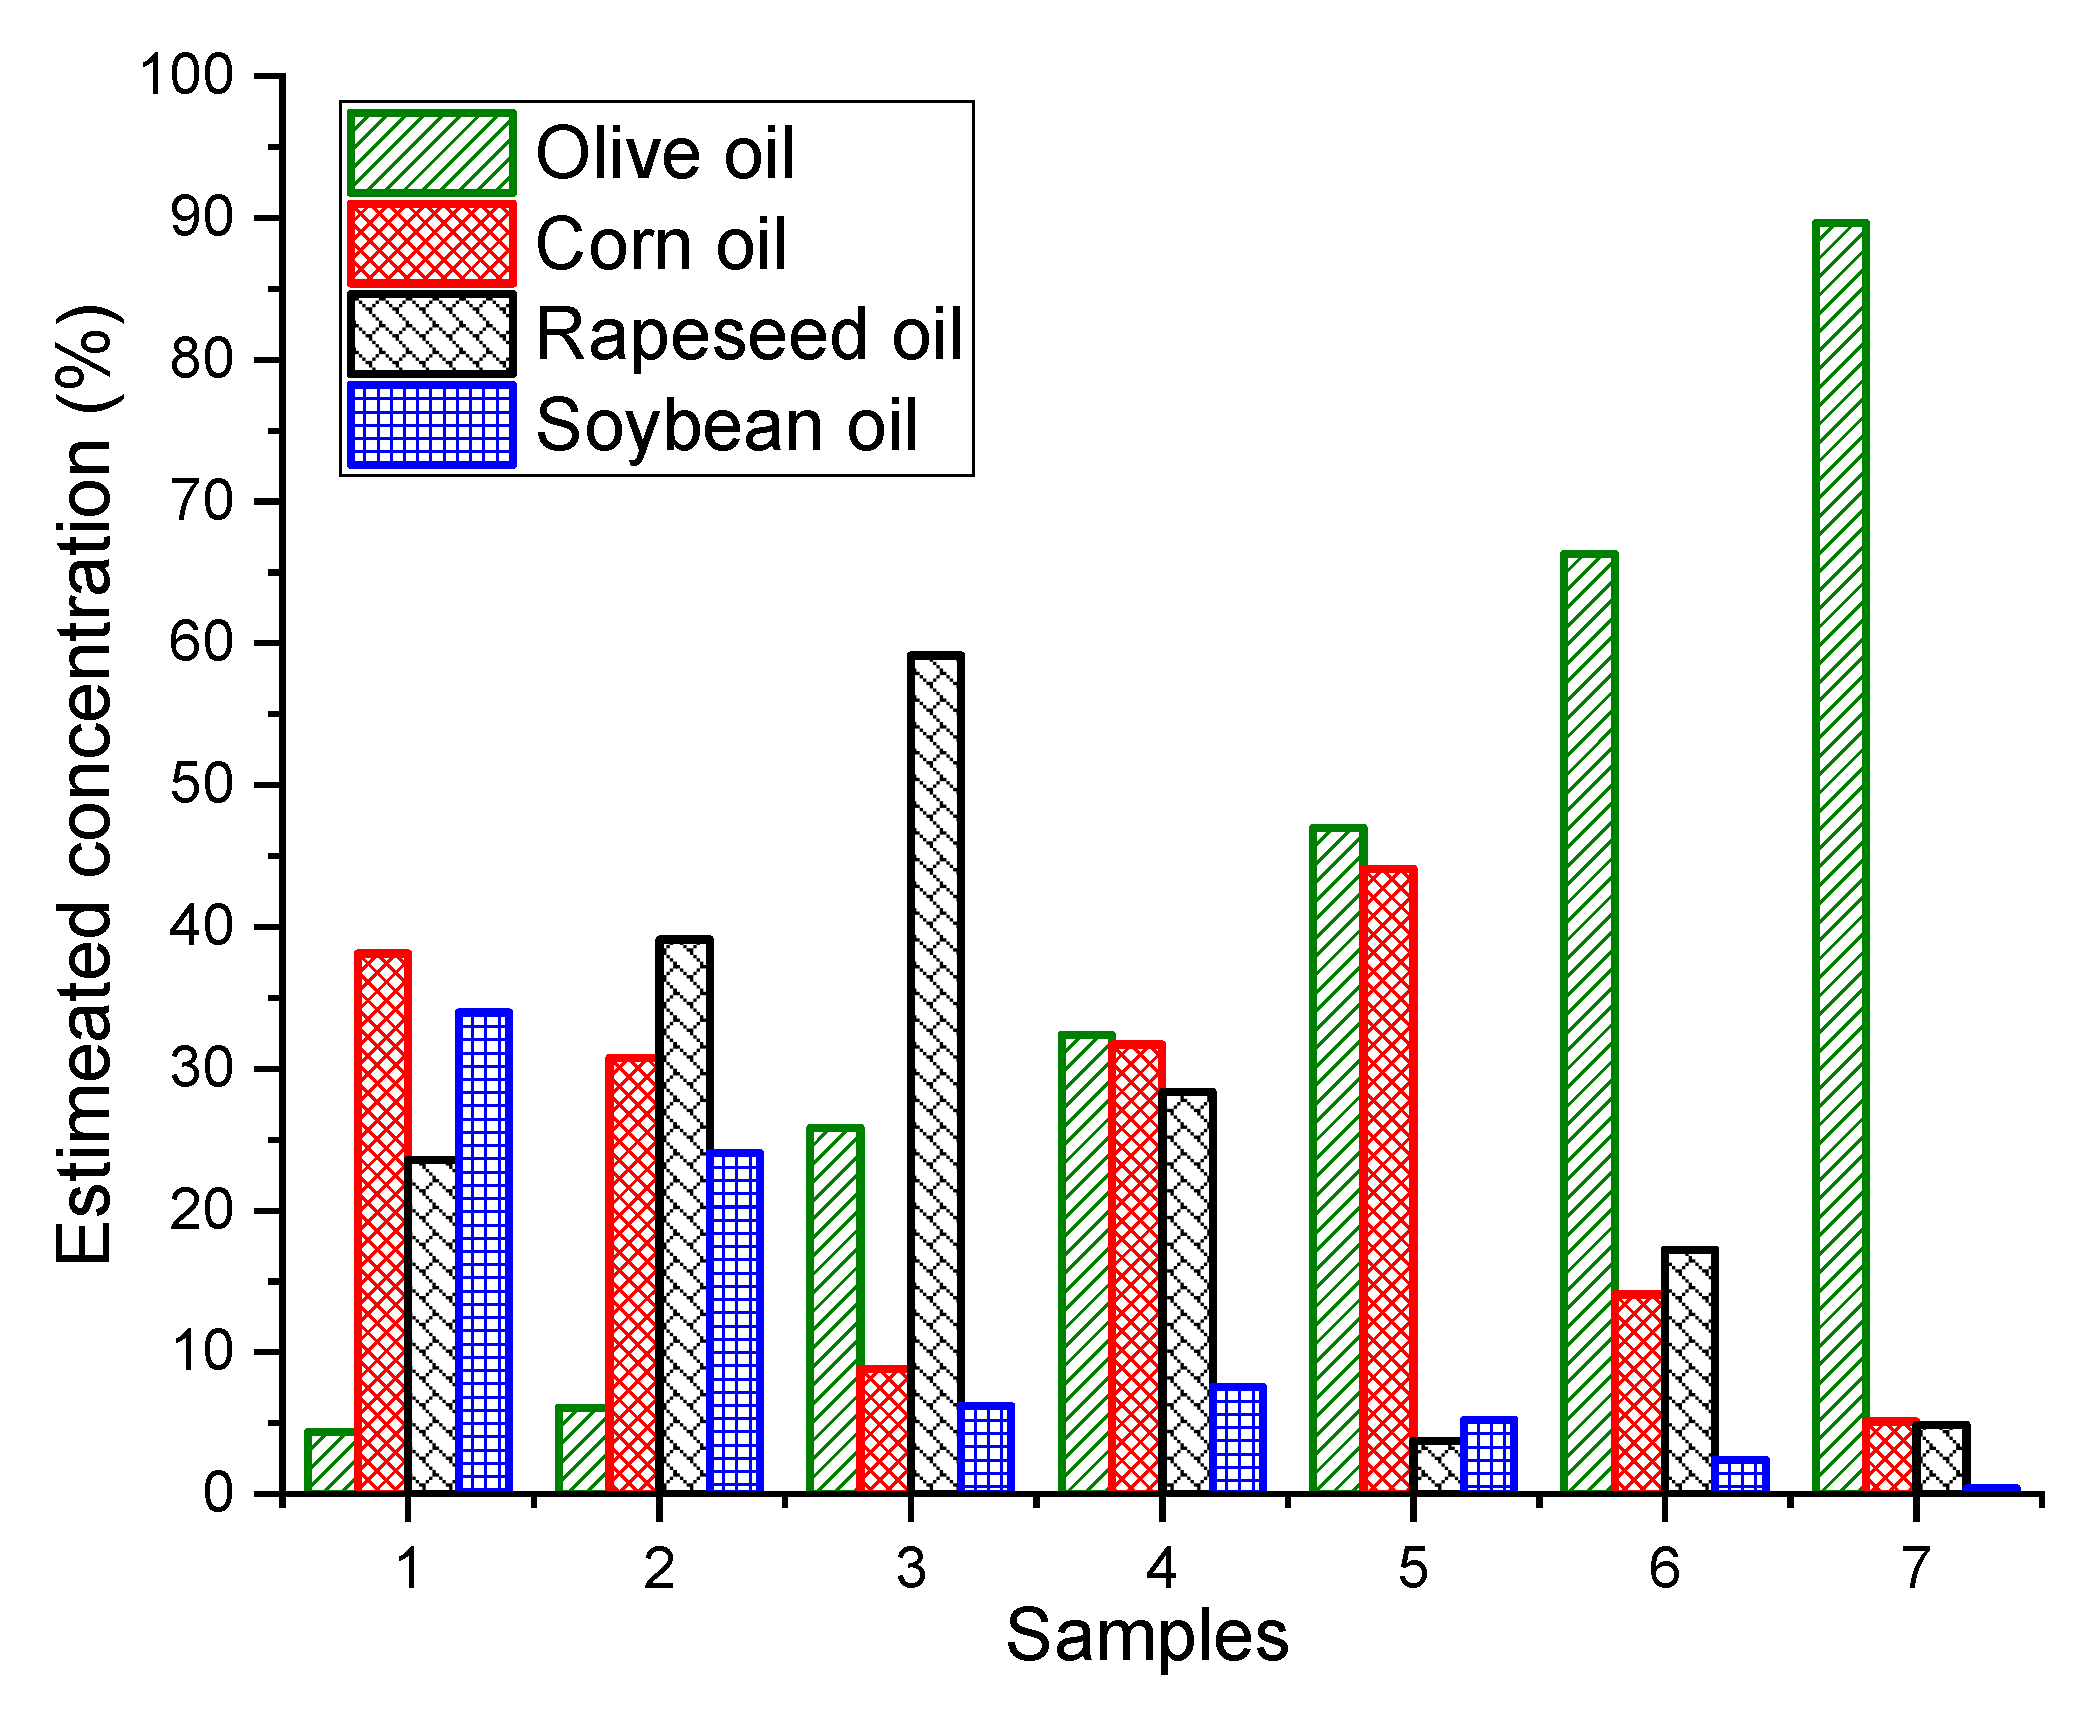
3. Results and Discussion

Raman spectra (n = 214) were acquired from 71 olive oil mixtures in the region 800–1800 cm−1 under 785 nm excitation. Thirty-three Raman spectra from 11 binary blends of EVOO and rapeseed oil, 48 Raman spectra from 16 ternary blends of EVOO, rapeseed oil and corn oil, and 133 spectra from 44 quaternary mixtures of EVOO, rapeseed oil, corn oil and soybean oil were recorded. From each sample, 3 spectra were taken at different position of the droplet. Figure 2 shows the typical Raman spectra measured from pure EVOO, rapeseed oil, corn oil and soybean oil. From Figure 2, it is very obvious that the characteristic Raman peak positions of different oils are similar due to the fact that they are essentially composed of similar components such as triglycerides, saturated and unsaturated fatty acids with straight aliphatic chains and predominantly with 16 or 18 number of carbon atoms in the chains [29]. The primary Raman peak positions and the respective vibrational modes of EVOO, rapeseed, corn and soybean oil are as follows (Figure 2): 869 cm−1 (C–C) stretching from the molecule –(CH2)n–, 972 cm−1 (C=C) bending from Trans RHC=CHR, 1079 cm−1 (C–C) stretching from –(CH2)n–, 1263 cm−1 in-plane =C–H) deformation from unconjugated cis (RHC=CHR), 1303 cm−1 (C–H) bending (twisting) from methylene(CH2), 1441 cm−1 (C–H) bending (scissoring) from methylene(CH2), 1527 cm−1 (C=C) stretching attributed to carotenoids, 1657 cm−1 (C=C) stretching from unsaturated banding(cis RHC=CHR), 1746 cm−1 (C=O) stretching from ester (RC=OOR) [6,8,17,19].
Despite the similar Raman peak positions observed for various oils, the differences can be noticed in their relative Raman peak intensities because each oil is characterized by its own specific fatty acids ratio content [29]. For instance, the fatty acids composition of the triglycerides in EVOO comprise 11% saturated fatty acids, around 80% monounsaturated fatty acids (twice the amount of oleic acid in comparison to other vegetable oils), and 9% polyunsaturated fatty acids (considerably less linoleic and linolenic acid in comparison to other vegetable oils) [7,13]. Hence, the Raman peak intensities at 972, 1263 and 1657 cm−1 corresponding to the degree of unsaturation (the number of C=C bonds) are weaker and the peaks (1303 and 1441 cm−1) related to saturated fatty acids (CH2) are higher in EVOO compared to cheaper oils [13,17,18,19]. EVOO and rapeseed oil has a feature at 1118 cm−1 (in-phase aliphatic all trans C–C stretch) [30], however, it has not been seen in corn and soybean oil. The distinct peak at 1527 cm−1 corresponds to carotenoids, has been noticed only in EVOO [6,31]. Carotenoid is a pigment in olive oil, which is responsible for the color of olive oil and an important feature for the quality of EVOO [32]. The C=O ester carbonyl band at 1746 cm−1 does not exhibit any changes. Soybean oil is the most different one from EVOO, showing the highest peak around 972, 1263, and 1657 cm−1. The rapeseed oil is closer to EVOO compared to corn and soybean oil. Figure 3 shows the Raman spectra acquired from different volume percentage of EVOO blended with rapeseed oil, soybean oil and corn oil. Although there are multiple adulterants, the characteristic peaks at 972, 1263, and 1657 cm−1 decrease with EVOO concentrations and the peaks at 1079, 1118, 1303, and 1527 cm−1 increase with the concentrations of EVOO (Figure 3).
As we know the nature of the adulterants, simple non-negative least squares fitting can be used to estimate the concentrations of EVOO and other adulterants in the oil mixtures. The extremely complex quaternary dataset (non-normalized) was taken as an example to build non-negative least squares model for predicting the concentrations of different oils in the mixture. The developed non-negative least squares model fit the dataset very well with small residuals (±5.000 arb.units). The concentrations of EVOO, rapeseed oil, corn oil and soybean oil were estimated with the root mean square errors of 3.8%, 6.5%, 5.2% and 6.9%, respectively (Figure 4). The estimated concentrations of four different oils for seven samples are shown in Figure 5 and their actual concentrations are given in Table 1 for reference.
In a real case scenario, there can be many adulterants in EVOO and the nature of the adulterants are unknown. Hence, it is easier to develop a single test that can estimate the purity of EVOO instead of determining what the adulterant is and its concentration. The PLS model along with 10-fold cross validation built on the binary, ternary, quaternary calibration datasets and the corresponding PLS regression coefficients are shown in Figure 6. The model identified the spectral changes around the major Raman peaks (844, 869, 972, 1023, 1263, 1303, 1441, 1527, 1635 and 1657 cm−1) due to the adulteration of EVOO (Figure 6).
The PLS model provided root mean square errors of 3.6%, 2.8%, and 4.3%, respectively, for the binary, ternary and quaternary calibration datasets. The robustness of developed PLS model was tested on the binary, ternary and quaternary test datasets and root mean square errors of 5.8%, 1.9%, and 6.0% are obtained to estimate the purity of spiked EVOO (Figure 7). We further developed a PLS model on the combined dataset (binary + ternary + quaternary) and the respective regression coefficient is also displayed in Figure 6. The purity of spiked EVOO samples has been estimated with the root mean square error of prediction 5.2% for the calibration dataset and 5.1% for the test set (Figure 7). The PLS model developed from the combined dataset can estimate the purity of samples in spite of them being spiked with either one or more cheaper additives and being measured with different measurement parameters (power levels and acquisition times), and sample conditions (binary, ternary, quaternary oil mixtures). The amount of impurity or adulteration can also be calculated from the purity. As the purity or impurity of spiked EVOO with one or more adulterants can be estimated using a single PLS model, this study enables Raman spectroscopy to screen the quality of oil labelled as EVOO in the market without having prior knowledge of the adulterants. The ways food can be made fraudulent is in principle infinite, however, adulteration with cheap oils like corn, rapeseed or soybean oil is known to have been used [6,8,13,17,18]. The detection limit of adulteration was estimated as 13% for EVOO–rapeseed binary mixture, as the rapeseed oil is much closer to EVOO compared to other oils used in this study. The demonstrated detection limit of adulteration using our compact lab system is sufficient and robust for commercially effective testing of olive oil adulteration. As a proof of concept, in this study, we used single batch of commercial oil bottles for estimating the purity of EVOO. The method can easily be adapted for purity analysis of clean EVOO obtained at the EVOO production site.

4. Conclusions

Raman spectra were acquired from binary, ternary and quaternary mixture of oil samples. Non-negative least squares was used to determine the relative concentration of EVOO and other cheaper additives. The purity of EVOO was estimated from EVOO spiked with one or more adulterants using Raman spectroscopy in combination with PLS. The potential of Raman spectroscopy for determining the purity of EVOO was successfully demonstrated on the complex scenario where the spectral library was obtained with different measurement parameters and sample conditions (binary + ternary + quaternary). The chemical composition of EVOO not only varies by cultivar, region, altitude, time of harvest, soil conditions, and extraction process, but also because of ageing and oxidation associated with storage conditions such as exposure to oxygen, light, and temperature. In future studies of EVOO, we plan to incorporate all the potential variations in our chemometrics model to determine the origin and the quality of EVOO. We foresee that the developed Raman sensor with PLS analysis might close the gap for the increasing demand to develop a quick, sensitive, portable, easy-to-use and cost-effective online analytical approach for quantifying either the purity or adulteration of EVOO and identifying the added adulterant. Note that the current Raman setup can easily be packed with the software which can control the entire set up and contains the calibration models to determine the quality of not only olive oil, but also other types of food real-time in the field.

Author Contributions

Formal analysis, S.D.; Funding acquisition, J.C.P. and M.L.; Investigation, S.D.; Methodology, S.D.; Project administration, J.C.P. and M.L.; Visualization, S.D., J.C.P. and M.L.; Writing—original draft, S.D.; Writing—review and editing, J.C.P. and M.L.

Funding

This research was funded by EUREKA Eurostars (E!10132-PASOCA) and the Danish Agency for Institutions and Educational Grants.

Conflicts of Interest

There are no conflicts of interest.

Abbreviations

The following abbreviations are used in this manuscript:
EVOOExtra Virgin Olive Oil
PLSPartial Least Squares
CCDCharge-Coupled Device

References

  1. Ben-Ayed, R.; Kamoun-Grati, N.; Rebai, A. An overview of the authentication of olive tree and oil. Compr. Rev. Food Sci. Food Saf. 2013, 12, 218–227. [Google Scholar] [CrossRef]
  2. OliveOilTimes. Five Years Later, UC Davis Report Still Sends Shockwaves. 2015. Available online: https://www.oliveoiltimes.com/olive-oil-making-and-milling/five-years-later-uc-davis-report-still-sends-shockwaves/48223 (accessed on 6 June 2019).
  3. Moore, J.C.; Spink, J.; Lipp, M. Development and Application of a Database of Food Ingredient Fraud and Economically Motivated Adulteration from 1980 to 2010. J. Food Sci. 2012, 77, R118–R126. [Google Scholar] [CrossRef] [PubMed]
  4. Gamazo-Vázquez, J.; Garcìa-Falcón, M.; Simal-Gándara, J. Control of contamination of olive oil by sunflower seed oil in bottling plants by GC-MS of fatty acid methyl esters. Food Control 2003, 14, 463–467. [Google Scholar] [CrossRef]
  5. Saba, A.; Mazzini, F.; Raffaelli, A.; Mattei, A.; Salvadori, P. Identification of 9 (E), 11 (E)-18: 2 fatty acid methyl ester at trace level in thermal stressed olive oils by GC coupled to acetonitrile CI-MS and CI-MS/MS, a possible marker for adulteration by addition of deodorized olive oil. J. Agric. Food Chem. 2005, 53, 4867–4872. [Google Scholar] [CrossRef] [PubMed]
  6. El-Abassy, R.M.; Donfack, P.; Materny, A. Visible Raman spectroscopy for the discrimination of olive oils from different vegetable oils and the detection of adulteration. J. Raman Spectrosc. 2009, 40, 1284–1289. [Google Scholar] [CrossRef]
  7. Carranco, N.; Farrés-Cebrián, M.; Saurina, J.; Núñez, O. Authentication and quantitation of fraud in extra virgin olive oils based on HPLC-UV fingerprinting and multivariate calibration. Foods 2018, 7, 44. [Google Scholar] [CrossRef]
  8. Dong, W.; Zhang, Y.; Zhang, B.; Wang, X. Quantitative analysis of adulteration of extra virgin olive oil using Raman spectroscopy improved by Bayesian framework least squares support vector machines. Anal. Methods 2012, 4, 2772–2777. [Google Scholar] [CrossRef]
  9. Mendes, T.O.; da Rocha, R.A.; Porto, B.L.S.; de Oliveira, M.A.L.; dos Anjos, V.d.C.; Bell, M.J.V. Quantification of extra-virgin olive oil adulteration with soybean oil: A comparative study of NIR, MIR, and Raman spectroscopy associated with chemometric approaches. Food Anal. Methods 2015, 8, 2339–2346. [Google Scholar] [CrossRef]
  10. Rodriguez-Saona, L.; Giusti, M.; Shotts, M. 4-Advances in Infrared Spectroscopy for Food Authenticity Testing. In Advances in Food Authenticity Testing; Downey, G., Ed.; Woodhead Publishing Series in Food Science, Technology and Nutrition; Woodhead Publishing: Cambridge, UK, 2016; pp. 71–116. [Google Scholar]
  11. Jabeur, H.; Zribi, A.; Makni, J.; Rebai, A.; Abdelhedi, R.; Bouaziz, M. Detection of chemlali extra-virgin olive oil adulteration mixed with soybean oil, corn oil, and sunflower oil by using GC and HPLC. J. Agric. Food Chem. 2014, 62, 4893–4904. [Google Scholar] [CrossRef]
  12. Fragaki, G.; Spyros, A.; Siragakis, G.; Salivaras, E.; Dais, P. Detection of extra virgin olive oil adulteration with lampante olive oil and refined olive oil using nuclear magnetic resonance spectroscopy and multivariate statistical analysis. J. Agric. Food Chem. 2005, 53, 2810–2816. [Google Scholar] [CrossRef]
  13. Giubileo, G.; Puiu, A.; Botti, S.; Tarquini, G.; Nunziante Cesaro, S. Olive Oil Adulteration Sensing by FTIR and Raman Spectroscopy; ENEA: Rome, Italy, 2015. [Google Scholar]
  14. Amelio, M. The official method for olive oil sensory evaluation: An expository revision of certain sections of the method and a viable means for confirming the attribute intensities. Trends Food Sci. Technol. 2016, 47, 64–68. [Google Scholar] [CrossRef]
  15. Andrikopoulos, N.; Giannakis, I.; Tzamtzis, V. Analysis of olive oil and seed oil triglycerides by capillary gas chromatography as a tool for the detection of the adulteration of olive oil. J. Chromatogr. Sci. 2001, 39, 137–145. [Google Scholar] [CrossRef] [PubMed]
  16. Aparicio, R.; Aparicio-Ruíz, R. Authentication of vegetable oils by chromatographic techniques. J. Chromatogr. A 2000, 881, 93–104. [Google Scholar] [CrossRef]
  17. Zou, M.Q.; Zhang, X.F.; Qi, X.H.; Ma, H.L.; Dong, Y.; Liu, C.W.; Guo, X.; Wang, H. Rapid authentication of olive oil adulteration by Raman spectrometry. J. Agric. Food Chem. 2009, 57, 6001–6006. [Google Scholar] [CrossRef] [PubMed]
  18. Zhang, X.F.; Zou, M.Q.; Qi, X.H.; Liu, F.; Zhang, C.; Yin, F. Quantitative detection of adulterated olive oil by Raman spectroscopy and chemometrics. J. Raman Spectrosc. 2011, 42, 1784–1788. [Google Scholar] [CrossRef]
  19. Li, Y.; Fang, T.; Zhu, S.; Huang, F.; Chen, Z.; Wang, Y. Detection of olive oil adulteration with waste cooking oil via Raman spectroscopy combined with iPLS and SiPLS. Spectrochim. Acta Part A Mol. Biomol. Spectrosc. 2018, 189, 37–43. [Google Scholar] [CrossRef] [PubMed]
  20. López-Díez, E.C.; Bianchi, G.; Goodacre, R. Rapid quantitative assessment of the adulteration of virgin olive oils with hazelnut oils using Raman spectroscopy and chemometrics. J. Agric. Food Chem. 2003, 51, 6145–6150. [Google Scholar] [CrossRef] [PubMed]
  21. Sun, X.; Lin, W.; Li, X.; Shen, Q.; Luo, H. Detection and quantification of extra virgin olive oil adulteration with edible oils by FT-IR spectroscopy and chemometrics. Anal. Methods 2015, 7, 3939–3945. [Google Scholar] [CrossRef]
  22. Öztürk, B.; Yalçin, A.; Özdemir, D. Determination of olive oil adulteration with vegetable oils by near infrared spectroscopy coupled with multivariate calibration. J. Near Infrared Spectrosc. 2010, 18, 191–201. [Google Scholar] [CrossRef]
  23. Downey, G.; McIntyre, P.; Davies, A.N. Detecting and quantifying sunflower oil adulteration in extra virgin olive oils from the eastern mediterranean by visible and near-infrared spectroscopy. J. Agric. Food Chem. 2002, 50, 5520–5525. [Google Scholar] [CrossRef]
  24. Fujiwara, M.; Hamaguchi, H.; Tasumi, M. Measurements of spontaneous Raman scattering with Nd:YAG 1064-nm Laser Light. Appl. Spectrosc. 1986, 40, 137–139. [Google Scholar] [CrossRef]
  25. Westergaard, P.G.; Lassen, M.; Petersen, J.C. Differential high-resolution stimulated CW Raman spectroscopy of hydrogen in a hollow-core fiber. Opt. Express 2015, 23, 16320–16328. [Google Scholar] [CrossRef] [PubMed]
  26. Kerdoncuff, H.; Pollard, M.R.; Westergaard, P.G.; Petersen, J.C.; Lassen, M. Compact and versatile laser system for polarization-sensitive stimulated Raman spectroscopy. Opt. Express 2017, 25, 5618–5625. [Google Scholar] [CrossRef] [PubMed]
  27. Duraipandian, S.; Knopp, M.M.; Pollard, M.R.; Kerdoncuff, H.; Petersen, J.C.; Müllertz, A. A fast and novel internal calibration method for quantitative Raman measurements on aqueous solutions. Anal. Methods 2018, 10, 3589–3593. [Google Scholar] [CrossRef]
  28. Savitzky, A.; Golay, M.J. Smoothing and differentiation of data by simplified least squares procedures. Anal. Chem. 1964, 36, 1627–1639. [Google Scholar] [CrossRef]
  29. Vaskova, H.; Buckova, M. Measuring and identification of oils. In Proceedings of the 18th International Conference on Circuits, Systems, Communications and Computers (CSCC 2014), Santorini Island, Greece, 17–21 July 2014. [Google Scholar]
  30. Karacaglar, N.N.Y.; Bulat, T.; Boyaci, I.H.; Topcu, A. Raman spectroscopy coupled with chemometric methods for the discrimination of foreign fats and oils in cream and yogurt. J. Food Drug Anal. 2018. [Google Scholar] [CrossRef]
  31. Jiménez-Sanchidrián, C.; Ruiz, J.R. Use of Raman spectroscopy for analyzing edible vegetable oils. Appl. Spectrosc. Rev. 2016, 51, 417–430. [Google Scholar] [CrossRef]
  32. Lazzerini, C.; Domenici, V. Pigments in extra-virgin olive oils produced in Tuscany (Italy) in different years. Foods 2017, 6, 25. [Google Scholar] [CrossRef]
Figure 1. Fiber optic Raman spectroscopy set up. The general chemical structure of extra virgin olive oil (EVOO), where R 1 , R 2 and R 3 are alkyl groups (approx. 20%) or alkenyl groups (approx. 80%). (DAQ-DataAcquisition).
Applsci 09 02433 g001
Figure 2. Pure Raman spectra of EVOO, soybean oil, corn oil and rapeseed oil.
Applsci 09 02433 g002
Figure 3. Raman spectra of EVOO adulterated with rapeseed oil, soybean oil and corn oil with different volume percentage. Inlet: The characteristic peak of EVOO at 1527 cm−1 is enlarged for better visualization.
Applsci 09 02433 g003
Figure 4. Actual concentration vs. estimated concentration of extra virgin olive oil (EVOO), corn oil, rapeseed oil and soybean oil calculated from quaternary mixtures of EVOO, corn, rapeseed and soybean oil (v/v%) using non-negative least squares. The solid line represents the zero-error curve.
Applsci 09 02433 g004
Figure 5. Bar plot of estimated concentrations of extra virgin olive oil (EVOO), corn, rapeseed and soybean oil resulting from non-negative least squares of quaternary mixtures shown for seven samples as an example.
Applsci 09 02433 g005
Figure 6. Regression coefficients of PLS models developed from binary, ternary, quaternary and combined (binary + ternary + quaternary) dataset. The curves are scaled for better visualization.
Applsci 09 02433 g006
Figure 7. Actual concentration vs. estimated concentration of extra virgin olive oil (EVOO) calculated from binary, ternary, quaternary and combined (binary + ternary + quaternary) dataset using partial least squares (PLS) analysis. The solid line represents the zero-error curve.
Applsci 09 02433 g007
Table 1. The actual concentrations of EVOO, corn, rapeseed and soybean oil used in the bar plot (Figure 5).
Sample NoEVOO (%)Corn (%)Rapeseed (%)Soybean (%)
1033.3333.3333.33
210303030
330105010
440202020
5505000
670101010
7900010

