Article

Competition Among the World’s Main Technological Powers to Develop IPs: Cross-National Longitudinal Patentography Over a 9-Year Time Span

by
Cheng-Chien Hsu
1 and
Zheng-Yun Zhuang
2,*
1
Taiwan Data Science Co. Ltd., Taipei 104, Taiwan
2
Department of Civil Engineering, National Kaohsiung University of Science and Technology, Kaohsiung 807, Taiwan
*
Author to whom correspondence should be addressed.
Appl. Sci. 2019, 9(12), 2432; https://doi.org/10.3390/app9122432
Submission received: 22 April 2019 / Revised: 31 May 2019 / Accepted: 5 June 2019 / Published: 14 June 2019
(This article belongs to the Special Issue Intelligent System Innovation)

Abstract

:
Relatively few studies have focused on systematically mining the patent databases of different countries. This study mines the databases of the main ‘technological powers’ using several methods. By using descriptive statistical methods, the study yields key insights regarding patenting activities affecting the succession and ‘crowding out’ of technologies, the ‘hottest technologies’ and the patent application strategies in these countries. The spectrums of technological strength in these countries are further analysed with Principal Component Analysis (PCA), as two principal components are sufficient to resolve over 92% of the total variance. The US, EU and China are the economies that all technological powers may regard as important; similarities in the application strategies used in these countries are thus further investigated. Another extensive analysis utilising K-means clustering is also performed. Except for the optimal number for patent clustering, surprisingly, the top 10 ‘most important technologies’ are identical to the top 10 hottest ones that were previously identified. The knowledge and insights gained from this study are valuable not only for technological development policy makers, but also for business decision makers seeking suitable markets and areas to enter and invest in. Some data visualization and analysis methods are applied for the first time to this knowledge discovery problem.

Graphical Abstract

1. Introduction

From a systemic perspective, the intellectual property (IP) system is an important subsystem of the entire economy. In this subsystem, patenting (that is, the making of patent applications) is an important activity which can be used to measure a country’s development in terms of technological innovations. The chance to protect a given novel product (e.g., design, innovation, or manufacturing process) can be lost if it is made public in, or shipped to, a country without the relevant patents having been granted by the destination country’s patent office. As such, the company producing a given product tends to apply for a patent for said product before introducing it to a given market (country), even though these patenting activities, without exception, are expensive and time-consuming for both the initial application and patent maintenance procedure.
As patents for ‘core competitive technologies’ are usually closely related to the industrial development of a country, they can be viewed as an index by which to measure the industrial development and core competiveness of different countries. In addition, the analysis of patenting activities can reveal not only the core business ideas, but also the actual strategic intentions of a given company. Moreover, the value of any knowledge discovered through such analysis would be significant, especially when the company in question is both large and a leader in its field.
Since the patent database of a country typically includes not only the patent claims themselves but also information regarding the status of those claims and related activities (even for patent applications that are still being processed), the value of these databases is undeniable for researchers wishing to perform cross-national analyses. According to a survey conducted by the World Intellectual Property Organization (WIPO), approximately 90%–95% of the inventions produced around the world can be found among the patent databases of all the countries throughout the world. This is also true at the company level, and is thus an important fact when it comes to analysing the leading companies within a single industry.
Relatedly, mining the patent databases of leading high-tech countries is worthwhile not only because they are the centralised repositories for information regarding key innovations, but also because of the quality of the data they contain (see Appendix A for more detail). On one hand, a patent database is usually organised formally by a country’s government (with a strict and standardized review process and the guaranteed regulatory enforcement). On the other hand, in light of associated costs and development strategies, a company will be serious (and parsimonious) in applying for patents. In other words, patent databases are both well-organised and of high quality. These characteristics make them worthy of exploration via data mining methods in light of the potential knowledge they might reveal.
For a company facing competition, it is sometimes more critical (or at least of equal importance) for it to know what other similar companies are doing than it is to know what it is doing itself. However, from a broader perspective, this also holds for a country when each country’s patent database is treated (and analysed) as a whole. As such, when the ‘granularity’ used in viewing patent data is set at the ‘country level’, the current industrial trends of an entire country, as well as the trends of competing countries, can be analysed simultaneously. By altering such granularity in other ways, the crowding-out effects in a given domestic market can also be observed. In this way, the relative technological strength of a country can be analysed, as can the competition among other countries within that country’s economy (with the economy of single country being referred to hereinafter as a ‘market’).
The notions about the ‘industrial trends’ given above should satisfy the core interests of government policy makers and company decision makers. However, they should also provide valuable information for ‘investors’ (a term which can be defined generally to include a company’s top management, pure investors, or even a company’s founders). Such investors are usually the ones who decide which markets and industries to enter and invest in. However, the viewpoint of investors is typically missing from the existing literature.
Recall that the logistic curve of the initial growth model was first proposed by Verhulst in 1838. Pearl then proposed the popular S-shaped model (i.e., the Pearl growth curve of technology forecasting) [1] to describe the different stages of technology development [2], the general form of which is as follows:
y ( t ) = L ( 1 + a e b t )
where y(t) is a predictive function for the growth in terms of a time value t; L is the growth limit; and a and b are the model parameters to be determined after the input data is provided, with a controlling the position of the curve and b controlling the shape of the curve.
Regardless of the values of a and b, within the universal interval t = ( , ) , there always exists an ‘inflection point’ at t = ln ( a ) / b or, alternatively, at y = L / 2 . Prior to this point, the technology is in its ‘development stage’ and ‘growth stage’. Given that when using this inflection point as a pivot, such a curve is roughly symmetrical (as shown in Figure 1), the later stages after this point can be viewed as, respectively, the ‘succession’ and ‘maturity’ stages of the given technology.
A related argument is that if an ‘investor’ can utilize the patent databases and foresee the development and growth stages of some key, or at least focused, technologies before specific events occur throughout the worldwide knowledge-based economy, then that investor will have a fair chance of applying the relevant resources and obtaining extra profits from the resulting ‘potential competitive advantages’, in addition to those from routine ‘sustainable competitive advantages’ (SCA). When technological trends are accurately forecasted, given investors (such as the top management of a company or its founders) may be better enabled to modify a company’s R&D strategy in an appropriate manner. When such information is available, one can consider the growth potential of each technology, as well as the question ‘What if I were making this?’ This inferential process can thereby result in a set of new technologies that are then developed in the near future, and such knowledge is not only referential but also beneficial for the decision-makers (DMs). That is, it provides them with valuable assistance in making the relevant product development decisions. For more detail, see the extensive discussions in Appendix B.
In addition to the industrial trends mentioned above, the inherent industrial structure of each country and the related underlying knowledge can also be analysed and revealed. For example, it is generally well known that IC design for wireless communications is a specialty of the US, whereas wafer foundry is a specialty of Taiwan. As such, the foundry companies in Taiwan, such as TSMC (Taiwan Semiconductor Manufacturing Company, Ltd.), are engaged in the ‘co-development’ of products with wireless communications companies, e.g., QualComm, in the US. Therefore, their main patenting categories are supposed to be ‘correlated’ because of these co-development efforts. In contrast to these overlapping specialties, DRAM (dynamic random-access memory) manufacturing is one of South Korea’s fortes. So, for the IC (integrated circuit) design industry in the US, expending any research effort on the co-development of DRAM technologies would be regarded as ineffective as there are no strong co-development relationships between these two countries. Instead, a strategic alliance with Samsung or SK Hynix on the other side of Pacific Ocean is required. In other words, their relative upstream/downstream positions in the supply chain might determine the lack of overlap in their DRAM-relevant patents (or at least result in them not being that correlated because co-development activities are seldom required). If so, such information would be extremely valuable for the high-tech companies in these countries in terms of helping them to make decisions regarding the initiation of relevant patenting activities. However, in spite of the fact that the above inferences are interesting (e.g., in terms of answering how one country interacts with another in a given technological domain), they are merely plausible without being backed by specific evidence. Relevant clues must thus be sought from the patent databases of the different countries. This is the first main objective of this study.
Having been constrained by limited software/hardware capabilities and a lack of new requirements driven by new business applications, previous studies of patents usually followed the paradigm of pre-processing the data, conducting some straightforward analyses (e.g., descriptive statistical analyses) and then presenting the results to their audiences (e.g., companies) through the use of common tabularisation and charting techniques. Many such studies fell short, however, of providing a thorough analysis through the use of modelling and emerging visualisation techniques in conjunction with a comprehensible discussion. In addition, relatively few studies have supported, or at least provided a clear link to, business decisions in practice. To remedy these shortcomings, this study applies contemporary data-mining methods in order to reveal more relevant knowledge regarding matters of interest that are new to us. This is the second main objective of this study.
Motivated by the increasing popularity of, and emerging developments in, relevant big data and AI techniques, another main objective of this work is to scrutinize the effectiveness of these methods for patent data-mining in order to obtain information which facilitates investment decisions or the policy-making process. Mining the patent databases using these methods also widens the utilisation of these databases insofar as it allows some new types of applications to be performed. In this sense, this study extends the use of data science methods to the patent databases, and the application of these methods should be novel in the context of patent data-mining. This is the third main objective of this study.
With a focus on these main objectives, the next section provides a review of the relevant literature. Then, Section 3 first analyses the patenting activities among the leading high-tech countries overall during the 2007–2015 period and identifies the global technological trends in that period by exploring their focused ‘hottest technologies’ in terms of the IPC (International Patent Classification) codes. The significant ‘total correlation matrix’ which shows how a country’s pattern of patenting in the high-tech industry is related to another country’s pattern of patenting in that industry is also presented in that section. In Section 4, a PCA-based multivariate analysis is presented, followed by several inferences of fact regarding the overall picture of the industrial trends. The ‘most influential investment spots’ (i.e., the most important technologies) are further visualised, and, through ‘angular analysis’, the competitive relationships among the technological powers are investigated and explained. Finally, by clustering the IPC indices using the K-means technique, the set of ‘most important technologies’, which totally concurs with the previously identified set of top ten ‘hottest technologies’, is also identified. The concurrence of these sets is surprising but meaningful, because the two analytical perspectives effectively cross-validate the results of one another. Section 5 concludes the study.

2. A Review of the Methods

This section begins with a review of the initial patent analysis system proposed by CHI Research, Inc. for the utilisation of direct and indirect indices, followed by a summary of the systematic patent indicator framework proposed by Ernst (Section 2.1 and Section 2.2, respectively). The PCA model applied to extract the two principal factors behind the correlations (in terms of the patenting activities) used to identify each technological power’s influence on these two factors is reviewed in Section 2.3. The K-means method that is used later to find out the ‘most important (technologies) set’ in order to verify the ‘hottest (technologies) set’ is reviewed in Section 2.4. Other methods, such as the ‘angular method’ for visualisation based on the angular-based component analytical axis system, are introduced in later discussions.

2.1. The Initial Patent Analysis System Proposed by CHI Research

In the late 1970s, CHI Research Inc. (which later underwent a merger and was renamed ‘ipIQ’) worked with the US National Science Foundation in the field of patentometrics to develop the first scientific patent analysis system including the essential indicators for evaluating an institution’s technological output capability. After its introduction, the system was applied to evaluate the intangible assets of companies, a task which was usually deemed as difficult an actuarial company’s value assessment. Therefore, this indicator-based patent analysis system can be viewed as the initial framework that was established not only for measuring the technological strength(s) of a company but also for understanding the real value of the intangible IP assets of that company. Subsequent studies from 2001 onwards have also proposed (and patented) some relevant methods for assessing companies’ intangible assets [3,4]. The information provided by such assessments is the cogent basis for selecting stocks in which to invest.
The patent analysis system proposed by CHI suggested that two types of sub-indicators should be considered, namely, essential indicators (including direct measures that can be calculated directly) and advanced indicators (i.e., derived measures that are computed indirectly) [5]. For example, the ‘number of patents’ is the most intuitive essential indicator of the overall ‘patenting volume’ of a company and the number of patents which have approved by an individual department (area). The annual data sets of that indicator form, in turn, the basis for calculating a company’s ‘patent growth in area’ indicator, which measures the annual increase in patents as approved by each specific department. By multiplying these percentages with the given annual weights (i.e., the years closer to the present time are assigned heavier weights), the weighted average is obtained. This in turn becomes an important composite index which indicates ‘how the studied subject is emphasising the technological developments in this area’. The ‘% company patents in area’ is another effective essential indicator.
In contrast, advanced indicators further measure the impacts of patents. For example, ‘science linkage’ (SL) is an advanced indicator that measures the association between a company-owned patent and other relevant R&D works (i.e., other patents or academic papers). Another advanced indicator, ‘technology cycle time’ (TCT), measures the average gap between a patent’s patenting time and the other previous works which it cited. So, when generalised to a broader extent, TCT is also helpful for observing the velocity of the emergence of new technologies in a given area [6].

2.2. The Patent Indicator Framework Proposed by Ernst

Following the initial patent analysis system and referencing his own previous study [7], Ernst [8] summarised a more systematic indicator framework. Through observation of the positive effects on company sales revenues that are possibly obtained through patenting, Ernst established a model that can utilize the relevant ‘patent data’ in order to provide a description of the technological trends in industrial developments. Replacing the y-axis with ‘number of patents applied’ and re-plotting the technological lifecycle diagram (while keeping ‘time’ as the x-axis), one can easily observe these ‘trends’ (that is, in the adoption and diffusion of a new technology), since these numbers must be closely related to the technology’s life cycle, in spite of the fact that the patenting activities of the major enterprises (players) would vary considerably for each specific field (area).
Allison et al.’s study [9] presented evidence that the patent data, if properly utilised, is really helpful for an enterprise because it provides very useful information to support strategic decisions about company development [8]. Apart from this, another contribution of that work that is relevant to the present study is the insight that in order to meet the aim of actuarially assessing the total value of the IPs of a company, a more systematic and mathematically controlled patent indicator framework should be designed, and it should include the economic values of the patents owned, the quality and the range of the patent application processes, the share ratios and relative increasing rates of these ‘technologies’ and so on. The indicators that should be included in such a systematic patent-indicator framework are summarised in Table 1.

2.3. The PCA Model

This study uses the principal component analysis (PCA) method to extract the principal factors behind the correlations among the technological powers, in terms of their patenting activities. The influences of each country on the two major factors are thus identified.
The PCA method was proposed by Pearson in 1901 [10] and further developed by Hotelling [11]. The purpose of PCA is to identify a set of unobservable variables that are the ‘principal components’ behind a set of observable facts. It is a conversion process wherein the identified ‘first principal component’ has the largest variance (i.e., it accounts for the main part of variability in the given data set). Furthermore, while the ‘second principal component’ is orthogonal to the first one in the vector space, it has the highest variance among all the other factors except for the first one. So, in fact, this process orthogonally and linearly transforms the data into a new coordinate system; this can be mathematically written as follows:
{ z 1 = j = 1 p a 1 j x j z 2 = j = 1 p a 2 j x j z p = j = 1 p a p j x j
Or alternatively, it can be written as:
z i = j = 1 p a i j x j , i { 1 , 2 , , p }
where i is the identifier for the principal components, which identifies zi; p is the number of original variables; j = 1, ... , p and xj are the original variables; and aij is the ‘factor loading’ of the j-th original variable for the i-th principal component.
With PCA, one can often use a lower number of m variables to represent the original system of p variables (m < p). Though after the linear transformation we still have a number of p components ( z 1 ,   ,   z p ) (strictly speaking), a threshold between 70% and 90% can be set, such that if some components ( z 1 ,   ,   z m ) are sufficient to resolve enough of the variance (against the total variance) so that the amount resolved is above the threshold, then these components can be used as the ‘principal factors’ to resolve a large part of the total variance. This could reduce the dimensions of the data space considerably and facilitate the subsequent data analyses. The above justification can be mathematically expressed as follows:
m < p ,   s . t . , k = 1 m V k > s V
where m < p is a positive integer; V is the total variance (of the original variables xj, j = 1, 2, ..., p) present in the original data; and s is a given threshold, in terms of a percentage value, as described above.
Since the above process constitutes a transformation, as with other transformations in other fields, e.g., the wavelet transformation in digital signal processing (DSP) [12,13], while the new ‘principal components’ are actually composite variables, they should imply some unforeseen means that could not be easily or directly observed or analysed based on the data of the original variables.
Finally, in spite of the many applications of PCA in various fields, its application in analyses of patent data is relatively rare. However, since it has previously been proven effective for analysing patent-relevant data [14], its application in this study should be meaningful in spite of the analytical purpose herein differing from its purposes when applied in other fields. In this study, the patent databases of the various countries are aggregated during the data pre-processing, and then an ‘overall PCA model’ is fitted and established based on the aggregated dataset (see Section 4). As such, not only can the ‘overall main countries’ which dominate the trends in the global technology industry be easily identified, but also any other analysis that is conducted based on this dataset is meaningful because the cross-national implications can be drawn subject to a global view (e.g., the competitive relationships and dependencies among these countries within a single industry can be scrutinised in accordance with the correlations among them). In any case, the PCA method is the basis for the PCA-based analytical works performed in Section 3.4 and Section 4.1.

2.4. The K-means Technique

In addition to the PCA method, another method, the K-means method [15], is also employed in this study. In the field of data mining, the K-means method has been, and still is, a widely accepted and popular method for data-clustering, even in recent years [16,17,18,19]. It is a ‘classifier’ that is frequently applied by analysts in order to classify the data points in question into several ‘clusters’. A point in a cluster is said to be identical or similar to other points in the same cluster when their similarity can be justified based on some properties (i.e., ‘attributes’, ‘factors’, or even ‘features’; the usual term is subject to the field or domain), but points in the same cluster are all quite different from the points in any other cluster. Figure 2 illustrates such a clustering process, and such a process can be performed by using the K-means method.
Mathematically speaking, the mechanism behind the K-means method can be written as the following optimisation problem, wherein the objective is to minimize the aggregated J statistic in the objective function of the model:
M i n ( J )
s . t .   J = i = 1 k ( x j S i ( x j μ S i ) 2 )
i = 1 k S i = S
i = 1 k S i = Φ
where xj is a data point that belongs to cluster i, as represented by a set Si which has one or more data points, among all, as its elements; μ S i is the mean value of all the data points in the set: Si; k is a predefined number of groups to be clustered as desired by the analyst; J, therefore, is the summation of all the ‘within-group variances’ that is to be minimised; and S is the set of all source data points.
This K-means model seeks to cluster the data points into a number of k clusters. The model reaches optimality when, in each cluster, the sum of the Euclidean distances between each point and the virtual mean point of the cluster is sufficiently minimised so that, overall, the sum of the ‘within-group variances’ (for all groups) is minimised, given the condition that every data point in S has been classified into one of the k clusters. If such optimality is reached, the model solution (i.e., the solution indicating which source data point should belong to which cluster) is regarded as an optimal clustering scenario of the source data, while the centre of each cluster can be located.
Normally, the constant k can be pre-determined for the above process, but in real-world applications, this value is usually uncertain and not easily fixed [20]. For this reason, some studies have suggested that trying any value within the [1,10] interval for k would be sufficient in most cases [21]. However, given the computational efficiency available nowadays, limiting the number of trials is perhaps unreasonable. Instead, incrementing the value for k above 2 and then watching the objective function value of Equation (5) with regard to the optimal solution obtained every time seems to be a better approach.
As will be shown in Section 4, in this study, it was found that k = 7 yields the optimal solution for clustering the relevant patents. In addition, the results for the identified set of the 10 ‘most important technologies’ (non-ordered) exactly match those for the 10 ‘hottest technologies’ identified previously using the descriptive methods detailed in Section 3. This match confirms the main empirical finding of this study, despite the fact that such a reconfirmation is rarely seen in the patent study literature.
Therefore, this study may provide supplements to the field through its interdisciplinary use of methods that are reflexive to the theories of big data analytics. Note that because the descriptive methods used in this study are commonly used and well known, reviews of these methods are omitted here.

3. Results from Patent Data Mining across the Countries

Utilising the patent databases of the main technological powers, this section analyses the patenting strategies currently employed in the global high-tech industry and identifies the ‘hottest technologies’ and the correlations between each pair of these countries in terms of their patenting activities. Through these efforts, a set of relevant knowledge regarding the trends, the competitive relationships and the dependencies among these main technological powers is revealed. This information constitutes the main empirical findings of this study.

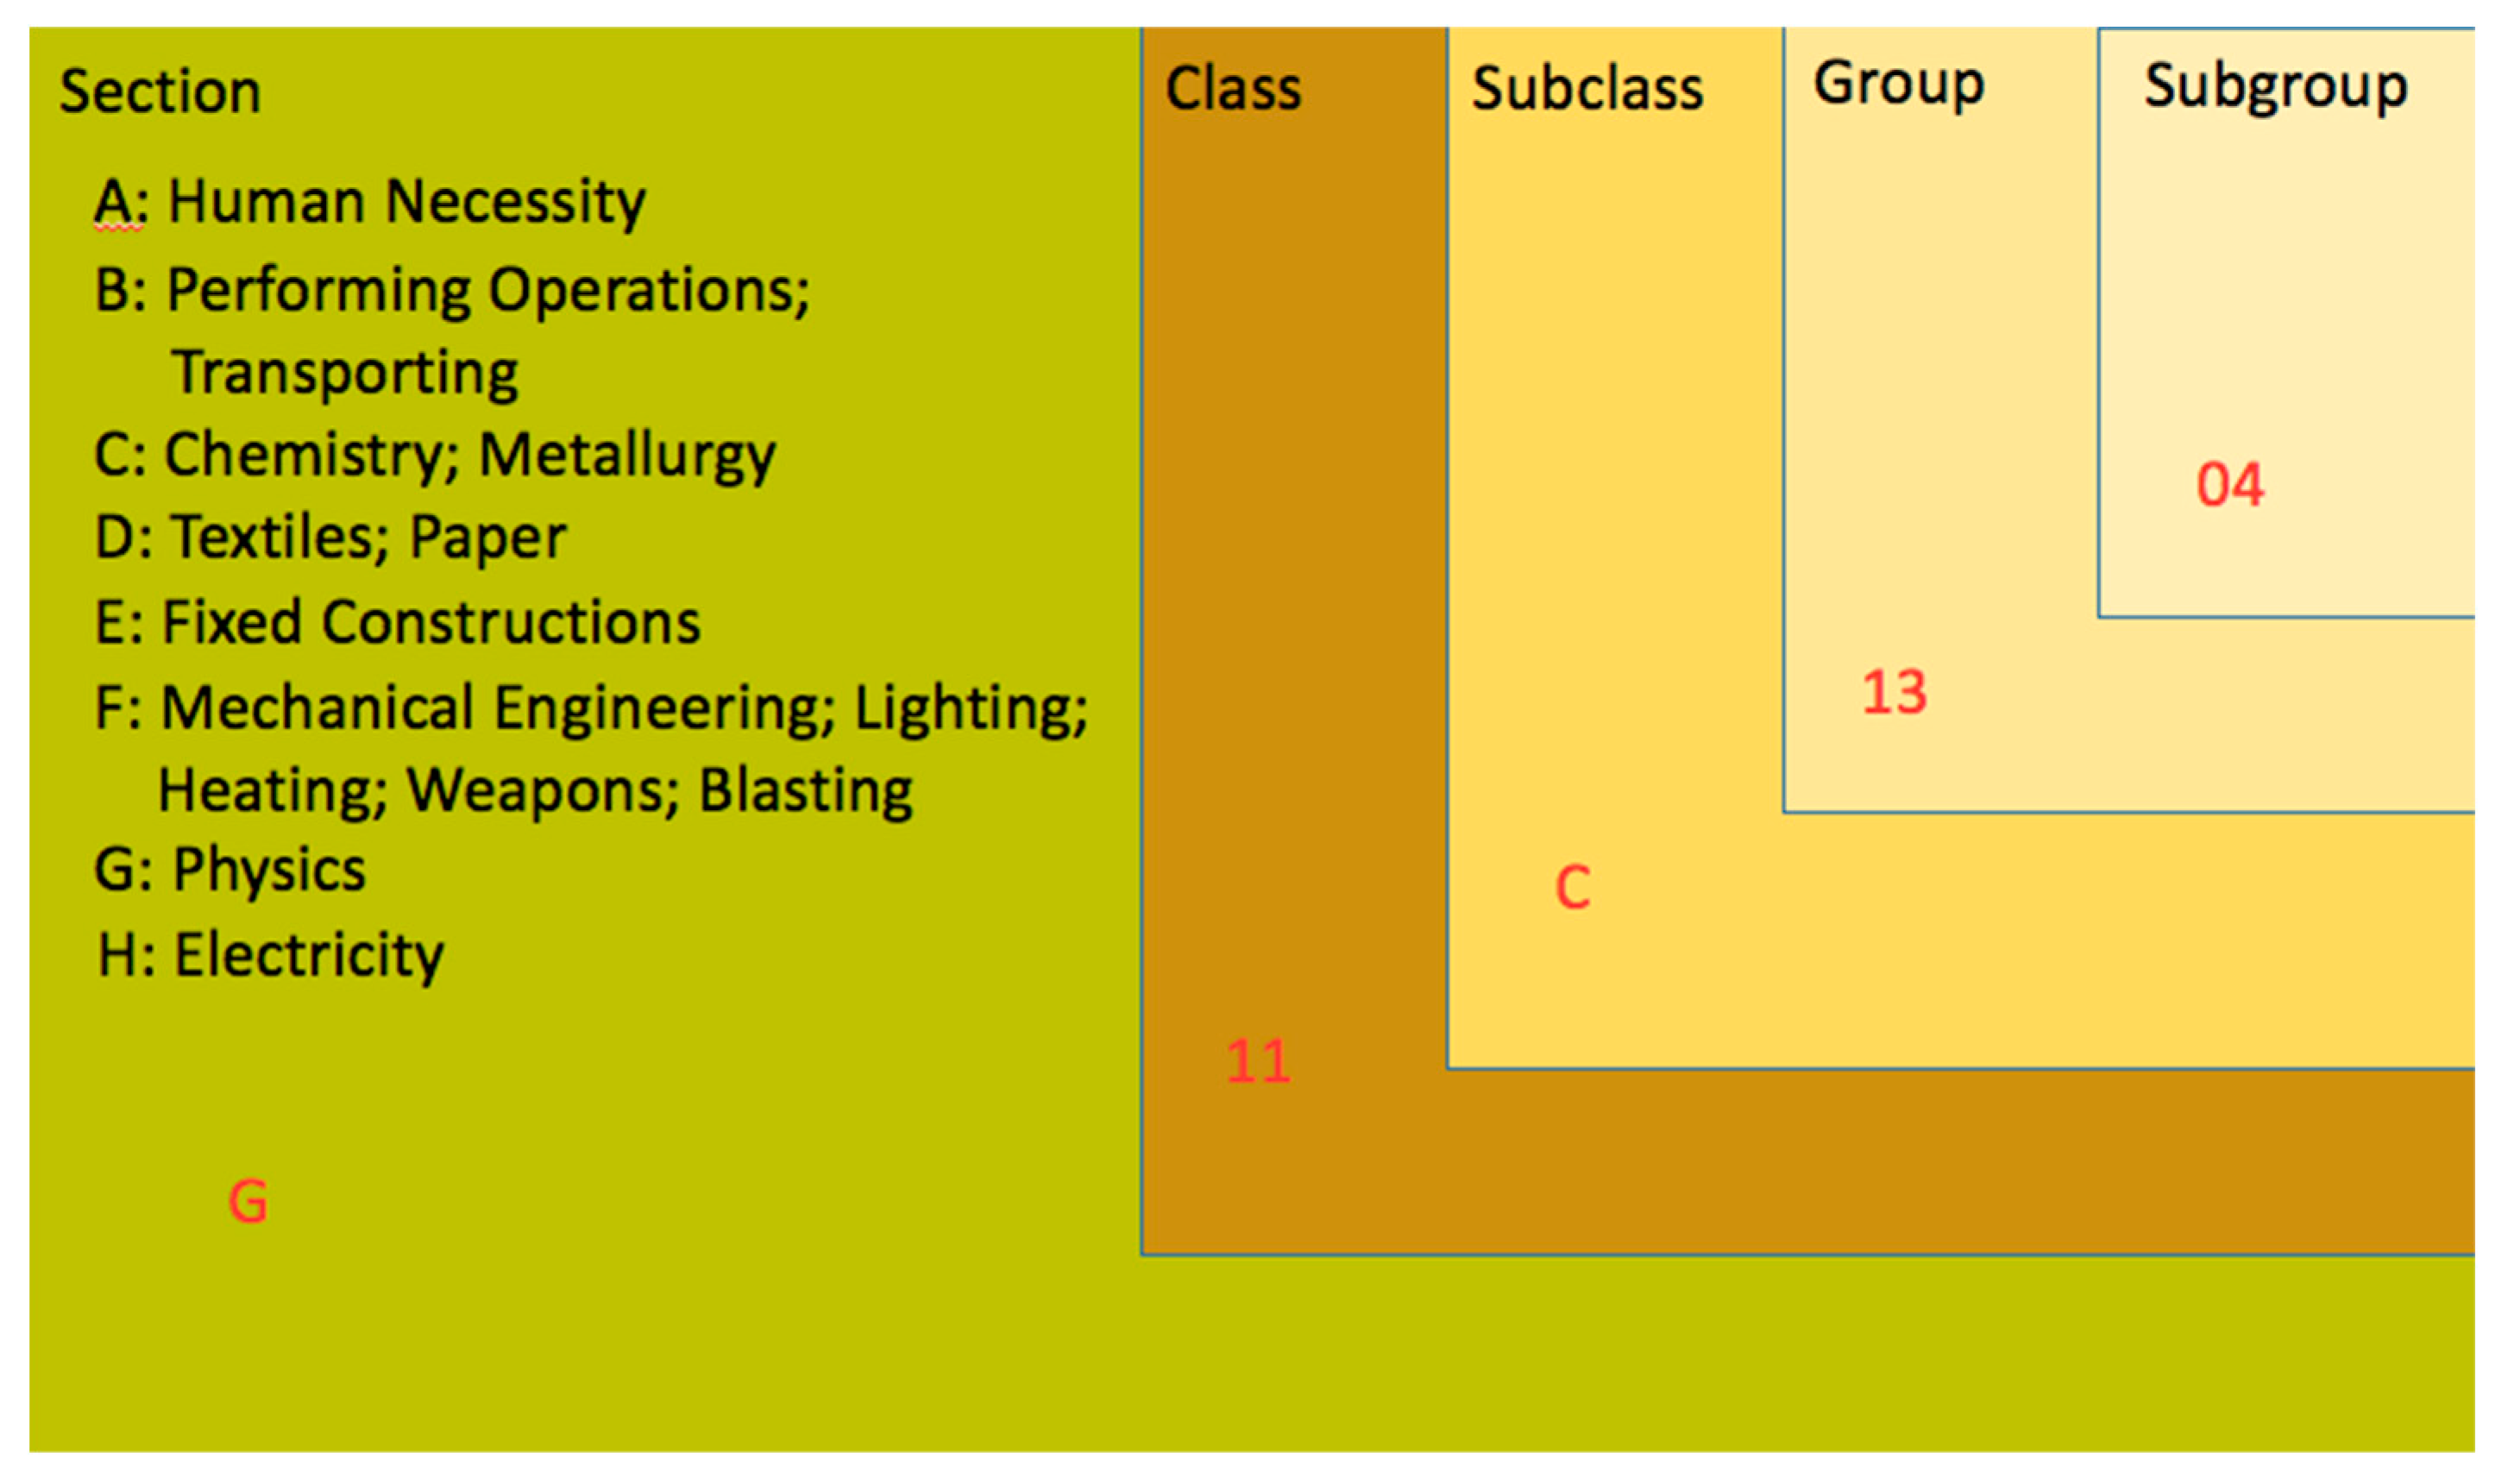
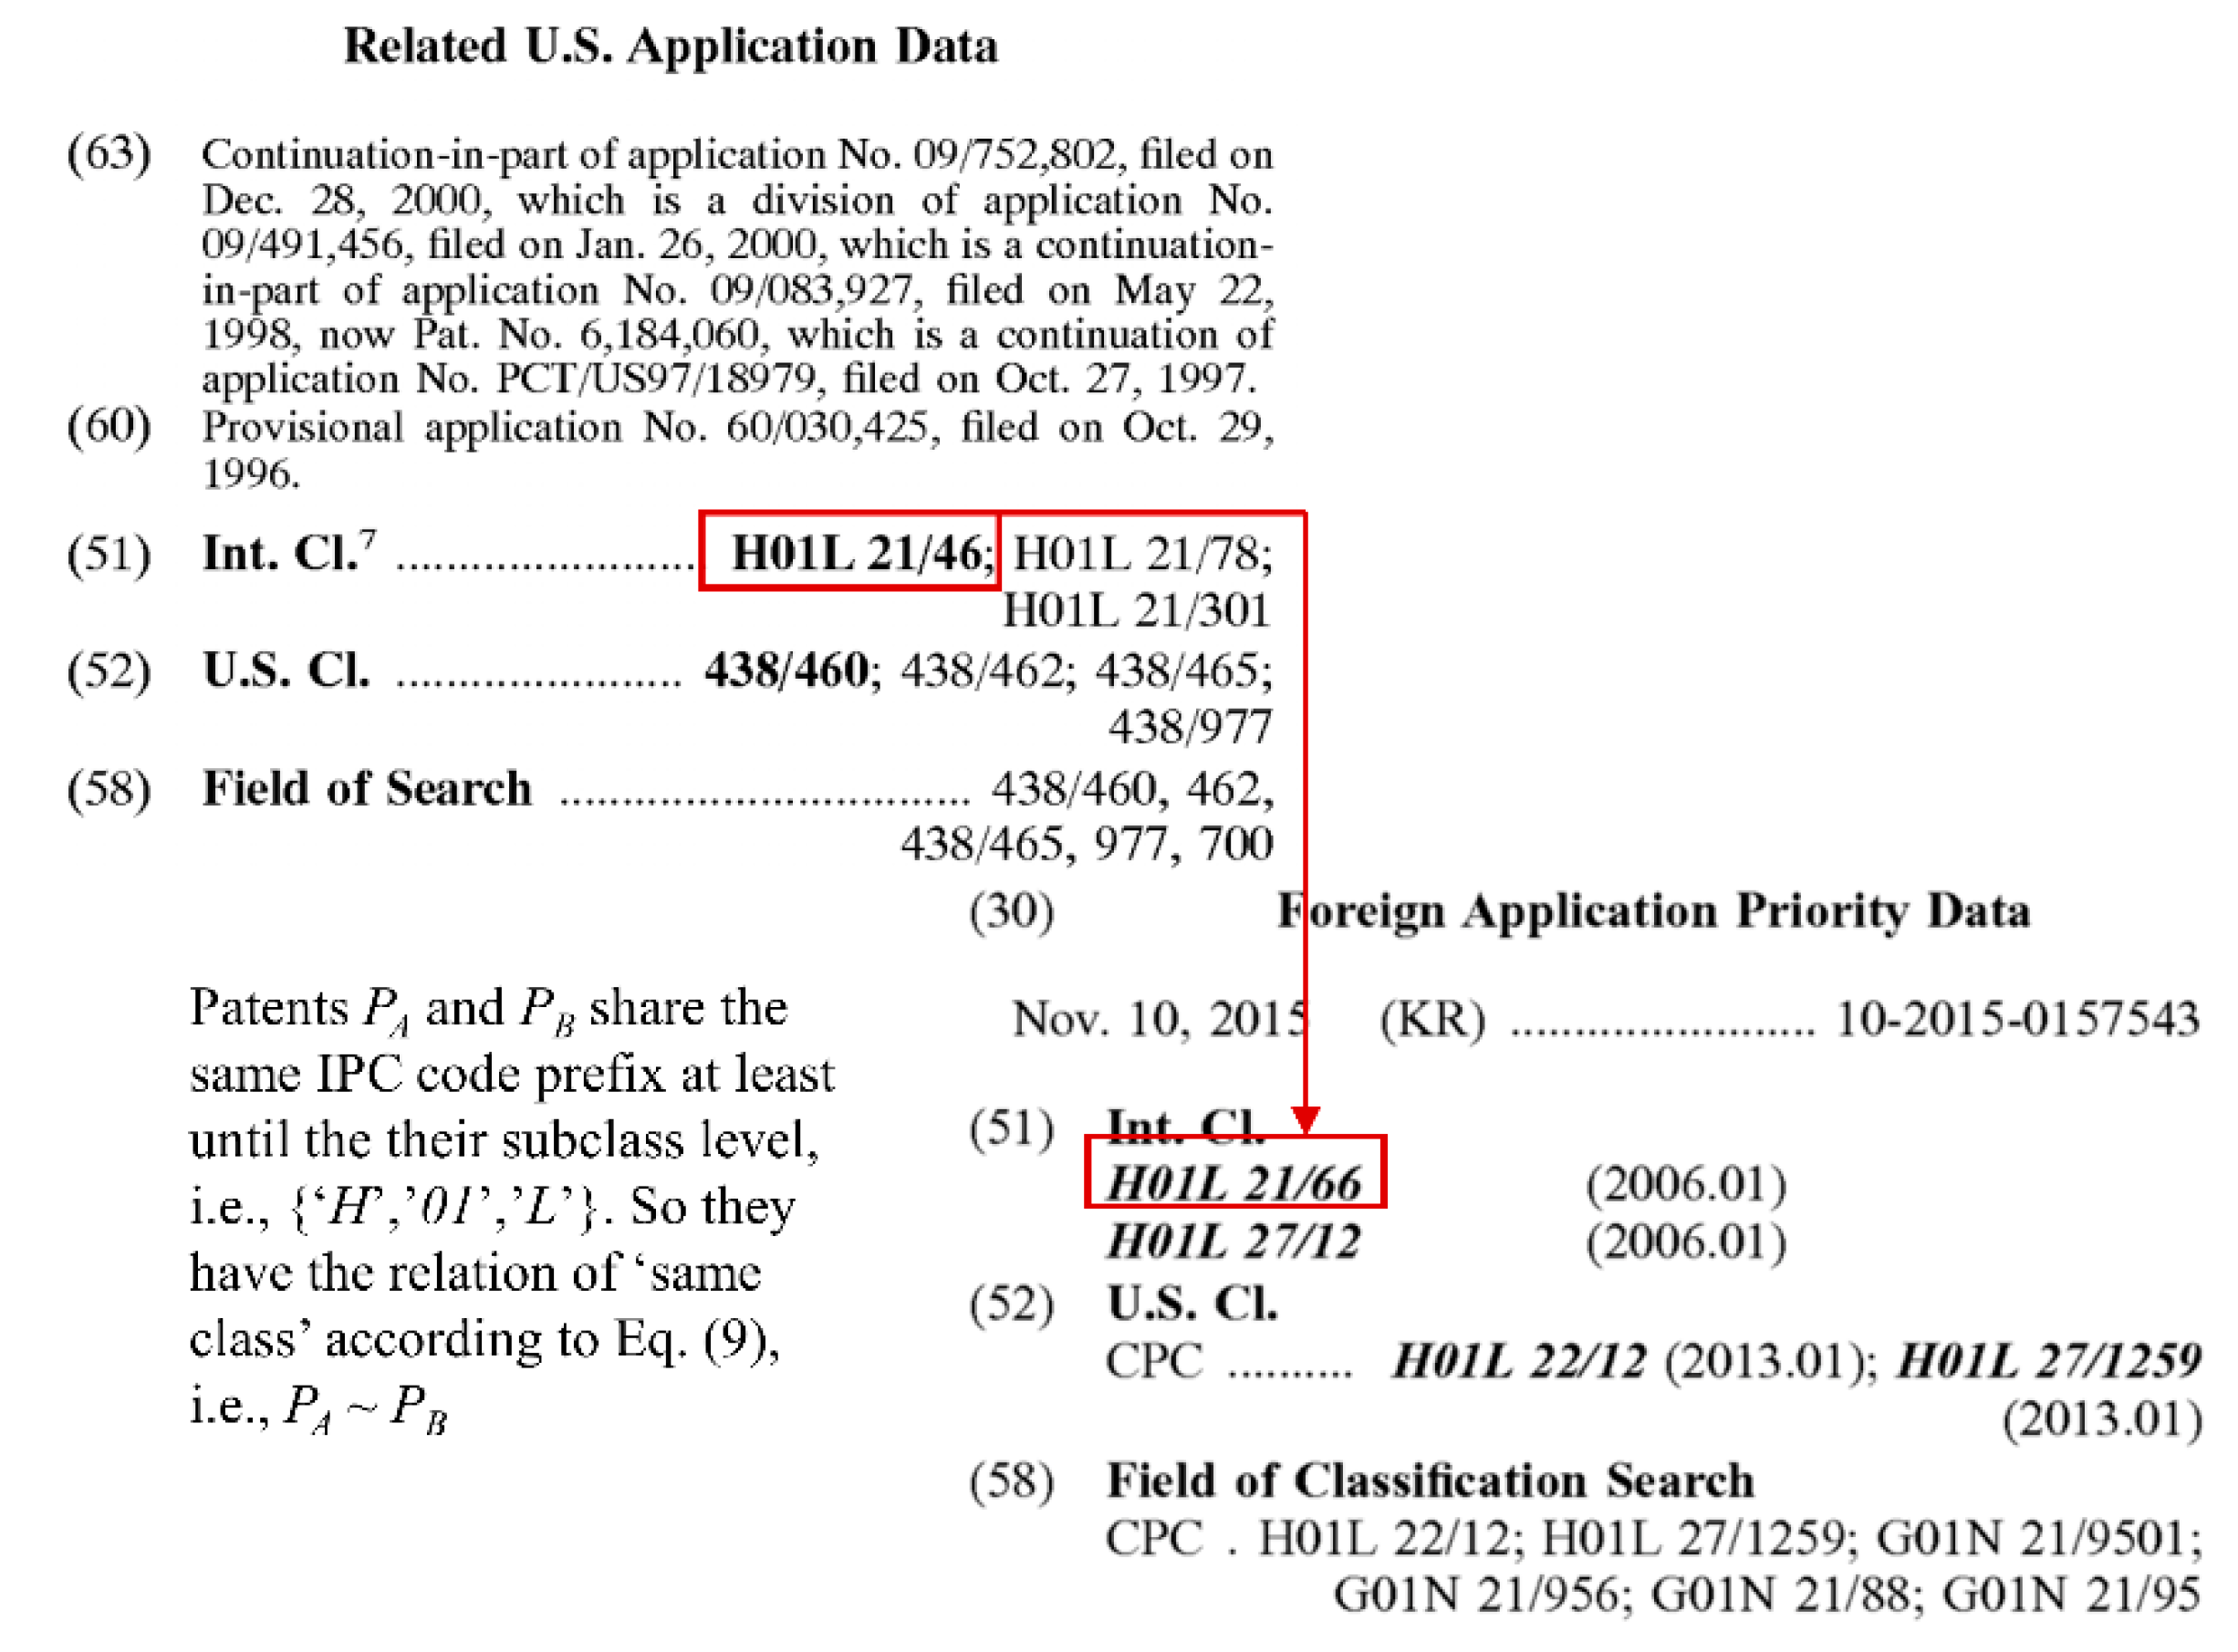
3.1. IPCs and the Patent Data Pre-processing: The Basis

In this phase, the datasets of the patents for inventions from the ‘technological power’ countries are featured and stored in a data repository. For the purposes of knowledge discovery, all of the patents in sections G (which covers physics-related patents such as those for technologies involving optics, data storage, image processing, magnetic materials, etc.) and H (which covers electricity-related patents such as those for technologies involving electronic circuits, electrical communication, semiconductor components, etc.) during the 2007–2015 period included in the official patent databases of the top 9 high-tech patenting countries are focused on. The ‘technological powers’ whose patent databases are selected from include the United States (USA), Japan (JPN), Germany (GER), Great Britain (GBR), South Korea (KOR), China (CHN), Canada (CAN), Taiwan (TWN) and the European Union (EU). For a special style to apply a patent in some countries in EU, see the supplementary discussion in Appendix C.
Consistent with previous works on patent indicator frameworks (see Section 2.1 and Section 2.2), this study utilizes the IPC codes of these patents. This is not only because IPC is a common code field for each patent in all the patent databases investigated herein, but also because it connotes the ‘technological classification’ by which to index the given patent per se. Therefore, it should provide a suitable shared foundation for the desired analytical works.
According to the Strasbourg Agreement of 1971, every patent should at least receive an IPC. The possibly tagged IPC codes are alpha-numerically coded and they are organised systematically in a hierarchical structure. This means that each patent is classified into suitable categories.
At the root of the hierarchy, each patent is assigned a ‘section’, which is indicated by a letter from set {‘A’, ‘B’, …, ‘H’} [9]. Following the section tag, there are two numerical digits coding the ‘class’ of the patent, followed by some ‘subclass’ coded in terms of another capitalised letter. The entire ‘class–subclass’ tag is then followed by another tag of ‘group–subgroup’ codes. With the standard of IPC, 1–3 numerical digits are allowed to code the ‘group’, while 2–4 are allowed to code the ‘subgroup’.
Figure 3 illustrates this coding scheme. As shown, the hierarchy entails, in fact, a tree of 5 levels extending above the root, and the set of all possible IPC codes is obtained by tree traversal. Note that in this figure, only the section names are shown; names for the codes in the rest of the layers are omitted to allow for simplicity in the presentation.
For illustration purposes, Figure 3 also demonstrates a specific IPC code: “G11C 13/04”. Parsing it according to the hierarchy, this is a patent in the “11: information storage” class and “C: static storage device” subclass within the “G: physics” section. In an additional detail, the postfix of this IPC code is “13/04”. This means, for a patent that is tagged with this group/subgroup code, that the technology in question is related to “digital storage memory by using optical components”. Therefore, the entire IPC sequence is interpreted as “optical-components-enabled static data memory device under the physics section”, which is a relatively long description. This explains why the shortened IPC coding style is used. The full compilation of the IPC codes can be accessed via the official website of the WIPO [22].
For this study, the IPC coding style forms a ‘natural taxonomy’ that is useful because the patents which receive the same (full) IPC code are highly related to one another. Furthermore, patents that receive the same ‘code prefix’ can also be supposed to be related to some extent. This study utilizes this feature of the coding style. That is, using different ‘resolutions’ to view the IPC codes can determine the ‘granularity’ of the patent data pre-processing for the subsequent analyses.
In this study, the initial 3 subcodes are used as the basis, despite the fact that an IPC code can have a total of 5 subcodes. This is because for the high-tech industry, this code prefix (i.e., a 3-tuple of {section, class, subclass}) is sufficient to identify a technological category. As such, two patents are viewed as being in the ‘same class’ if (and only if) they receive identical IPC subcodes up through the subclass layer. Mathematically, this means that the two 3-tuples can hold the following ‘ordered identity property’ according to the formal rules in tuple mathematics:
P x = { s x , c x , s c x } P y = { s y , c y , s c y } ,   if   and   only   if   s x = s y ,   c x = c y   and   s c x = s c y
where x and y are any two patents; Px and Py are the 3-tuple ‘patent descriptors’ for them; sx, cx and scx are the section, class and subclass codes of patent x; is the operator which defines the ‘same class relation’ between two patent descriptors; and x , y U is the universe of patent database(s).
The following example illustrates the above ‘same class’ relation between two patents, and the positive consequence of identifying this relation (i.e., altering the data granularity greatly simplifies the process of patent data preprocessing). As shown in Figure 4, the former patent, A, receives several IPC codes, but all of them are prefixed with ‘H01L’ until the third subclass level. Although patent B receives only one IPC code, which is ‘H01L 21/302’, the IPC codes of A and B share a ‘H01L 21’ prefix, although the last code of A, ‘44’, does not match with the last code of B, which is ‘302’. The fact that their IPC codes are identical until the fourth group level implies that they have the aforementioned ‘same-class relation’ (i.e., P A P B = { H , 01 , L } ), regardless of whether the tail parts (the overlapped ‘21/*’ group/subgroup codes) are identical or not.
The above ‘same-class relation’ identification logic is exactly the algorithm used to perform prefix-matching for the patents in the database(s). This facilitates the analytical works.

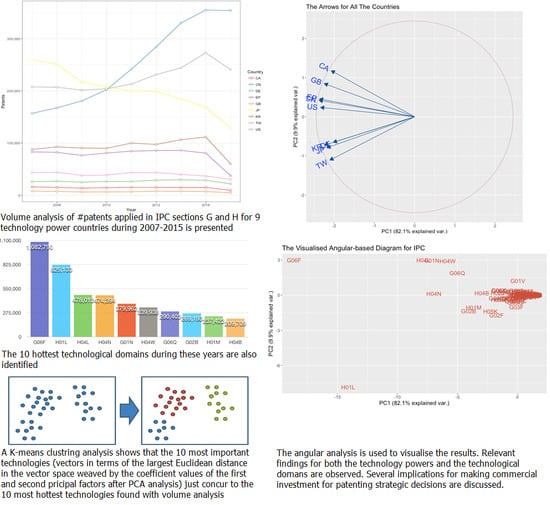
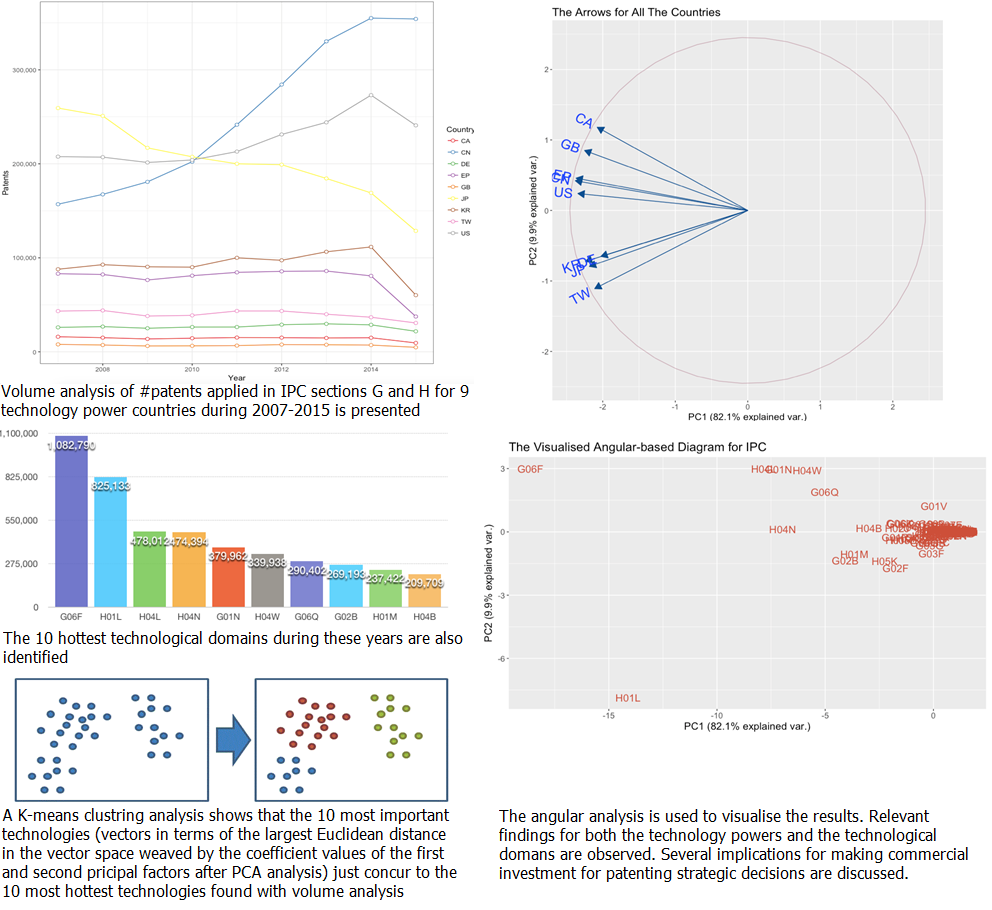
3.2. Patenting Activities in the Main ‘Technological Power’ Countries

The trends in patenting throughout the technology industry worldwide is the first focus of analysis. A descriptive analysis accumulating the annual number of patent applications in the 9 countries during the 2007–2015 period is made. In terms of the total amount of patents applied for (in Sections G and H) year by year, Figure 5 shows the general trends in patenting in the technology industry in each country. According to the rule that “the greater the number of applications received by a country’s patent office is, the larger the size of the market in this country will be”, it is observed that the biggest markets worldwide during these years were the USA, JPN and CHN.
Further scrutiny revealed that TWN, although far less important than the USA, JPN and CHN, was the 6th ranked market in these years. This observation is interesting because TWN, while developed, is only an island country with a small territory and relatively small population (23 million), but in these years the patent office for TWN received more patent applications (i.e., the pink curve) than those in GER, GBR and CAN (i.e., the number of patents for which are indicated by the green, red and orange lines). One reasonable explanation for this is that, despite the domestic market in TWN being relatively small, because of the role it has played in the global high-tech supply chain [23], companies based in many other countries have applied for patents in Taiwan to apply for the patents. Rather than attempting to crowd out the market, it appears that these overseas companies have done so in strategic attempts to protect and claim their exclusive IP rights for their innovations and products in Taiwan.
Another interesting observation is that although the last financial crisis seriously hurt the global economy from 2008 to 2010, the number of patenting activities in CHN continued to increase during that time. Meanwhile, as can also be observed, the pace of patenting activities decreased in JPN, although the pace in the USA was roughly maintained. These observations reflect the fact that the Asian market suffered from drastic fluctuations during the financial crisis, and these fluctuations had great impacts on the patenting activities of some companies in Asia. However, during the same period, companies in the other nations grew more aware of the importance of the IP market in CHN and shifted their focus from JPN to CHN. The subsequent economic progress of China confirmed this view, as China became the second largest economy in 2011. The situation in which the number of patenting activities in JPN is offset by CHN is discussed in Appendix D extensively.
The last finding worthy of note from this analysis is that for each curve in Figure 5, a reduction was observed in 2015. This implies that in 2015, either the high-tech companies became more conservative with regard to patent investments, or they had already reached maturity in terms of their innovation efforts. In either case, this was a general phenomenon across the entire global technology industry, and the reason for it, which relates to the development of smartphone technologies, may have been identified by one global industrial analyst. He stated that, as of 2015, there was a technological bottleneck in the smartphone field that was hard for companies to break through [24].
In any case, such knowledge presented a warning sign for industrial DMs as well as ‘investors’ (as defined previously, e.g., venture capitalists). During that period, a lack of new innovations led to a failure to create new markets and vice versa: a lack of new markets led to a failure to achieve more innovations. In other words, in the high-tech industry, there could be no ‘new profit’ to be sought for. As a result, the DMs had to devote themselves to increasing their market shares of the ‘old profit’. This had been shown by the ‘red ocean strategy’ and the polarisation of the consumer electronics market in the past few years [25]. This is perhaps also of critical importance for high-tech companies and investors in the upcoming years, that is, issues will arise if such a ‘no-no-no’ situation continues.

3.3. Hottest Technologies around the World

This section explores the knowledge needed to answer the question, ‘What were the hottest technologies around the world during the years in question?’ As ‘hottest technologies’ refers to the areas that have gained more attention, the relevant analysis can be accomplished by measuring the total number of patents applied for in each individual area during the study period, such that the ‘hottest technologies’ can be ranked and observed.
In the data repository, the patents that have the same 3-tuple values in Sections G and H (i.e., {section, class, subclass} values, as mentioned in Section 3.1) are counted for each country. This is followed by a process in which each 3-tuple is accumulated over all the countries. This results in a table which carries the information of “the total number of times patents have received a given IPC code prefix in the top 9 technological powers during the period”. By sorting this table, the top 10 ‘hottest technologies’ can be observed along with the top 10 IPC codes. These are visualised in a histogram in Figure 6.
As shown in Figure 6, three main technological categories accounted for the top ten hottest technologies, namely, 4G wireless communications (i.e., the four IPC codes for signal transmissions of handset devices, transmission technologies for images, cells and inductances), optical lenses (i.e., the two IPC codes for digital cameras and optical modulation/demodulation) and fin-techs (including data-driven forecasting and prediction). These findings perfectly meet the observable trends in the smartphone-relevant industries, as the optical lens industry, for example, was boosted by the smartphone market, and fin-tech was boosted by mobile-based value-added services over the 9 years in question. These results also reveal the strategic global patenting policies during the study period, i.e., they were not limited to any particular high-tech company or any particular country.

3.4. Total Correlation Matrix of the Patenting Activities among the Countries

As discussed previously, the records in an official patent database of a country can indicate two things. A high number of patents being applied for in a given area may connote a strong or potentially strong domestic market for the technologies in that area (in terms of the IPC code(s)) in that country, while this may also denote the degree to which the IPs that are relevant to these technologies are protected in that country. Patents applied for with the latter purpose usually have the aim of crowd out (blocking out) similar technologies, so such patents usually imply a ‘battle’ against the original technological strengths of the country in which the patents are applied for. This is especially true when the company which is applying for the patent is a foreign company.
Regardless of the dual potential purposes of these patenting activities, the extent of such activities in an area in a given country is an important indicator of the technical strength of the country in that field. Therefore, by examining the strengths of a country in all relevant technology domains (in terms of the IPCs), a ‘spectrum of the technical strengths’ (STS) in these domains can be determined for the country.
In order to obtain the STSs for the technological powers, in each country’s patent database, a subtotal for each 3-tuple is accumulated, so that the ‘patenting volume’ of the technology domain can be recorded and analysed according to its IPC prefix. These numbers then form a ‘statistical variable’ that is titled with the abbreviated country name (e.g., GER). Each statistical variable, on the other side, can be treated as a vector whose elements are ordered [26,27] according to a certain sequence of all possible 3-tuples that are prefixed by G or H. Thus, 9 such variables (vectors) are obtained, so the correlation between each pair of these variables is then identified. A so-called ‘correlation matrix’, which is shown in Table 2, is then obtained by filling in these numbers. This reveals the pairwise correlational degrees between the STSs of all pairs of two technological powers.
Numerous insights revealed by Table 2 are of considerable value. However, for space reasons, only some empirical insights regarding how the STS of Taiwan is related to those of other countries are explored. The analytical case standing in the position of other countries is analogous.
  • Among the correlational numbers that involve the STS of TWN, the highest one is 0.925, i.e., TWN’s STS correlates with KOR’s STS to a high degree. This not only implies that the markets for technological products in these two countries are almost identical, but also indicates that the patenting strategies of the high-tech companies are very similar in these two countries. Relatedly, many industrial analysts have claimed that “if North Korea launches a missile, the largest beneficiary would be TWN because it will receive an economy of scale due to the shifts in orders of technological products from KOR to TWN”. This claim is supported by the patent-based analysis here. This analysis provides evidence that the intrinsic structures of the technology industry are very similar in these two countries.
  • The second highest correlation number for TWN (0.879) is between it and JPN. This is because a high volume of trade occurs between TWN and JPN, i.e., the high-tech industry in JPN submits a considerable amount of OEM (Original Equipment Manufacturing) orders to TWN for component-making. An extended observation from this point is that the correlation number for (JPN, CHN) is 0.796, which is lower than those for (JPN, KOR), (JPN, TWN), (JPN, USA) and (JPN, EU), despite the fact that CHN has increased its impact in recent years and become one of the most important markets. In other words, the relatively low number could thus be read as indicating either that the technological strengths of these two countries do not overlap so much or that Japan is relatively uninterested in the Chinese market (and/or vice versa), in spite of Japan and China being neighbouring countries. That said, the underlying reasons for the number are outside of the scope of this study.
  • The third highest correlation number for TWN (0.818) is between it and the USA. A common situation is that companies in the USA also submit OEM orders to manufacturers in TWN, and many of these products are then shipped back to the America or shipped to other countries in Asia. Therefore, the wafer foundries in TWN have become the partners of the R&D companies in the USA, and this co-dependency has increased their technological correlation. With respect to what they have patented in the USA, the USA companies will try to protect their IPs in Taiwan before making an order. Of course, given that economic data indicates that TWN usually has a trade surplus with the USA, and that this is usually due to exports of technology products resulting from mutually beneficial partnerships, the observation of technological correlation between the two countries is common; however, it is worth noting, then, that this finding derived from the cross-national patent databases once again reflects the facts.
  • Surprisingly, in terms of the STSs, the technological (and also the market) relevance between TWN and CHN is relatively low (0.757) and is only middle ranked (i.e., 5 of 8). This is because although TWN companies addressed the market in CHN, moved many factories over there and applied for a considerable number of patents in CHN during the study period, the opposite did not also occur. Setting aside the possible reasons for it, companies in CHN bypassed the market in TWN and applied for patents in other technological power countries which were deemed more important during the study period. In the table, the (CHN, TWN) pair is ranked the lowest (8 of 8) among all of the (CHN, *) correlation pairs.
  • Finally, the correlation between the technology industries of CAN and TWN is very low at only 0.495. This is the smallest number in the entire table. The reason for this observation is presumably that the two countries are the least populated countries in the list of technological powers (i.e., there are 37.281 and 23.589 million people in CAN and TWN, respectively). Given the resulting smaller sizes of their domestic markets, patent applications are only necessary when there is technological conflict between companies from the two countries.

4. Further Analysis with Discussions and Implications

4.1. The Principal Factors Affecting High-tech Companies’ Global Patenting Strategies

The PCA model is constructed according to Equation (2) by using the pairwise correlational numbers in Table 2 as the model parameters, and then solved for an optimal fit, after which the factor loadings (aij) associated with each variable (x1, ..., x9 for all technological powers) are assessed (estimated). This establishes a model wherein the main components are identified that, in turn, enables further analysis. After the modelling work, a threshold of 85% is set. That is, if one or more component(s), zi, can successfully explain 85% of the total variance of the data, the component(s) is chosen as the principal component(s).
After modelling in R [28], it was observed that two principal components were sufficient to explain enough of the total variance. The first principal component explains a major part of the variance, which is as high as 82.14% (with a standard deviation of 2.719). Furthermore, the second principal component also explains a relatively minor but still quite large part (9.93%, which is almost 10%) of the variance, with a standard deviation of 0.945. As a result, up to 92.07% of the total variance can be explained when these two principal factors are considered. Therefore, the suitable PCA model is obtained as follows:
z 1 = 0.311 x C A N + 0.357 x C H N + 0.304 x G E R + 0.355 x EU + 0.337 x GBR + 0.328 x JPN + 0.336 x K O R + 0.317 x T W N + 0.351 x U S A
z 2 = 0.509 x C A N + 0.182 x C H N 0.281 x G E R + 0.198 x EU + 0.367 x GBR 0.343 x JPN 0.312 x K O R 0.479 x T W N + 0.104 x U S A
The established model reveals the overall scenario of the patenting strategies taken by the high-tech companies in the main technological powers. Since the influence of the first principal factor, z1, explains 82.14% of the total variance, which is far greater than the amount explained by the second one (z2), the knowledge which can be derived from Equation (10) is the main focus here.
On the RHS (right-hand side) of Equation (10), one can easily observe that CHN, the EU and the USA are the three main economies that the technological powers may think are important because they have higher estimated weights (or ‘factor loadings’) than the other countries associated with their variables (i.e., 0.357, 0.355 and 0.351, respectively).
However, if the RHS of Equation (10) is examined, it is also observed that the factor loadings of these technological powers are all above 0.3, and the differences among them are not so substantial. In this sense, it can be seen that every country in the list is deemed as important by all the other countries, so that overall, no specific country dominates the others. Nevertheless, the companies in these countries utilised various patent strategies according to their individual technological strengths (i.e., the STSs) and business/marketing considerations. This has been shown in Section 3.4.

4.2. Angular Analysis and the Inferences of Fact

In this section, the results obtained from PCA modelling are further visualised [29] in order to discover more insights and inferences of fact.

4.2.1. Classifying the Technological Powers with the Angular Analysis Method

The extractions of the two principal components in Section 4.1 (i.e., z 1 and z 2 by using Table 2 for the model parameters) is interesting. The influences of each technological power country on these two components are, respectively, estimated and identified as the weight priorities associated with the country’s variable (e.g., 0.311 and 0.509 associated with xCAN in Equations (10) and (11) for Canada). These values constitute useful information for the ‘angular analysis’. For each country, these weights, when normalised, can be plotted as an arrow in the vector space weaved by the dimensions of the principal components, i.e., the ( z 1 , z 2 ) coordinate system. When the arrows for all the countries are plotted, it forms a visualised angular-based diagram for further knowledge exploration (see the codes within the circle plotted in Figure 7a).
Aside from the countries, the different types of technologies can also be the targets of interest in such an analysis. To explore the relations among them, another similar analysis that follows the correlation matrix analysis (Table 2 in Section 3.4) method and the PCA modelling (see Section 4.1) is also performed. However, this analysis is performed on a ‘by-technology’ (that is, by-IPC-code) basis, rather than on a ‘by-country’ basis.
This additional PCA modelling yields another set of two principal components ( z 1 and z 2 ) that explains more than 85% of the total variance present among the variables of the IPC codes (i.e., { x 1 ,   x 2 , , x q }, where q is the number of IPC codes in Sections G and H). For space reasons, this equation system (that is, the PCA model) is omitted here because the RHS of these equations is too long. Instead, the weights that are associated with each x’ in the model compose a ( a 1 j , a 2 j ) pair (where j = 1, … , q is an IPC code) that can be plotted as a point in the ( z 1 ,   z 2 ) coordinate system.
For simplicity in the presentation, in this study, each of the points, the locations of which show the features of a technological area, are separately plotted in Figure 7b, while the arrows that connote the patenting activities of the countries are plotted in Figure 7a. In both figures, the coordinate system is weaved by the first principal component (as the x-axis) and the second principal component (as the y-axis), but the meaning of an arrow and that of a point are different. Each point in Figure 7b, ( a 1 j , a 2 j ), is for (the feature of) an IPC code, in terms of its weight in the equation for z 1 and the weight in that for z 2 . Each arrow in Figure 7a, ( A j = ( a 1 j , a 2 j ) ) is for (the feature of) a country, in terms of its weight in the equation for z 1 and the weight in that for z 2 . This benefits the upcoming discussions.
In Figure 7a, it can easily be seen that regardless of the angle and signs, each arrow vector, A j = ( a 1 j , a 2 j ) , is defined by the contribution of country j to the first principal component and its contribution to the second. All of the arrows fall within the circle with a radius of 1. Since the length of each arrow is a Euclidean distance from the origin, it represents the amount of variance of the country and, thus, the importance of that country in the studied technological domains.
In the figure, it can also be observed that among the 9 arrows plotted, except for the arrow for GER (‘DE’), the amounts of variance indicated (that is, for the other 8 technological powers) are almost even. Other key observations, point by point, are as follows:
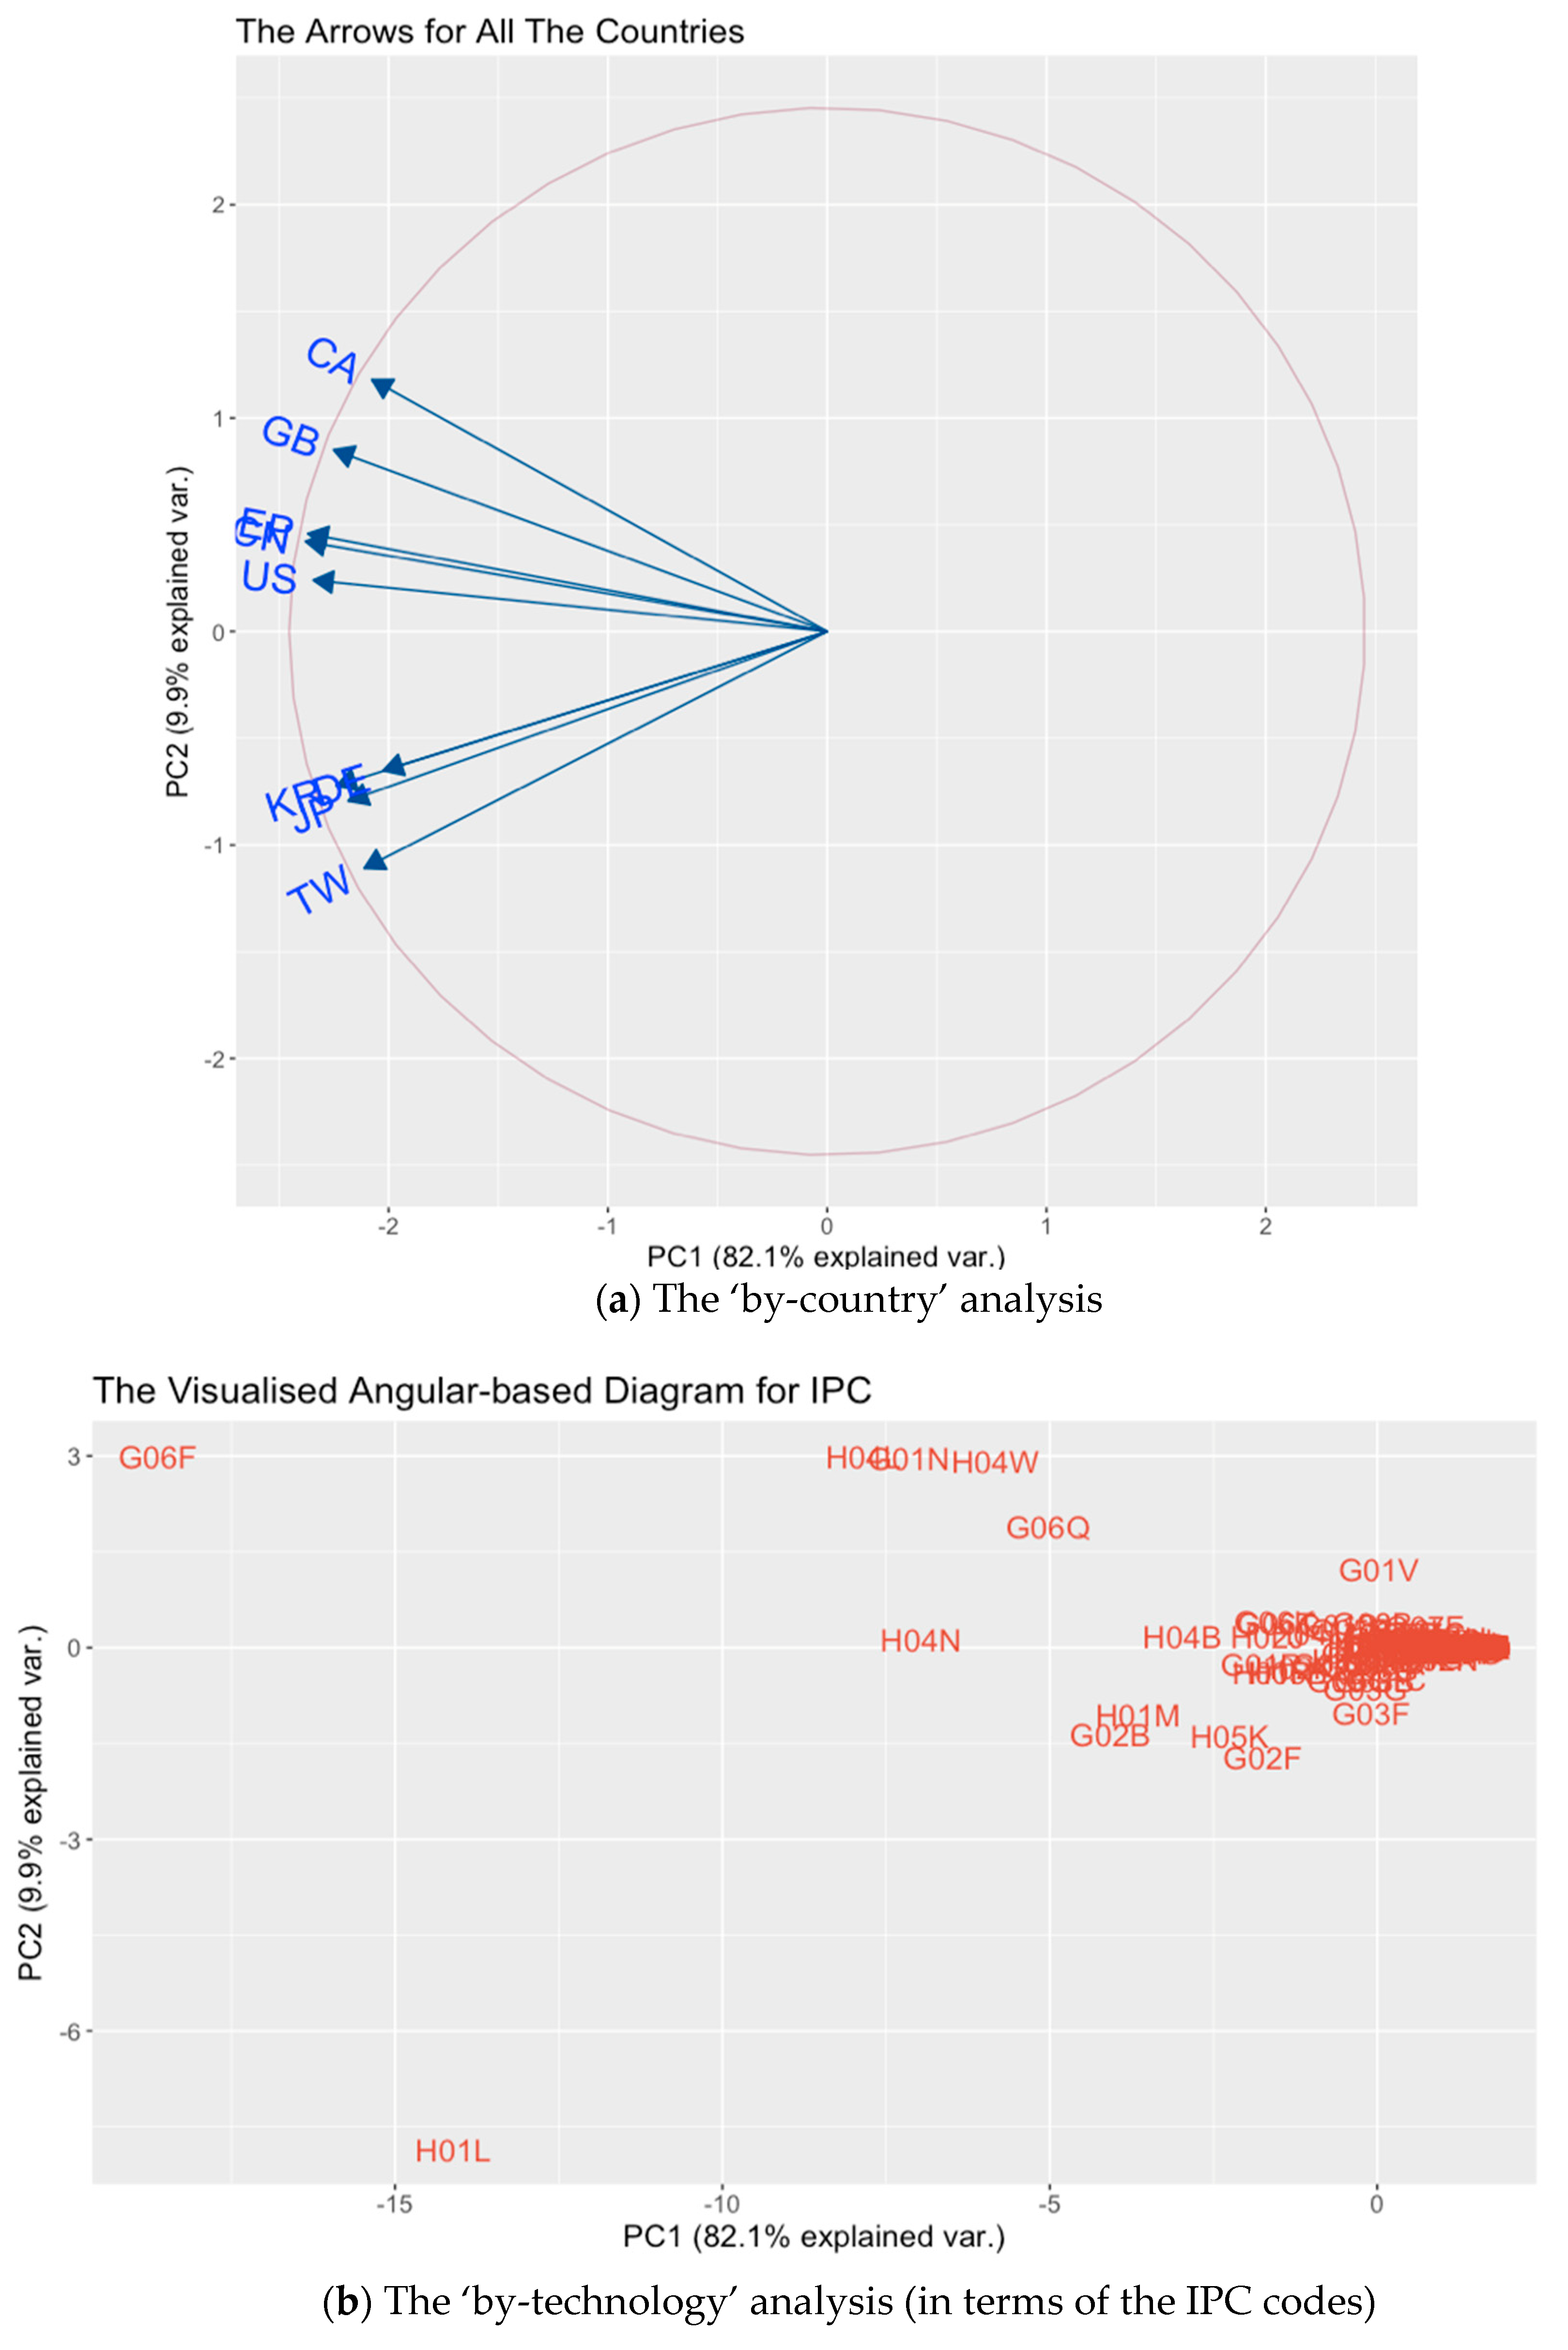
  • Two groups of technological powers are classified naturally. The destinations of the arrows for the USA, CHN, EU, GBR and CAN fall in quadrant II, while those for GER, JPN, TWN and KOR fall in quadrant III. As such, these countries are roughly classified into two distinct groups due to the divergence in the STS in each country.
  • The high-tech industries and markets in Japan and Germany are very similar. Based on the direction in which the arrows are pointing, it can be concluded that the industries and markets in JPN and GER are very similar (correlated): “There are well-known similarities between Japan and Germany - they are both manufacturers of exports which are in demand across the world, they have excellent engineering skills and leadership in manufacturing and craftsmanship” [30]. This is indeed a surprising finding. According to statements made by experienced patent attorneys and historians who are familiar with the world’s industrial history, this is perhaps because these two countries are the two leading experts in the field of precision machinery, e.g., in the machine tool and automobile industries. In addition, the collaborations between them is quite strong, so technology company patenting strategies in these two countries are extremely correlated with each other.
  • Germany plays a special role in Europe. Another surprising fact is that GER and the EU are located in different quadrants (i.e., they are classified into two different groups). This implies that the market and industrial properties of GER are totally isolated from the rest of the EU. So, many overseas technology companies would thus be interested in applying for patents in GER in order to protect their IP directly there, rather than in applying for patents first via the EU’s official patent office and then claiming their IP rights in GER later (an approach which would be more time-consuming).

4.2.2. Results from Using Angular Similarity as the Classification Basis

In the aforementioned analysis, the market and industrial orientations of the countries are classified using the quadrants. However, they can also be classified according to how close the arrow directions are between each pair of vectors in the circle. The smaller the angle between a pair is, the more correlated the two vectors are, which in turn means that the two economies in question should be more similar in terms of their high-tech industries.
Using this logic for further analysis, it is observed that the top nine technological power countries can be re-classified into three groups: (i) a main group consisting of the USA, CHN and EU; (ii) another main group consisting of JPN, GER and KOR; and (iii) an ‘outliers group’ consisting of CAN, TWN and GBR. The fact that CAN, TWN and GBR are centrifuged from the horizontal axis of the circle in the figure means that they contribute less to the first principal component (i.e., they have smaller cosine values for the first component but larger sine values for the second one). In other words, these countries are relatively unique in terms of their roles in the global high-tech market or industry, and the technological focus of each is very independent, as indicated by their diverse arrow directions. At the same time, this does not imply that the technological strength of these countries is weak. Rather, their strengths are measured by the magnitudes of the vectors (see the length of each arrow), and the lengths of all the arrows are roughly similar. This reflects the claim made in Section 4.1 that ‘no single country may dominate the others’. Therefore, within the patent databases of these ‘outlier’ countries, some niche IPs should be found. This is true because, in the real world, it is generally acknowledged, for example, that the patent database of GBR includes a considerable number of IPs regarding financial transactions, which are uncommon in other countries’ patent databases.

4.2.3. Analysing the Technological Domains Addressed by the Technological Powers

The following analysis is focused on the IPC codes, rather than the countries. To gain further knowledge, the results of the ‘by-IPC analysis’ can be scrutinised.
In Section 4.2.2, in the first main group of technological powers, the arrow for the USA is the one closest to the horizontal axis. The implication that the technologies of the USA align with the ‘mainstream’ (that is, the first principal component) is very much reflective of the common knowledge that the “USA is the leading technological power”. However, further ‘by-IPC’ observations can also be made based on this:
  • The market or industry in the USA addresses technologies related to communications and software. In Figure 7b, the arrow for the USA points to many IPC codes, including H04N (pictorial communication, e.g., TV or smartphone screens), H04B (transmission technologies, e.g., wireless transceivers), H02J (circuit arrangements or systems for supplying or distributing electric power; systems for Storing Electric Energy, e.g., batteries) and G06F (electrical digital data processing and peripherals, e.g., CPUs). This implies that the market or industry in the USA is biased toward communications and software technologies, and that the USA is the battleground for products in these areas.
  • The markets or industries in CHN and the EU are similar, and they differ from the USA from the subclass level. In the figure, it can also be observed that for the other countries in group (i), the arrows of CHN and the EU almost overlap. This implies that the technological markets or industrial properties in these two economies are almost identical. In addition to this, the IPC codes being pointed to by these two arrows are as follows: G06K (recognition/presentation of data; record carriers; handling record carriers, e.g., OCR devices), G06T (image data processing or generation, in general, e.g., computer graphics) and H04M (telephonic communications, e.g., switches or PBX). So, as can be seen, although the three countries in group (i) all exhibit a general interest in the G06 and the H04 classes, their real interests are varied because the subclasses that are focused on are different. In other words, within group (i), in general, the main interests of the technology industries vary at the subclass level.
  • Technologies pertaining to smartphone design are the main focus. If the above two findings for the group (i) countries are combined to state something other than their differences, it reflects the remarkable technological developments for smartphones during the study period. Over that time span, these countries have, coincidentally, targeted the technologies making up the market for ‘touchable mobile device with panels’, which is, in other words, the smartphone market.
  • Industries and markets for countries in group (ii) are more homogeneous, but JPN and KOR address more areas in similar fields. JPN, GER and KOR form group (ii). Unlike in group (i), in which the arrows of the EU and CHN overlap but that of the USA is somewhat farther away, the vectors of JPN, GER and KOR all almost overlap with each other in Figure 7b. This not only indicates the homogeneity of the market/industrial properties among them, but also facilitates the ‘by-IPC analysis’, because they point in an almost uniform direction. After identifying the subclasses along with the directions of these three arrows, it can be seen that the main technologies in these countries include those in the following categories: G01R (measuring electric variables; measuring magnetic variables, e.g., filters), G02B (optical elements, systems, or apparatuses, e.g., fibres), H01L (semiconductor devices; electric solid state devices not otherwise specified, e.g., LEDs), H01M (processes or means for the direct conversion of chemical into electrical energy, e.g., fuel cells), H02K (dynamo-electric machines, e.g., clutches) and H05B (electric heating; electric lighting not otherwise specified, e.g., electric heating elements). These IPCs reveal the background business logics of the high-tech industries in these countries. Without exception, all of them address the manufacturing and testing technologies for semiconductors as well as those for large dynamo-electric (motor) units. However, as both JPN and KOR have larger variances than GER (see the magnitudes instead of the directions of the arrows), it is reasonable to assume that they are focused on a larger number of other fields at the subclass level for, e.g., the optical, semiconductor and motor technologies.
  • Analysing the industrial properties for the countries in group (iii): using TWN as an example. For the rest of the countries in group (iii), as discussed previously, their high-tech industrial interests are quite diversified. As an example, the market and industry in TWN are studied. For this analytical purpose, some main IPC codes can also be identified along with the direction of the arrow for TWN. These main IPC codes include the following: H05K (printed circuits; casings or construction details of electric apparatuses; manufacture of assemblages of electrical components, e.g., mother boards), G02F (devices or arrangements, the optical operation of which is modified by changing the optical properties of the medium of the devices or arrangements for the control of the intensity, color, phase, polarization or direction of light, e.g., optical logic elements or LCD manufacturing) and H01L (as stated previously). In other words, TWN addresses its technological niches in some hardware manufacturing fields and the manufacturing processes of, e.g., PCB, optical elements and semiconductors. This observation also applies to the other two countries in this outlier group (i.e., CAN and GBR).
To provide a short summary, in this section, a novel visualised analysis for the field of patent data mining termed the ‘angular(-based) analysis method’ is presented in order to unveil critical further knowledge regarding the world’s technological powers based on the results from using the correlation matrix analytical method and the PCA modelling discussed in Section 3.4 and Section 4.1. This analysis method discovered and contributed several extensive yet insightful points for strategic settings in the studied high-tech industries worldwide. As this method was proven effective in terms of revealing valuable knowledge, further analyses can be conducted by applying this method to the patent databases of various countries in future periodical works.

4.3. The Most Important Technologies and the Associated Implications

This Section provides supplementary support to the findings regarding the ‘world’s hottest technologies’ that are presented in Figure 6 in Section 3.3. By introducing the K-means method (see Section 2.4) to classify the technologies in terms of IPC, another set of ‘most important technologies’ (i.e., most influential areas of patent investment) are identified. It is surprising to find that the results from this additional experiment can cross-validate the previous results, such that further confidence can be gained regarding the relevant findings.
In our analysis, not only is the ‘best clustering scenario’ for the source data points (of the IPC codes, as shown in Figure 7b) identified; rather, the suitable value for k, which is the optimal number that is to be set for the number of clusters, is also obtained. The results of this clustering process are also visualised in Figure 8, with the most appropriate k value set at k = 7, because the minimal value of the objective function in Equation (5) is obtained (that is, the model reaches optimality) when k = 7.
In Figure 8, each point is plotted for an IPC. The source data points of the IPC codes are classified into 7 clusters, each of which is displayed with a different colour. The texts of the IPC codes are intentionally unmarked, making the figure clearer for illustration purposes, with only the locations of them being displayed. Further scrutiny yields several implications, which are as follows:
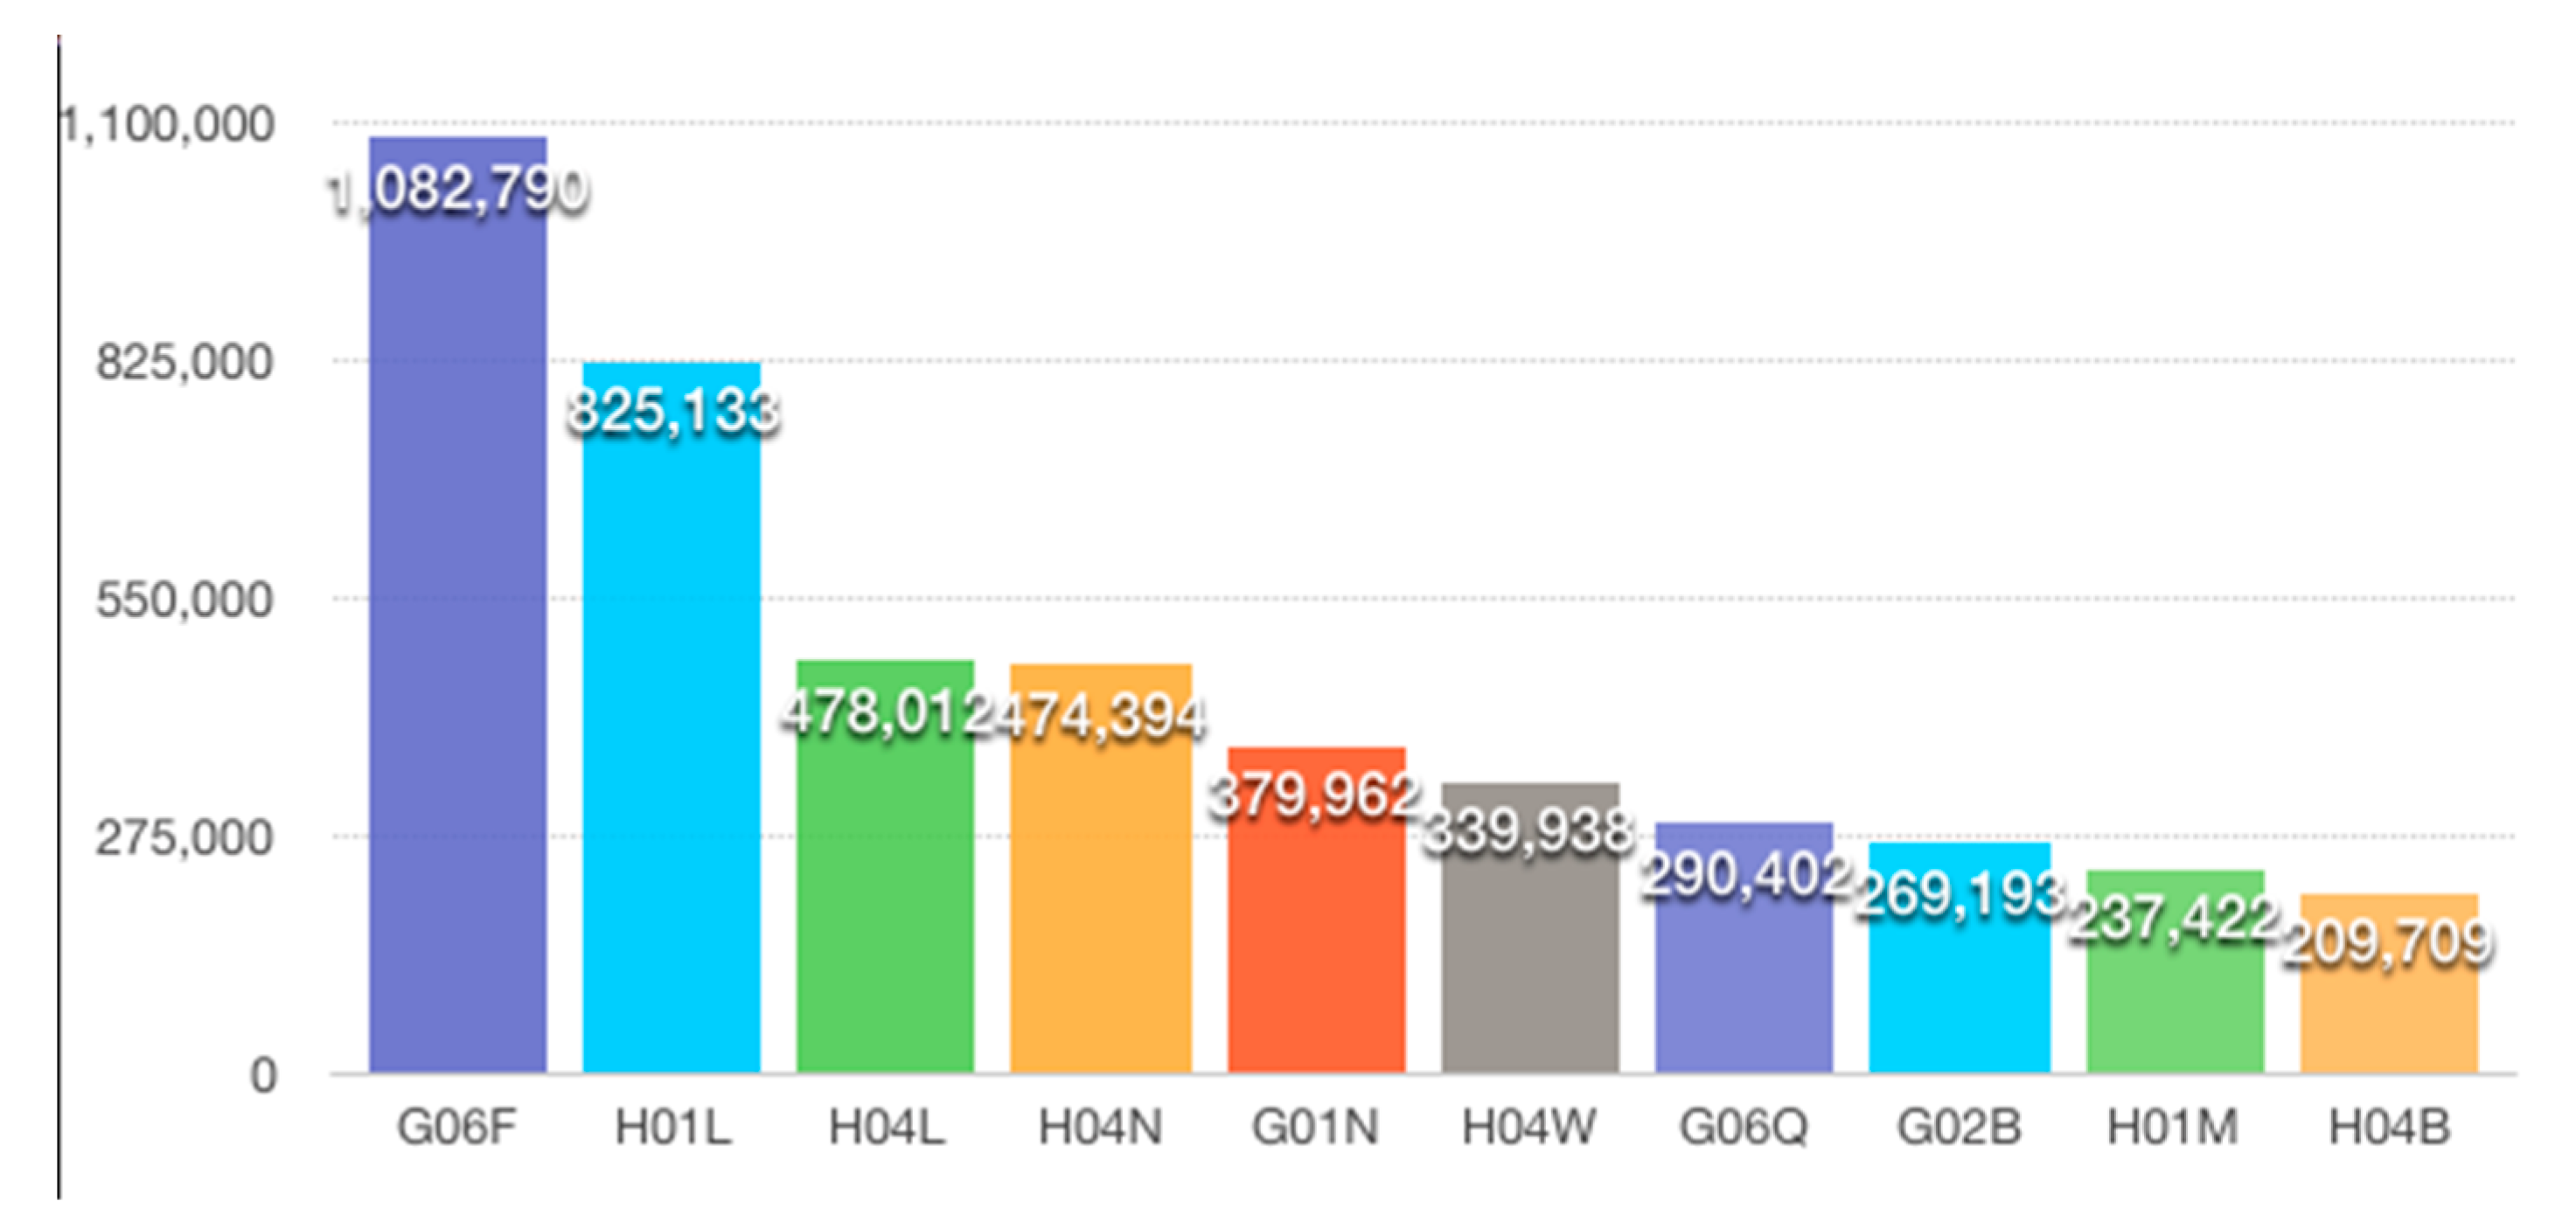
  • The most important (influencing) technologies are identified. As can be imagined, the farther a point is from the origin, the more important the technology should be (this is again indicated by the magnitude of the vector). So, the top 10 ‘most important technologies’ during the study period, at the ‘subclass’ level, are (ranked by vector length): G06F, H01L, H04L, H04N, G01N, H04W, G06Q, G02B, G06Q, H01M and H04B. As a supplementary material, the coordinate and the magnitude (Euclidean distance toward the origin) of the vectors of all IPCs are also listed and ranked in Table 3, while the abovementioned most important technologies are highlighted.
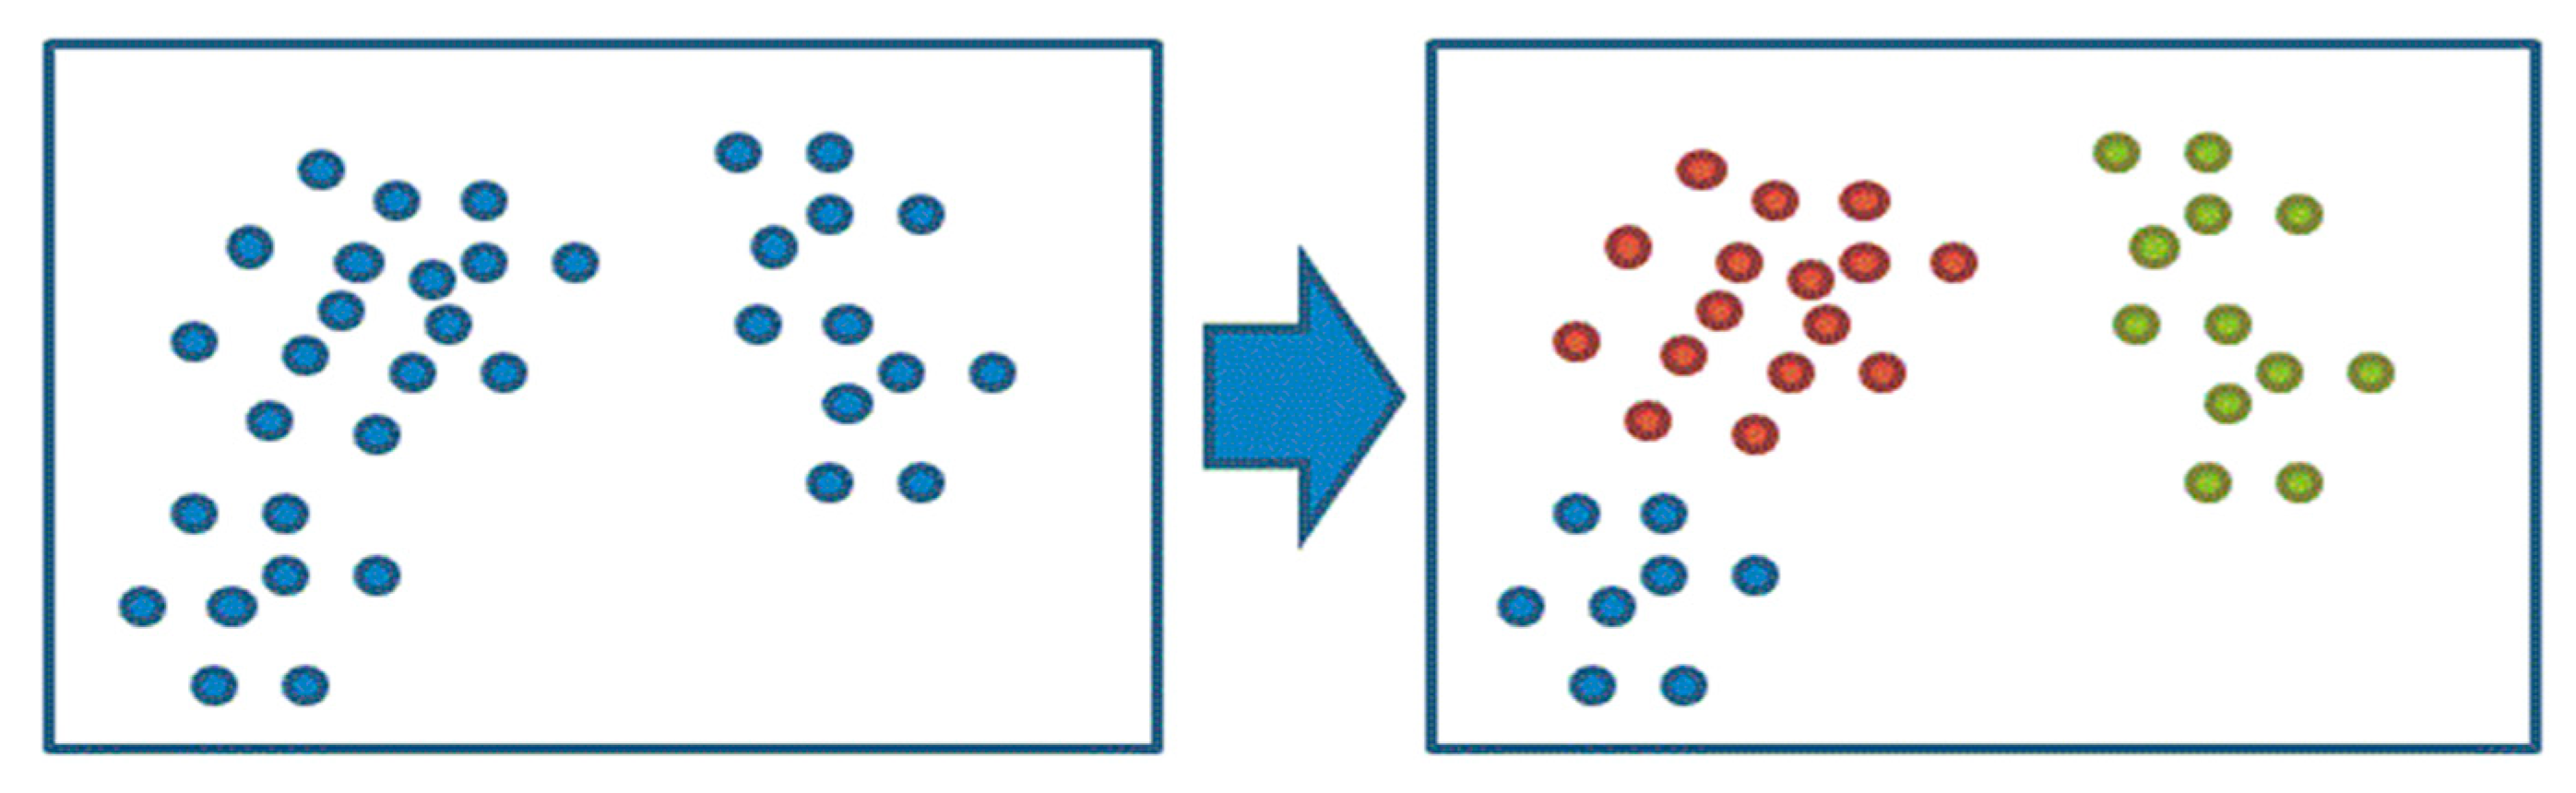
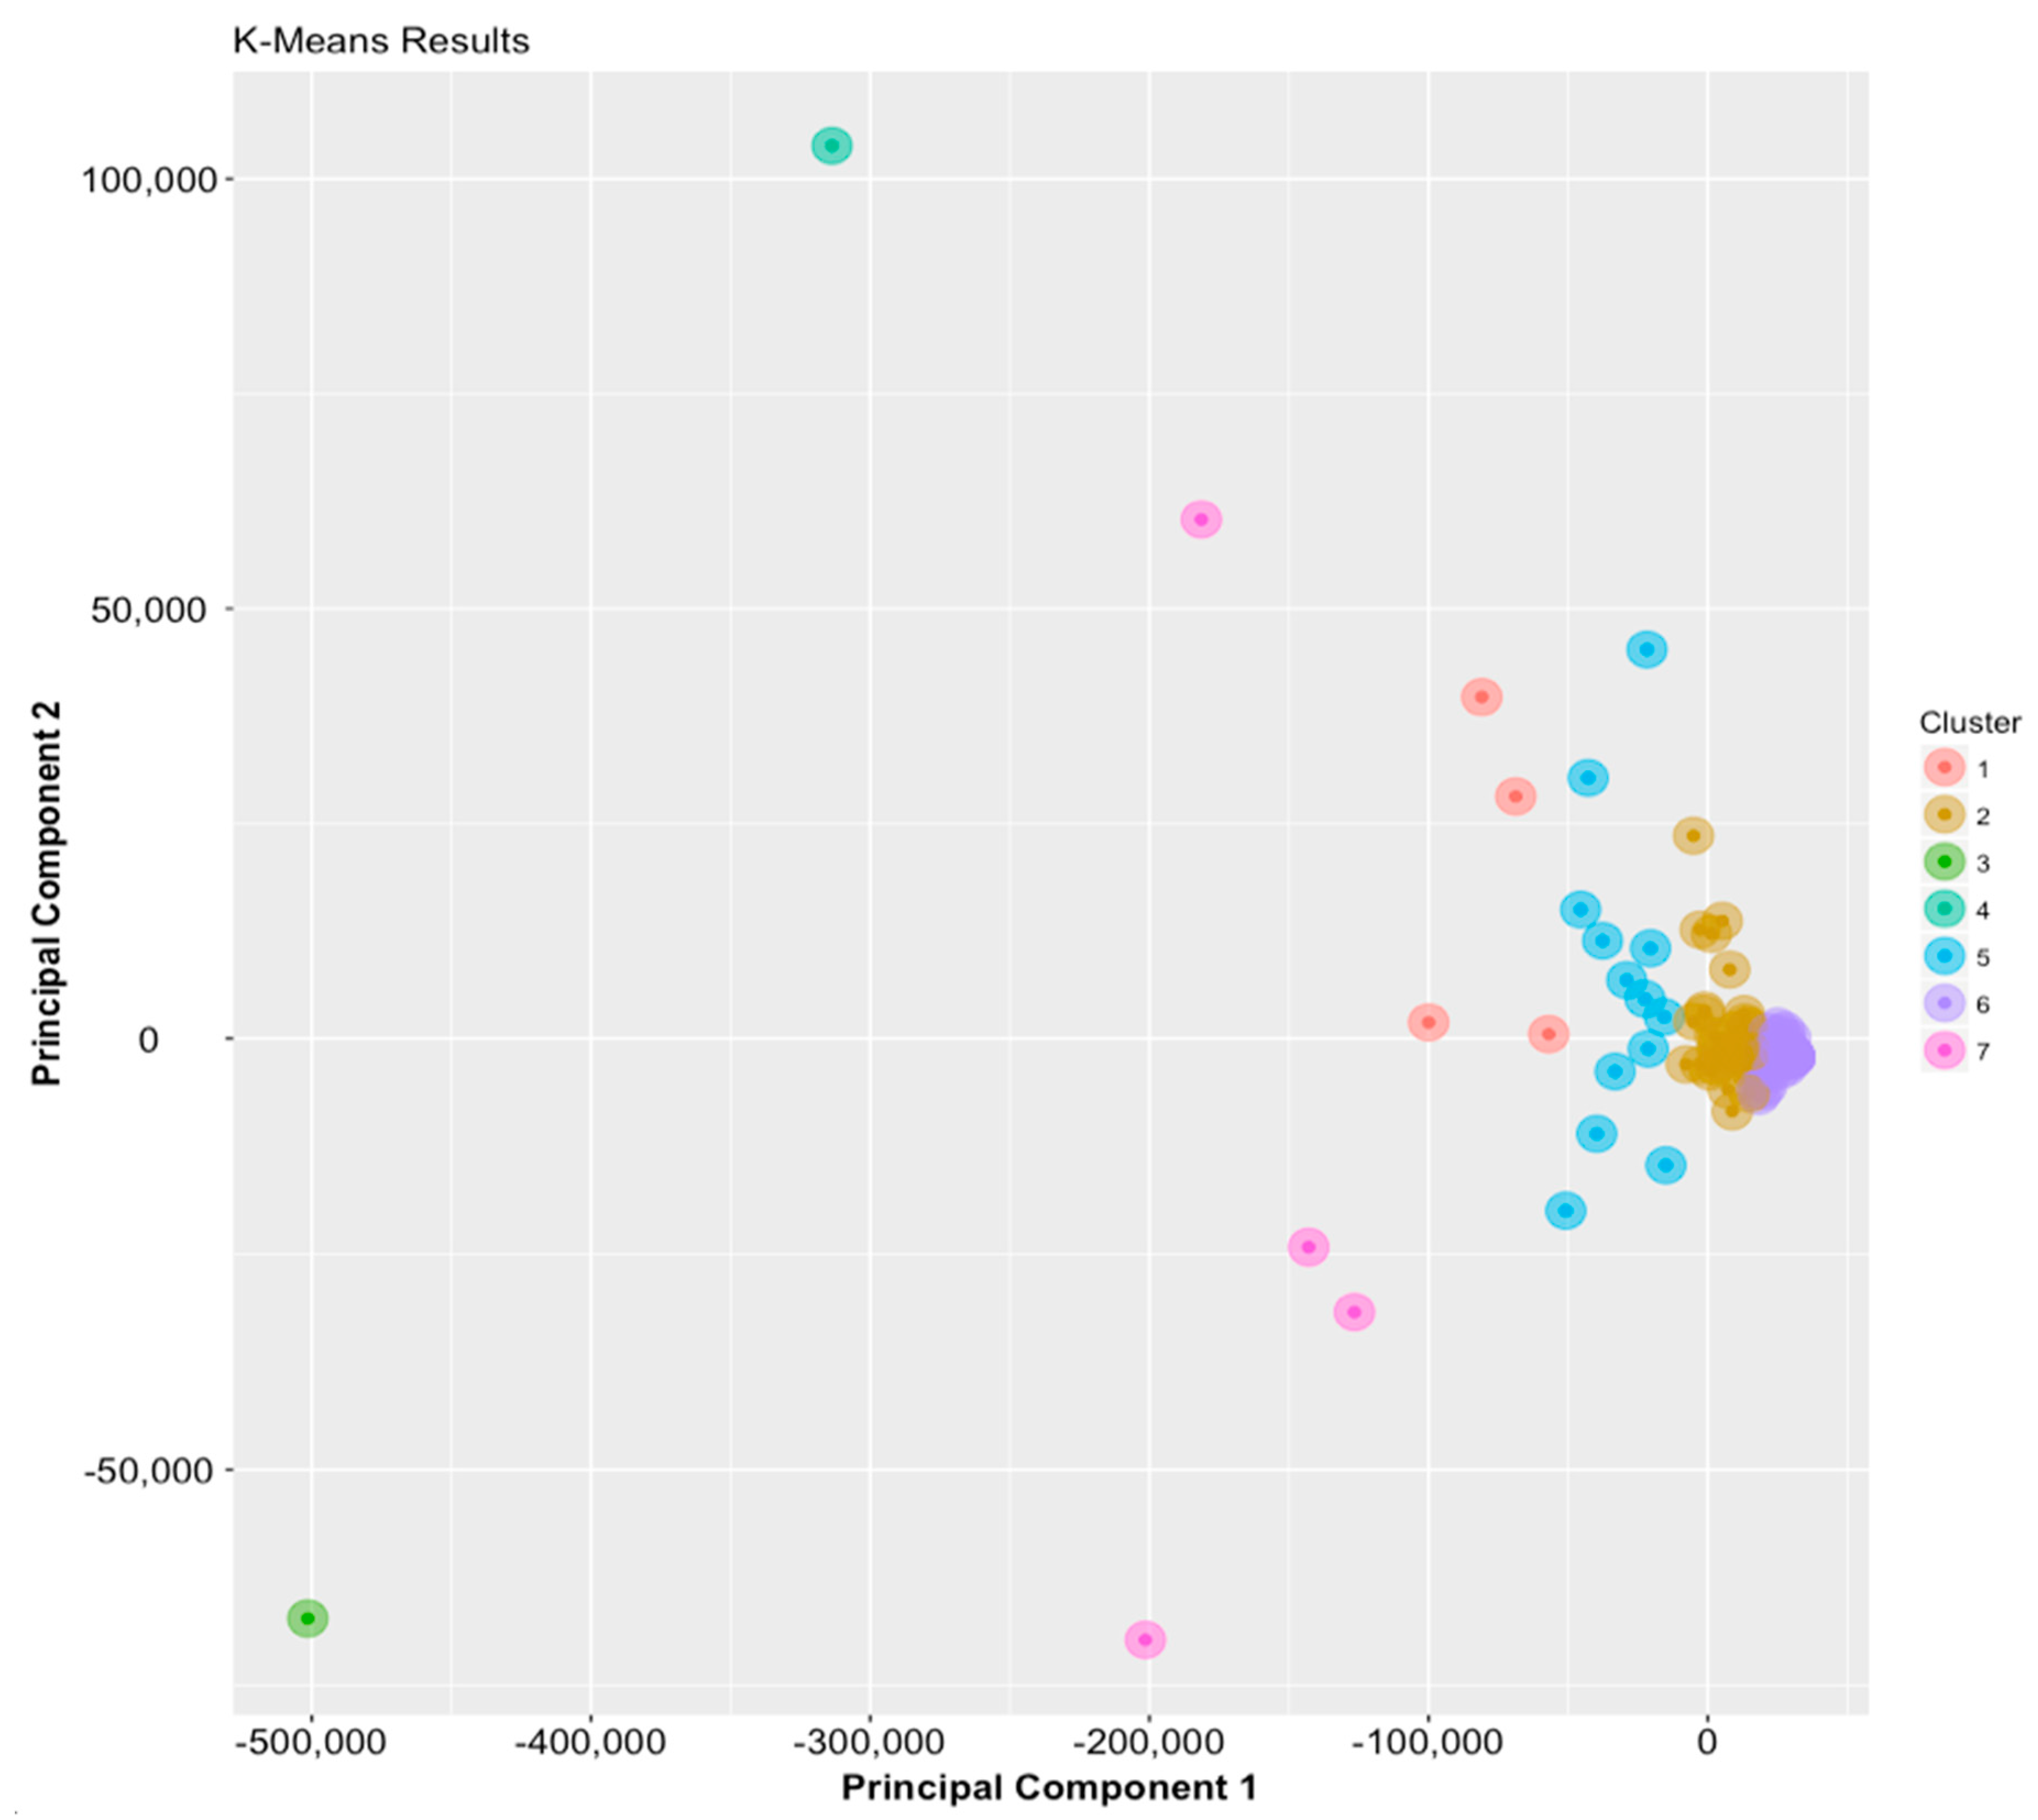
  • The set of most important technologies identified above is identical to the set of most popular (hottest) technologies, when the top 10 in either case are considered. When the order in the ‘most important technologies list’ above is ignored, it becomes a set of elements, i.e., the ‘most important technologies set’ (see the highlighted entries for the domains in Table 3). As the patterns in Table 4 are extensively analysed (and also mapped to Figure 8), these 10 technologies fall in (and perfectly match) the four clusters (i.e., CID = 1, 3, 4 and 7) that not only have the centres that are the farthest from the origin O (see the ‘Dist. to O’ column in Table 4; 505,921 for CID = 3, 330,414 for CID = 4, 163,899 for CID = 4 and 78,659 for CID = 7) but also the highest average within-group variances for the IPC codes (i.e., 51468.61 for CID = 7 and 22483.96 for CID=1, except that 0 was observed for both CID = 3 and CID = 4 since for these clusters, each contains only one technological domain). These observations of the patterns rendered by the four clusters (which consists of a few very diversified points and at the same time are very far away from the origin) may help ascertain the importance of the 10 technologies in the set. Going back to Figure 6 in Section 3.3, the ‘hottest technologies list’ also implies another ‘hottest technologies set’ regardless of the rank order. Comparing these two non-ordered sets, it is found that the ‘most important technologies set’ obtained by the K-means machine learning technique is exactly identical to the ‘hottest technologies set’ identified before by the descriptive statistical method. This is perhaps the most surprising finding of this study, and one which leads to further implications.
  • The popularity of a technology may connote its importance, and vice versa. From the fact that “in patent databases, those hottest technologies are also the most important technologies”, it can be concluded that “a technology’s importance can be roughly estimated based on its popularity because they are strongly correlated” and that “a technology’s volume of patents, when observed from the patent databases, may indicate the importance of this technology”. In other words, through this analysis, the longstanding missing link between importance and popularity (of a technology) is established and supported.
  • The ten hottest and most important technologies are, in fact, closely related to our daily lives. These technologies cover several areas that are generally relevant to our daily lives nowadays, i.e., wireless communications and networking, digital image transmission, cellular battery modules, optical lenses and fin-tech products (including data-driven decision models). The angular-based analysis in Section 4.2 also reflects the following conclusion: these areas concur with the main areas addressed by the countries in group (i) (i.e., the USA, EUR and CHN). In the PCA model established in 4.1, the estimated loading factors indicated that the USA, EUR and CHN are the most influential technological powers around the world. The set of the ten hottest and most important technological fields are exactly the IPC subclasses that these economies emphasised during the study period and in which they have applied for a considerable number of patents (indicating that the popularity of these subclasses increased).
To provide a short summary, according to the analytical results in this section, all of the technologies in Sections G and H should be clustered into 7 groups in terms of their IPC codes in the patent databases of the 9 technological power countries around the world. In addition, the 10 ‘most important technologies’ identified in this section fully concur with the 10 ‘hottest technologies’ identified in a previous section (Section 3.3). Moreover, the areas of these 10 technologies are closely related to our daily lives, and they are exactly the IPC subclasses that the technological powers in group (i) have emphasised during the study period. In this sense, the different analytical methods used and applied by this study (i.e., descriptive statistics, the correlation matrix method, the angular-based analysis and the machine-learning-based clustering) may cross-validate each other, since similar outcomes are obtained by them.

5. Conclusions

This study performed thorough data analytics of the patent databases of the nine technological power countries over a time span of nine years. Through this work, a set of empirical knowledge providing key insights to investors and DMs for/in the high-tech industries all over the world was mined.
First, after suitable data pre-processing (Section 3.1) in terms of the IPCs, the trends of the patenting activities in the high-tech patent sections (i.e., G and H) were analysed for each country (Section 3.2). The popularities of the technological domains (areas) were also analysed with regard to each IPC code prefix (until the subclass level) in terms of volume, and the top 10 ‘hottest technologies’ were identified (Section 3.3). The spectrum of technical strengths (STS) of each technological power was calculated as a vector. This vector is an element-wise ordered vector in which each element represented the strength of the country in a certain technological area. The correlation matrix analysis method was used to identify the correlations between all the STS pairs when each STS vector was treated as a statistical variable, while knowledge about the homogeneity and heterogeneity in the industry or market among these countries was exploited (Section 3.4).
Second, in terms of PCA modelling, it is understood that up to 92% of the total variance which is present in the intermediate data (i.e., the STSs) can be resolved by merely introducing two principal components (Section 4.1). As further explorations drew many implications pertaining to the global patenting strategies of the high-tech companies, and the markets and industries in the technological power countries were analysed in more detail through the angular analysis (Section 4.2), PCA modelling and the subsequent angular-based analysis were shown to be the effective methods when utilising the cross-national patent databases.
Third, the set of discovered knowledge may support the optimal yet precise decisions of investors and company DMs, or even the policy makers of a country. For example, the analysis in Section 4.2.3 revealed that in the study period, the patented areas were closely related to the development of smartphones. A major part of these technological areas patented by the countries in group (i) is related to the market of ‘touchable mobile device with panels’, which is, in other words, the ‘smartphone’ market. This observation also applied to the clustering analysis in Section 4.3, wherein wireless communications and networking, digital image transmission, cellular battery module, optical lens and fin-tech technologies, all of which are relevant to smartphones, were identified as the ‘most important technologies’. In any case, by referencing these findings, a cogent yet plausible decision process is guaranteed for either making investment decisions in the stock market or for parsimoniously allocating the limited resources of a company within the emphasised technological domains.
As this study also applied the K-means method to conduct a clustering analysis for all the patents in Sections G and H (Section 4.3), the results showed that partitioning the relevant areas into 7 clusters is the optimal status. However, this was not as important as the other finding that the non-ordered set of the top 10 ‘most important technologies’ identified using this recently popular unsupervised machine learning method totally concurs with the set of the top 10 ‘hottest technologies’ identified previously using the traditional statistical method. This finding is surprising and also critical, in that although the two methods are intrinsically dissimilar, their results nonetheless appear to cross-validate each other.
With these cogent results, the interdisciplinary application of the methods may form a confident yet systematic methodological flow for future applications. This can be a safe ground for mining similar matters in other patent sections that are irrelevant to electronics or IT. Other than patentography, the possible analytical targets of application include, for example, data sets which pertain to supply chain management (SCM) [31], aeronautics [32], or engineering [33] (e.g., the building information management (BIM) data), as they are quality data sets as patent databases. Finally, even though the proposed methodological flow only utilises ‘data mining’ and completely ignores the perspectives of ‘mind mining’ for data-driven decision making (DDDM, or D3M) [34], it should also pave the way for relevant future research.

Author Contributions

conceptualization, methodology, writing—original draft preparation: Z.-Y.Z. & C.-C.H.; software, data curation, visualization, project administration: C.-C.H.; validation, writing—review and editing, supervision, funding acquisition: Z.Y.Z.

Funding

The authors sincerely thank the following funding institutions for their grants in supporting this research: Ministry of Science and Technology, Taiwan (No.: MOST107-2410-H-992-046); TMU Research Project, Taipei Medical University (No. TMU105-AE1-B46).

Acknowledgments

The authors also sincerely thank Ying-Chiang Cho, CEO of Taiwan Data Science Co. Ltd., who allowed Cheng-Chien Hsu (who is the Chair Data Officer (CDO) of the company) to continue co-working and complete this study after his industrial commitment.

Conflicts of Interest

The authors declare no conflict of interest.

Appendix A

A supplementary argument here is that these databases can avoid the interferential problems of human prejudices and/or information vagueness (e.g., in comparison with news media). Compared to other datasets that are more widely known, e.g., the rumor data streams of social networks or the financial data cited in e-news reports, patent databases constitute more suitable sources through which to scrutinize actual technological advances in terms of innovation and IP. Such databases provide a high-quality and well-organised basis for understanding the core business thinking and technological strategies of high-tech companies in particular and countries in general.

Appendix B

When a new strategic decision is made to act at this very early stage, the expected costs of developing the new items are relatively low because the necessary resources can be utilised more appropriately and the lead time for related business activities (i.e., design, sourcing and prototyping) can be reduced before the other phases of the supply chain (i.e., manufacturing, logistics and retailing/marketing) are activated. For example, the making of strategic decisions at the very early product development stage provides effective support for associated patent investment (patenting) decisions (e.g., decisions regarding the countries in which to seek patents).

Appendix C

It should be noted, with regard to the EU, that one of the styles applied involves first making an application to the European Patent Office (EPO). Then, if the patent is issued by the EPO, it would be optionally sent to the patent offices of the contracted countries (e.g., Belgium, Germany, France, Norway, England and Switzerland) based on the applicant’s marketing strategies in order to obtain IP protection in these countries. Otherwise, aside from those individual countries within it, the EU itself has become a generally recognised economy throughout the world, so in our study it is treated as a single entity, and the database of the EPO is also sourced.

Appendix D

It can be seen that, after the financial crisis, the curve for CHN entered a ‘gold cross’ in 2010, and then further surpassed the curves of the USA and JPN in 2011. As the curve for CHN retained a high rate of annual increase in the subsequent years, the market in CHN was increasingly addressed by relevant companies during the period, as these companies shifted their strategic patenting actions in Asia from JPN to CHN. This is shown in Fig. 5 in that for every year after 2010, the annual increase (in patenting activities) in CHN is roughly consistent with the annual decrease in JPN. In other words, during that period, companies thought that applying for patents in JPN was not as effective as applying for patents in CHN. However, this only happened for their patent investments in East Asia. That is, outside of East Asia, companies did not reduce the volume of their patenting activities in the other countries, nor did they transfer the applications in one country to any other country, because there was no ‘cross’ between any pair of curves for these other countries.

Appendix E

G06F: ELECTRIC DIGITAL DATA PROCESSING; H01L: SEMICONDUCTOR DEVICES; ELECTRIC SOLID STATE DEVICES NOT OTHERWISE PROVIDED FOR <a list of things>; H04L: TRANSMISSION OF DIGITAL INFORMATION, e.g., TELEGRAPHIC COMMUNICATION; H04N: PICTORIAL COMMUNICATION, e.g., TELEVISION; G01N: INVESTIGATING OR ANALYSING MATERIALS BY DETERMINING THEIR CHEMICAL OR PHYSICAL PROPERTIES; H04W: WIRELESS COMMUNICATION NETWORKS; G06Q: DATA PROCESSING SYSTEMS OR METHODS, SPECIALLY ADAPTED FOR ADMINISTRATIVE, COMMERCIAL, FINANCIAL, MANAGERIAL, SUPERVISORY OR FORECASTING PURPOSES; SYSTEMS OR METHODS SPECIALLY ADAPTED FOR ADMINISTRATIVE, COMMERCIAL, FINANCIAL, MANAGERIAL, SUPERVISORY OR FORECASTING PURPOSES, NOT OTHERWISE PROVIDED FOR <a list of things>; G02B: OPTICAL ELEMENTS, SYSTEMS, OR APPARATUS; H01M: PROCESSES OR MEANS, e.g., BATTERIES, FOR THE DIRECT CONVERSION OF CHEMICAL ENERGY INTO ELECTRICAL ENERGY; H04B: TRANSMISSION

References

  1. Kucharavy, D.; De Guio, R. Application of S-shaped curves. Procedia Eng. 2011, 9, 559–572. [Google Scholar] [CrossRef] [Green Version]
  2. Forster, R.N. Assessing technological threats. Res. Manag. 1986, 29, 17–20. [Google Scholar]
  3. Breitzman, A.F.; Narin, F. Method and apparatus for choosing a stock portfolio, based on patent indicators. U.S. Patent 6,175,824, 16 January 2001. [Google Scholar]
  4. Thomas, P.; Narin, F. System and method for producing technology-based price targets for a company stock. U.S. Patent 6,832,211, 14 December 2004. [Google Scholar]
  5. Lin, H.-Y. A Model and Platform for Patent Search/Valuation. Master’s Thesis, Department of Industrial Engineering and Engineering Management, National Tsing-Hua University, Hsinchu City, Taiwan, 2005. [Google Scholar]
  6. Narin, F.; Albert, M.; Kroll, P.; Hicks, D. Inventing Our Future—The Link between Australian Patenting and basic Science; CHI Report; Australian Government: Canberra, ACT, Australia, 2000.
  7. Ernst, H. Patent portfolios for strategic R&D planning. J. Eng. Technol. Manag. 1998, 15, 279–308. [Google Scholar]
  8. Ernst, H. Patent information for strategic technology management. World Pat. Inf. 2003, 25, 233–242. [Google Scholar] [CrossRef]
  9. Allison, J.R.; Lemley, M.A.; Moore, K.A.; Trunkey, R.D. Valuable Patents. Georget. Law. J. 2003, 92, 435. [Google Scholar] [CrossRef]
  10. Pearson, K. On lines and planes of closest fit to systems of points in space. Philos. Mag. 1901, 2, 559–572. [Google Scholar] [CrossRef]
  11. Hotelling, H. Analysis of a complex of statistical variables into principal components. J. Educ. Psychol. 1933, 24, 417–441. [Google Scholar] [CrossRef]
  12. Zhuang, Z.Y.; Ouhyoung, M. Novel multiresolution metrics for content-based image retrieval. In Proceedings of the Pacific Conference on Computer Graphics and Applications, In pg (Pacific Graphics), Seoul, KOREA, 13–16 October 1997; IEEE: Piscataway, NJ, USA, 1997; p. 105. [Google Scholar]
  13. Ho, N.; Jarvis, R. Vision based global localisation using a 3D environmental model created by a laser range scanner. In Proceedings of the IEEE/RSJ International Conference on Intelligent Robots and Systems, IROS 2008, Nice, France, 22–26 September 2008; IEEE: Piscataway, NJ, USA, 2008; pp. 2964–2969. [Google Scholar]
  14. Lee, S.; Yoon, B.; Park, Y. An approach to discovering new technology opportunities: Keyword-based patent map approach. Technovation 2009, 29, 481–497. [Google Scholar] [CrossRef]
  15. Hartigan, J.A.; Wong, M.A. Algorithm AS 136: A k-means clustering algorithm. J. R. Stat. Soc. Ser. C (Appl. Stat.) 1979, 28, 100–108. [Google Scholar] [CrossRef]
  16. Celebi, M.E.; Kingravi, H.A.; Vela, P.A. A comparative study of efficient initialization methods for the k-means clustering algorithm. Expert Syst. Appl. 2013, 40, 200–210. [Google Scholar] [CrossRef] [Green Version]
  17. Injadat, M.; Salo, F.; Nassif, A.B. Data mining techniques in social media: A survey. Neurocomputing 2016, 214, 654–670. [Google Scholar] [CrossRef]
  18. Kim, G.J.; Park, S.S.; Jang, D.S. Technology forecasting using topic-based patent analysis. J. Sci. Ind. Res. 2015, 74, 265–270. [Google Scholar]
  19. Oliveira, G.V.; Coutinho, F.P.; Campello, R.J.; Naldi, M.C. Improving k-means through distributed scalable metaheuristics. Neurocomputing 2017, 246, 45–57. [Google Scholar] [CrossRef]
  20. Raschka, S. Python Machine Learning; Packt Publishing Ltd.: Birmingham, UK, 2015. [Google Scholar]
  21. Kassambara, A. Practical Guide to Cluster Analysis in R; CreateSpace: North Charleston, SC, USA, 2017. [Google Scholar]
  22. World Intellectual Property Organization. International Patent Classification. Available online: http://www.wipo.int/classifications/ipc/en/ (accessed on 4 November 2017).
  23. Wittstruck, D.; Teuteberg, F. Understanding the success factors of sustainable supply chain management: empirical evidence from the electrics and electronics industry. Corp. Soc. Responsib. Environ. Manag. 2012, 19, 141–158. [Google Scholar] [CrossRef]
  24. Merritt, R. Smartphone, Samsung in Trouble. 2016. Available online: https://www.eetimes.com/author.asp?section_id=36&doc_id=1325927 (accessed on 16 December 2017).
  25. Kim, W.C.; Mauborgne, R. Blue Ocean Strategy: How to Create Uncontested Market Space and Make the Competition Irrelevant; Harvard Business School Press: Boston, MA, USA, 2004. [Google Scholar]
  26. Chi, L.-P.; Zhuang, Z.-Y.; Fu, C.-H.; Huang, J.-H. A Knowledge Discovery Education Framework Targeting the Effective Budget Use and Opinion Explorations in Designing Specific High Cost Product. Sustainability 2018, 10, 2742. [Google Scholar] [CrossRef]
  27. Zhuang, Z.-Y.; Lin, C.-C.; Chen, C.-Y.; Su, C.-R. Rank-Based Comparative Research Flow Benchmarking the Effectiveness of AHP–GTMA on Aiding Decisions of Shredder Selection by Reference to AHP–TOPSIS. Appl. Sci. 2018, 8, 1974. [Google Scholar] [CrossRef]
  28. Husson, F.; Lê, S.; Pagès, J. Exploratory Multivariate Analysis by Example Using R; Chapman and Hall/CRC: Boca Raton, FL, USA, 2017; pp. 11–51. [Google Scholar]
  29. Everitt, B.; Hothorn, T. An Introduction to Applied Multivariate Analysis with R; Springer Science & Business Media: Berlin, Germany, 2011; pp. 71–72. [Google Scholar]
  30. Rudlin, P.; 4 Differences between Japanese and German Approaches to Work, Communication and Customer Service. Official Website of Japan Intercultural Consulting. 2014. Available online: https://www.japanintercultural.com/en/blogs/default.aspx?blogid=240 (accessed on 6 May 2018).
  31. Bai, C.; Sarkis, J. Integrating sustainability into supplier selection: A grey-based TOPSIS analysis. Technol. Econ. Dev. Econ. 2018, 24, 2202–2224. [Google Scholar] [CrossRef]
  32. Ignatius, J.; Tan, T.S.; Dhamotharan, L.; Goh, M. Deregulation control by mergers and acquisitions: A game theoretic analysis of the Chinese airline industry. Technol. Econ. Dev. Econ. 2018, 24, 2277–2294. [Google Scholar] [CrossRef]
  33. Gunduz, M.; Yahya, A.M.A. Analysis of project success factors in construction industry. Technol. Econ. Dev. Econ. 2018, 24, 67–80. [Google Scholar] [CrossRef]
  34. Zhuang, Z.-Y.; Su, C.-R.; Chang, S.-C. The effectiveness of IF-MADM (intuitionistic-fuzzy multi-attribute decision-making) for group decisions: Methods and an empirical assessment for the selection of a senior centre. Technol. Econ. Dev. Econ. 2019, 25, 322–364. [Google Scholar] [CrossRef]
Figure 1. The S-shaped model describing the different stages of technological development.
Applsci 09 02432 g001
Figure 2. The fundamental logic of the K-means classification method (uniform colour: non-clustered data points; red, green and blue: data points in clusters 1, 2 and 3, respectively).
Applsci 09 02432 g002
Figure 3. The coding style of IPC using the “G11C 13/04” code as an example.
Applsci 09 02432 g003
Figure 4. Illustrative example for matching the IPC codes.
Applsci 09 02432 g004
Figure 5. Patenting activities carried out by the main technological powers: An analysis across the time span.
Applsci 09 02432 g005
Figure 6. Top 10 ‘hottest technologies’ in the 9 technological power countries. (see Appendix E for the related technological domains as are revealed by these IPCs)
Applsci 09 02432 g006
Figure 7. The angular analysis results.
Applsci 09 02432 g007
Figure 8. The clusters of technologies.
Applsci 09 02432 g008
Table 1. The main indicators in the systematic patent-indicator framework.
IndicatorDefinitionMeaning
Patent ActivityThe number of patent applicationsThe level of R&D activities
Share of Granted PatentsGranted patents/patent activityHigher technological capacity
Technological ScopeDiversity and number of IPC classes aTechnological quality of patent applications
International ScopeSize of patent family and share of triad (US, JP and EPO) patents of patent activitiesEconomic quality of patent applications
Technology ShareThe ratio of patent activity to patent applications of all competitors in technological fieldCompetitive technological position in technological field
Relative Technology SharePatent strength/maximum patent strength in technological fieldDistance of firm i from the technological leader in technological field
Citation RatioThe number of patent citations against the number of patent applicationsThe number of citations received by a patent in subsequent patent documents can also be viewed as a sign for an economically important invention
Patent Growth RateAverage growth of patent applications per technological field/average growth of patent applications in all technological fields Measures the average growth of patent applications in a technological field relative to the average growth of total patent applications
a: IPC is a standard style for coding each patent, as defined by the WIPO since Oct 7, 1975. With this coding scheme, each patent is coded in a tier-wise manner with a section, class, subclass, main group and group. This enables the classification and ensures a fast indexing of/to the patent database. For more detail, please check Section 3.1.
Table 2. Correlation between each pair of technology powers in terms of the STS vectors.
Country vs. Country aCANCHNGEREUGBRJPNKORTWNUSA
CAN1.0000.8920.6070.9000.9210.6020.6510.4950.812
CHN0.8921.0000.7780.9810.9340.7960.8140.7570.939
GER0.6070.7781.0000.7500.6360.7750.7650.7700.683
EU0.9000.9810.7501.0000.9320.8010.8250.7370.924
GBR0.9210.9340.6360.9321.0000.7110.7320.6460.940
JPN0.6020.7960.7750.8010.7111.0000.8950.8790.810
KOR0.6510.8140.7650.8250.7320.8951.0000.9250.839
TWN0.4950.7570.7700.7370.6460.8790.9251.0000.818
USA0.8120.9390.6830.9240.9400.8100.8390.8181.000
a: The list is alphabetically ordered. CAN: Canada; CHN: People’s Republic of China; GER: Germany; EU: Europa or European Union; GBR: United Kingdom; JPN: Japan; KOR: South Korea; TWN: Taiwan or Republic of China; USA: United States of America).
Table 3. Coordinates, magnitudes and ranks of the vectors of the IPCs.
IPC X Y MagnitudeRankCIDIPC X Y MagnitudeRankCID
G01B(−7739.54249,−2990.0055)8297.0266331172G10H(27655.8573,−587.916233)27662.10561616
G01C(−1329.38785,2868.29038)3161.3860511272G10K(25965.5279,659.5932016)25973.9043706
G01D(15437.23071,−1385.6492)15499.294041012G10L(11396.9956,−1763.38027)11532.606741102
G01F(16599.97106,−3330.2129)16930.72228952G11B(−2718.9937,12657.45776)12946.202671072
G01G(25998.48537,−2635.8023)26131.75645696G11C(−2496.9105,−3048.66589)3940.6758111222
G01H(27305.67738,−2518.2019)27421.54915646G12B(30075.1376,−2430.79408)30173.21094396
G01J(15634.0645,−3716.5686)16069.74969972G21B(30670.9816,−2242.13112)30752.82532306
G01K(20725.58222,−3920.1657)21093.06657876G21C(26149.9783,−451.100656)26153.8689686
G01L(15842.32504,−2556.2687)16047.23566982G21D(30183.0829,−1602.49796)30225.59331376
G01M(7216.719486,−5916.9472)9332.2721661162G21F(27961.3409,19.06400515)27961.34738586
G01N(-142953.398,-24215.979)144989.957257G21G(30504.227,−2259.45869)30587.792336
G01P(22347.27428,−1413.0689)22391.90549826G21H(30908.8917,−2227.95374)30989.08454266
G01R(−39770.4633,−11076.975)41284.2478155G21J(31065.8187,−2193.79868)31143.18296196
G01S(845.8445049,−3838.6185)3930.7054261232G21K(28106.4215,−2034.36734)28179.94992566
G01T(23754.57091,−176.0965)23755.22361776H01B(−1109.918,3266.971376)3450.3651881262
G01V(17561.41426,−6018.3175)18564.03556946H01C(27703.4148,−1911.98168)27769.31515606
G01W(29451.13564,−2092.9604)29525.41065486H01F(2603.68973,279.855573)2618.6865661282
G02B(-80948.5454,39723.398)90169.9248981H01G(13015.1155,2843.146727)13322.038691062
G02C(24583.91924,−1604.1999)24636.2039746H01H(3396.75559,−1382.2747)3667.2376391252
G02F(−42838.6842,30314.3612)52479.64707125H01J(3896.68445,−159.214022)3899.9357431242
G03B(−5103.82769,23594.534)24140.23798762H01K(30238.2249,−2271.73426)30323.4401366
G03C(30059.34145,−2309.5555)30147.93617406H01L(-313673.11,103838.8805)330413.881624
G03D(30951.59551,−2197.8116)31029.52852256H01M(-68784.185,28167.24428)74328.0411891
G03F(1316.855449,12186.4598)12257.402281082H01P(23203.034,−2615.67061)23350.00037786
G03G(−21771.1333,45247.0651)50212.34059135H01Q(5988.77812,−2998.48249)6697.4891261182
G03H(28890.25315,−1338.5879)28921.24729526H01R(−21337.623,−1185.65121)21370.53891855
G04B(27321.28884,−2155.2885)27406.16888656H01S(14456.6571,1431.728887)14527.380461032
G04C(29854.03698,−1650.9209)29899.6499426H01T(27952.3944,−1107.39024)27974.32157576
G04F(30279.31421,−2218.722)30360.49401346H02B(22552.7739,−4013.51932)22907.11568816
G04G(28699.14613,−1290.8128)28728.16016536H02G(14084.7727,1053.909753)14124.147691042
G04R(30519.86049,−2181.7256)30597.74192326H02H(14847.1336,−6422.81194)16176.83183962
G05B(−14983.9822,−14732.006)21013.13245885H02J(−33190.604,−3833.12746)33411.21123175
G05D(8775.493132,−8464.6522)12192.604971092H02K(−15602.097,2510.887033)15802.84686995
G05F(19939.99616,−3849.2202)20308.12506916H02M(−5010.0528,1986.169001)5389.3873611192
G05G(28611.20497,−1747.9788)28664.55093546H02N(21092.2218,−1461.87299)21142.82134866
G06C(30976.91704,−2212.0533)31055.79767236H02P(9742.49238,934.3646014)9787.1954591142
G06D(31066.92244,−2194.2993)31144.31922186H02S(25492.8284,−3810.22962)25775.99949716
G06E(30995.94442,−2220.3759)31075.3703226H03B(27477.4262,−797.302724)27488.99133636
G06F(-501431.002,-67253.564)505921.033213H03C(30730.0124,−2220.73809)30810.14995296
G06G(28351.70914,−3296.0209)28542.65518556H03D(29646.9243,−2314.25207)29737.11288466
G06J(31057.26691,−2196.731)31134.85916206H03F(20536.6451,−1522.00491)20592.96705896
G06K(−50830.7843,−20024.291)54632.78193115H03G(26913.6299,−1807.49597)26974.25659666
G06M(30119.74722,−2198.19)30199.8545386H03H(21805.3697,739.1366687)21817.89337836
G06N(19653.48715,−6106.7052)20580.36456906H03J(29704.2662,−1596.50929)29747.13885456
G06Q(-99988.7346,1882.52409)100006.454571H03K(9430.22879,−2250.98438)9695.1609451152
G06T(−37689.9297,11381.8023)39371.00743165H03L(24158.6062,−3020.41433)24346.68677756
G07B(27895.48698,−1232.4205)27922.69783596H03M(15447.5895,−1489.45239)15519.229631002
G07C(21029.44645,−5576.1675)21756.17756846H04B(-56960.215,520.0938859)56962.58903101
G07D(25037.33654,1375.3137)25075.08143736H04H(26124.715,−1583.5866)26172.66668676
G07F(19790.65504,−3016.2309)20019.18269926H04J(13309.7489,1900.397057)13444.735931052
G07G(27592.59151,930.538057)27608.27787626H04K(29667.1677,−2686.66189)29788.57146446
G08B(2872.401218,−3253.925)4340.3590371212H04L(-201428.8,-69740.2774)213160.191537
G08C(18398.70175,−6673.6675)19571.66483936H04M(−29050.345,6799.674282)29835.51771435
G08G(7877.307342,8033.669)11251.302531112H04N(-181399.73,60377.27726)191183.886547
G09B(10492.86486,−889.15004)10530.470111132H04Q(10765.7121,−1232.87073)10836.075271122
G09C(29673.65858,86.0808862)29673.78343476H04R(5017.21898,−1525.89996)5244.1259491202
G09D(30953.4895,−2213.0528)31032.50094246H04S(28966.8208,−1489.58758)29005.09572516
G09F(5201.062408,13671.5278)14627.430471022H04W(-126554.54,-31715.9776)130468.212667
G09G(−22441.5606,4603.9677)22908.95372805H05B(−20516.906,10493.45439)23044.65253795
G10B(30840.35251,−1786.3533)30892.0443286H05C(30999.2393,−2213.05014)31078.13425216
G10C(30599.31248,−2126.8488)30673.13825316H05F(29861.1899,−1980.35381)29926.78501416
G10D(28896.50376,−2530.903)29007.12671506H05G(28961.9364,−2162.02998)29042.52287496
G10F(30889.52961,−2095.7007)30960.53942276H05H(25685.3922,377.4390402)25688.16521726
G10G(30291.8942,-1748.4749)30342.314356H05K(-45543.258,14997.64323)47949.11498145
Table 4. Patterns of the clusters of IPCs.
CIDIPC CntCenter XCenter YDist. To OTan−1 (°)Within GRP. VAR.Avg. VAR.IPC Codes
513−30428.35807.44630977.5−10.8054230028.917694.53{"G01R", "G02F", "G03G", "G05B", "G06K", "G06T", "G09G", "H01R", "H02J", "H02K", "H04M", "H05B", "H05K"}
74−163084−16323.71638995.715925205874.551468.61{"G01N", "H04L", "H04N", "H04W"}
41−313673103838.9330413.9−18.316700{"H01L"}
31−501431−67253.65059217.63910800{"G06F"}
2346764.796826.24846815.0686.963583282985.68323.107{"G01B", "G01C", "G01D", "G01F", "G01J", "G01L", "G01M", "G01S", "G03B", "G03F", "G05D", "G08B", "G08G", "G09B", "G09F", "G10L", "G11B", "G11C", "H01B", "H01F", "H01G", "H01H", "H01J", "H01Q", "H01S", "H02G", "H02H", "H02M", "H02P", "H03K", "H03M", "H04J", "H04Q", "H04R "}
67127319.53−2044.6927395.94−4.28023237455.43344.442{"G01G", "G01H", "G01K", "G01P", "G01T", "G01V", "G01W", "G02C", "G03C", "G03D", "G03H", "G04B", "G04C", "G04F", "G04G", "G04R", "G05F", "G05G", "G06C", "G06D", "G06E", "G06G", "G06J", "G06M", "G06N", "G07B", "G07C", "G07D", "G07F", "G07G", "G08C", "G09C", "G09D", "G10B", "G10C", "G10D", "G10F", "G10G", "G10H", "G10K", "G12B", "G21B", "G21C", "G21D", "G21F", "G21G", "G21H", "G21J", "G21K", "H01C", "H01K", "H01P", "H01T", "H02B", "H02N", "H02S", "H03B", "H03C", "H03D", "H03F", "H03G", "H03H", "H03J", "H03L", "H04H", "H04K", "H04S", "H05C", "H05F", "H05G", "H05H"}
14−76670.417573.3278658.6−12.909589935.8422483.96{"G02B", "G06Q", "H01M", "H04B"}
*: Table note for the acronyms: CID: ID of the cluster; IPC CNT: number of IPCs contained in the cluster; Center X and Center Y: the coordinate of the center in the vector space of each cluster; Dist. To O: the Euclidean distance of the center of a cluster to the origin; TAN−1: the degree of the vector of cluster center relative to 0° (the positive direction of the x axis); Within GRP. VAR.: within group variance of the data vectors inside a cluster group; AVG. VAR.: value of the average variance (over the data vectors) in the group; IPC CODES: the IPC codes included in each cluster.

