Experimental Study of the Effect of High Temperature on the Mechanical Properties of Coarse Sandstone

Abstract
:Featured Application
Abstract
1. Introduction
2. Sample Preparation and High Temperature Treatment
2.1. Sample Preparation
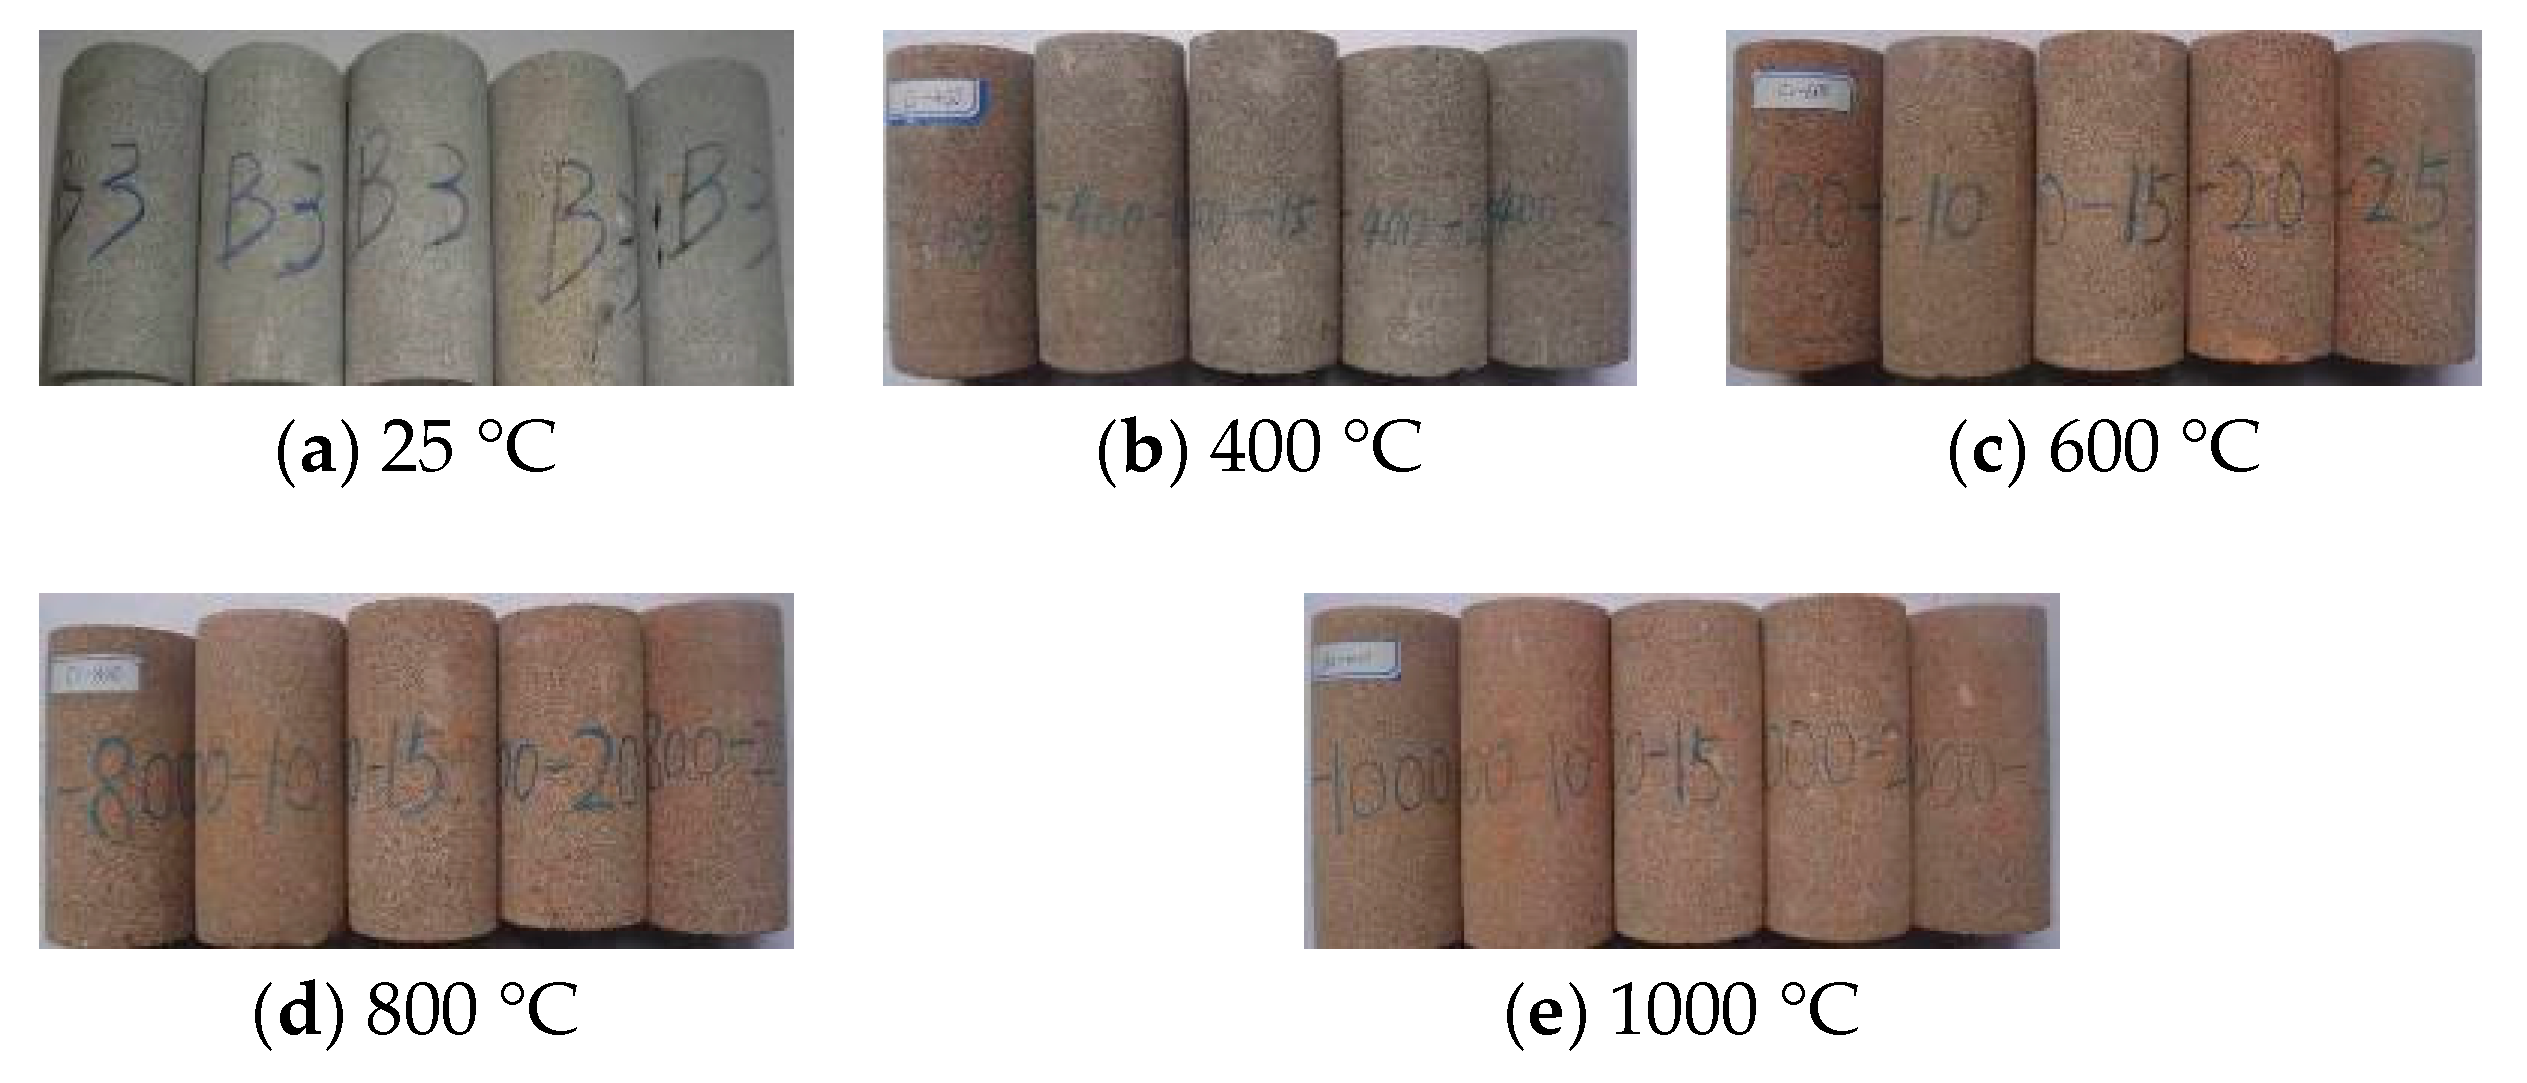
2.2. High Temperature Treatment
3. Testing Device and Scheme Design
3.1. Testing Device
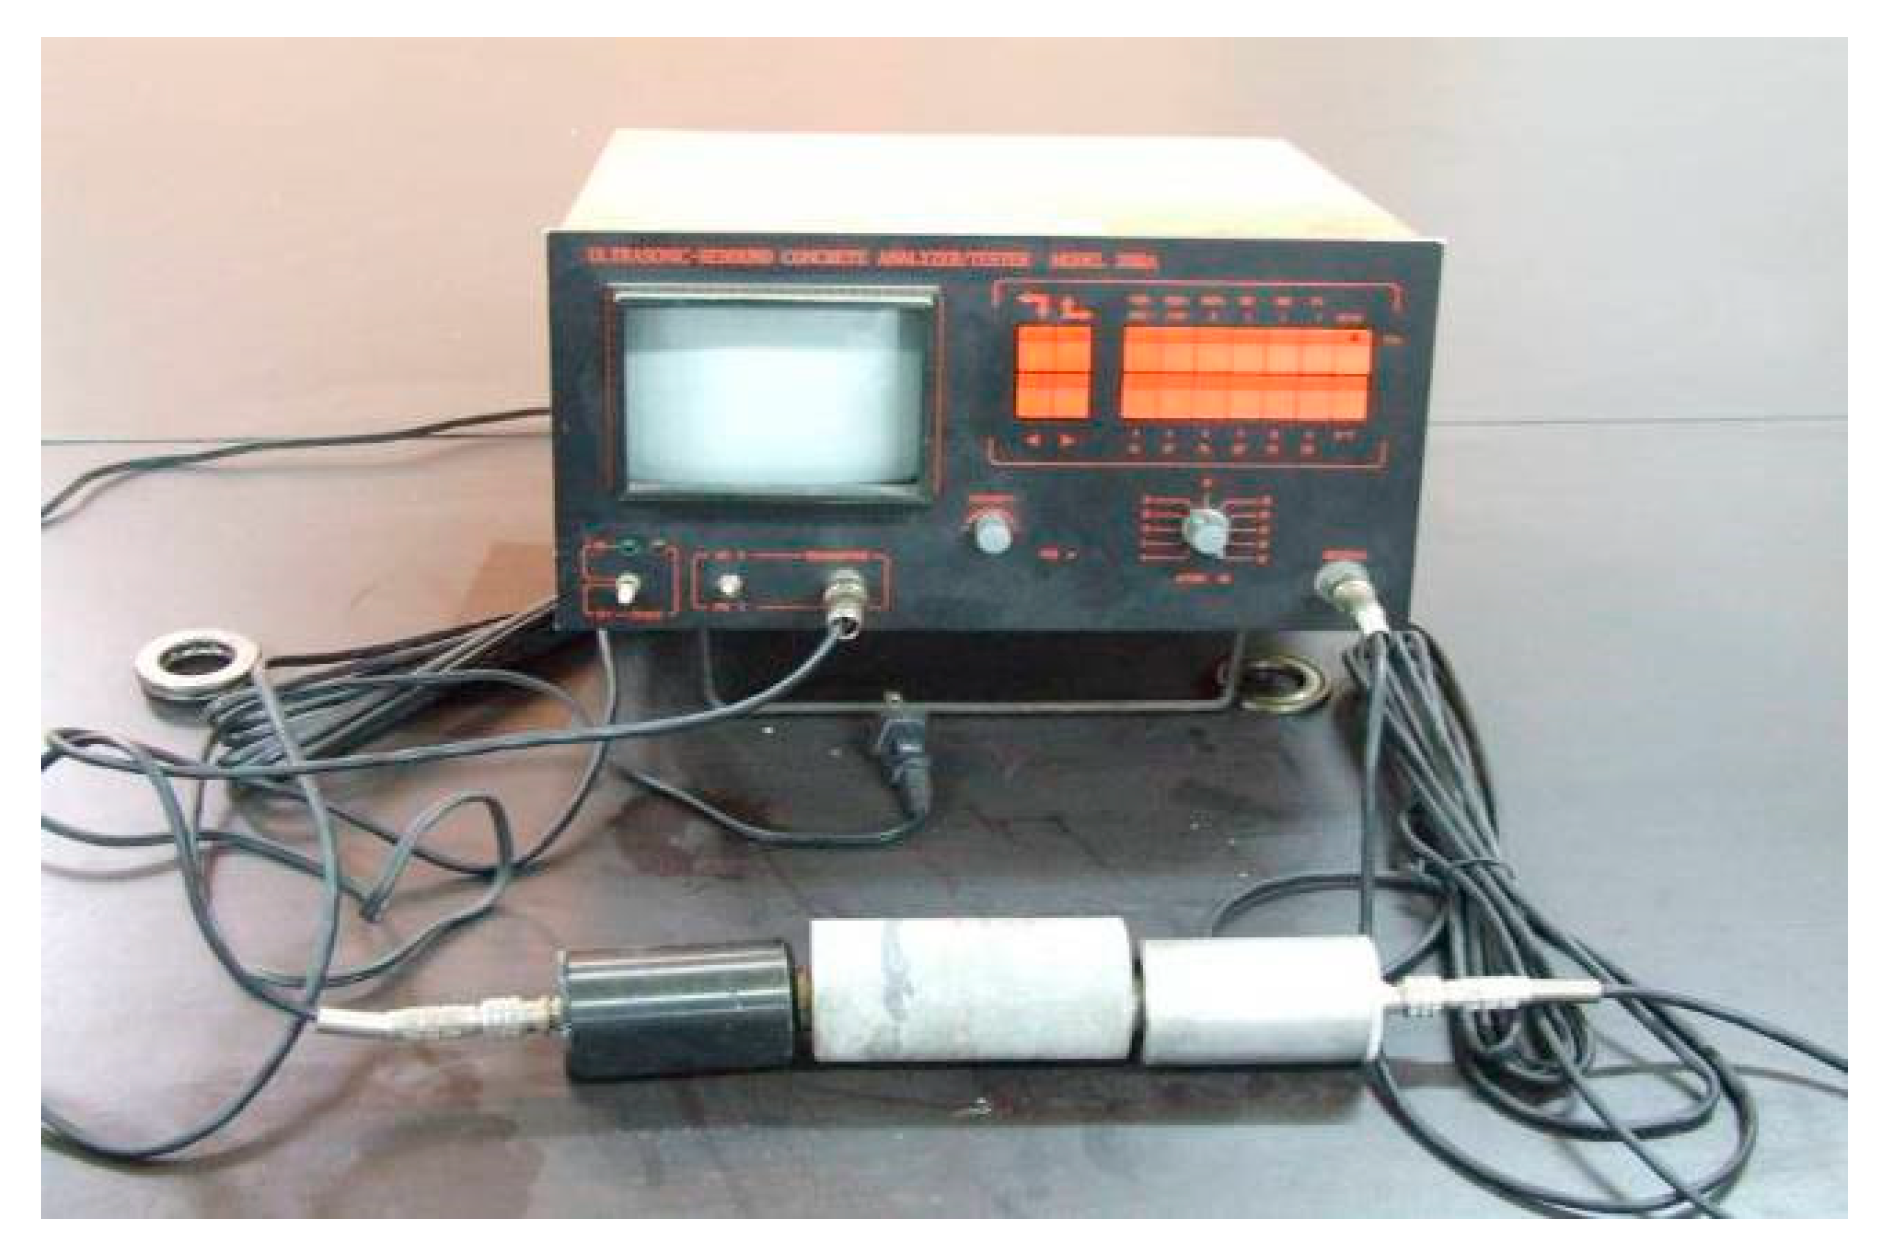
3.1.1. Ultrasound Testing Device
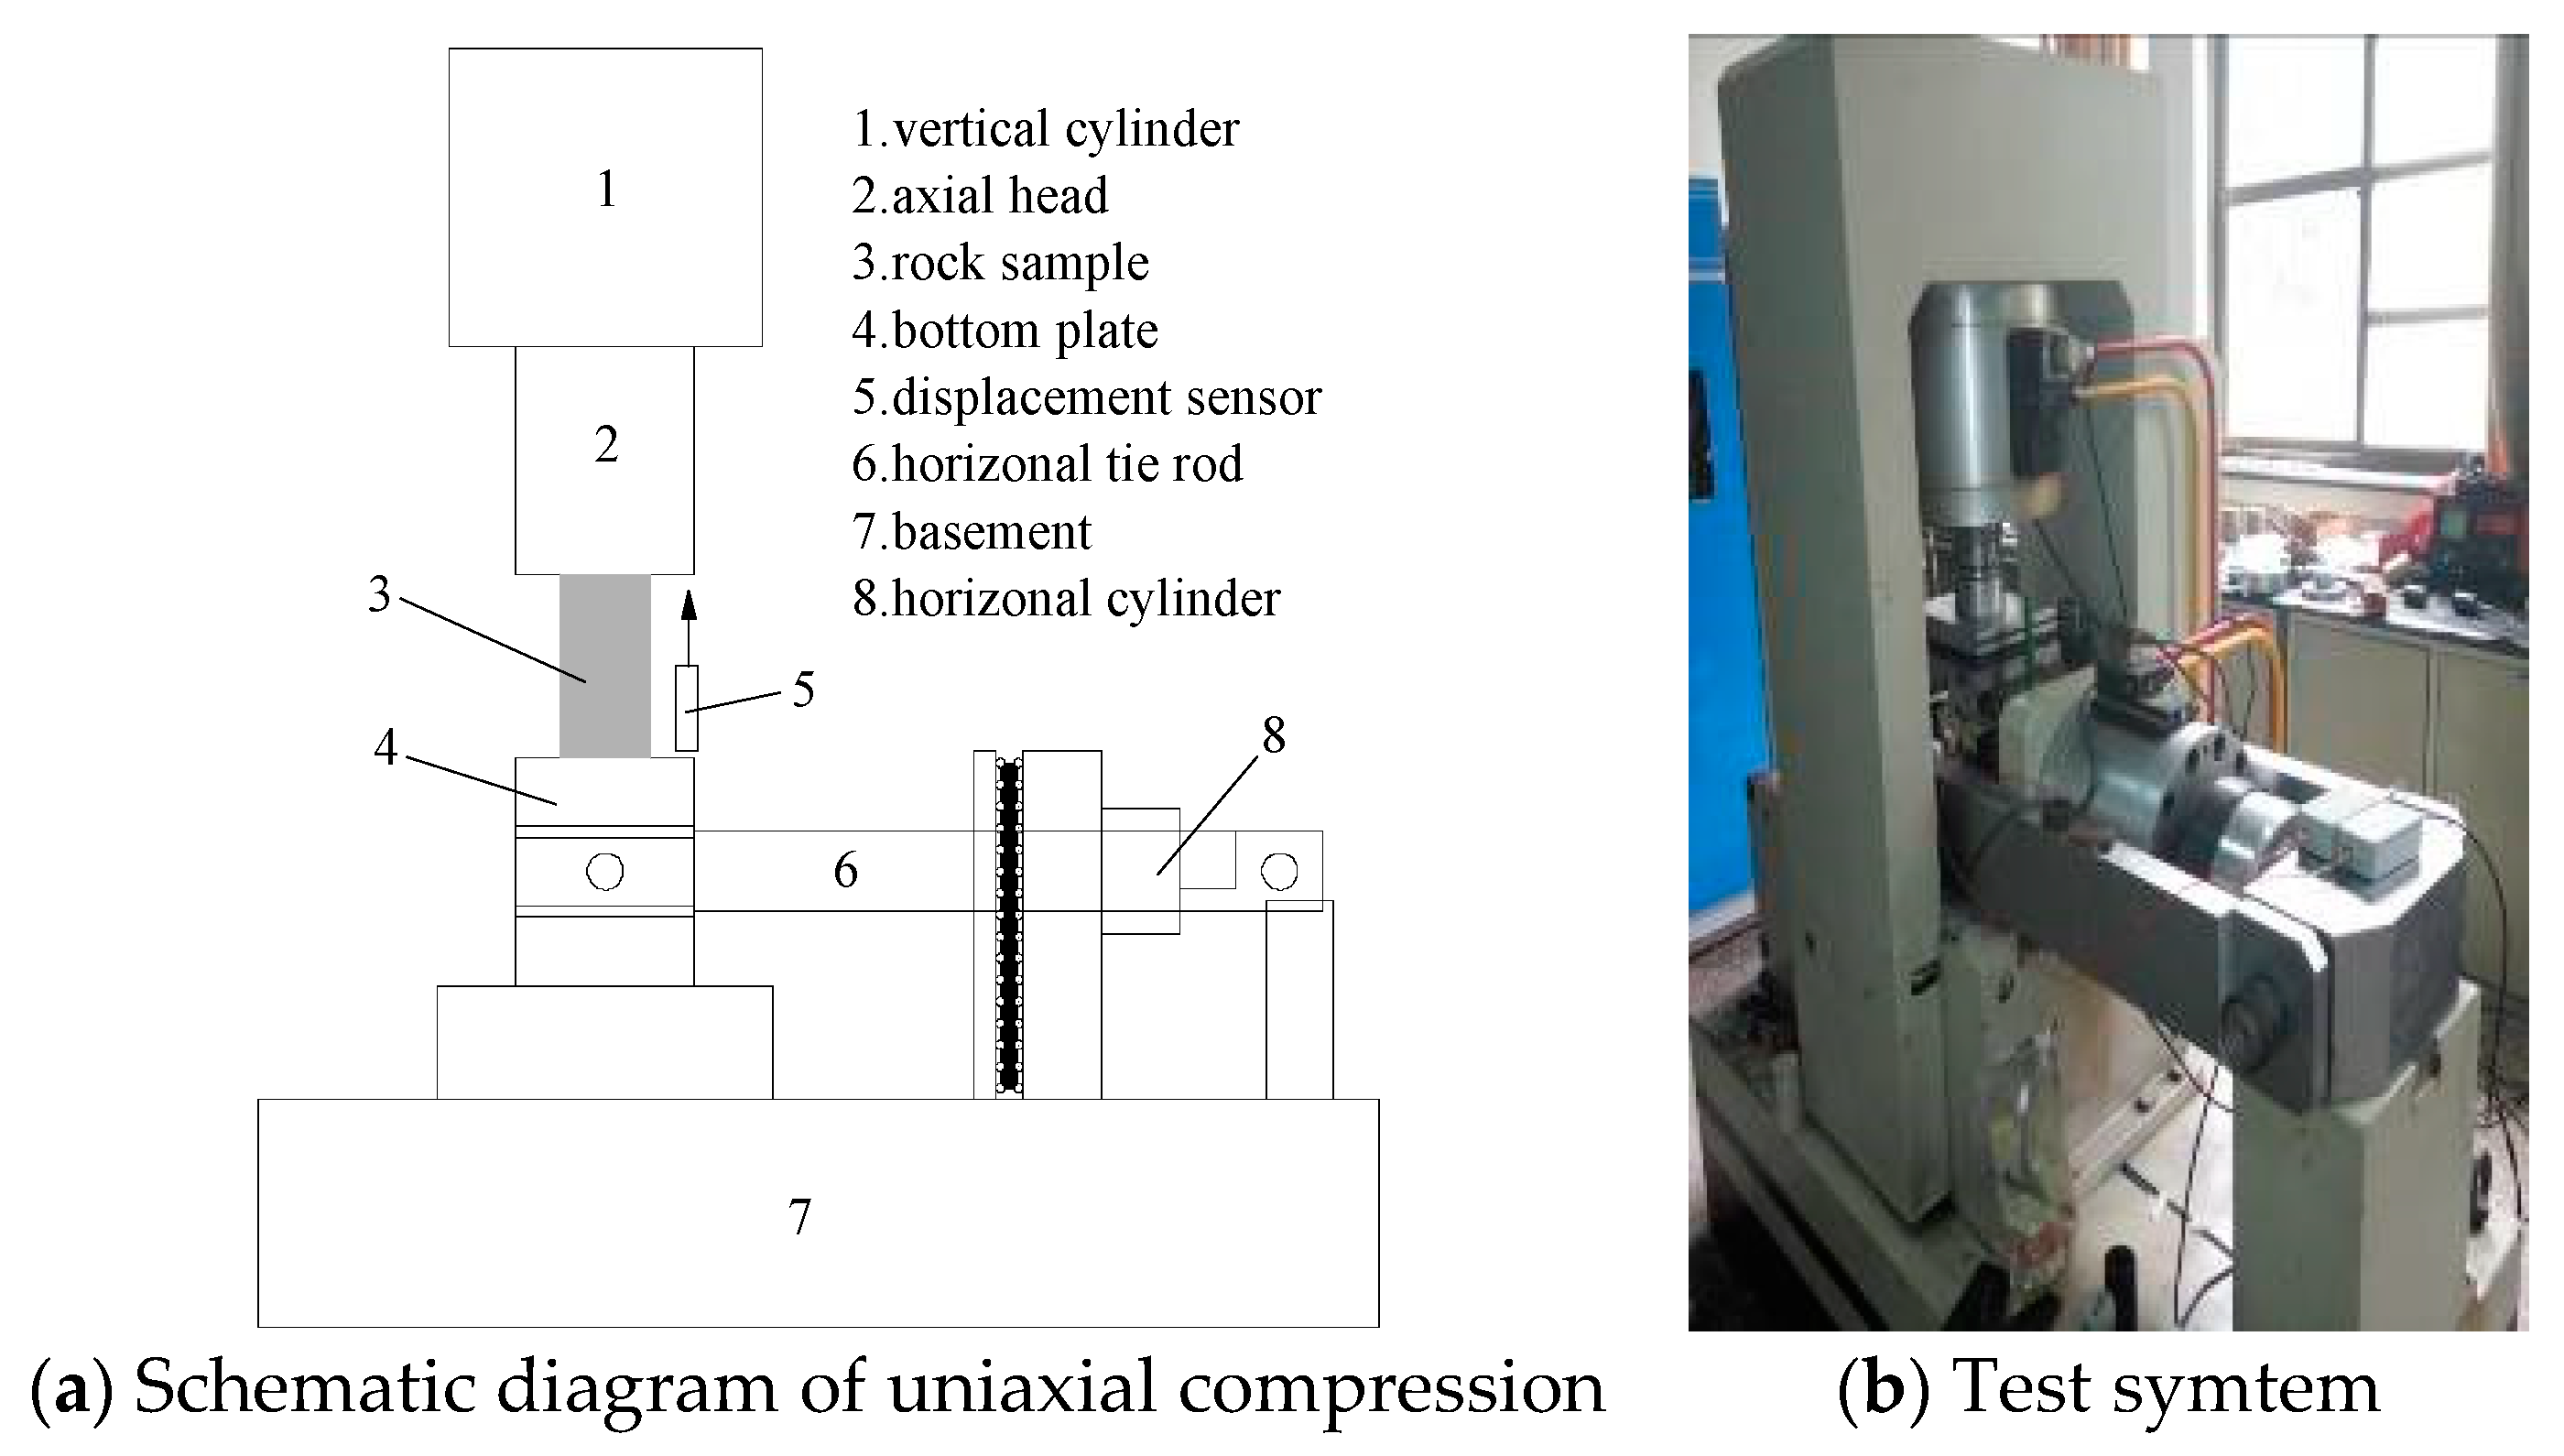
3.1.2. Mechanical Testing Device
3.2. Scheme Design
- (1)
- All samples were tested for longitudinal wave velocity at room temperature 25 °C and after high temperature treatment using UTA-2000A non-metallic ultrasonic monitoring analyzer.
- (2)
- The uniaxial compression tests were carried out on the specimens of group A. During the test, the axial stress was applied to the sample by displacement control at a rate of 0.02 mm/s, and three specimens were repeated at each temperature.
- (3)
- The conventional triaxial compression tests were carried out on the specimens of group B. First, the axial stress and confining pressure were applied simultaneously at the loading rate of 0.5 MPa/s to the preset values (confining pressures were set at 5 MPa, 10 MPa, 15 MPa, 20 MPa and 25 MPa, respectively), then the constant confining pressure was unchanged, the axial direction was changed from force control to displacement control (at a rate of 0.005 mm/s) to apply the axial stress until the specimen was completely destroyed.
4. Analysis of Test Results
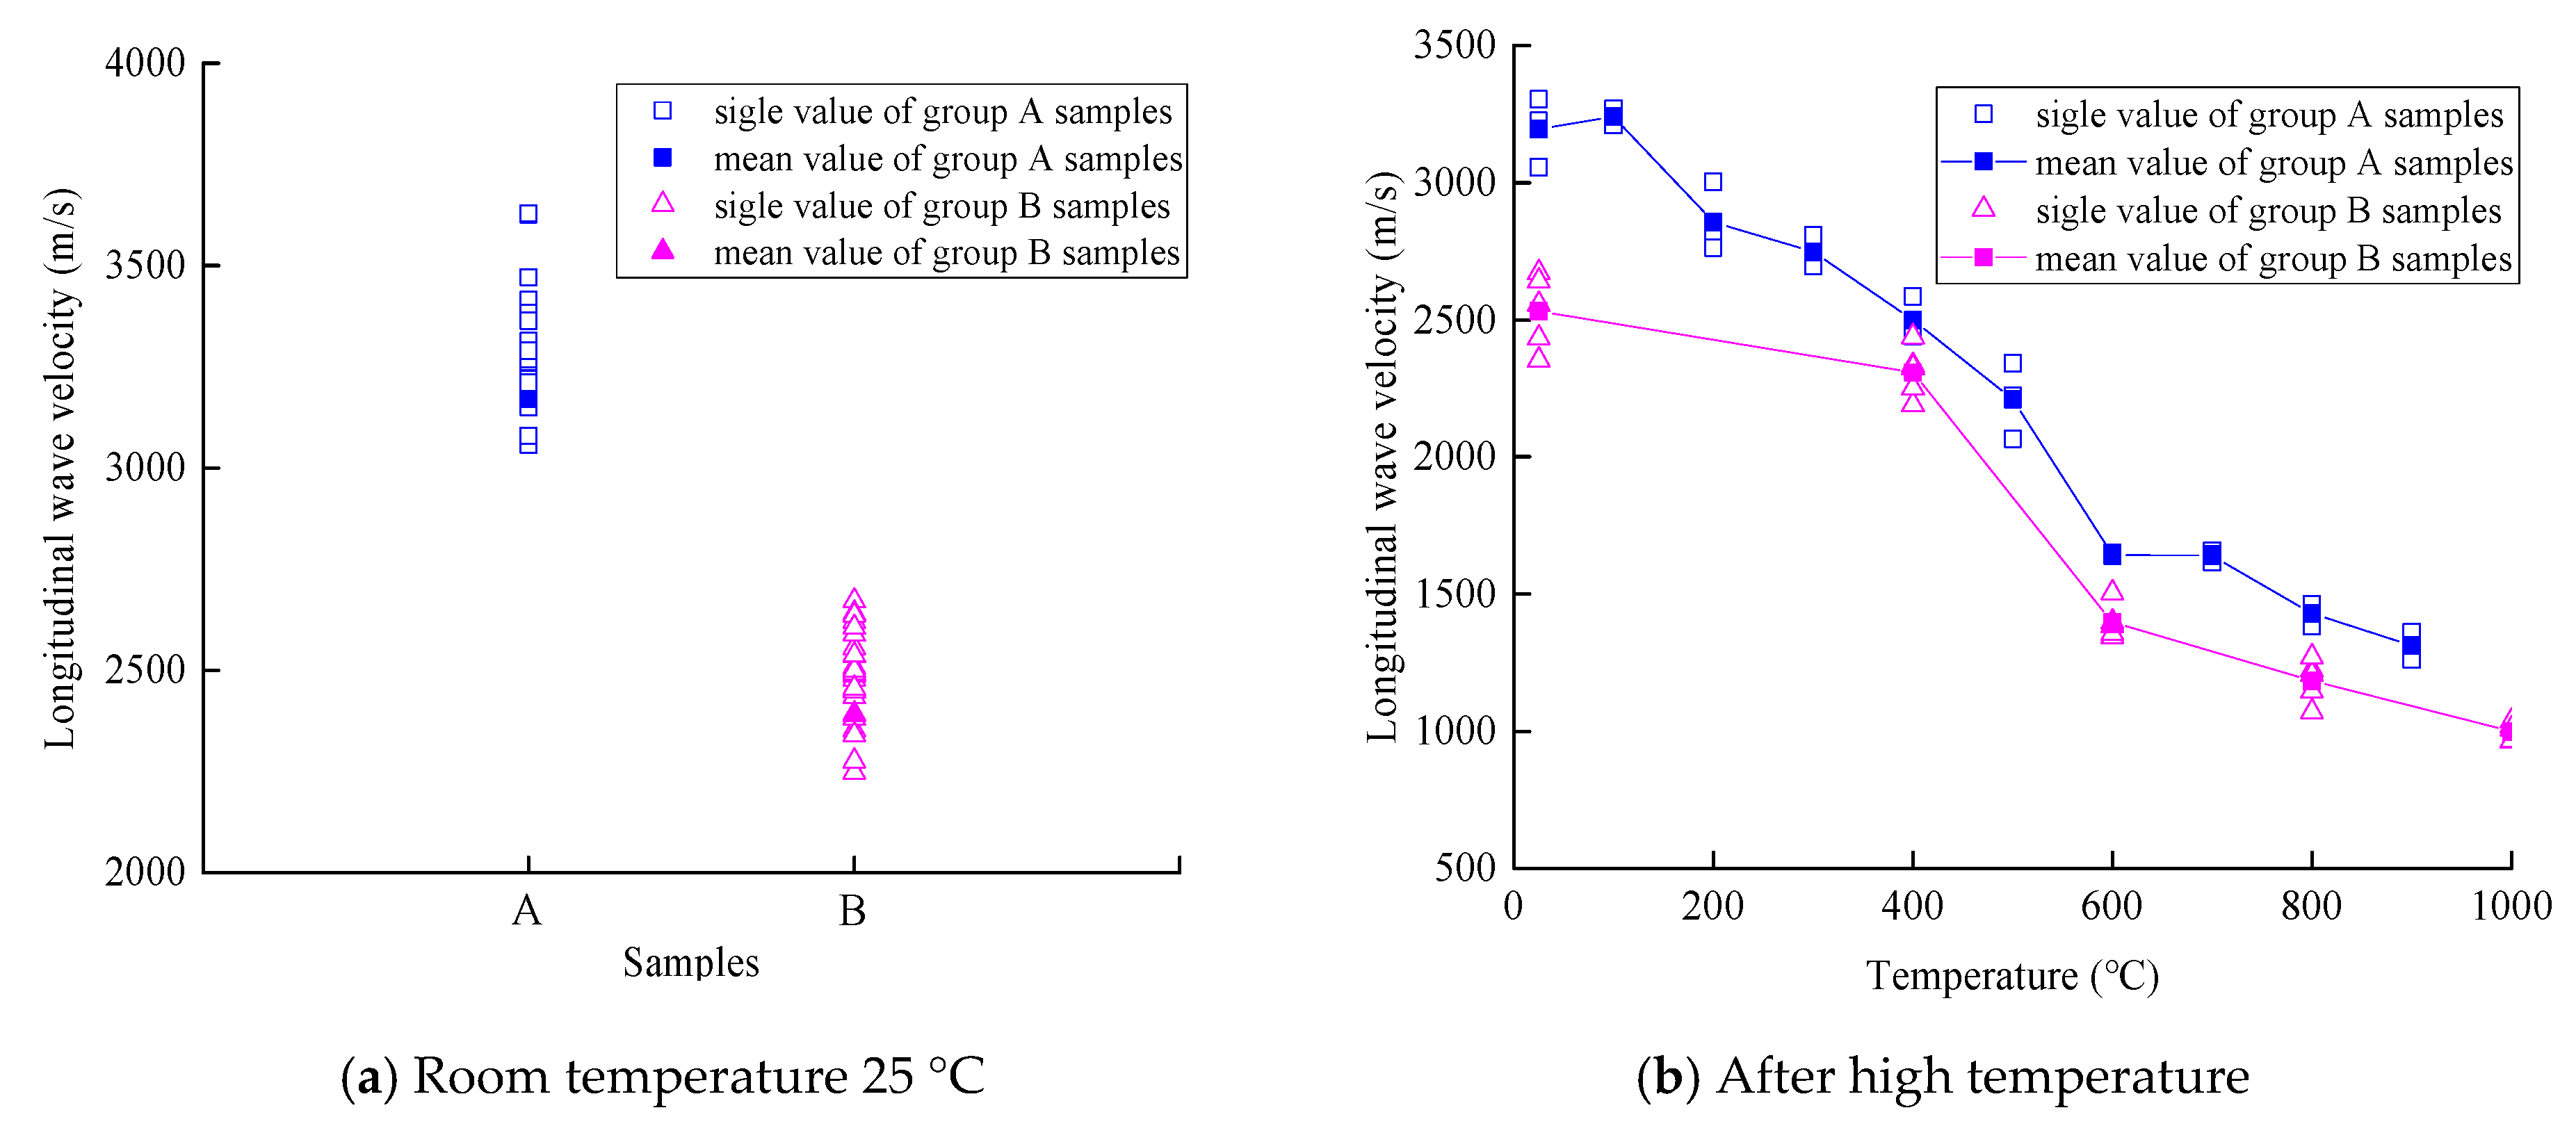
4.1. Effect of High Temperature on Longitudinal Wave Velocity of Sample
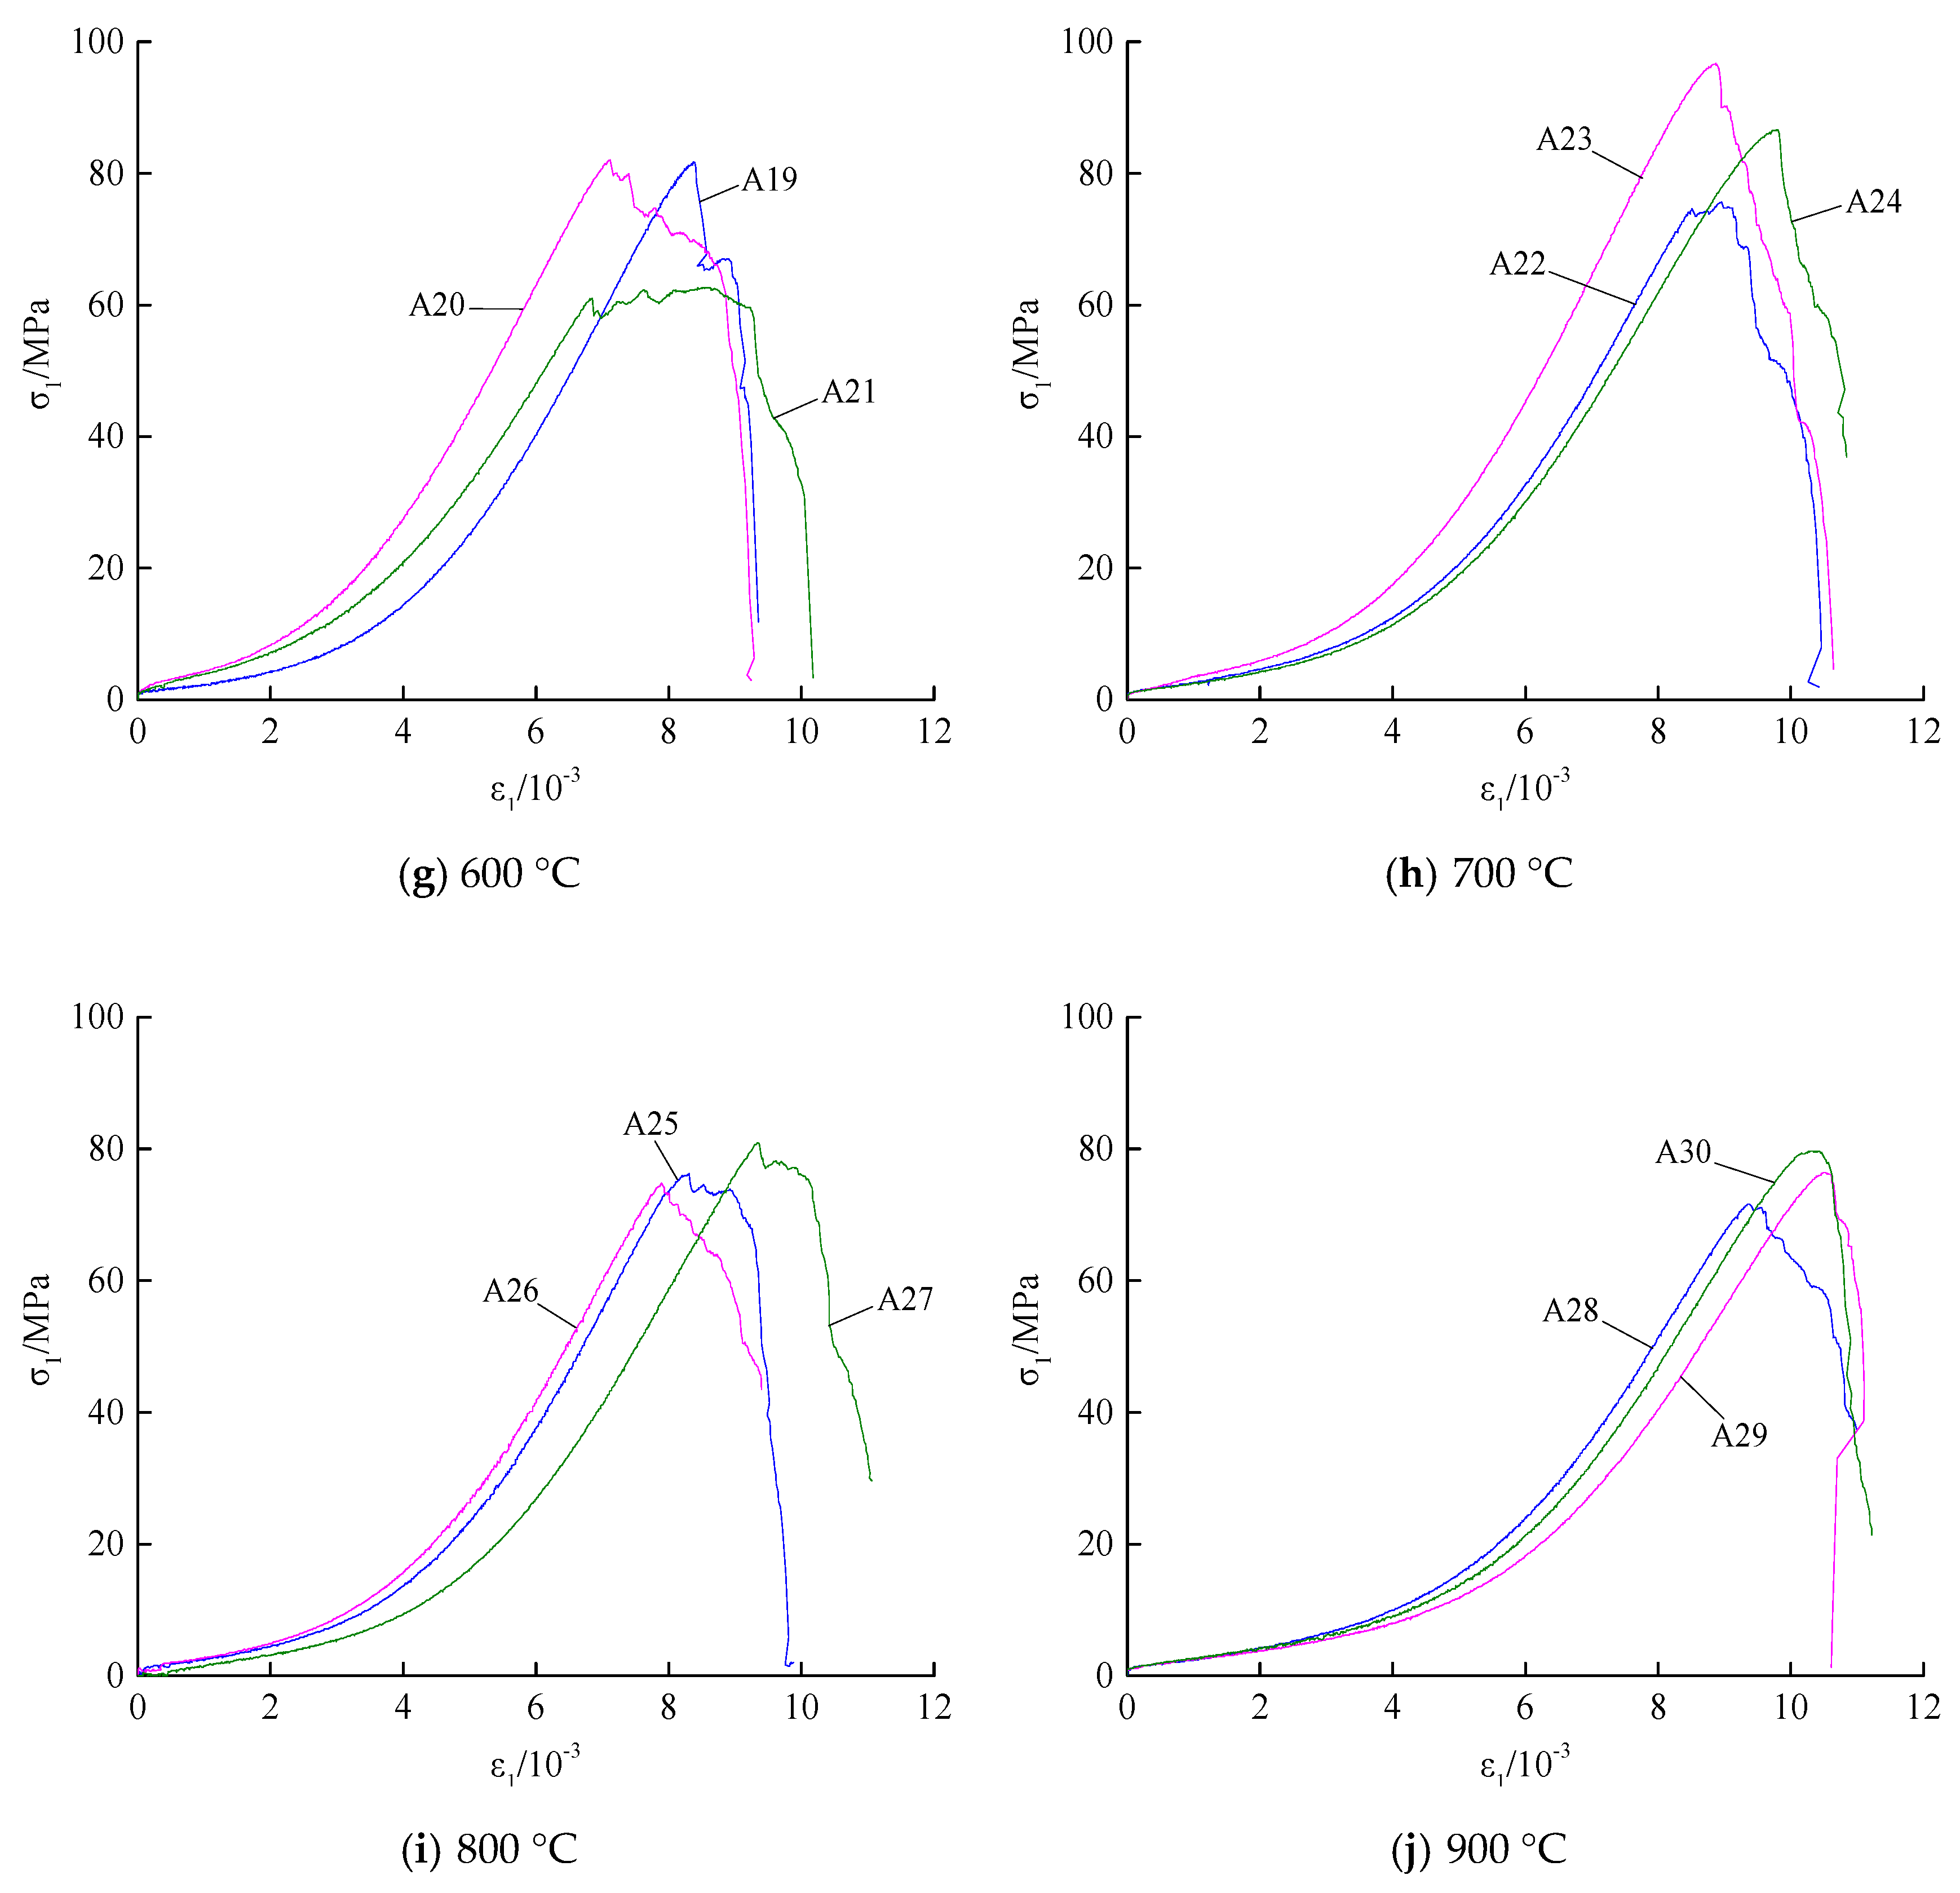
4.2. Analysis of Uniaxial Compression Test Results
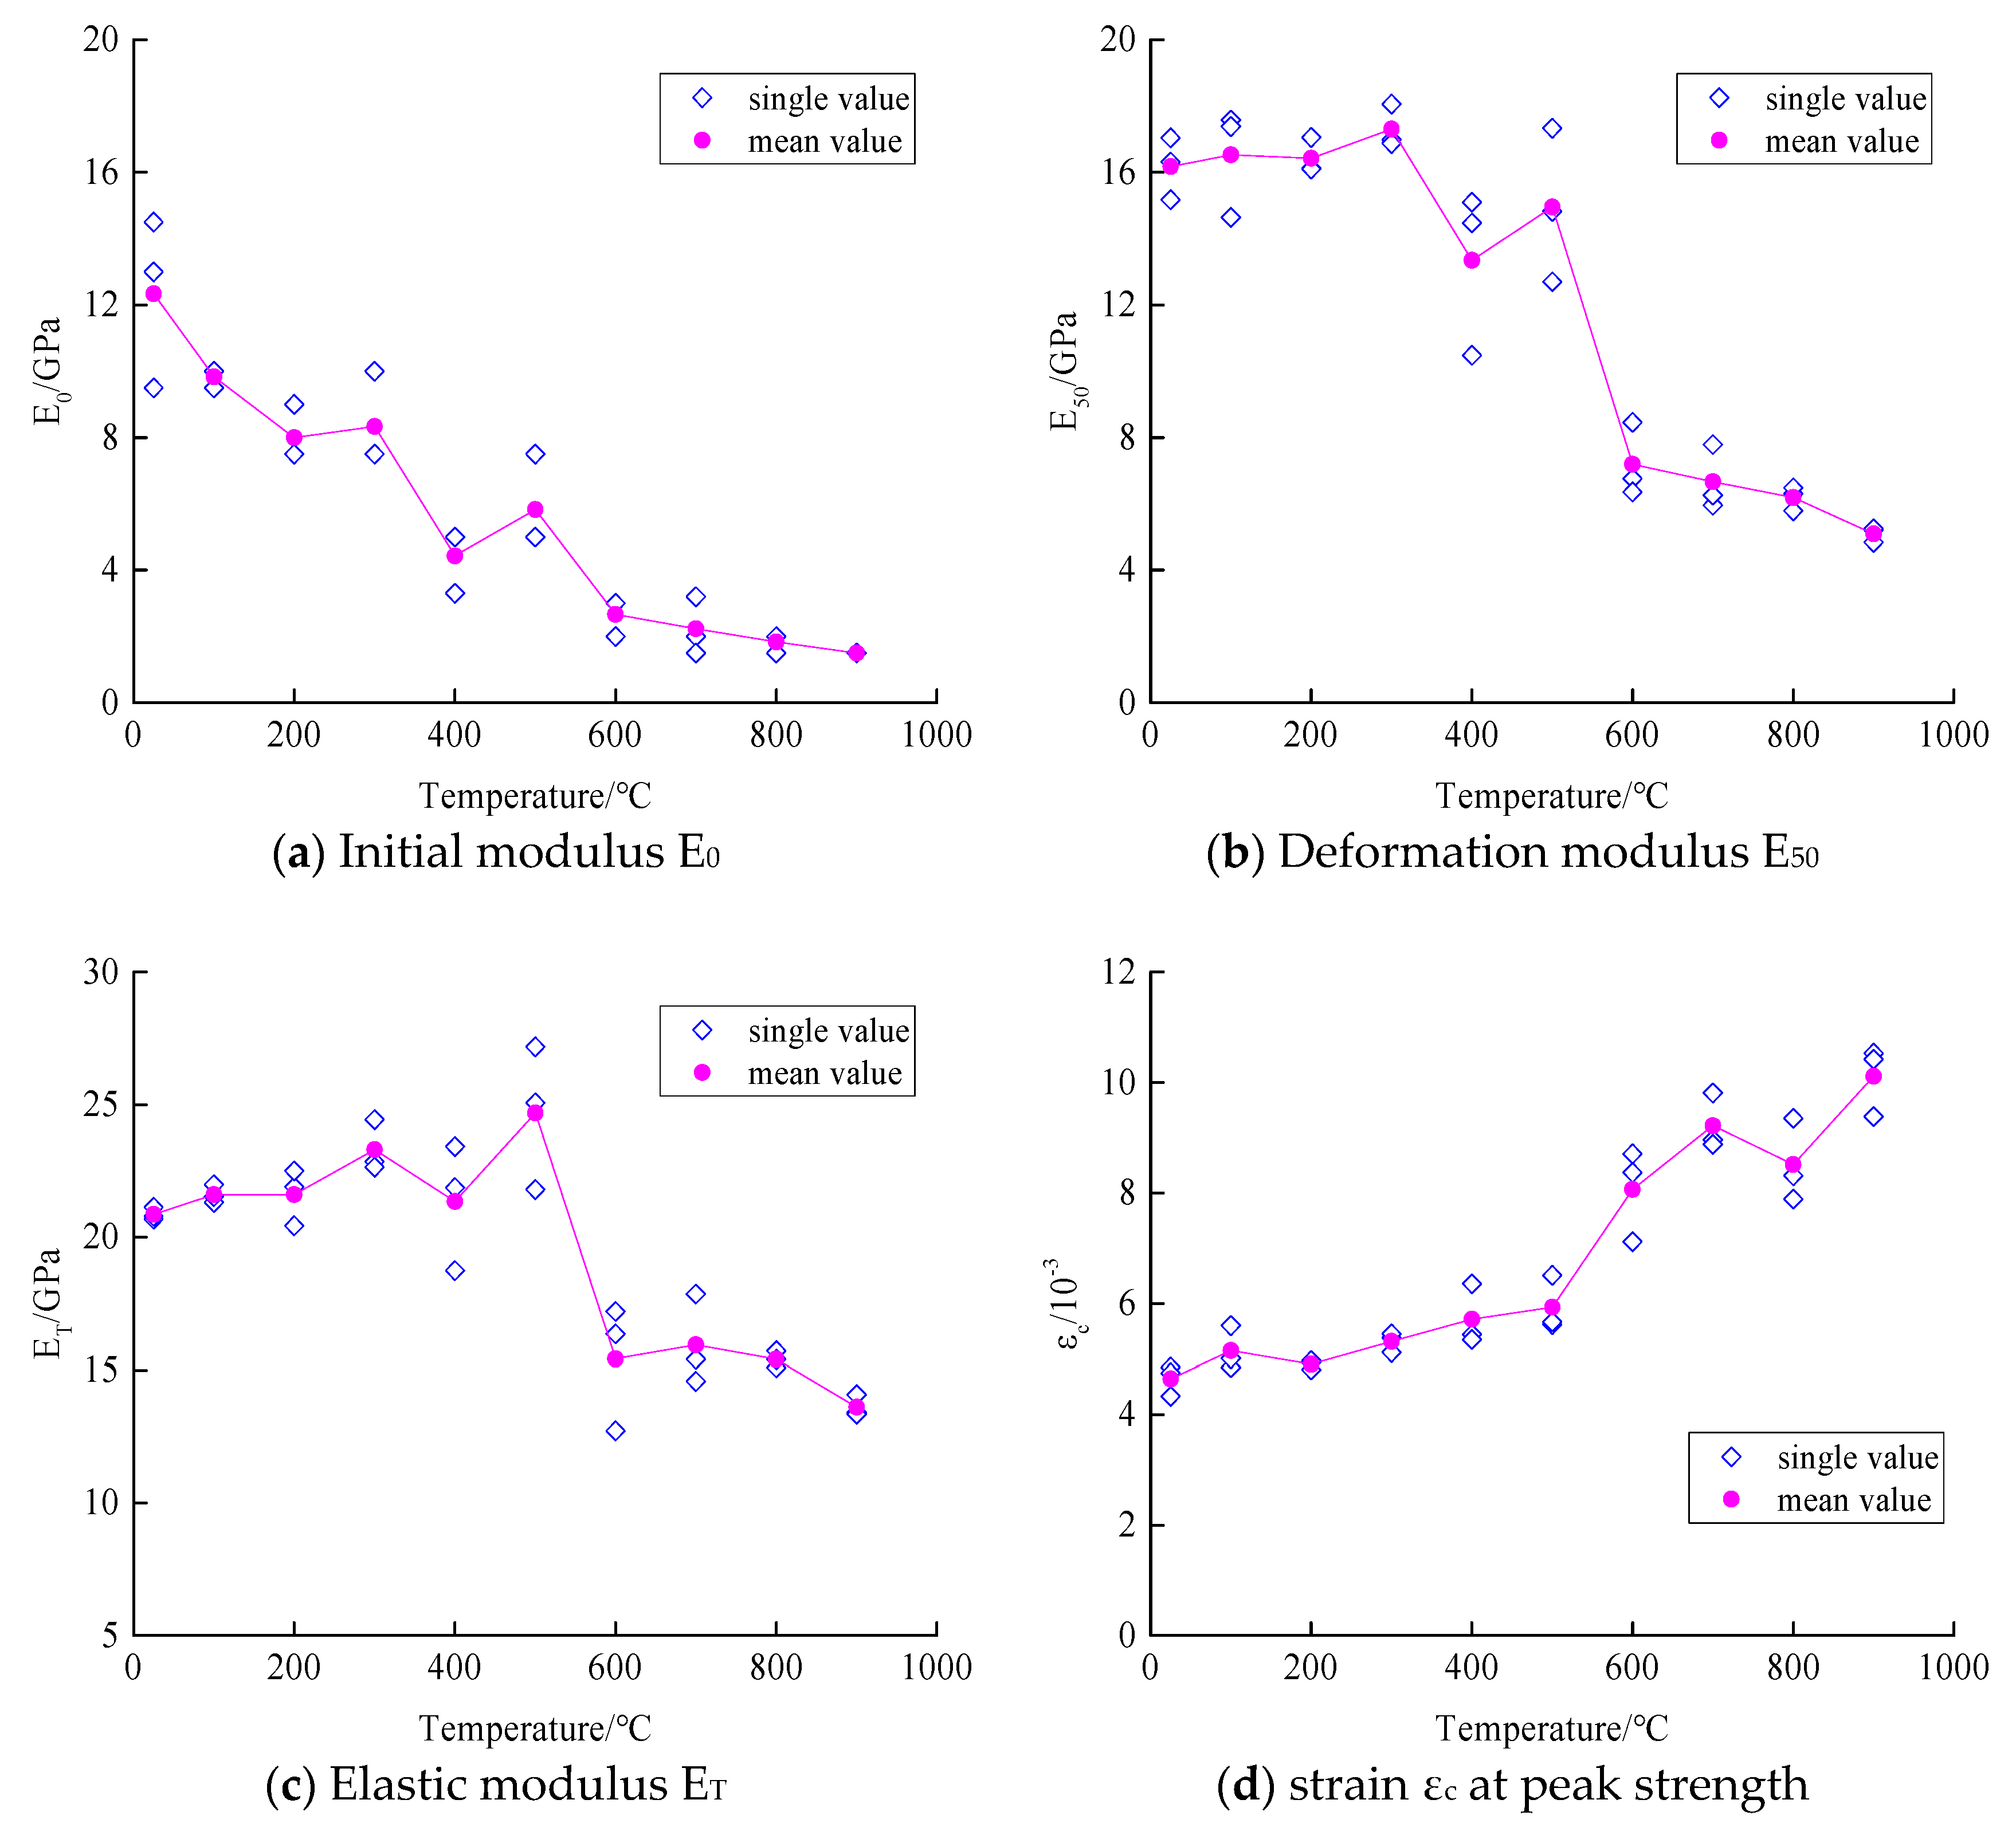
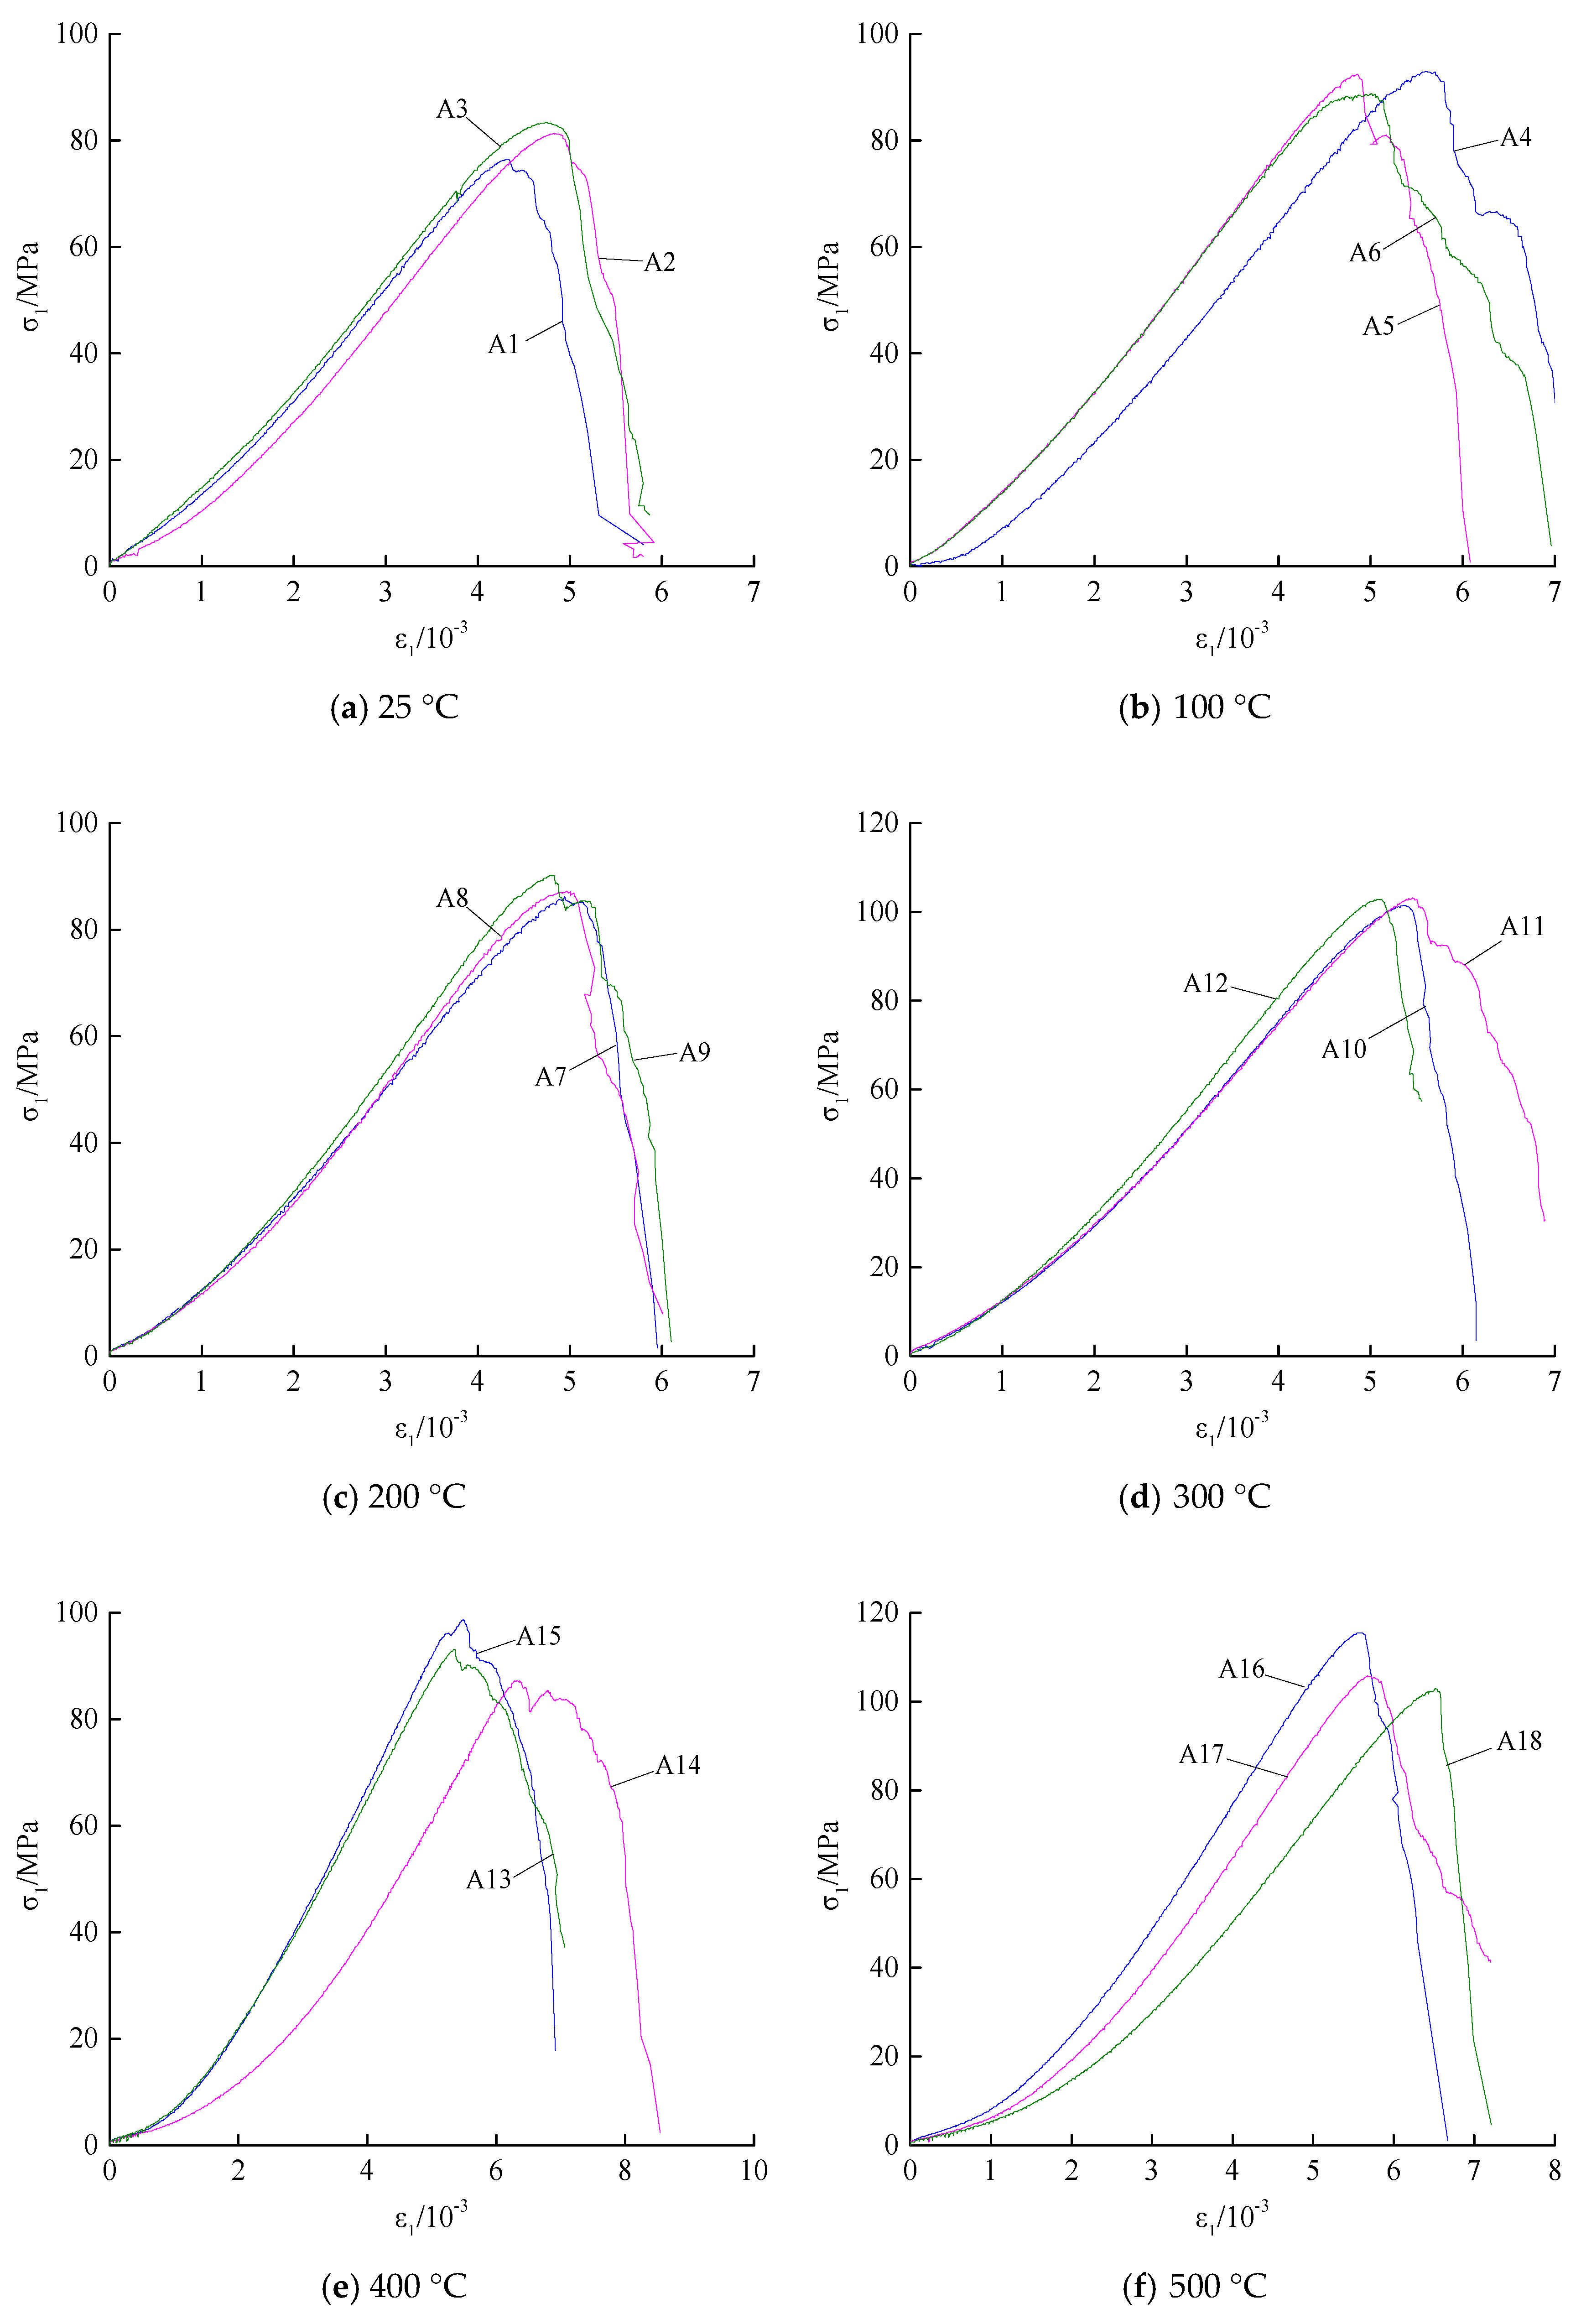
4.2.1. Deformation Characteristics
- (1)
- Compaction: The curve shows upward concave because of the closure of cracks existed under compress. Higher temperatures have long compaction phases, which indicate that the higher the temperature, the more micro-cracks are generated inside the sample.
- (2)
- Elasticity: The stress–strain curve at this stage is a straight line, showing a good linear relationship, showing the elastic characteristics of the material. The slope of the straight line segment at this stage is called the elastic modulus (also known as Young’s modulus) and is the mechanical parameter of the material.
- (3)
- Yield: The stress–strain curve bends downward, and the specimen presents inelastic deformation. The material with lower internal strength of the rock specimen first yields and destroys gradually, and the increase rate of axial stress decreases gradually.
- (4)
- Destruction: The axial stress increases to the limit capacity that the specimen can withstand. The micro-cracks inside the specimen penetrate to form a macroscopic slip. In the initial stage of the slip, stress occurs in the longitudinal direction of the specimen, and failure occurs locally [33]. The stress dropped rapidly and the sample as a whole lost its bearing capacity.
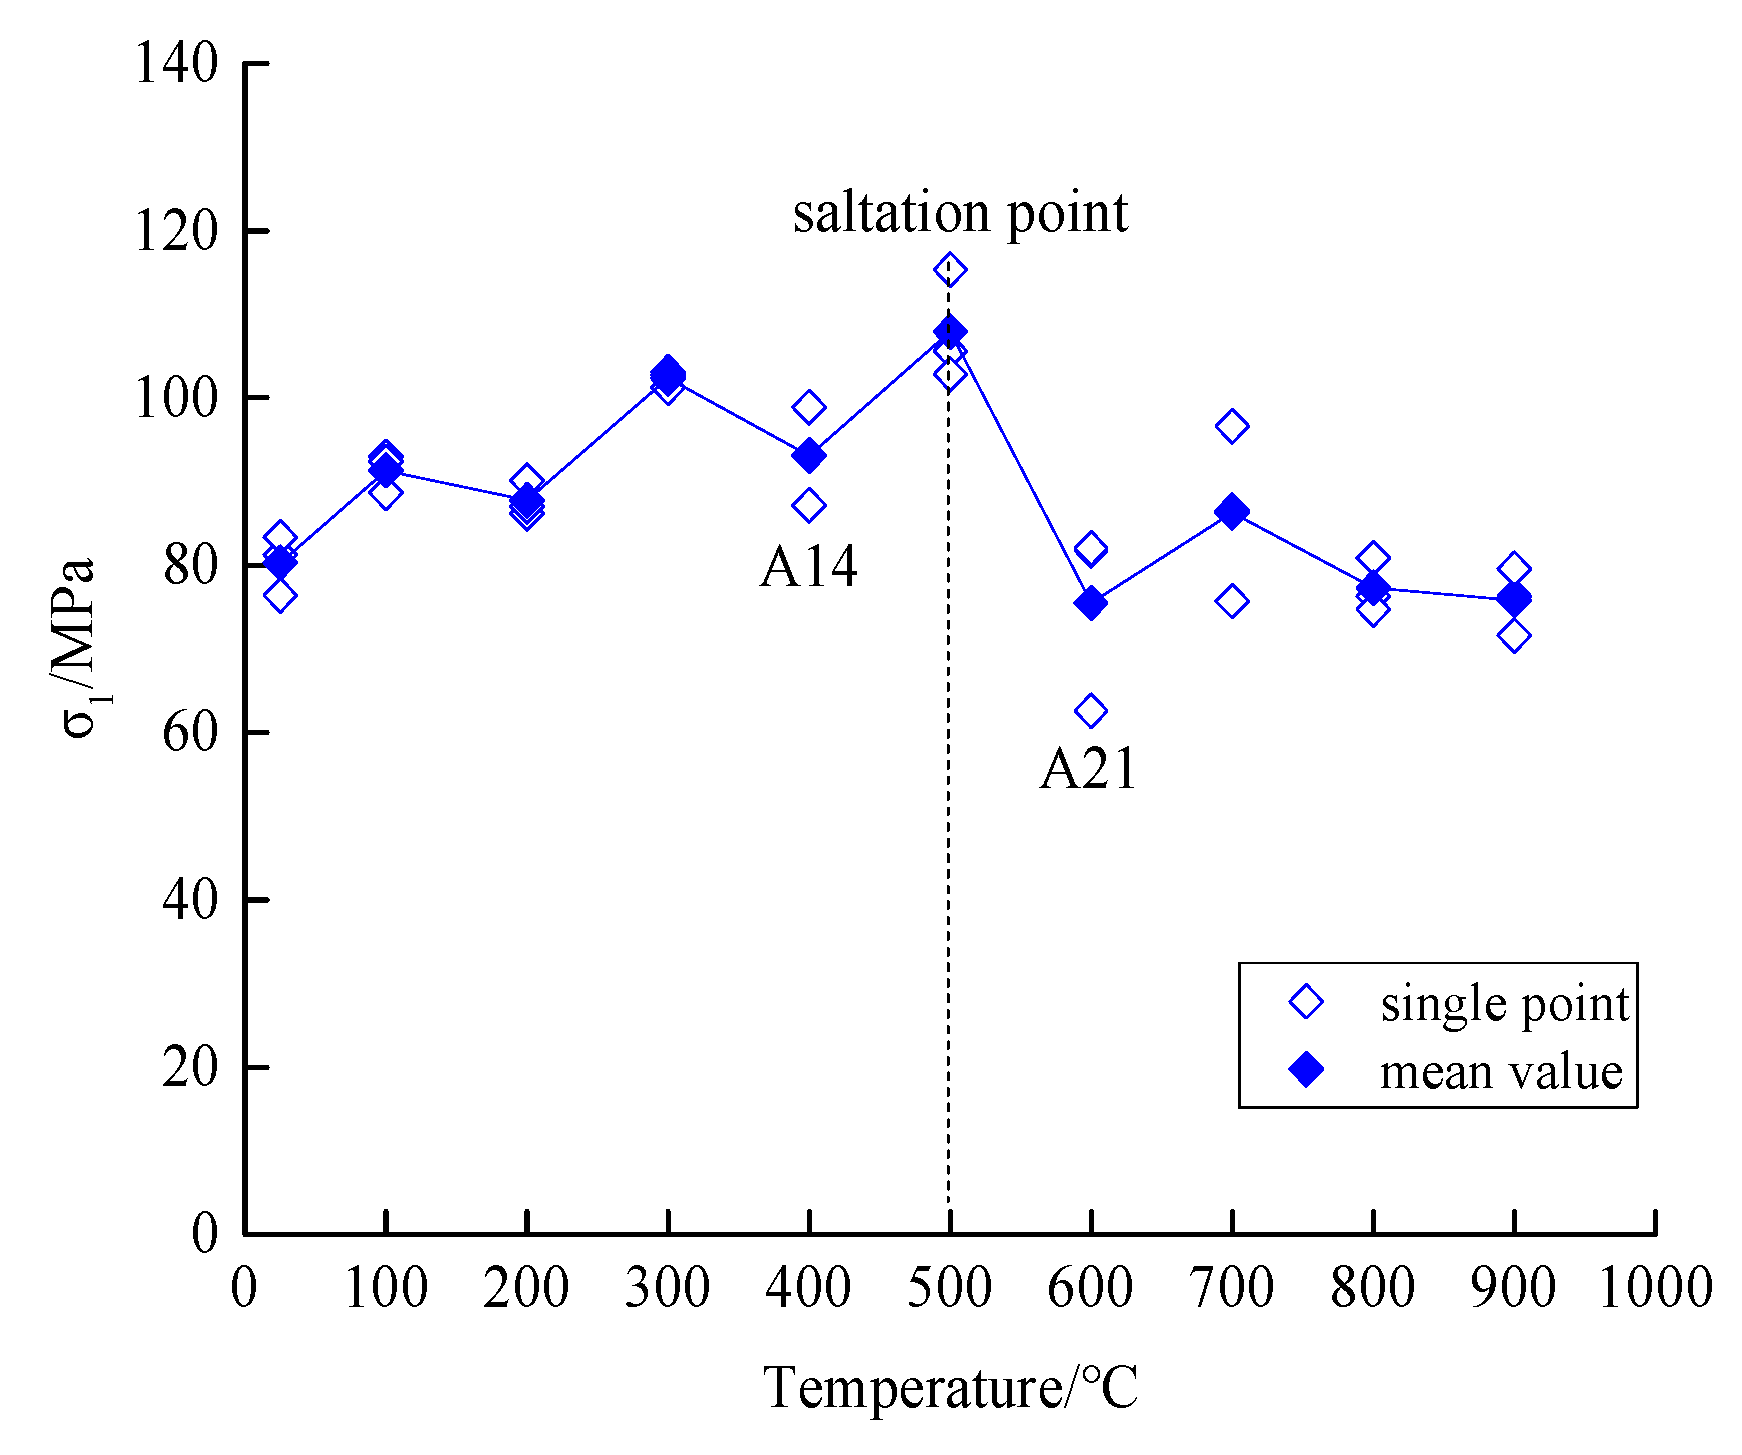
4.2.2. Strength Properties
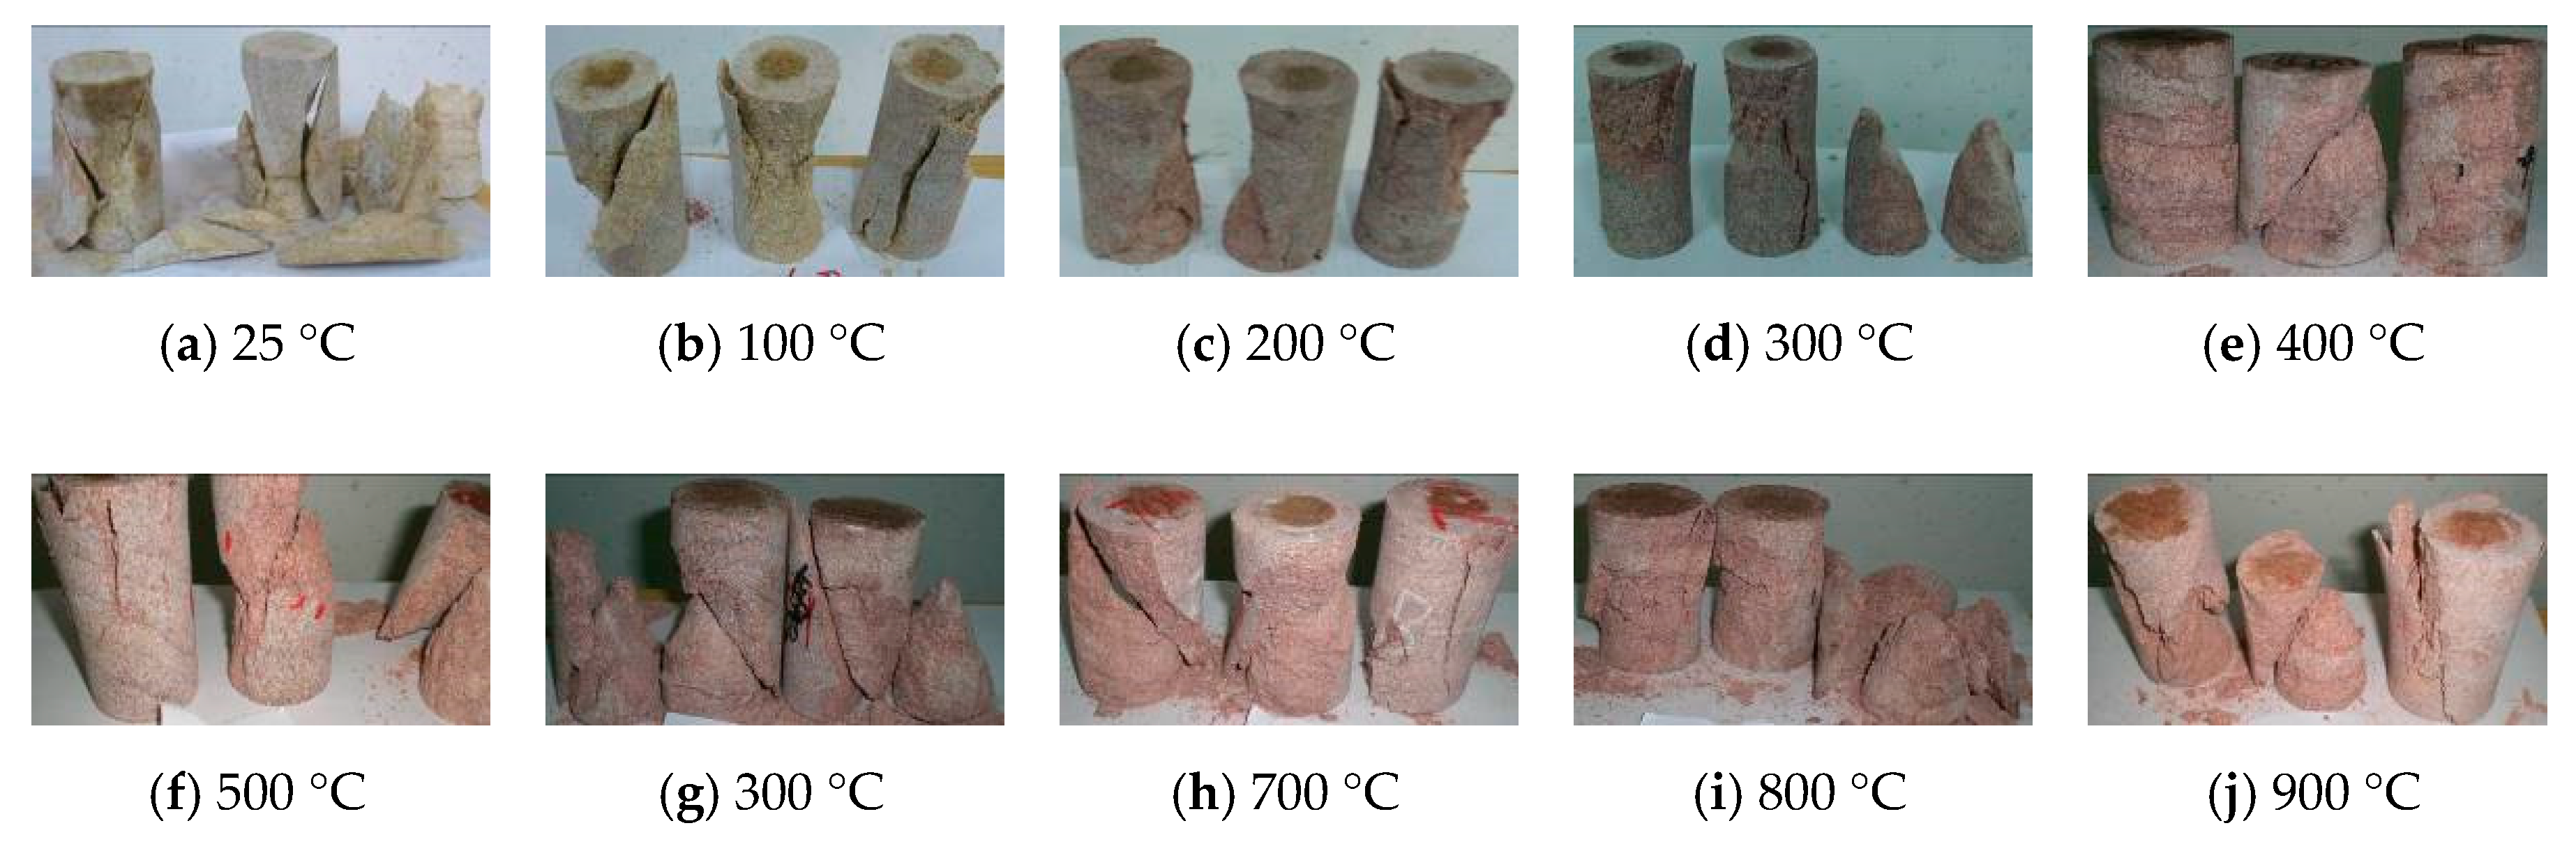
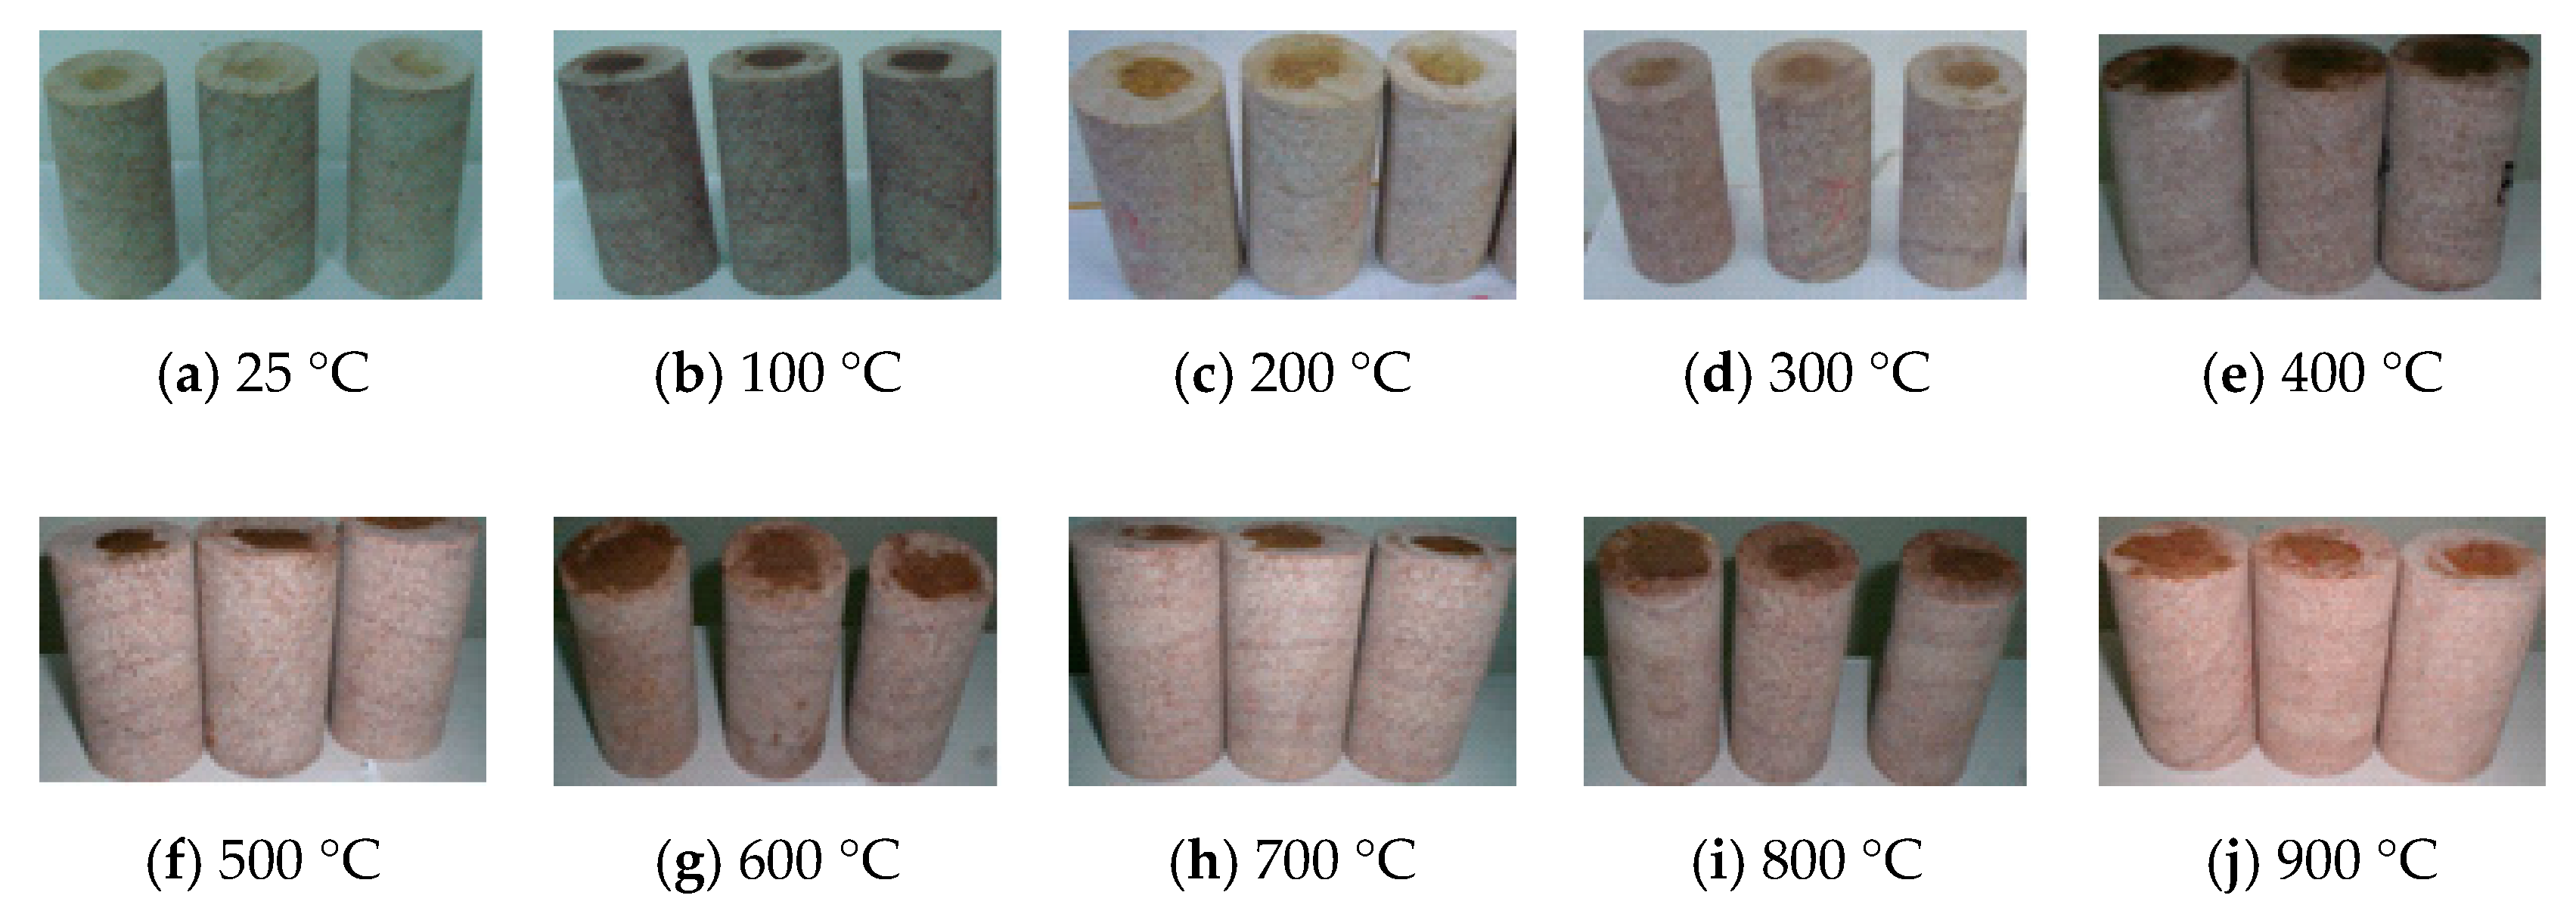
4.2.3. Failure Patterns
4.3. Analysis of Triaxial Compression Test Results
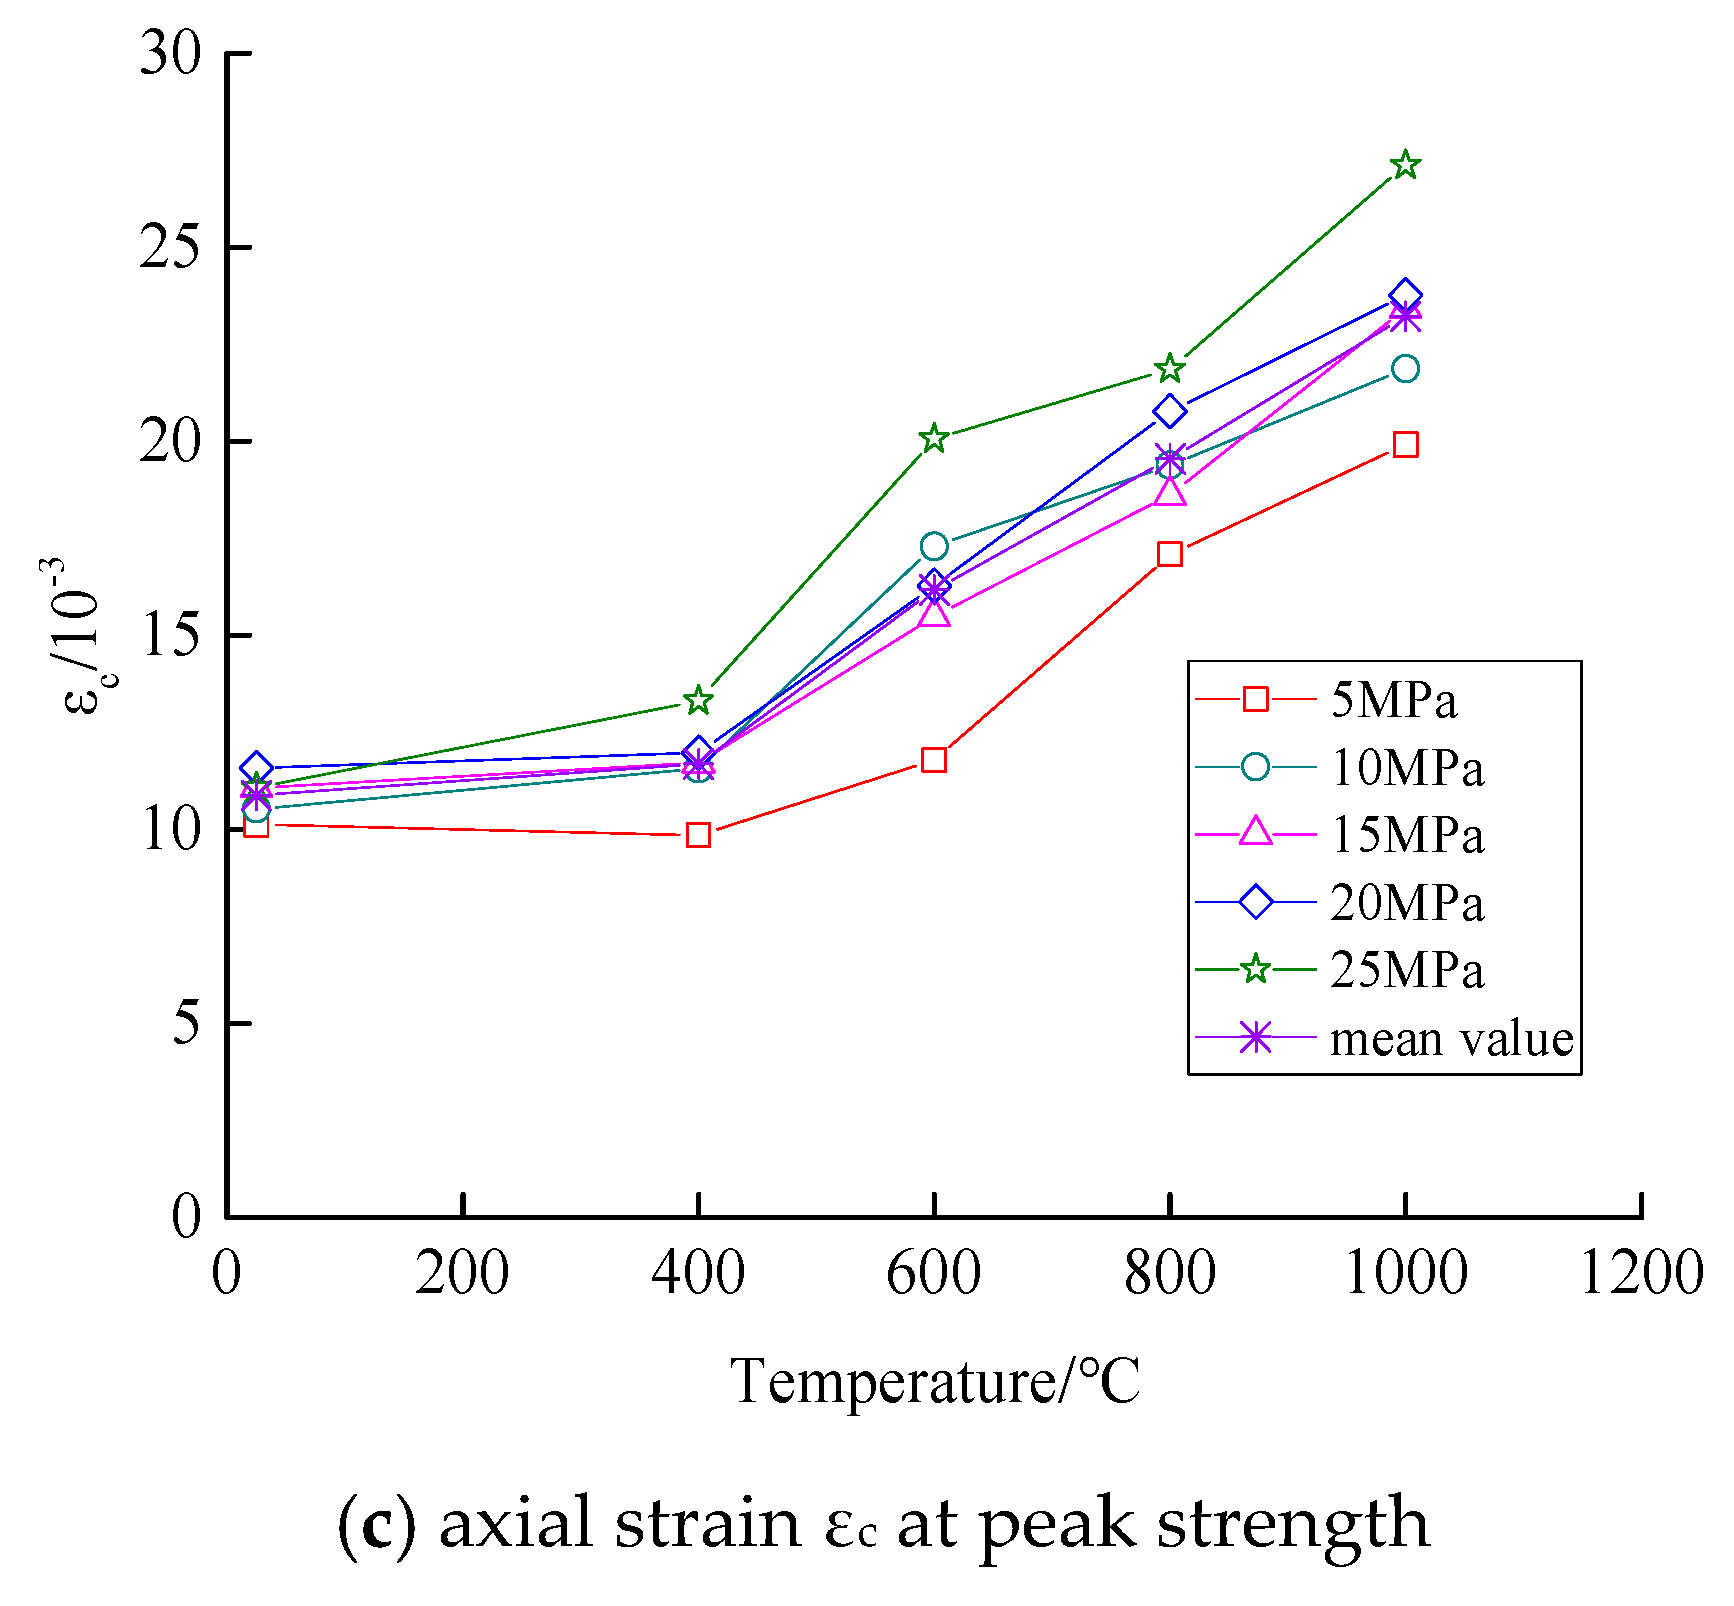
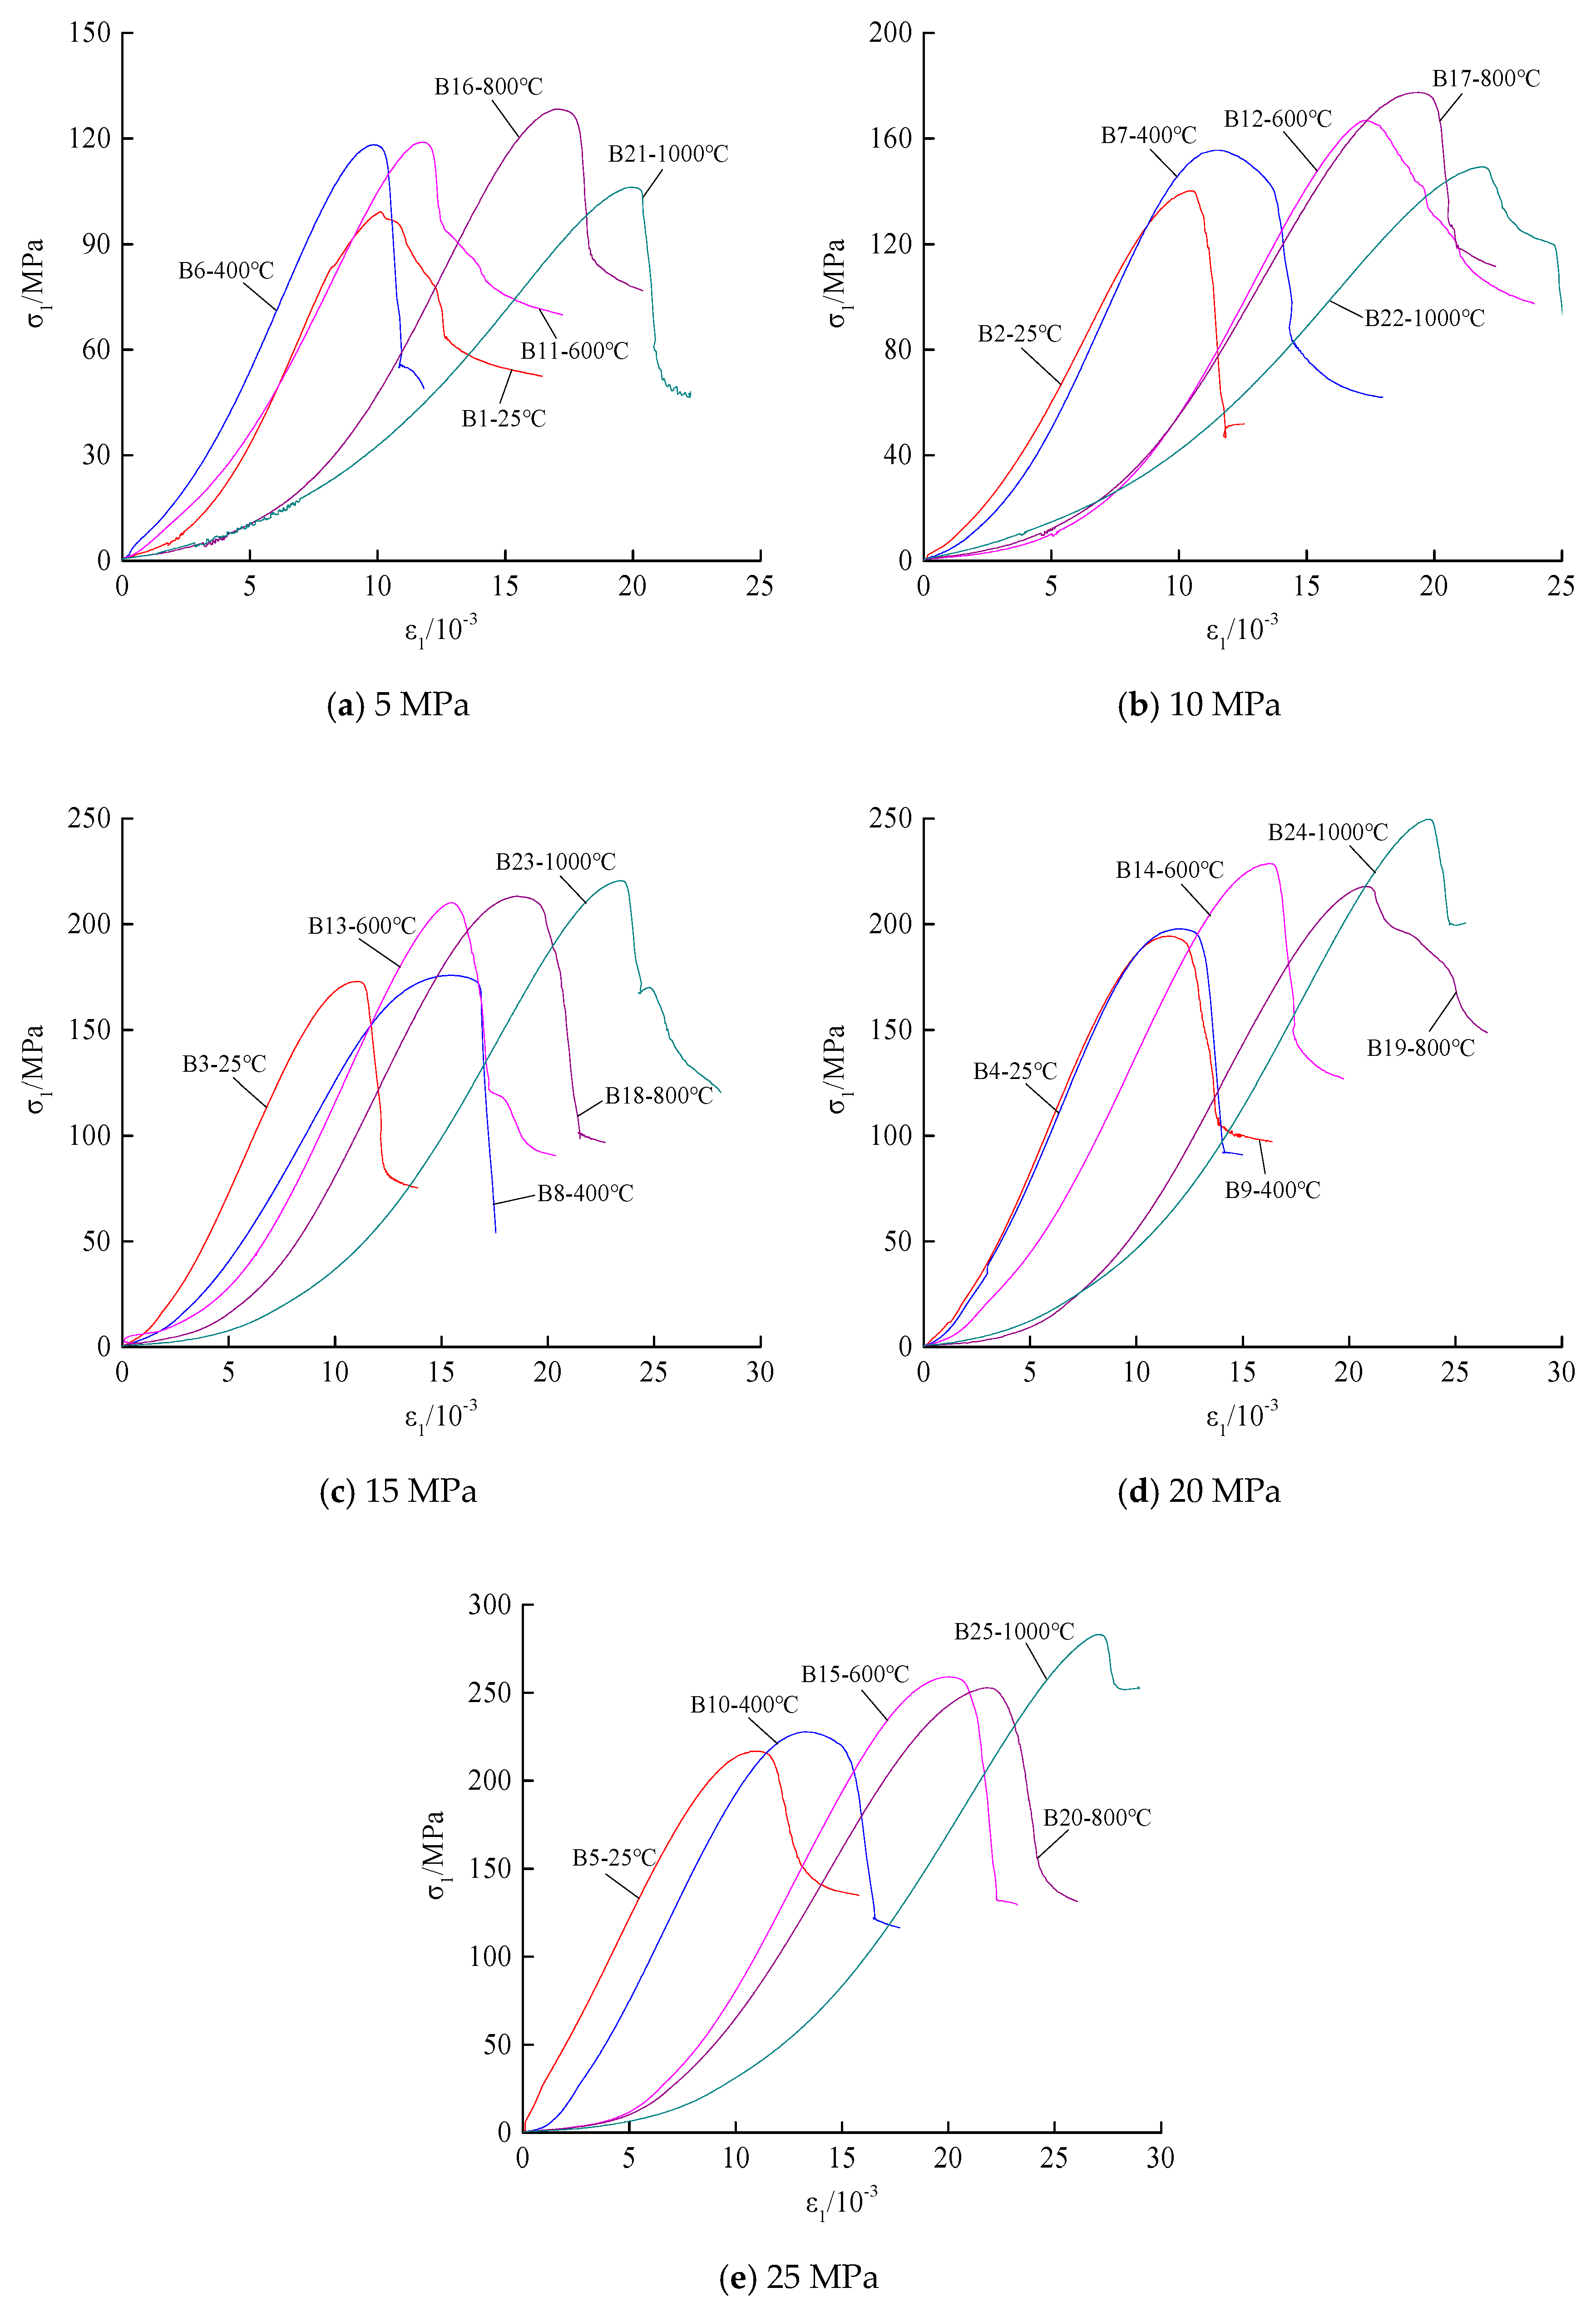
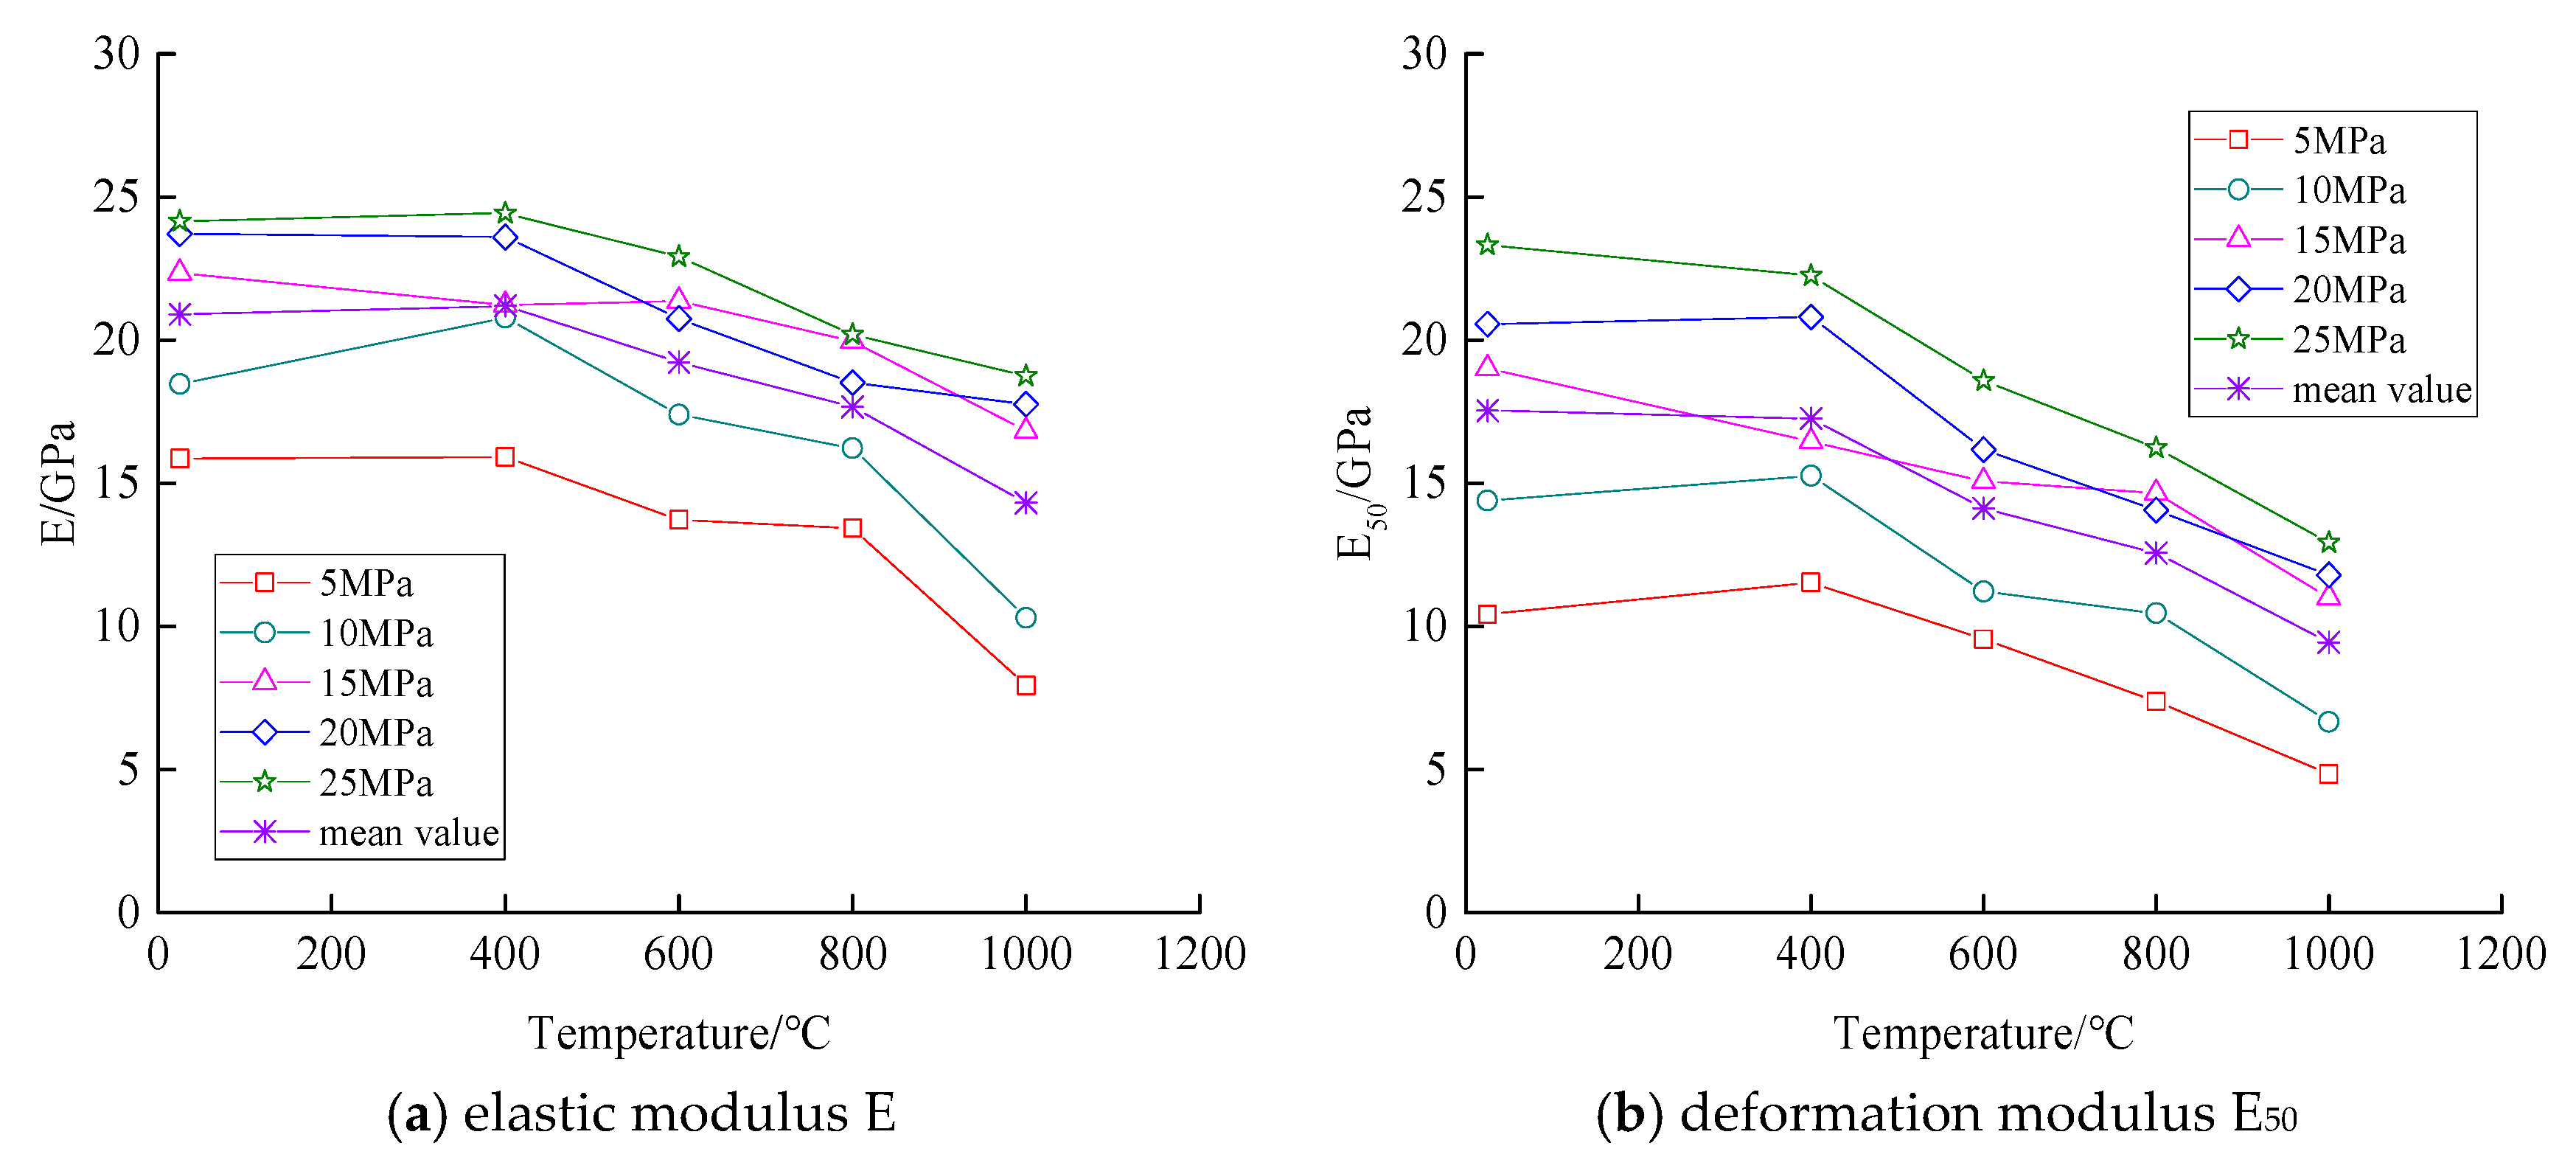
4.3.1. Deformation Properties
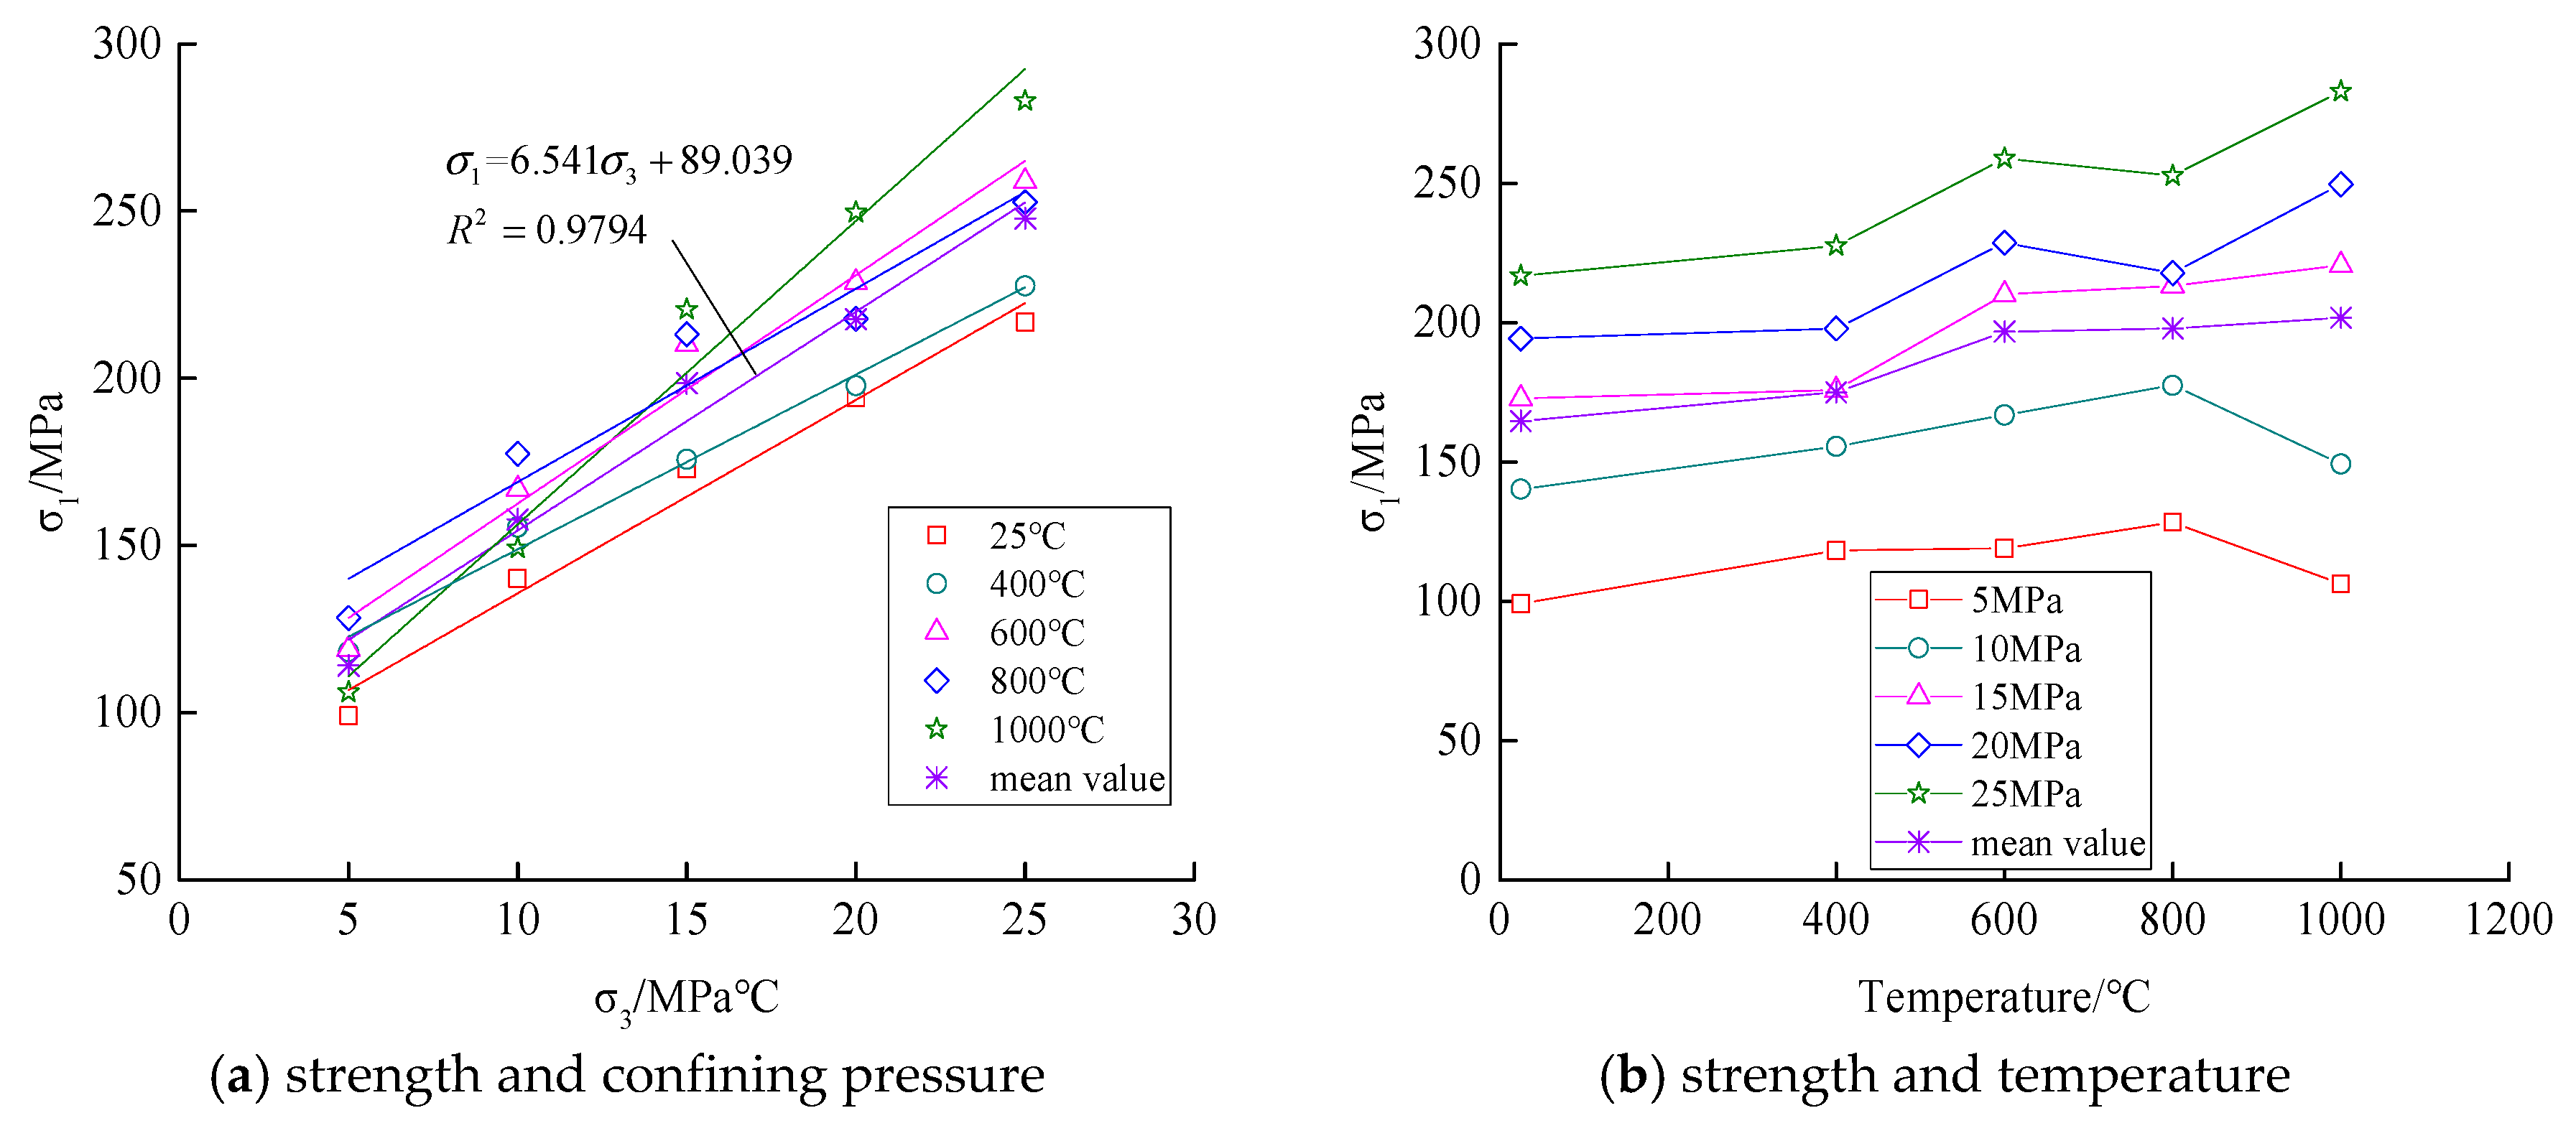
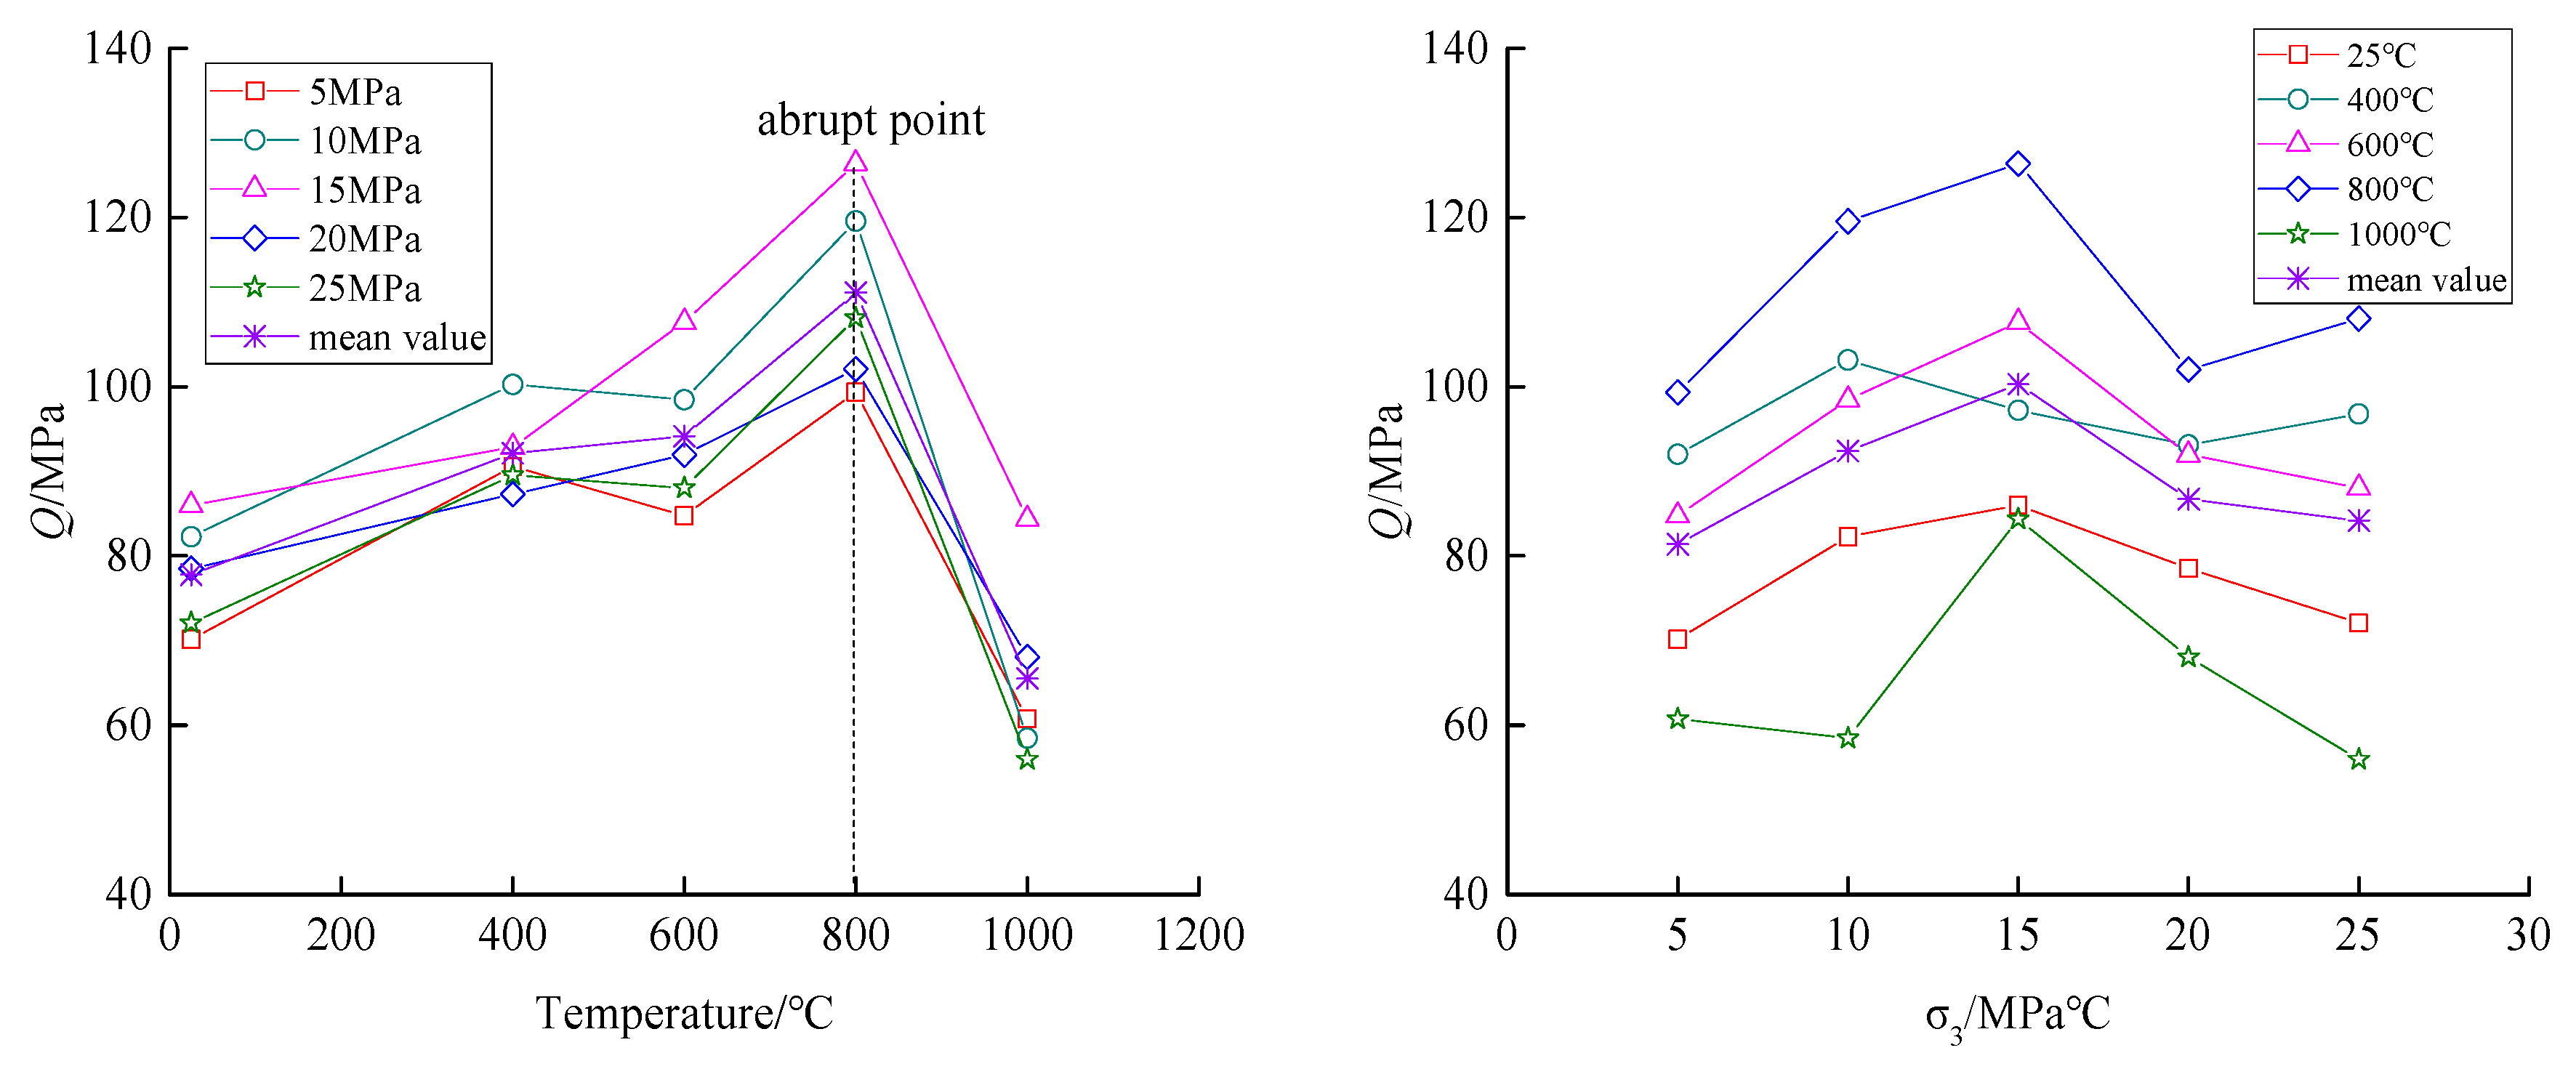
4.3.2. Strength Properties
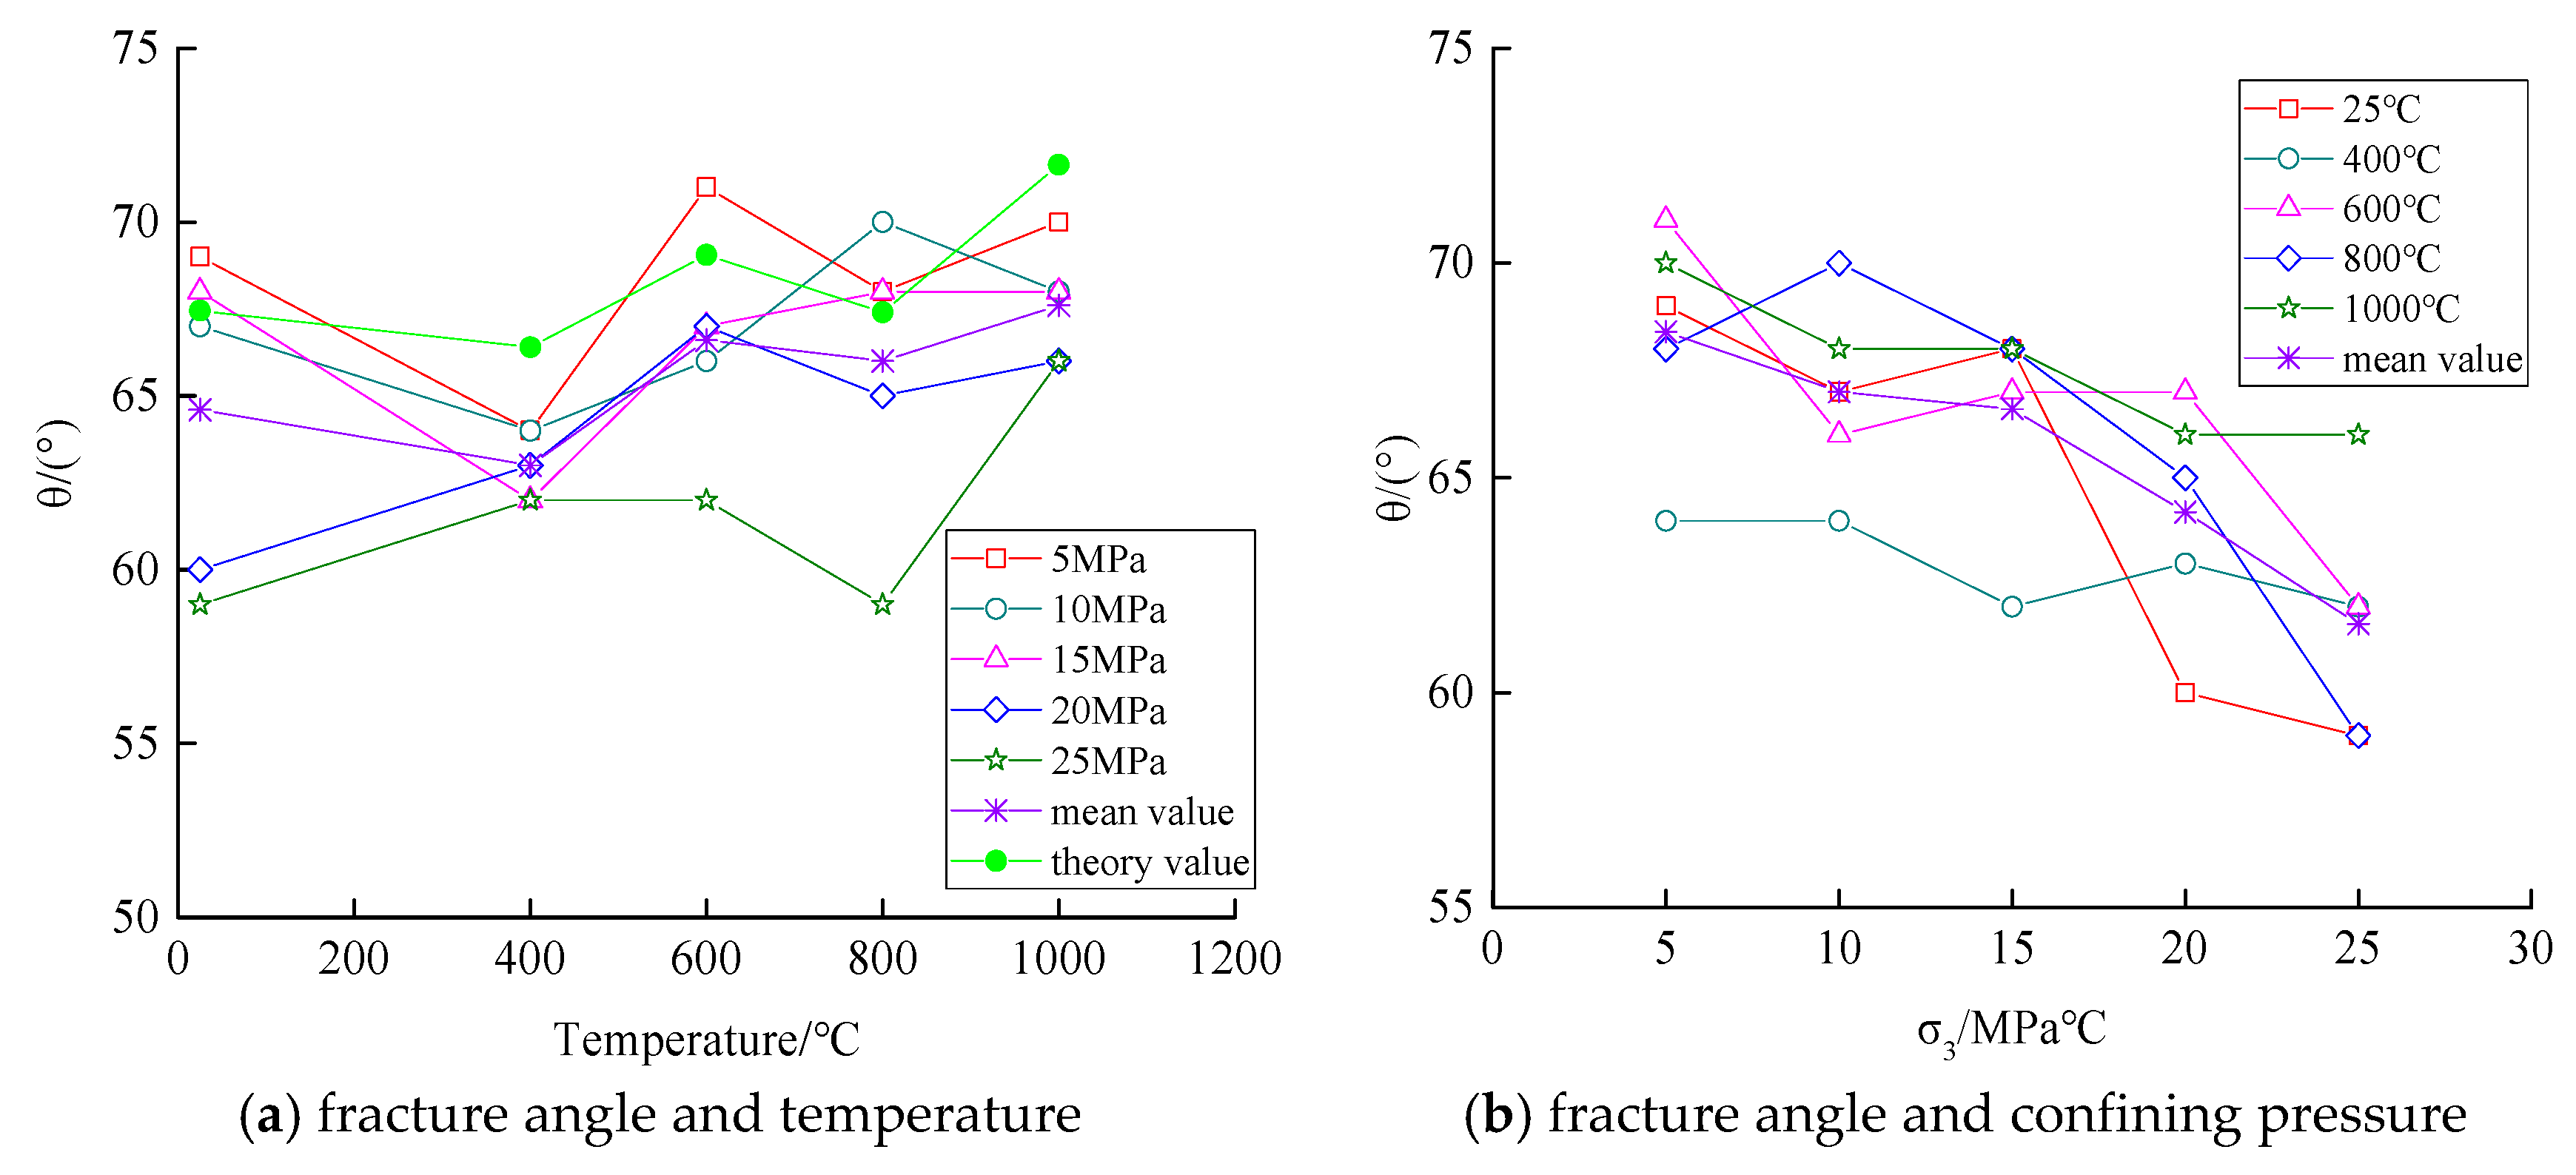
4.3.3. Failure Patterns
5. Discussion
6. Conclusions
- (1)
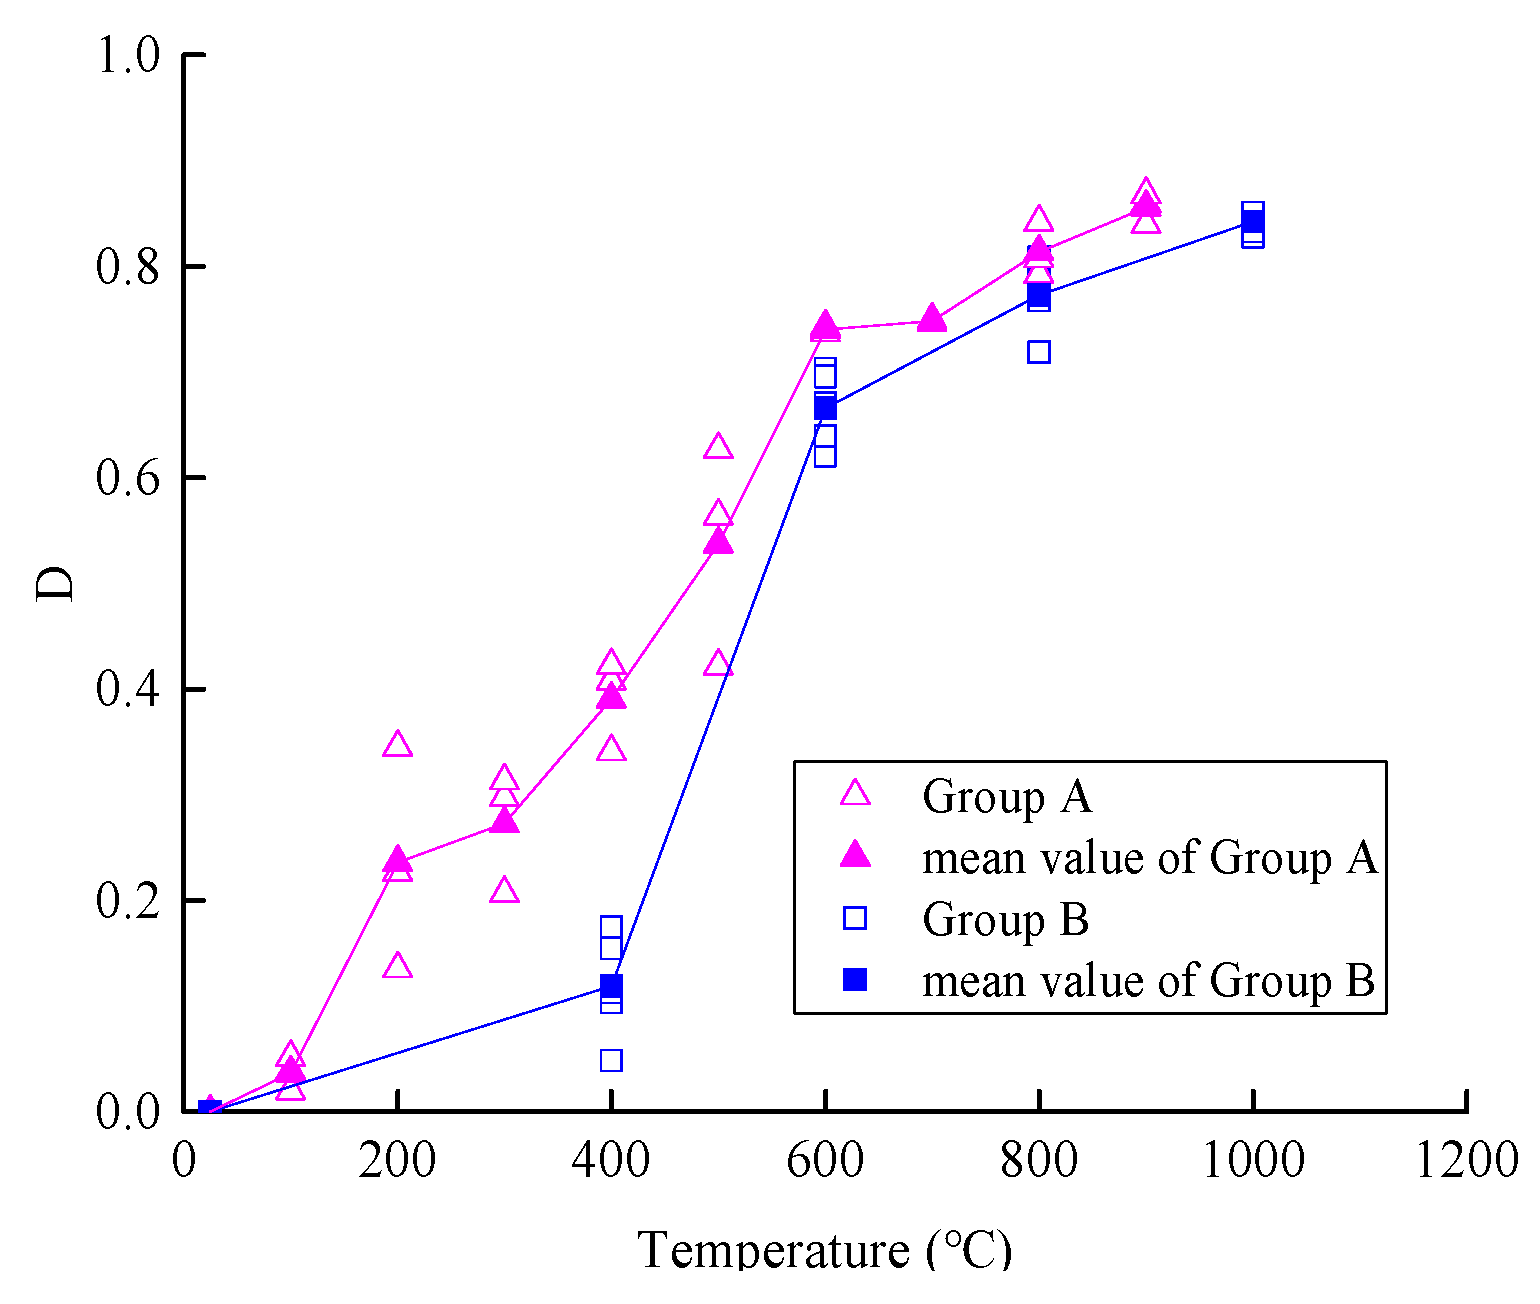
- With the increase of temperature, the longitudinal wave velocity gradually decreases, and the damage factor of temperature gradually increases.
- (2)
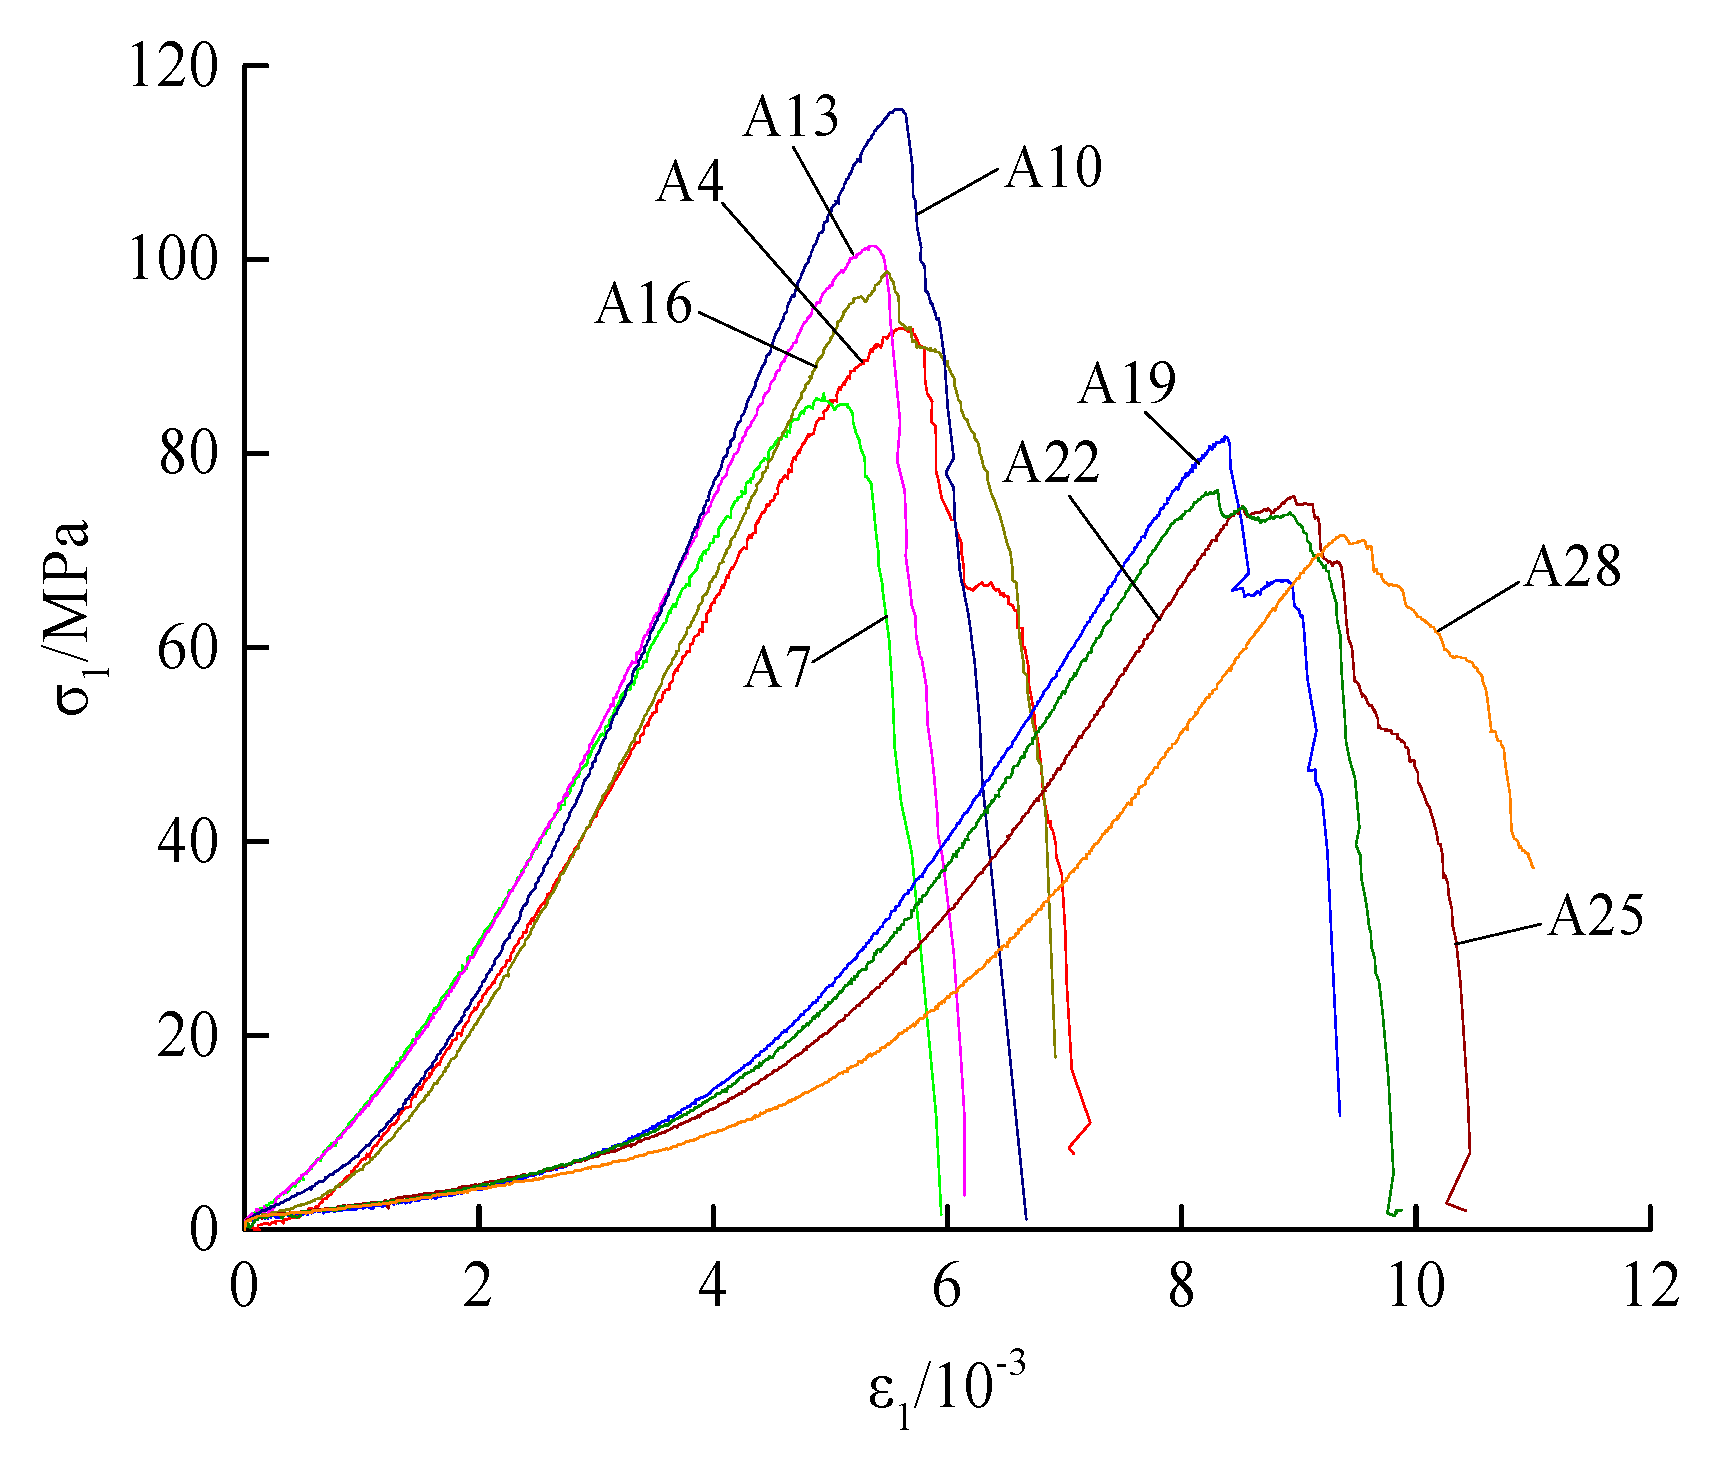
- For uniaxial compression tests at different temperatures, the high temperature action within 500 °C has a strengthening effect on the compression strength, and the high temperature effect has a weakening effect on the compression strength exceed 500 °C, so 500 °C is the temperature threshold.
- (3)
- For triaxial compression tests at different temperatures, the rock strength is positively correlated with temperature and confining pressure when the temperature is lower than 800 °C and the confining pressure is lower than 15 MPa; the rock strength is negatively correlated with temperature and confining pressure when the temperature is over 800 °C and confining pressure is above 15 MPa, so 800 °C is the temperature threshold, and 15 MPa is the confining pressure threshold.
- (4)
- In the triaxial compression, the actual fracture angle of the sample at high temperatures is basically the same as the theoretical calculation value, the high temperature has little effect on the actual fracture angle of the sample, and the actual fracture angle is negatively correlated with the confining pressure.
Author Contributions
Funding
Conflicts of Interest
References
- He, G.L.; Wu, G.; Huang, X.C.; Zhang, L.; Qiu, Y.P. Experimental study on ultrasonic properties of sandstone before and after high temperature. Rock Soil Mech. 2007, 28, 779–784. [Google Scholar]
- Zuo, J.P.; Zhou, H.W.; Liu, Y.J. Research on characteristic parameters of sandstone three-point bending failure under different temperatures. Chin. J. Rock Mech. Eng. 2010, 29, 705–712. [Google Scholar]
- Zuo, J.P.; Xie, H.P.; Liu, Y.J. Investigation on fracture characteristics of sandstone after thermal effects through three-bending point experiments. Chin. J. Solid Mech. 2010, 31, 119–126. [Google Scholar]
- Wu, G.; Xing, A.G.; Zhang, L. Mechanical characteristics of sandstone after high temperature. Chin. J. Rock Mech. Eng. 2007, 26, 2110–2116. [Google Scholar]
- Wu, G.; Wang, Y.; Zhai, S.T. Acoustic emission characteristics of sandstone after high temperature under uniaxial compression. Rock Soil Mech. 2012, 33, 3237–3242. [Google Scholar]
- Wu, G.; Zhai, S.T.; Wang, Y. Research on characteristics of mesostructure and acoustic emission of granite under high temperature. Rock Soil Mech. 2015, 36, 351–356. [Google Scholar]
- You, M.Q.; Su, C.D.; Li, X.S. Study on relation between mechanical properties and longitudinal wave velocities for damaged rock samples. Chin. J. Rock Mech. Eng. 2008, 27, 458–467. [Google Scholar]
- Chen, Y.L.; Ni, J.; Shao, W.; Azzam, R. Experimental study on the influence of temperature on the mechanical properties of granite under uni-axial compression and fatigue loading. Int. J. Rock Mech. Min. Sci. 2012, 56, 62–66. [Google Scholar] [CrossRef]
- Brotóns, V.; Tomás, R.; Ivorra, S.; Alarcon, J.C. Temperature influence on the physical and mechanical properties of a porous rock: San Julian’s calcarenite. Eng. Geol. 2013, 167, 117–127. [Google Scholar] [CrossRef]
- Huang, S.; Xia, K.W. Effect of heat-treatment on the dynamic compressive strength of Longyou sandstone. Eng. Geol. 2015, 191, 1–7. [Google Scholar] [CrossRef]
- Xu, X.L.; Gao, F.; Zhang, Z.Z.; Chen, L. Experimental study of the effect of loading rates on mechanical properties of granite at real-time high temperature. Rock Soil Mech. 2015, 36, 2184–2192. [Google Scholar]
- Yao, W.; Xu, Y.; Wang, W.; Kanopolous, P. Dependence of Dynamic Tensile Strength of Longyou Sandstone on Heat-Treatment Temperature and Loading Rate. Rock Mech. Rock Eng. 2015, 49, 3899–3915. [Google Scholar] [CrossRef]
- Yu, J.; Chen, X.; Li, H.; Zhou, J. Effect of freeze-thaw cycles on mechanical properties and permeability of red sandstone under triaxial compression. J. Mt. Sci. 2015, 12, 218–231. [Google Scholar] [CrossRef]
- Chmel, A.; Shcherbakov, I. Microcracking in impact-damaged granites heated up to 600 degrees C. J. Geophys. Eng. 2015, 12, 485–491. [Google Scholar] [CrossRef]
- Geng, J.S.; Sun, Q.; Zhang, W.Q.; Lü, C. Effect of high temperature on mechanical and acoustic emission properties of calcareous-aggregate concrete. Appl. Therm. Eng. 2016, 106, 1200–1208. [Google Scholar] [CrossRef]
- Huang, Z.P.; Zhang, Y.; Wu, E.D. Analysis of mechanical and wave properties of heat-treated marble by water cooling. Rock Soil Mech. 2016, 37, 367–375. [Google Scholar]
- Su, C.D.; Wei, S.J.; Qin, B.D.; Yang, Y.S. Experimental study of influence mechanism of high temperature on mechanical properties of fine-grained sandstone. Rock Soil Mech. 2017, 38, 623–630. [Google Scholar]
- Su, C.D.; Guo, W.B.; Li, X.S. Experimental research on mechanical properties of coarse sandstone after high temperatures. Chin. J. Rock Mech. Eng. 2008, 27, 1162–1170. [Google Scholar]
- Ma, J.H.; Wei, S.J.; Su, C.D. Effect of high temperature on the mechanical properties of the sandstone physical weak bond. J. Min. Saf. Eng. 2017, 34, 155–162. [Google Scholar]
- Huang, Y.H.; Yang, S.Q. The tensile mechanical behavior of granite containing pre-existing holes after high temperature treatment. J. China Univ. Min. Technol. 2017, 46, 783–791. [Google Scholar]
- Shao, Z.S.; Wu, K.; Yuan, Y. Theoretical investigation on rock rheological characteristics in variable temperature field. Chin. J. Appl. Mech. 2018, 35, 962–969. [Google Scholar]
- Li, E.B.; Wang, Y.C.; Chen, L.; Liu, Y. Experimental study of mechanical properties of Beishan granite’s thermal damage. J. China Univ. Min. Technol. 2018, 47, 735–741. [Google Scholar]
- Kong, B.; Wang, E.Y.; Li, Z.H.; Wang, X.R.; Niu, Y.; Kong, X.G. Acoustic emission signals frequency-amplitude characteristics of sandstone after thermal treated under uniaxial compression. J. Appl. Geophys. 2017, 136, 190–197. [Google Scholar] [CrossRef]
- Becattini, V.; Motmans, T.; Zappone, A.; Madonna, C.; Haselbacher, A.; Steinfeld, A. Experimental investigation of the thermal and mechanical stability of rocks for high-temperature thermal-energy storage. Appl. Energy 2017, 203, 373–389. [Google Scholar] [CrossRef]
- Zhang, D.M.; Yang, Y.S.; Yang, H.; Chu, Y.P.; Yang, S. Experimental study on the effect of high temperature on the mechanical properties and acoustic emission characteristics of gritstone. Results Phys. 2018, 9, 1609–1617. [Google Scholar] [CrossRef]
- Ersoy, H.; Hasan Kolayli, H.; Karahan, M.; Karahan, H.; Sünnetci, M.O. Effect of thermal damage on mineralogical and strength properties of basic volcanic rocks exposed to high temperatures. Bull. Eng. Geol. Environ. 2019, 78, 1515–1525. [Google Scholar] [CrossRef]
- Coal Industry Ministry of the People’s Republic of China. Measuring Methods of Physico-Mechanical Properties for Coal and Rock; Standards Press of China: New York, NY, USA, 1988; pp. 32–33. [Google Scholar]
- Kahraman, S.; Yeken, T. Determination of physical properties of carbonate rocks from P-wave velocity. Bull. Eng. Geol. Environ. 2008, 67, 277–281. [Google Scholar] [CrossRef]
- Pappalardo, G.; Mineo, S.; Monaco, C. Geotechnical characterization of limestones employed for the reconstruction of a UNESCO world heritage Baroque monument in southeastern Sicily (Italy). Eng. Geol. 2016, 212, 86–97. [Google Scholar] [CrossRef]
- Pappalardo, G.; Punturo, R.; Mineo, S.; Contrafatto, L. The role of porosity on the engineering geological properties of 1669 lavas from Mount Etna. Eng. Geol. 2017, 221, 16–28. [Google Scholar] [CrossRef]
- Torok, A.; Vasarhelyi, B. The influence of fabric and water content on selected rock mechanical parameters of travertine, examples from Hungary. Eng. Geol. 2010, 115, 237–245. [Google Scholar] [CrossRef]
- Tugrul, A.; Zarif, I.H. Engineering aspects of limestone weathering in Istanbul, Turkey. Bull. Eng. Geol. Environ. 2000, 58, 191–206. [Google Scholar] [CrossRef]
- You, M.Q. Mechanical Properties of Rocks; Geological Publishing House: Beijing, China, 2007; pp. 25–26. [Google Scholar]


| T/°C | k | Q/MPa | R2 |
|---|---|---|---|
| 25 | 5.786 | 77.80 | 0.979 |
| 400 | 5.233 | 96.61 | 0.989 |
| 600 | 6.833 | 94.17 | 0.973 |
| 800 | 5.784 | 111.20 | 0.940 |
| 1000 | 9.078 | 65.61 | 0.975 |
© 2019 by the authors. Licensee MDPI, Basel, Switzerland. This article is an open access article distributed under the terms and conditions of the Creative Commons Attribution (CC BY) license (http://creativecommons.org/licenses/by/4.0/).
Share and Cite
Wei, S.; Yang, Y.; Su, C.; Cardosh, S.R.; Wang, H. Experimental Study of the Effect of High Temperature on the Mechanical Properties of Coarse Sandstone. Appl. Sci. 2019, 9, 2424. https://doi.org/10.3390/app9122424
Wei S, Yang Y, Su C, Cardosh SR, Wang H. Experimental Study of the Effect of High Temperature on the Mechanical Properties of Coarse Sandstone. Applied Sciences. 2019; 9(12):2424. https://doi.org/10.3390/app9122424
Chicago/Turabian StyleWei, Sijiang, Yushun Yang, Chengdong Su, Syabilla Rachmadina Cardosh, and Hao Wang. 2019. "Experimental Study of the Effect of High Temperature on the Mechanical Properties of Coarse Sandstone" Applied Sciences 9, no. 12: 2424. https://doi.org/10.3390/app9122424
APA StyleWei, S., Yang, Y., Su, C., Cardosh, S. R., & Wang, H. (2019). Experimental Study of the Effect of High Temperature on the Mechanical Properties of Coarse Sandstone. Applied Sciences, 9(12), 2424. https://doi.org/10.3390/app9122424