1. Introduction
In engineering, data-driven methods are increasingly being used to develop and optimize new materials and related manufacturing processes. Data-driven methods such as data mining (DM) and machine learning are intended to help where existing empirical knowledge reaches its limits. This is the case, for example, in the development and processing of new materials, the increasing complexity of which must be mastered in order to achieve high quality and efficient production. This requires a detailed understanding of the relationships between material, machine, tool, and product properties.
Another field of application for data-driven methods focuses on increasing efficiency in production. For example, methods for condition monitoring and need-based maintenance are being developed to increase plant availability and ultimately improve productivity.
The application of data-driven methods in engineering and production technology was made possible by the extended sensory capabilities of machines and tools, powerful networking technology, and the availability of practicable analysis software.
Data mining is commonly used in many fields (e.g., computer science, financial services) and therefore, several process models are available to lead through such projects. These conventional DM methodologies (e.g., KDD, SEMMA, CRISP-DM [
1]) address the knowledge discovery in existing databases while in the engineering domain this is often not the case. Several engineering tools (e.g., LABVIEW [
2], XperiDesk [
3]) often support data collection but do not have a toolchain to support data mining projects. This problem should be addressed by the process model presented here. While data can be acquired and connected more and more easily, the collaboration of technical competences is still missing [
4].
Therefore, it is the objective of research at the Institute of Mechatronic Engineering of the TU Dresden, especially at the chair, to develop an engineer-suitable procedure for DM. The result is the DM methodology for engineering applications (DMME)—a holistic extension to the CRISP-DM model, which abstracts and summarizes the experiences from numerous research projects. DMME is a general, systematic methodical approach for DM in an engineering context.
The combination of the networking expertise of computer scientists, the data mining expertise of mathematicians and the engineers’ competences on failure mode and effect analysis in technical systems is the major advantage of the methodology.
This enables DM in a common way as supposed by CRISP-DM with benefits in data quality assessment and the technical interpretation of DM findings.
The DMME is already in use in current projects and teaching.
2. Requirements for the New Methodology
The experiences from previous projects have shown that in the area of engineering several important tasks have to be processed in the DM project, which go far beyond pure data analysis. As described in the introduction, data is often not available by default and the DM methodologies do not support guidance in data collection. Therefore, the data needs to be collected first by choosing suitable sensors and data acquisition methods. The necessary signals and required data quality are directly connected to the research question of the project. Data acquisition as well as the traceability and use of DM results are integral components of production systems and processes. Here, the DM results unfold their economic dimension and here they are directly safety-relevant. This means that the installation of DM-relevant software and hardware must not disrupt any processes or cause any damage to people, the environment, or resources. For this reason, DM projects have to be handled holistically by engineers. From an engineer’s point of view, this leads to the following requirements for a holistic approach in DM:
First, a transformation of the business objectives into a technical task is required to clearly define technical strategies to achieve the business goals [
1].
Methods are needed to derive relevant influencing parameters (e.g., load, condition) on the target variables. First, it has to be worked out which parameters have to be measured. The more complex the system interactions become, the more important a systematic approach becomes [
5]. Methods such as Ishikawa diagrams, Pareto diagrams, or cause–effect diagrams can help here.
The development of a suitable measurement and data acquisition technology requires a link to the targeted DM algorithms. For the selection of measurement methods and associated sensors, technical performance parameters must be known which depend not insignificantly on the data quality required by the DM algorithm. This also applies to the data transmission path [
6].
The DM project must take into account the conditions of a running production which must not be disturbed by the DM project. The approach of the engineers often considers this with proof of concepts or testbeds. These are used to develop a first working solution outside production. After that, the implementation into the production systems takes place.
The engineering knowledge on the behavior of the machines and the interactions in the processes is to be incorporated into the DM strategy. Usually, new connections are not the main subject of the search, but previous knowledge is reproduced and perfected with the DM investigations. In order to keep the effort of complex investigations targeted and low, methods of designs of experiments can be used. Thus, according to the analysis task, targeted parameter specifications are given in the test series and more complex correlations can be uncovered with fewer tests.
In general, it is necessary that an engineer-suitable procedure for DM brings together the necessary expertise for the analysis and to the IT with the domain-specific knowledge of the manufacturing. Since the occurring DM applications are very diverse, a generic procedure model is needed for data mining in production engineering.
The holistic DM approach must cover the whole value chain from planning and implementation of the DM solution to documentation, permanent success control, and continuous improvement.
A simple applicability of this holistic approach for the engineers is also desirable. Supporting libraries for the situational optimal selection of measurement methods and sensors or of the problem-oriented evaluation algorithms can contribute to this. Also helpful would be integrated knowledge memories for lessons learnt or best practices. These modules can be based on the extended methodical procedure for DM and can be used in further development work for an assistance software.
3. State of the Art
The current state of the process models was researched under the focus of the above-mentioned requirements for an engineering-compatible approach in DM projects. In general, the methods searched for here are classified in the area of knowledge discovery in databases (KDD). KDD was coined as a term for a general process [
7] in which knowledge is found from data with the help of data analysis algorithms. KDD comprises the following phases: (1) selection of target data to focus on, (2) preprocessing and cleaning data to obtain consistent data, (3) transformation to reduce dimensions of data, (4) data mining to search for patterns of interest, (5) interpretation and evaluation of mined patterns. Essentially, there are two common methodological approaches. These are, as described in [
1,
8], the methods SEMMA and CRISP-DM, derived on the basis of KDD.
SEMMA stands for sample, explore, modify, model, and assess. SEMMA was developed by the SAS Institute. SAS uses SEMMA to methodically organize the functions of its statistical and business intelligence software. CRISP-DM stands for CRoss-Industry Standard Process for Data Mining and is the result of a cooperation between IBM and other industrial companies. CRISP-DM is comprehensively documented [
9] and serves as a general procedure for DM. In the SPSS software, CRISP-DM is used to manage DM projects. Both methods, SEMMA and CRISP-DM, are considered similar by [
1,
8]. They differ at most in the emphasis of individual phases. Since both procedure models are implemented in software systems for DM that are widely used in each case, their application is also very widespread. At the detailed level, many different industry applications have emerged.
An example is the adaptation of CRISP-DM in the medical field [
10]. However, engineering adaptations of CRISP-DM also show the need for more systematic task-specific support when using DM or ML. For example, in [
11], CRISP-DM is linked to Process Failure Mode and Effects Analysis (PFMEA) and Quality Function Deployment (QFD) methods to support the selection of data sources relevant to solving business objectives. The work in [
12] takes up the challenges facing the manufacturing industry in selecting the appropriate algorithms for the use of machinery and process data and presents a guideline based on CRISP-DM.
In summary, it can be stated that the well-known DM procedure models assume that the data is already available. Under this assumption, these approaches focus on data analysis. Domain-specific problems are not explicitly addressed. In preparation for the DM, the engineers must first take care of measuring the problem-relevant data in the correct quality in the production systems. This must be done in collaboration with the following KDD.
Numerous projects have demonstrated the need to combine the skills of engineers and IT specialists and data analysts. In [
13], this was already taken up and an extension of the workflow of CRISP-DM was suggested. The aim of the extension is to divide the extensive tasks of the engineers into independent phases. Thus, a better overview will facilitate the linkage to further aspects like to the project management. In [
13], CRISP-DM was selected for the extension of KDD for engineering applications, because a stronger integration into the business strategy is supported. This feedback is considered essential for the success of DM in production, as DM projects in industry cause extensive organizational, manufacturing, and business impacts due to the interventions in the production systems, which need to be managed. On the other hand, the technical success of the DM must be directly transformed back into the economic dimension. This direct interrelation is usually lacking in the current planning fundamentals. This complicates the concrete understanding of benefits and inhibits project offensives.
The concept of [
13] is underpinned in
Section 4 and illustrated in
Section 5 with an example. The example demonstrates the development of pattern recognition in the data from the machine drive controller to detect faults and their causes in the machine drive.
4. Concept DMME
Data mining methodology for engineering applications (DMME) is a holistic extension to the CRISP-DM model. DMME supports the methodical steps, which the engineers have to observe and process in order to achieve their development goals data-driven. The formulation of the additional engineer-focused steps results from the generalization and systematization of many data-driven engineering projects carried out in the area of machine tools development and adaptive controls. DMME is continuously evaluated and improved in current projects. In this respect, the concept explained below represents the current state of development.
In principle, the additional steps represent all tasks dealing with the physical, technical, and technological context of the application of data-driven methods. Before data-driven projects can be implemented, the technical understanding of the tasks must first be built up. This is the prerequisite for the development and implementation of a targeted measurement strategy in order to create an analysis-capable database.
From a current perspective, the additional steps can be conveniently classified as the phases “Technical Understanding & Conceptualization” and “Technical Realization & Testing” as well as a further task “Technical Implementation” in the Deployment phase in the CRISP-DM workflow.
Figure 1 shows this classification. In the following section, the methodological steps are explained in detail. It should be pointed out in advance that the tasks to be processed are usually processed iteratively. The iteration loops are performed optionally and are not described here for reasons of clarity. The classic steps of CRISP-DM are not discussed here, as they are already comprehensively documented [
9].
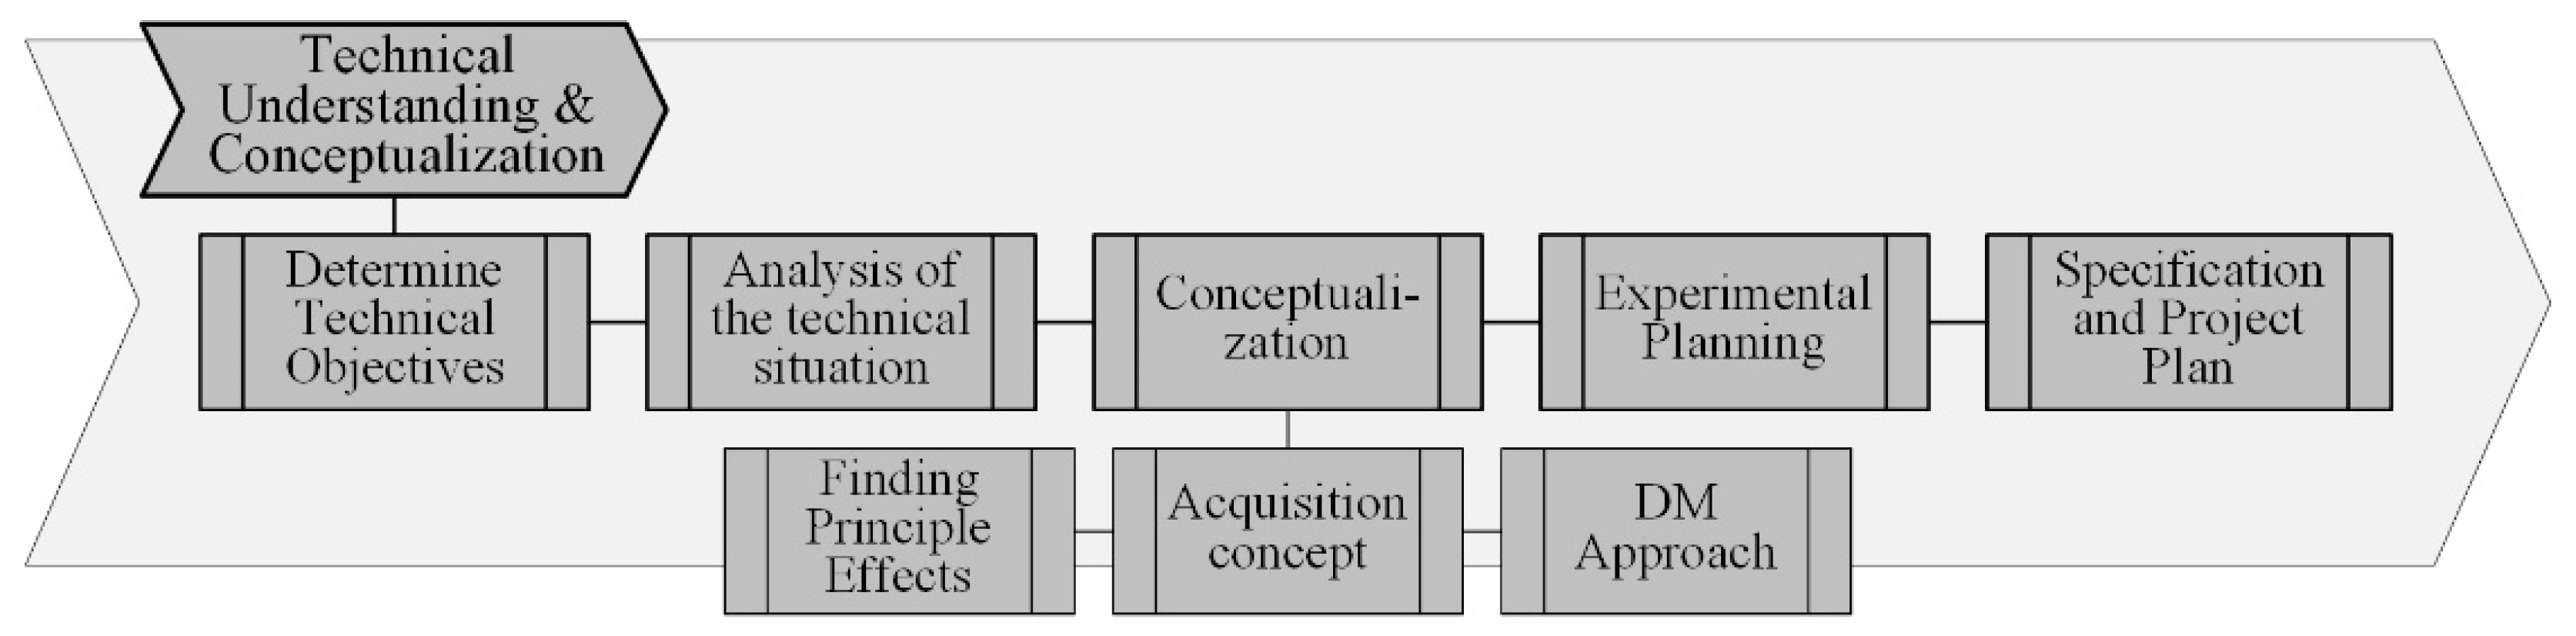
4.1. Technical Understanding and Conceptualization
The objectives of this phase are to transform the business objectives into measurable technical objectives, to gather existing knowledge about the physical and process-related interactions related to this, to develop a DM idea and a technical concept for data acquisition, as well as a test and experimental plan. The following tasks shown in
Figure 2 are to be carried out:
determine technical objectives,
analysis of the technical situation,
conceptualization,
experimental planning,
specification and project plan.
At the end of the “Technical Understanding & Conceptualization” phase, the required implementable concept descriptions, the test plans for the concept test and for knowledge generation as well as detailed project plans are available.
4.1.1. Determine Technical Objectives
In this task, it is to be worked out which technical tasks are to be solved in order to achieve the business objectives and which technical objectives are to be achieved. The following activities are processed:
Define which objects (machine, component, tool, etc.), which processes (usage process or product) and which DM use cases (support of sampling processes, improvement of quality and productivity, reduction of downtimes, condition monitoring, predictive maintenance, or as in our example development of smart products) are to be examined.
Define the main phenomena (product faults, plant availability, causes of plant malfunctions, wear, etc.) to be investigated.
Find out what constraints (such as project timeframe, testing inside or outside of production, budget) and requirements (Who are the users of the solution? Will a single or generic solution be targeted?) apply to the project.
Define the technical goals as well as measurable evaluation variables for success in a requirement specification.
Output of the task is a requirement specification with the system definition, technical objective with target values and constraints.
4.1.2. Analysis of the Technical Situation
In preparation for the development work, the initial situation is analyzed in this task. This analysis is an important basis for the development of the solution, both in terms of technical equipment and algorithmic strategy. The following activities will be worked on:
Analyze how the system is structured and equipped. It is important to maintain the relation to the objective and to select the system components that are important for the task. System boundaries that are defined as too large generate additional work, system boundaries that are defined as too narrow may ignore important influences, and the DM solution may only function to a limited extent.
Gather knowledge about relevant problems or phenomena and find out under which conditions they occur. Determine the existing expertise about relevant physical or technological interactions or influences on the target variables. Involve all experts (such as designers, workers, manufacturing process planners, quality assurance personnel, maintenance personnel, customer advisors, etc.) in the analyses, who can contribute their experience to the task from their respective perspectives.
Analyze which parameters can be acquired with the currently installed sensors and made available via the interfaces. Check which data formats and qualities the data sources provide. Analyze the implemented measurement principles (e.g., collocated or non-collocated measurement).
Document the initial technical situation.
Outputs of the task are a description of the initial situation at the technical system and a collection of the existing context-specific knowledge about the system behavior.
4.1.3. Conceptualization
In this task, the solution approach for the DM use cases is usually developed as a proof of concept. The approach first requires an idea of the physical effects with which the technical objective can be mapped. The necessary measurement and data acquisition concepts are developed for this purpose. Already in the early phase, ideas should be developed for the algorithmic procedure and for the mathematical modeling of the searched connections. Both also place demands on measurement methods and data acquisition. The following activities are being worked on:
Finding Principle Effects: Work out which physical effects can represent the technical objective. Consider the knowledge you have gathered and put forward theses that you will check in the following tests. Derive the necessary parameters from the effect to be mapped that are required for the verification of the theses. Parameters from the environment of the system (such as the climate in a production hall) often also influence its behavior. Think about how these parameters can be measured (directly or indirectly). In addition to measurement accuracy, data quality also plays a role. Some requirements to the measuring method and system as well as to the data quality result from the DM algorithm. Evaluate the possibilities and select the measurement methods to be implemented.
Acquisition concept for the parameters: Develop the capture IT concept according to the data quality requirements. Define the interfaces that will be used to capture the necessary data from the data sources. Consider the level of automation of the data collection. Automatic data collection is not always necessary. Especially in proof of concept, manual logging of events and states is often sufficient. Often, the data can first be used via manual file exchange in the analysis software. Consider the requirements for data quantity and data quality, such as sampling rates (ms or h) or format (number, text, image). Finally, compile the additions (interfaces, network technology, servers, software) that are required, taking into account the actual situation.
Approach and Algorithms for Data Mining: Develop the solution approach for the DM. The approach covers the mathematical workflow from data pre-processing to data source synchronization to effects modeling. First, develop a reliable synchronization approach. This determines the assignment of the data from different sources and thus also the data quality. Derive the requirements for the reference systems of the parameters (e.g., time stamp or ID) in order to develop a solution for this in the ‘acquisition concept’ task. Develop an idea with which algorithms you can map the technical objective. For the selection of mathematical algorithms, it is important to consider the quality of the interactions. You should therefore find out whether the interactions are linear or non-linear and how many influencing factors are involved. It also plays an important role whether the boundary conditions of the DM project allow comprehensive test series or only production-accompanying investigations. This influences both the effort and the achievable performance of the DM solution.
Outputs of the task are a description of the DM idea and the associated concepts for acquisition and analyzing the data.
4.1.4. Experimental Planning
In this task the experimental investigations are planned, which are necessary in order to represent the effects at the real system and to generate thereby the desired data. The following activities are to be carried out:
First, determine which scenarios (parameter settings, system configurations, process events) are to be examined.
Specify whether the experiments are to take place inside or outside production. Also, specify whether you only want to observe the system while it is working or whether you want to vary specific parameters.
For testing the “acquisition concept”, it is often advantageous to schedule test experiments before running the “large” effect-related test program in order to first prove that the system is functioning properly.
For the determination of complex interactions, extensive parameter variations usually have to be carried out. For this purpose, the parameter ranges to be considered have to be defined. The application of methods of the design of experiments [
14] can help to improve both the informative value and the effort of the experimental investigations. Take into account the available resources (quantity of test objects, machine availability).
Finally, create the experimental plan and determine which experiments are to be performed with which parameters on which system configuration.
Outputs of the task are the experimental plans for the system test and the knowledge generation.
4.1.5. Specification and Project Plan
The previous tasks have created a detailed view on the project. This task is now used to update the project plan and, if necessary, for subsequent budgeting and has the following tasks:
First, document the DM concept so comprehensively that its implementation is possible.
Determine the required time and resource requirements (time, material, personnel, etc.) from the developed concepts and test plans.
Include the implementation of the draft of the proof of concept in the ‘technical realization’ work package in the project plan.
Align the specified requirements with the project budget.
After approval, initiate the procurement of the required equipment and schedule the test times and resources.
The output of the task is a more precise project plan.
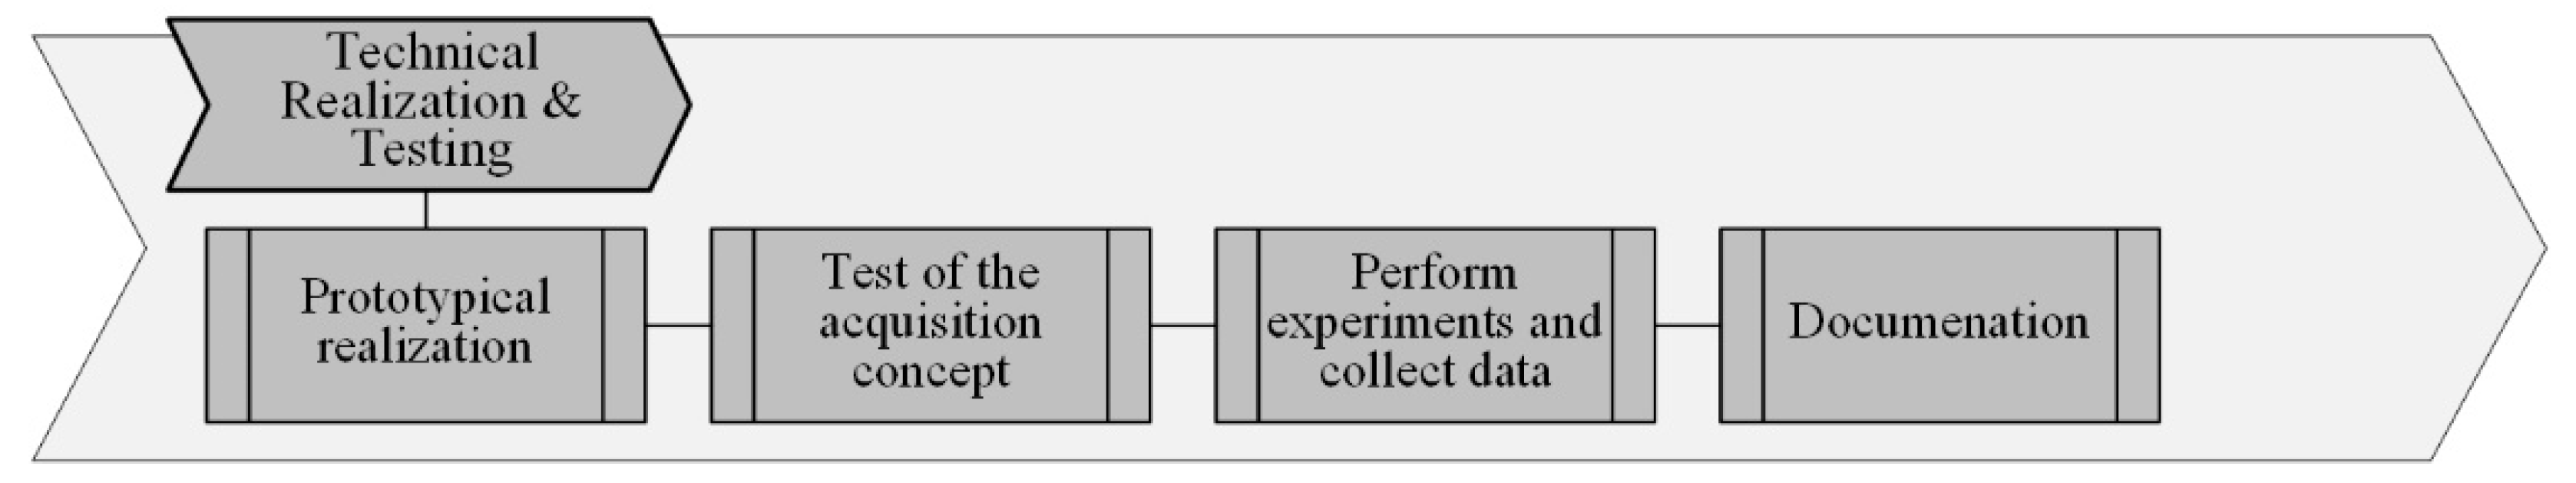
4.2. Technical Realization and Testing
The aim of this phase is to prototype the measurement and data acquisition concepts, to test their functionality and to execute the experimental plans (
Figure 3). As a result, data are generated which has the required data quality and contains all relevant information and characteristics for the subsequent data analysis tasks in order to substantiate the theses and achieve the defined business objectives.
4.2.1. Prototypical Realization
In this task, you build the testbed for the proof of concept according to the design. First, check the installation conditions in the target system and adjust them if necessary. Document the installation conditions and adjustments. Check the functionality of the concept components such as sensors, measuring instruments, and data interfaces with regard to the defined requirements. Improve if necessary. Document the status achieved and the experience gained in implementing the concept.
4.2.2. Test of the Concept
In this task, the overall system (i.e., target system, measurement and data acquisition concept) is evaluated with regard to functionality according to the concept specifications, in particular with regard to compliance with data quality. Document the tests and any adjustments. Output of the task is the target system with the DM-relevant equipment ready for operation.
4.2.3. Perform Experiments and Collect Data
In this task, execute the experimental design prepared in the experimental planning task. Document all steps of the data collection process, including technical constraints, possible sources of error, and the level of data quality. Output of the task is the data required for the development of the DM algorithms.
4.2.4. Documentation
In this task, you log the tests with regard to the work performed and the experience gained as notes for revising the concept or for transferring it to the productive environment later. Document and evaluate the fulfillment of the requirements. In addition, you document the observations made during the experiments, which are important for the interpretation of the data.
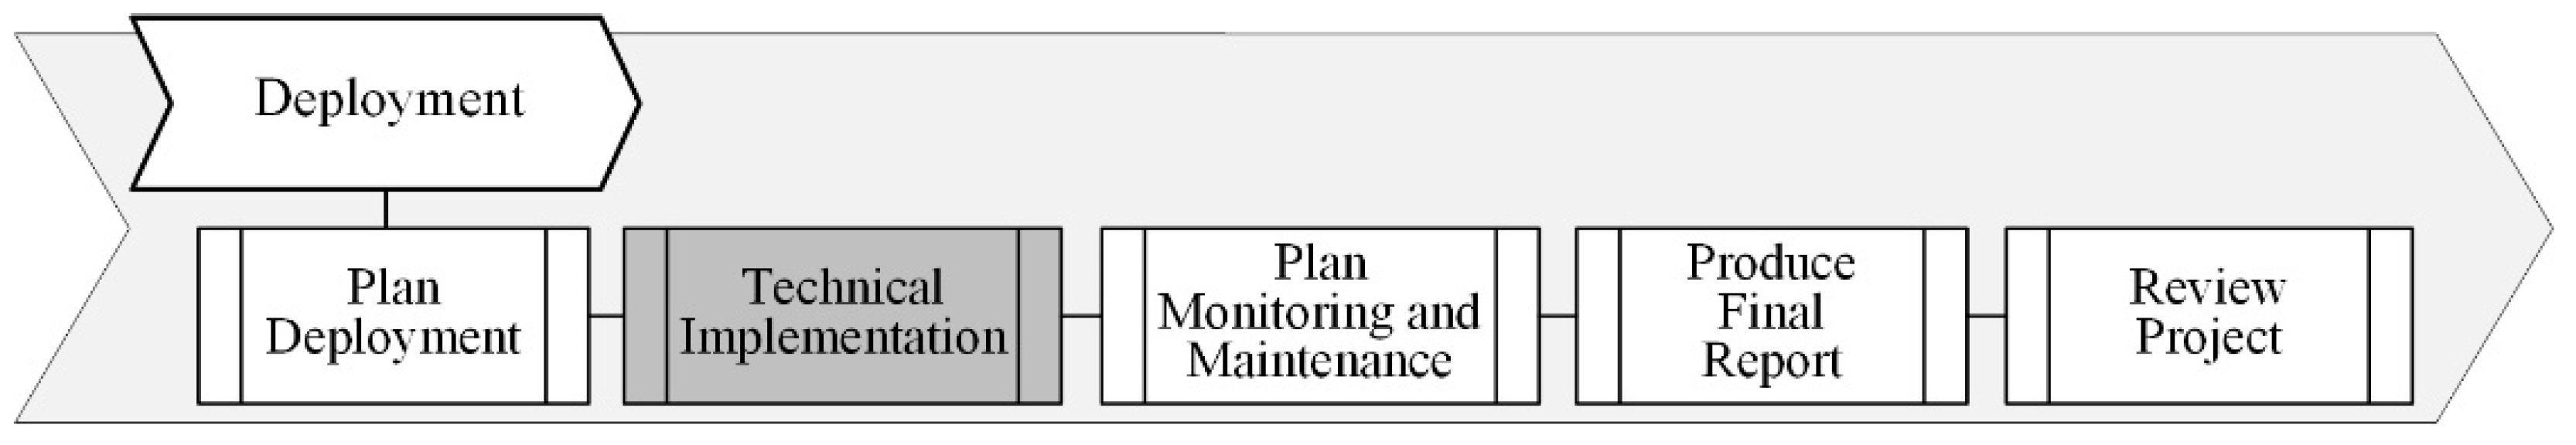
4.3. Technical Implementation
Technical implementation is an additional task in the deployment phase (
Figure 4). The aim of this extensive task is to transfer the functional and evaluated DM concept into the user application in production. That leads to the following tasks:
First, you analyze the specific conditions under which the DM concept is to be applied in production. Ask what additional requirements there are for the integration of data collection and transmission into the company network. Discuss the consequences of transferring the DM concept to other machines, processes, or products. Check whether the measurement equipment used in the proof of concept meets the conditions of production in the long term. Document the resulting requirements.
Develop the robust production solution for both data acquisition and transmission. Take into account the experience gained from the proof of concept studies.
Implement the permanent solution at the production systems. This means that you integrate the technical part into the production system and integrate the software elements into the company’s IT landscape.
Develop control procedures to monitor the reliable operation of the DM solution. Anticipate which errors or interruptions can occur and develop strategies for their elimination.
Train the staff to work with the DM solution. This is very important for the success of the DM methods. Despite all the automated functions, there are operations by the staff that can lead to incorrect data entry. This applies in particular to manual data entry and subjective assessments of system states or product characteristics.
The prototypical DM model is now supplied with runtime data during real production and is used to fulfill the technical objective and finally the business objective.
5. DMME on an Application Example—“Feed Axle”
The procedure model DMME will be illustrated in detail with a project example. The example belongs to the field of drive technology. The aim of the project was to develop a method to monitor the state of the drive and, if necessary, to draw conclusions about the application process of the machine. The data from the drive controller should be used for this purpose. The drive acts as a virtual sensor. No additional sensors should therefore be used. Additional sensors initially cause higher costs. Whereas, the use of existing data can be generalized by system providers and sold as an add-on to customers as a smart product. On the basis of condition monitoring, pattern recognition methods were used to identify disruptions or abnormal application processes or faults and their causes.
The explanations are not intended to demonstrate the practical suitability of the example. The steps of the DMME were used in the example project for specific tasks. This means that the steps are not described to the same extent according to their relevance.
5.1. Business Understanding
The development project was subordinated to the business objective of developing novel product functions that secure and expand the market position of the supplier of drive systems. The aim was to develop smart products in drive technology that would enable users to monitor and analyze the states of the drives during use in the machines and to perform appropriate measures in the event of anomalies. A subgoal was and is the implementation of condition-based maintenance. The benefit for the customer is aimed at, among other things, increasing overall equipment efficiency and ensuring stable manufacturing processes.
The second business objective was to improve the usability of these smart products in order to achieve a further advantage for customers. As a strategy for the improvement of usability, the “Plug & Play” approach is pursued, with which the smart components can be integrated into the system virtually without additional effort for the customer.
5.2. Technical Understanding and Conceptualization
5.2.1. Determine Technical Objectives
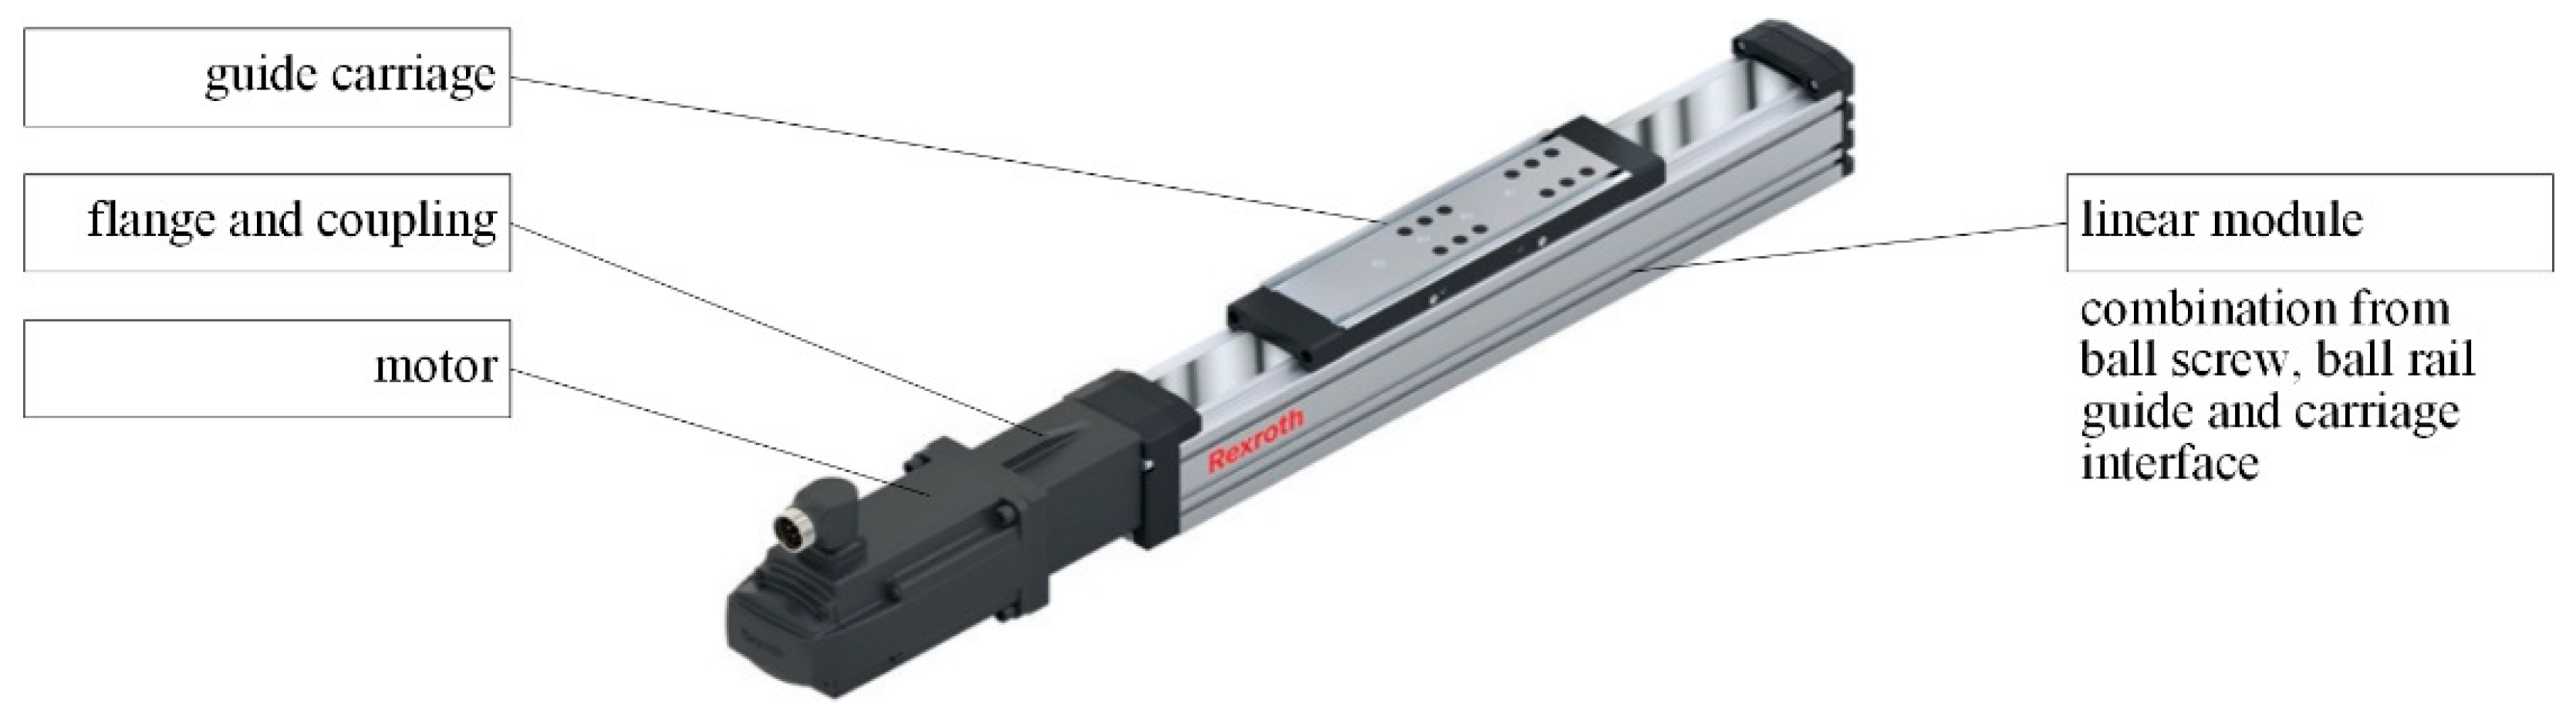
First, the technical use cases for condition-based maintenance were analyzed and evaluated. One of the most important maintenance tasks is the timely relubrication of moving parts in the machine. For this reason, the project objective was specified for the development of a DM method for detecting marginal lubrication. To ensure a good dissemination, the condition monitoring system should be developed for one of the most common product types.
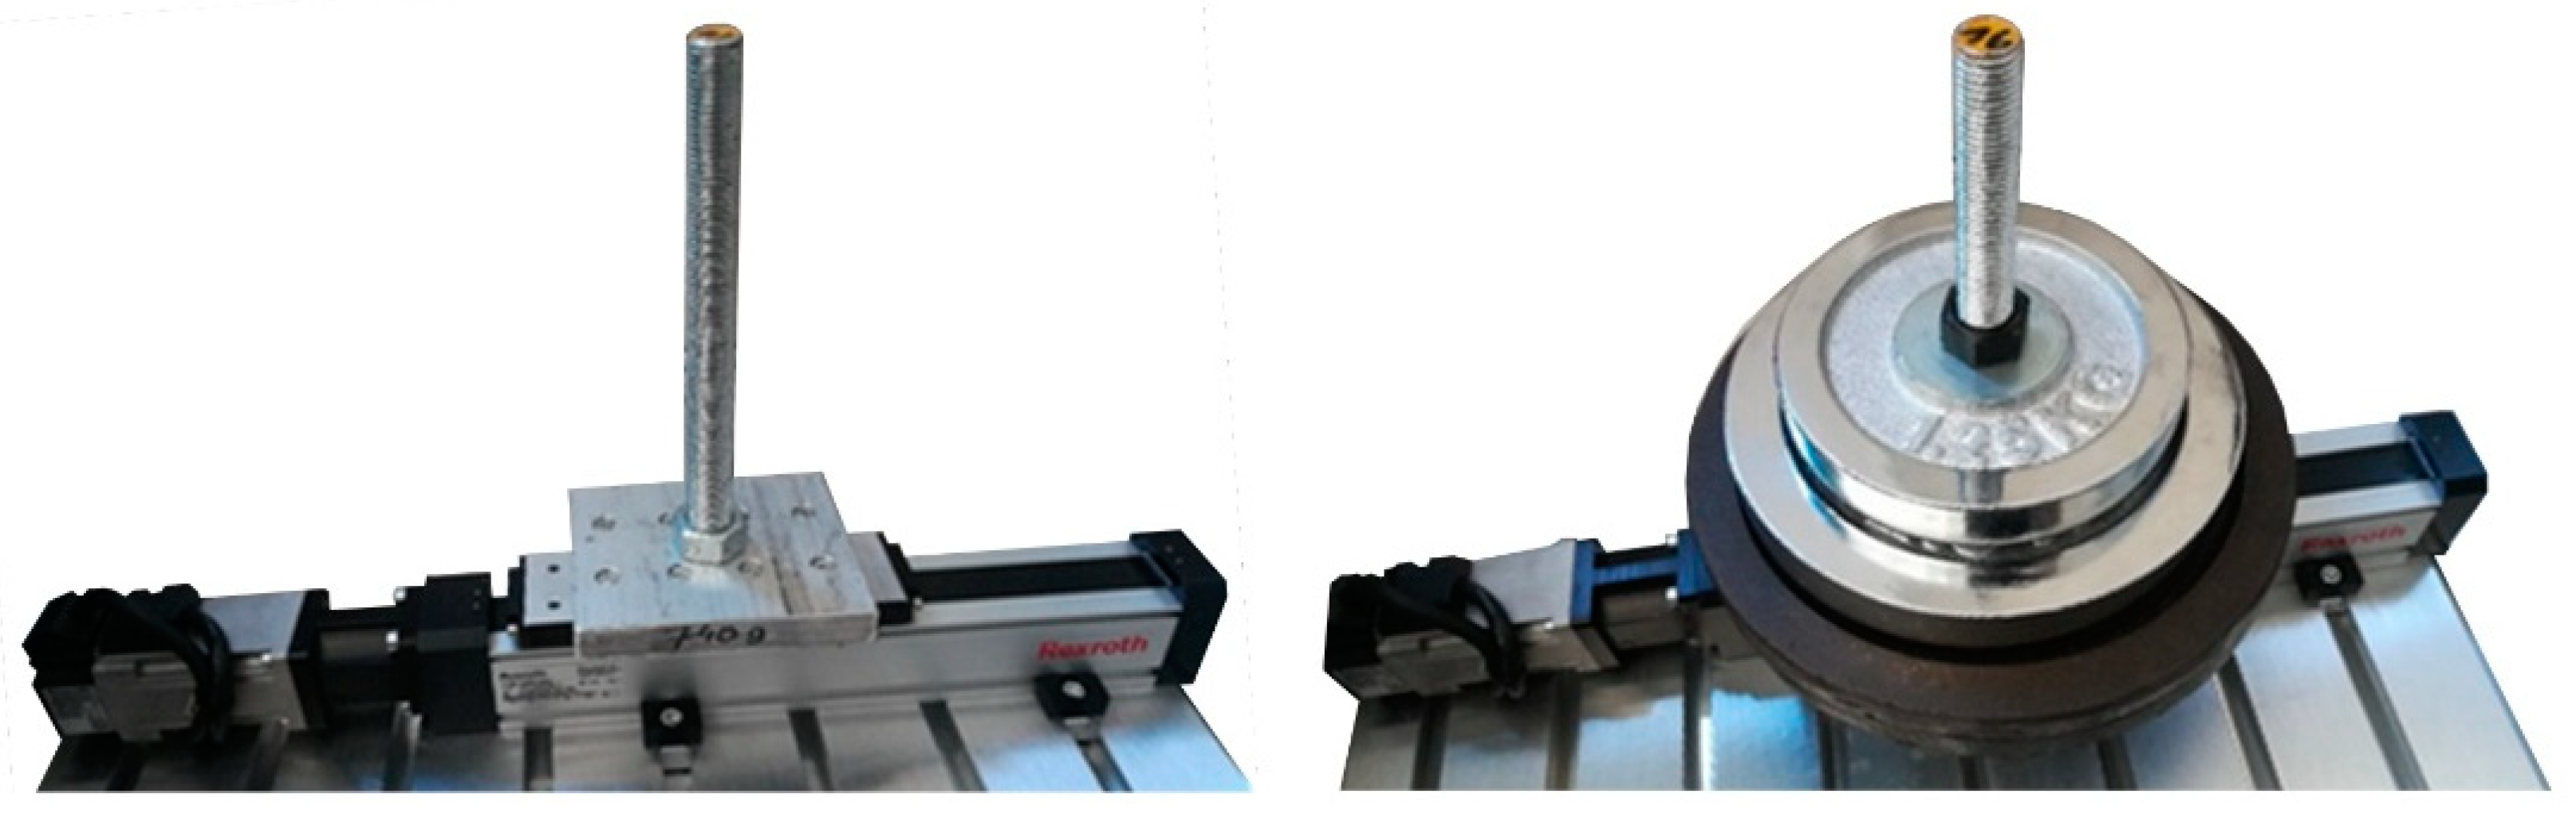
The linear, servo-controlled axle (
Figure 5) seems to be suitable and was defined as the target system. The system included the PLC, the drive controller and the data acquisition software “IoT Gateway” as interface to the drive controller and data acquisition software. Bosch Rexroth supplied all components, which was also a constraint of the project. In order to keep the costs for the proof of concept low, a small size was selected. Later, the DM method should be transferred to larger sizes. In this first concept, cyclic positioning (such as pick-and-place), is defined as the first investigated process.
As technical requirements were defined that no changes shall be made to the PLCs program and that only the internal sensor of the system may be used for DM.
For the practical tests, a testbed is available in the laboratory. This testbed represents a sub-structure of a machine, but can map the essential characteristics. The technical goal was to prove the applicability of the DM method for the detection of abnormalities in the drive based on drive controller data. In the narrower sense, the marginal lubrication should be reliably identified. Reliably means that the lubrication condition must be clearly distinguishable from other system states. This is important in order to be able to assign the measures clearly and to generate an error-free message to the maintenance department for re-lubrication.
Due to the objective of preparing a feasibility study, the user group was assigned to the development engineers involved. 6 months of project time were available. All requirements and boundary conditions were fixed in the project task.
5.2.2. Analysis of the Technical Situation
At the beginning of this task, available knowledge about the systems behavior according to different lubrication states is collected. This knowledge results from life-cycle analyses of monorail guidance [
16].
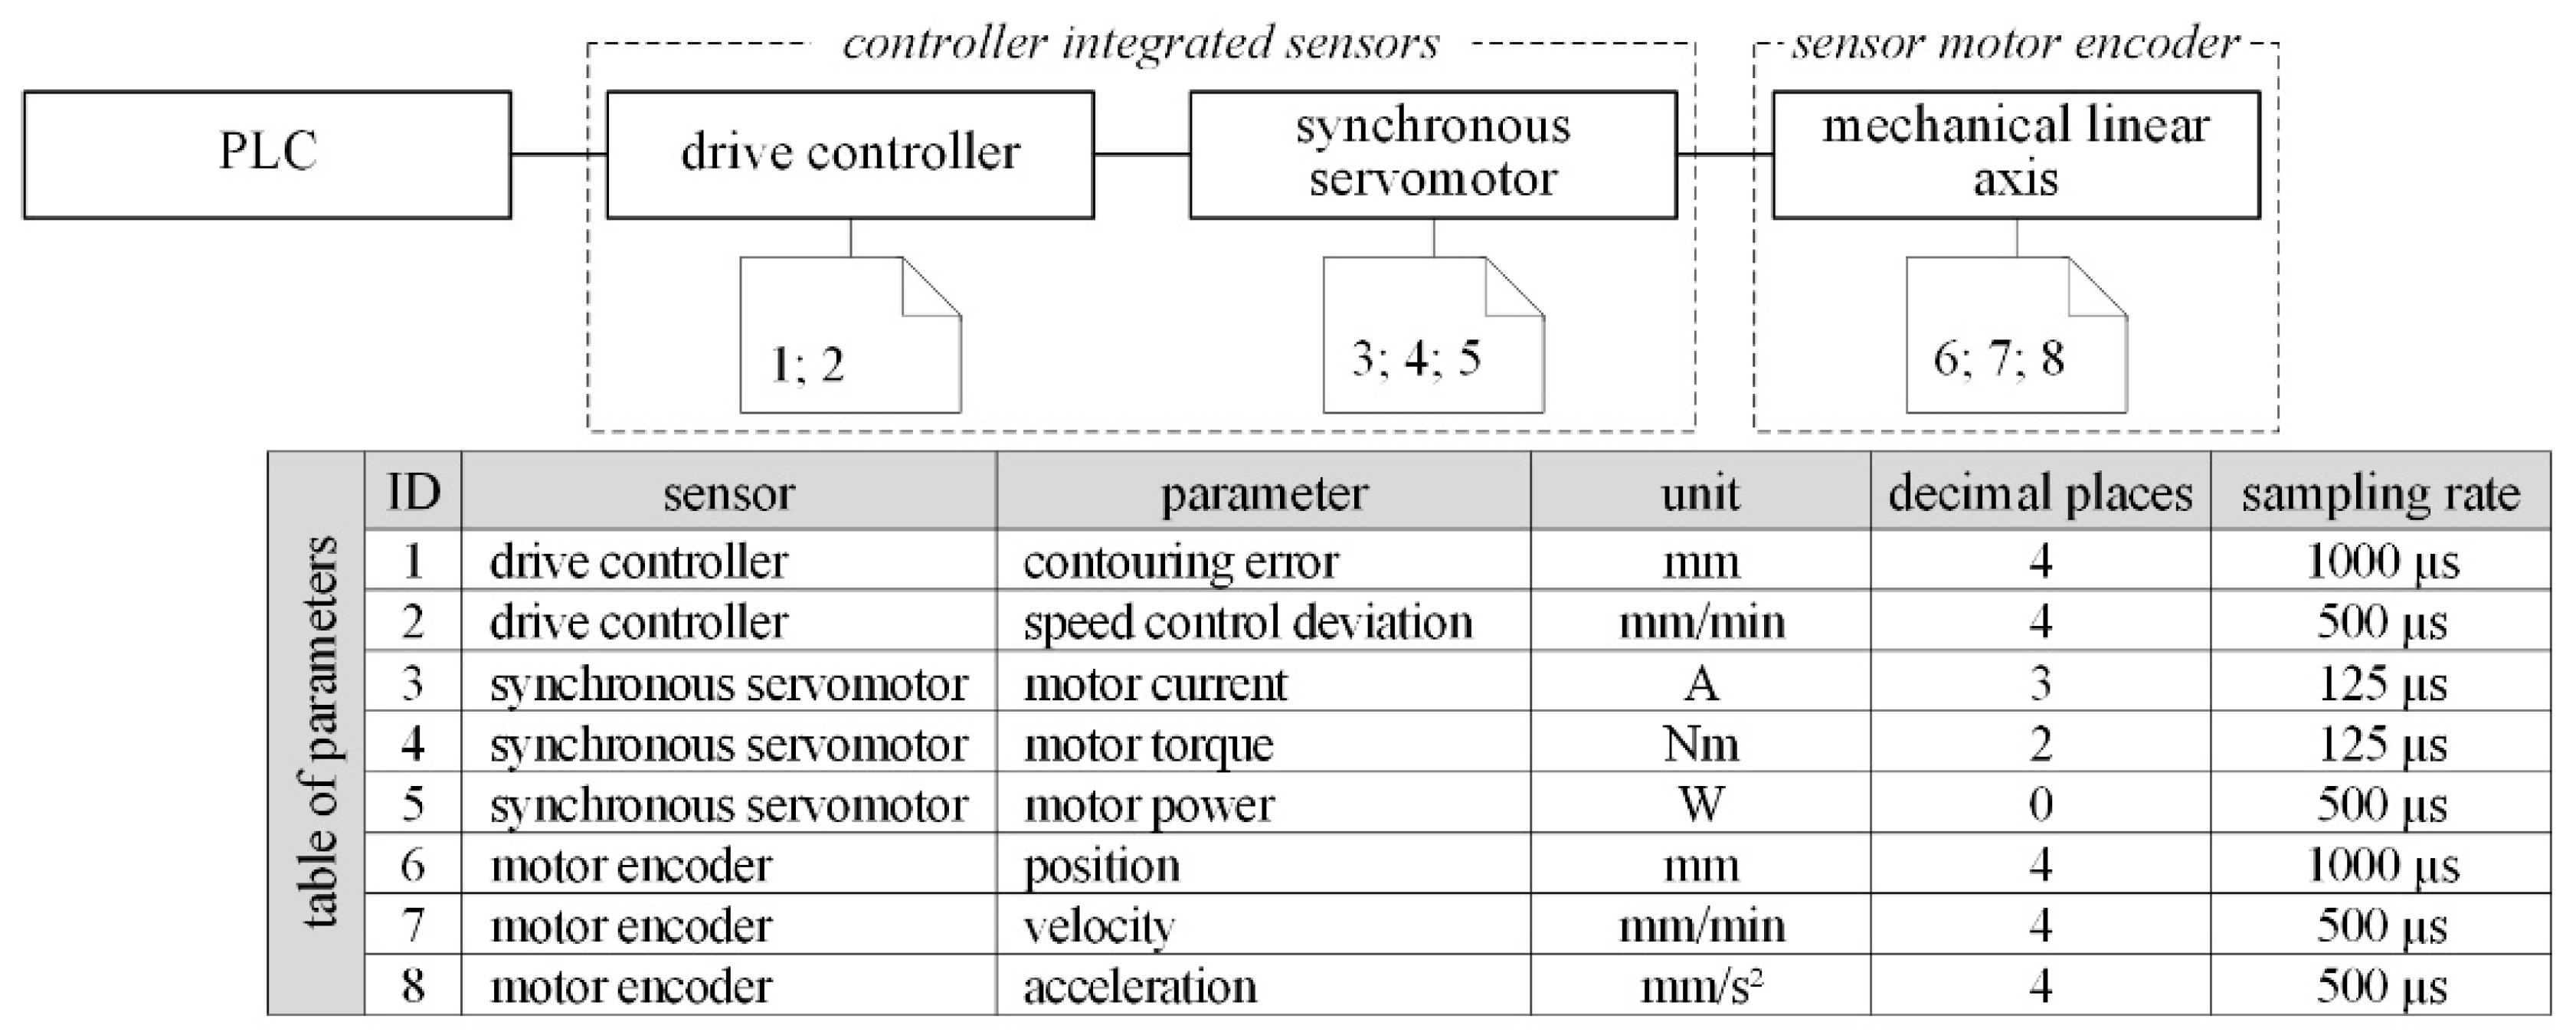
On that basis, it was checked whether necessary measured values are available as parameters in the PLC or drive controller. After that, the IT-infrastructure was analyzed with regard to available interfaces and functions to transfer data.
Figure 6 shows the available sensor-nodes of the drive controller, the corresponding component and the measuring location (dashed frame).
5.2.3. Conceptualization
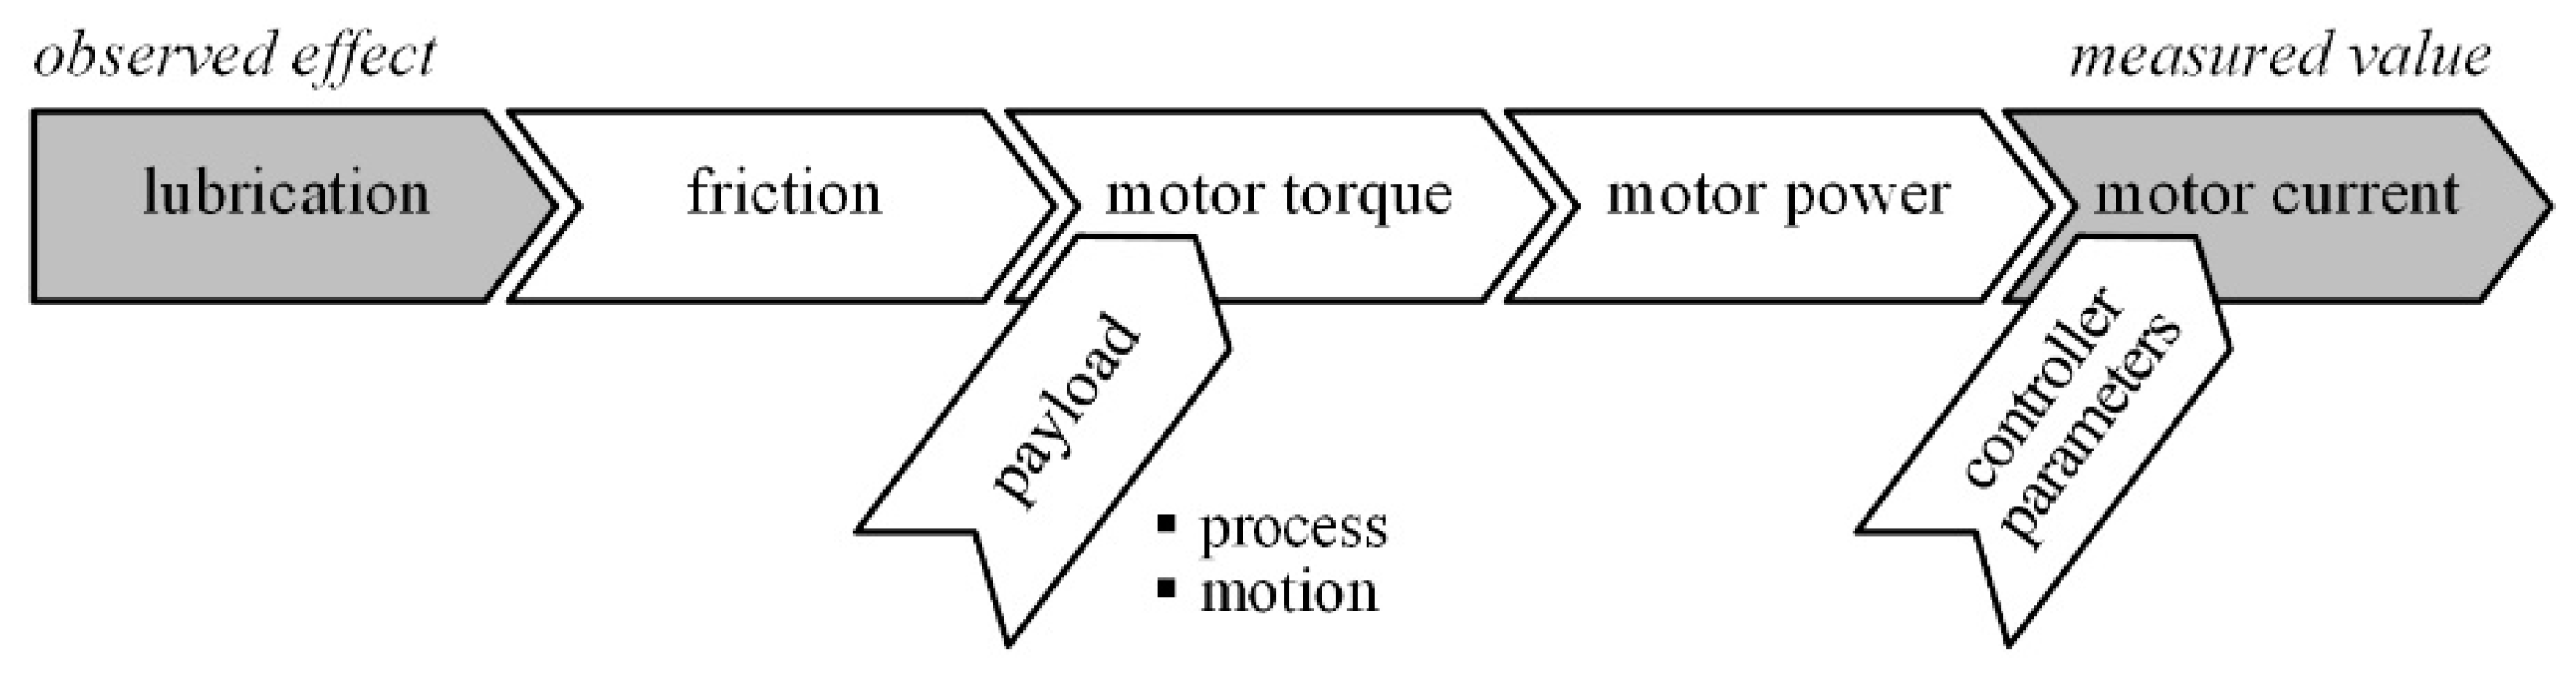
As first step of the conception, the principal effects that influence the data-driven detection of marginal lubrication were worked out (
Figure 7). The cause–effect chain starts with a marginal lubrication, which increases the friction in the axle. The higher the friction, the greater the required motor torque. This affects the magnitude of the motor current, which increases.
There are relevant influences on the elements of the cause–effect chain. The manufacturing process on the machine also influence the motor current. Therefore, the influences of position, speed, acceleration, and varying inertia of the moving goods must be clearly separated from the effect of the lubricating condition. In addition, environmental influences such as ambient temperature play an important role. The lubrication behavior changes due to temperature-dependent viscosity.
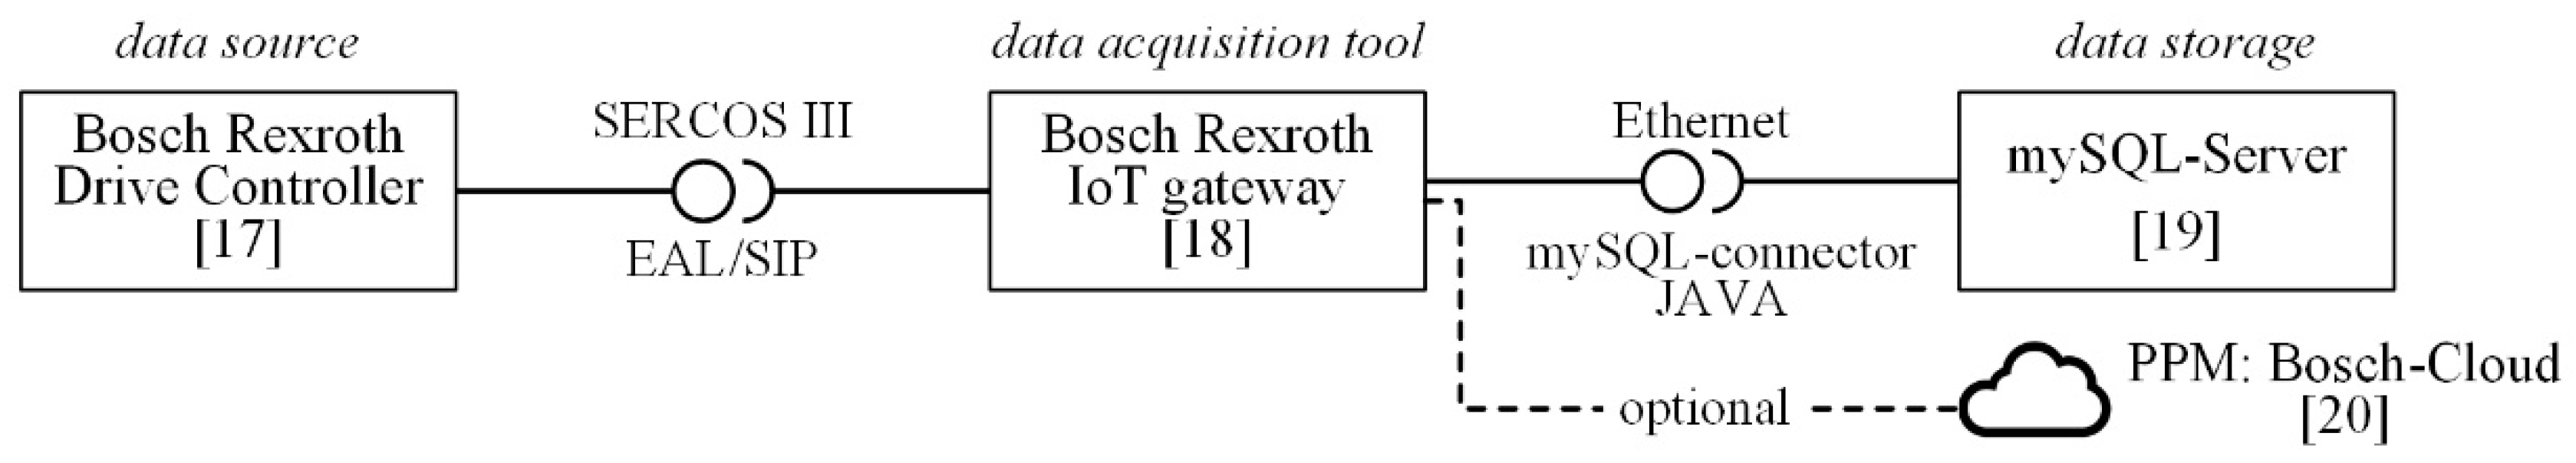
The drive system is embedded in a software environment. In addition to controlling the drive axle, the EAL/SIP interface is used for data acquisition by the “IoT Gateway” software which transfers data to the MySQL database.
Figure 8 shows the acquisition concept for the parameters.
The data acquisition starts with the internal sensors of the drive controller, which have a high resolution. The direct coupling of motor shaft and ball screw drive ensures a small positioning deviation of the motor encoder relative to the carriage position, as there is no backlash like with a common gearbox. The sampling rate of the data from the drive controller is limited to two milliseconds due to the used acquisition software “Bosch Rexroth IoT Gateway”. The data is stored in a local MySQL database for testing the concept. Later, a cloud database can be used, as the software also supports this.
As only data from the drive controller is collected, the approach for DM does not require synchronization of data sources. The drive controller assigns timestamps centrally to the measured data, which is stored on the database server by default in a nested JSON data format. Therefore, additional preprocessing of the data (deserialization) is necessary in preparation for data analysis. The necessary preprocessing must detect and handle errors in the data.
5.2.4. Experimental Planning
The goal of the testbed experiments was to generate datasets with which the lubrication conditions in the data of the controller can be recognized and mapped in a suitable mathematical model. In order to be able to separate the effect of the lubrication from other influences, the essential influencing parameters were varied in the experiment. Due to the experience of previous projects, the relevant influencing parameters are the mechanical state of health of the components, the manufacturing process, the control strategy (position-, velocity-, torque control) of the drive, etc.
Figure 7 shows the influence of selected parameters in the cause–effect chain.
In the experiment, various load conditions were simulated by applying weights to the moving carriage (
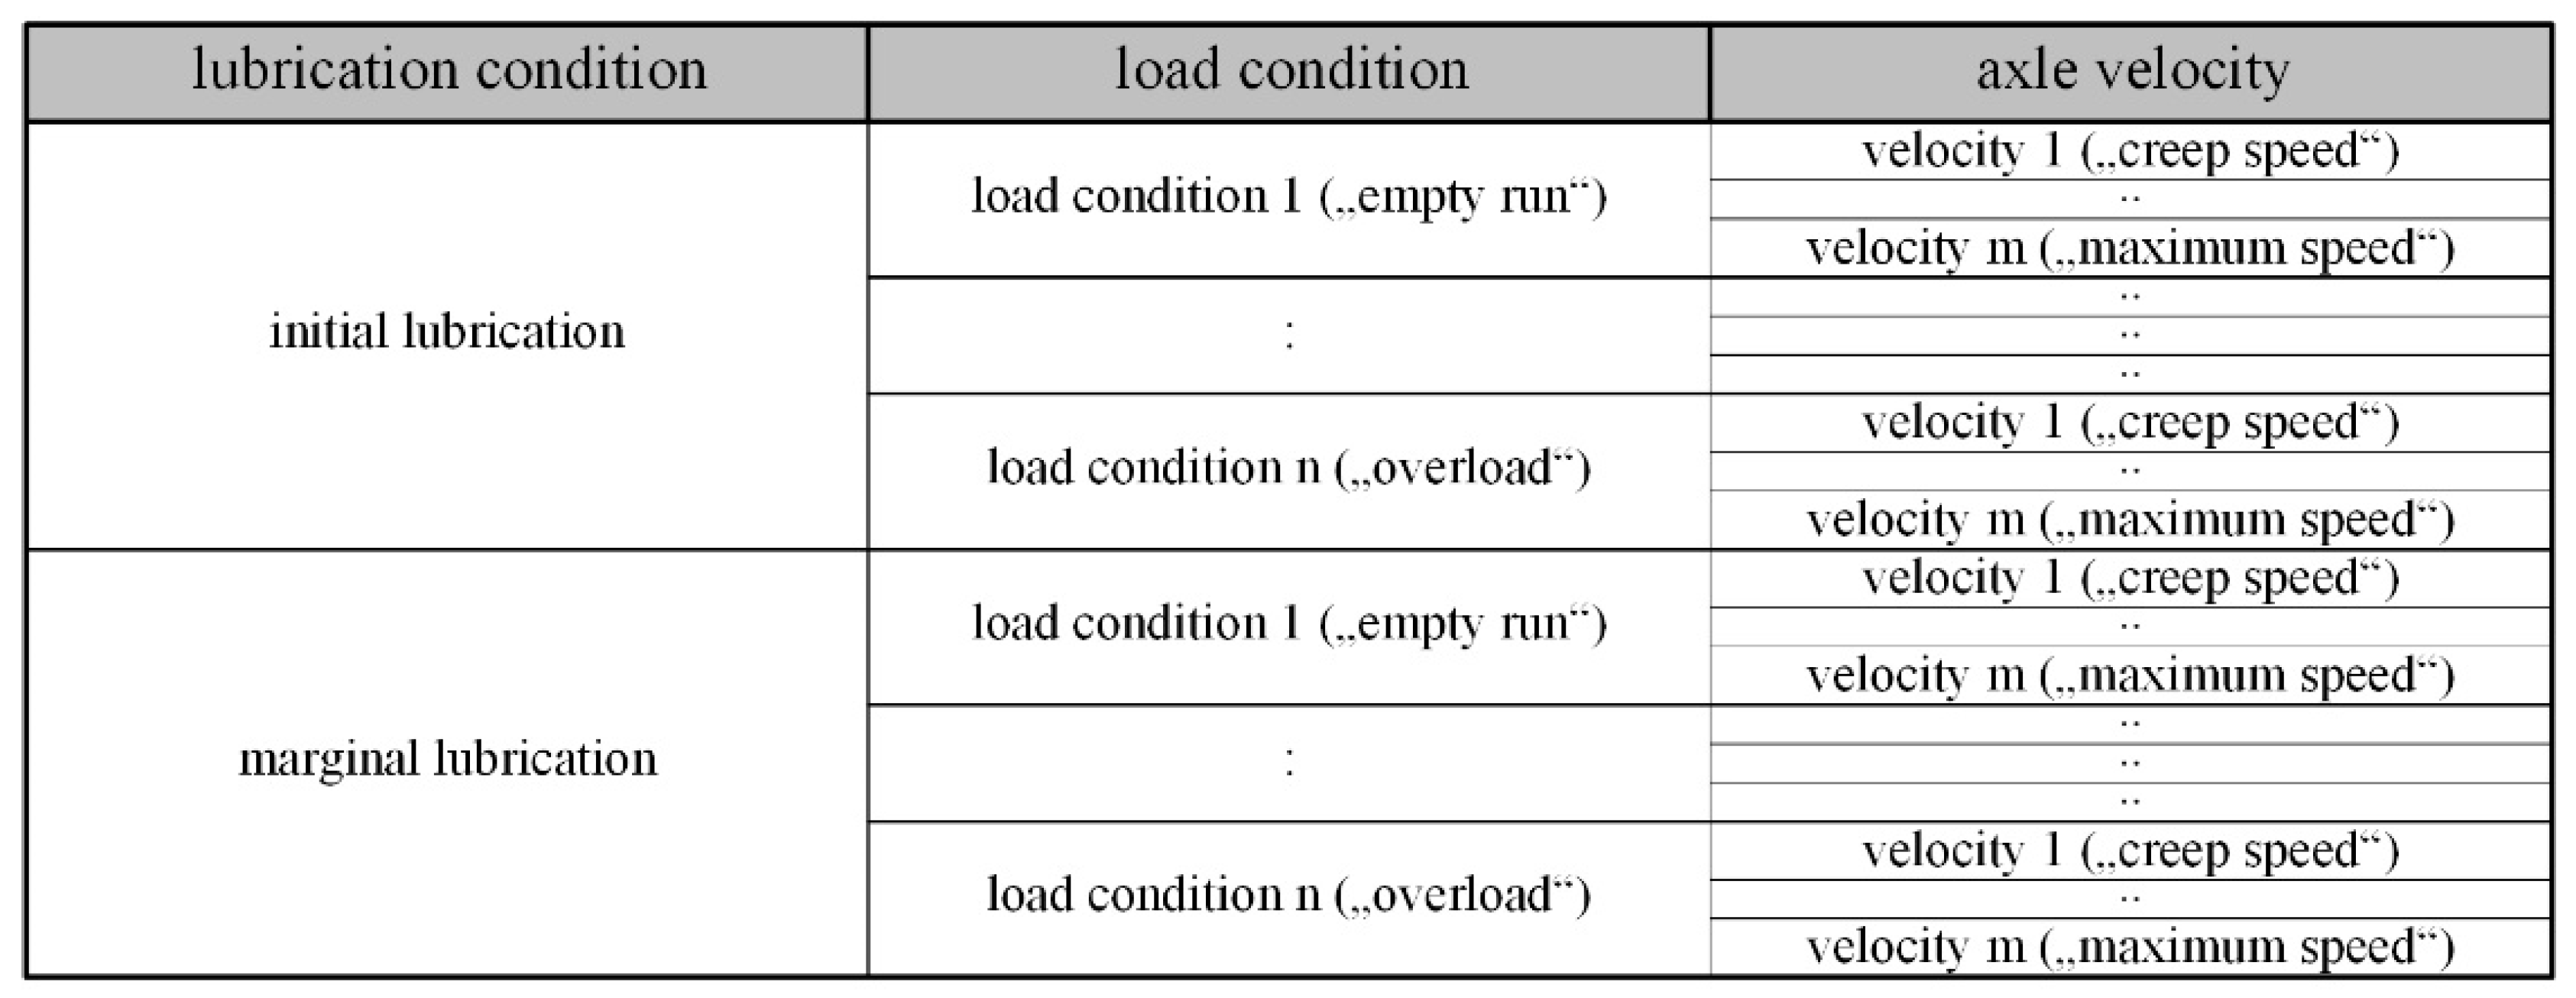
Figure 9) from “empty run” to “overload”. The axle speed was varied from “low” to “maximum permissible”. The limit values for the load conditions and speeds are determined in advance by calculation.
And most importantly, different lubrication conditions such as “initial lubrication” and “marginal lubrication” were set by removing the lubricant from the ball nut and linear guides or reapplying the lubricant through the grease nipples. Bosch Rexroth’s Linear Technology Service carried out this work.
All tests required for the influence analysis were described in an experimental plan (
Figure 10). The example shown here is a full factorial experimental design. For relationships that are more complex or for even more influencing parameters, a full factorial experimental design can lead to a gigantic number of experiments that can no longer be mastered. For this purpose, there are methods of statistical design of experiments with which the number of experiments can be reduced [
19]. It should also be noted here that parameter settings were preferred to random “natural” parameter settings in order to be able to set the relevant states in the system more quickly and specifically.
5.2.5. Specification and Project Plan
Due to the manageable scope of the trial, no adjustments to the project plan were necessary with regard to the required budget and project time.
5.3. Technical Realization and Testing
5.3.1. Prototypical Realization
Bosch Rexroth provided the Testbed (
Figure 5), which is mounted on a T-grooved plate as shown in
Figure 9. The system is commissioned as recommended in the OEM-instructions [
21,
22].
The data acquisition is based on the “Bosch Rexroth IoT Gateway” [
18] software, which is installed on an industrial PC with Linux operating software. This PC is directly connected with the drive controller via “SERCOS III”-cable. Because of this standardized protocol and interface, which is based on Ethernet, there is no additional hardware needed. The MySQL-database-server is installed and configured on another PC, which is connected to the data acquisition PC via Ethernet as well. The acquisition software is configured to log drive parameters and stores them in the MySQL-database [
19]. As last step, the control is programmed to perform the specific motion cycles from the Experimental Plan.
5.3.2. Test of the Concept
To check the data acquisition on the testbed, the axle performed demo movements for test purposes. First, the general data acquisition was tested by checking whether drive data is stored successfully on the MySQL-Server. The measured parameters (motor current, position, motor torque, etc.) of the drive were compared with the observed behavior concerning plausibility. All those tests were passed, which means that the data represented the observed behavior and the expected sampling rates were mainly kept.
By screening the data, data points were infrequently missing, but that may not cause major trouble in the following experiments.
When performing the “Technical Implementation” task, this problem should be addressed.
5.3.3. Perform Experiments and Collect Data
The experiments were carried out as designed in the Experimental Plan and the related data logged and stored. To get a statistically more reliable dataset, every experiment (
Figure 10) was repeated six times. By that, the repeat accuracy could be assessed as well.
While performing the experiments, exceptions like “excessive contouring error” or “exceeded position limit” occurred in the drive system. By changing the parameter set of the control loops of the drive controller, the problem could be solved.
Another problem was the infrequent, short interruption of data logging, which probably had been caused by vibration-related contact issues in cable connections (Ethernet connectors).
The experiments with an overloaded and marginal lubricated axle showed the massive effect on wear and tear as this caused the destruction of rolling elements in the ball screw drive.
5.3.4. Documentation
The first conclusion is that the testbed and test setup works but the hardware for the data acquisition, especially Ethernet cables and connectors, could be improved. The software for data acquisition works satisfying.
While executing the experiments, the influence of the drive controller configuration especially the systems control loop stability on the measured data could be noticed. Because of that, it is important to have on the one hand stable control loop parameters in the drive. On the other hand, it is necessary to detect the data from an instable drive control loop with analysis algorithms by deriving related patterns or generating new use cases.
5.4. Data Understanding
The generated data from the experiments is sifted and checked for errors and quality issues in this phase. Lastly, the parameters are analyzed for their suitability to assess the condition of the lubrication. Resulting from that step, all parameters could be used for the identification.
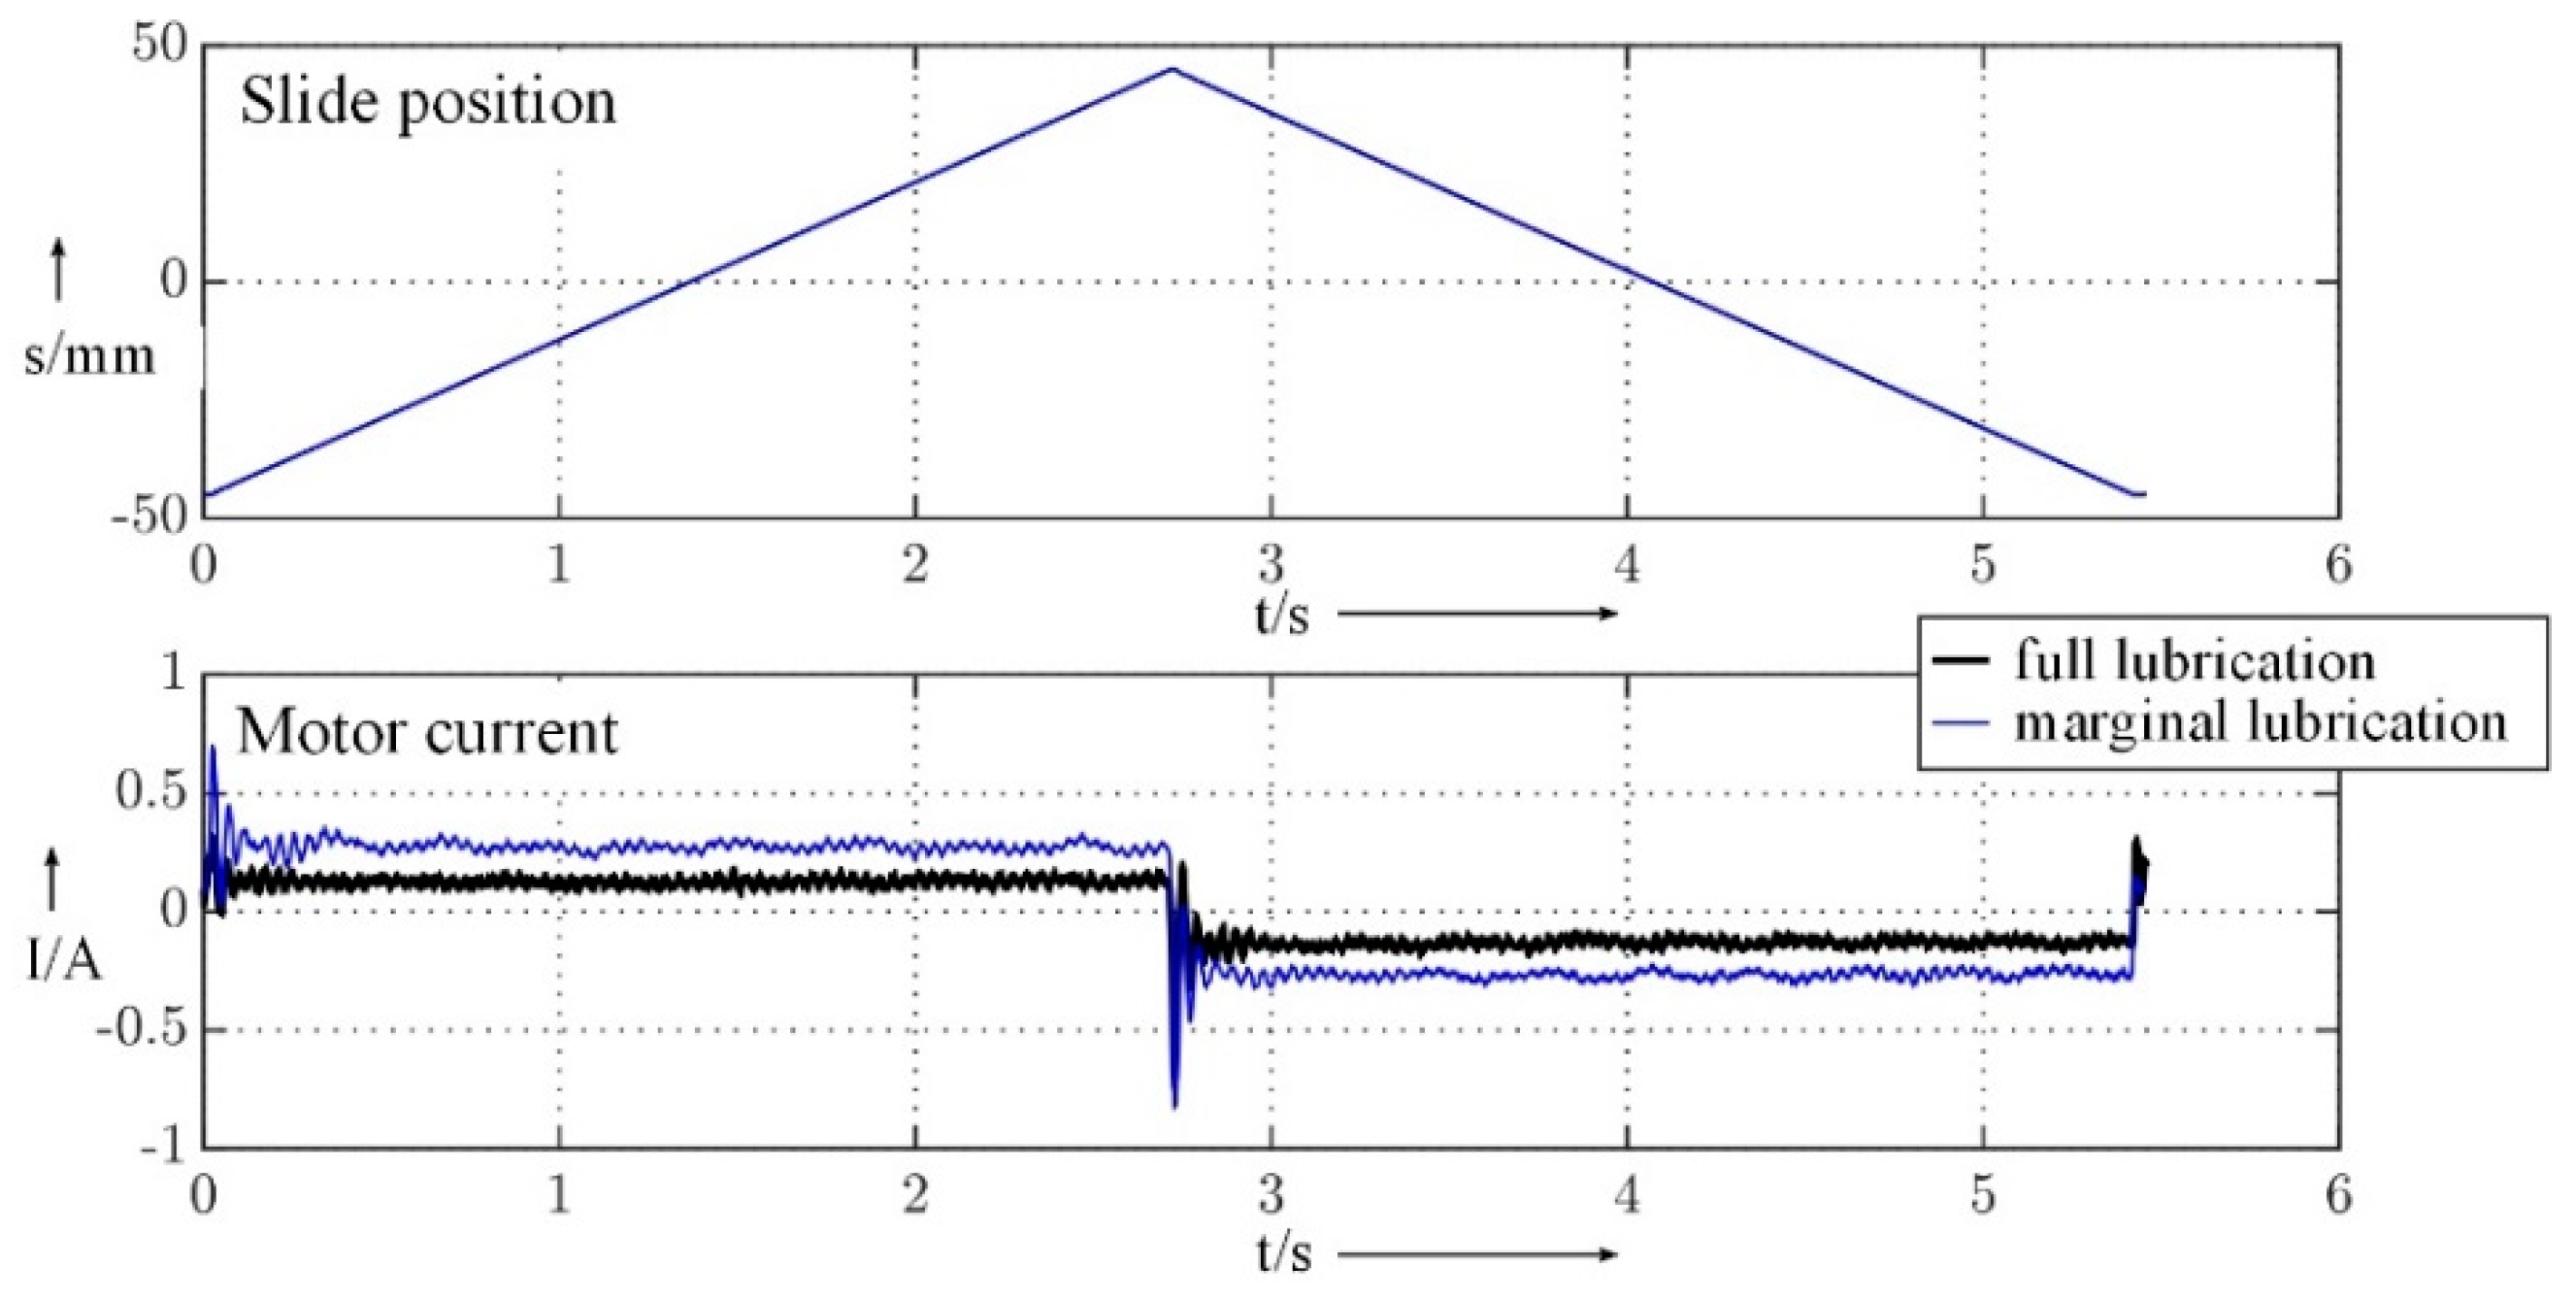
Figure 11 shows the motor current and slide position over time for the full and marginal lubricated axle.
The analysis of the data quality revealed infrequent, unsteady time delays between data points where the effect on the data analysis should be checked. Partially empty data arrays occurred, which should be treated before data analysis. Negative effects of these data quality issues on the modeling process are not expected.
From the drive controller and PLC point of view, the quantity of data to be processed in this case does not impose increasing demands on the system. To handle the quantity of data in more complex systems as for example a machine tool, the performance of the IT infrastructure to transfer and store data must be scaled in the “Technical Implementation” task.
The data generated in the experiments is sufficient for modeling. In preparation of the modeling phase, hypotheses are phrased based on which characteristic value the condition of lubrication could be classified.
Possible characteristic values are the absolute, rise, bandwidth, etc. of a parameter. The motor current by its absolute value is the favorite characteristic value for the classification of the lubrication state in the modeling process as it is directly affected through the cause–effect chain.
Figure 11 shows, that the absolute of the motor current increases with the decrease of the lubrication.
5.5. Data Preparation
For the modeling process, all available parameters and datasets from the experimental plan are used. The cleaning of the data is limited on deleting empty data fields. Within the framework of the proof of concept, an additional filtering of the data is not implemented. This should be done in the “Technical Implementation” task.
For the implementation of the “Proof of Concept”, the software MATLAB was used. That affords a transformation of the “nested JSON” format stored on the MySQL server to a CSV format, which MATLAB could handle. This transformation was realized within a JAVA application, which can connect to the MySQL server, read the data and transform it to a MATLAB readable CSV file. This application runs on the PC, where the modeling is done.
5.6. Model Building
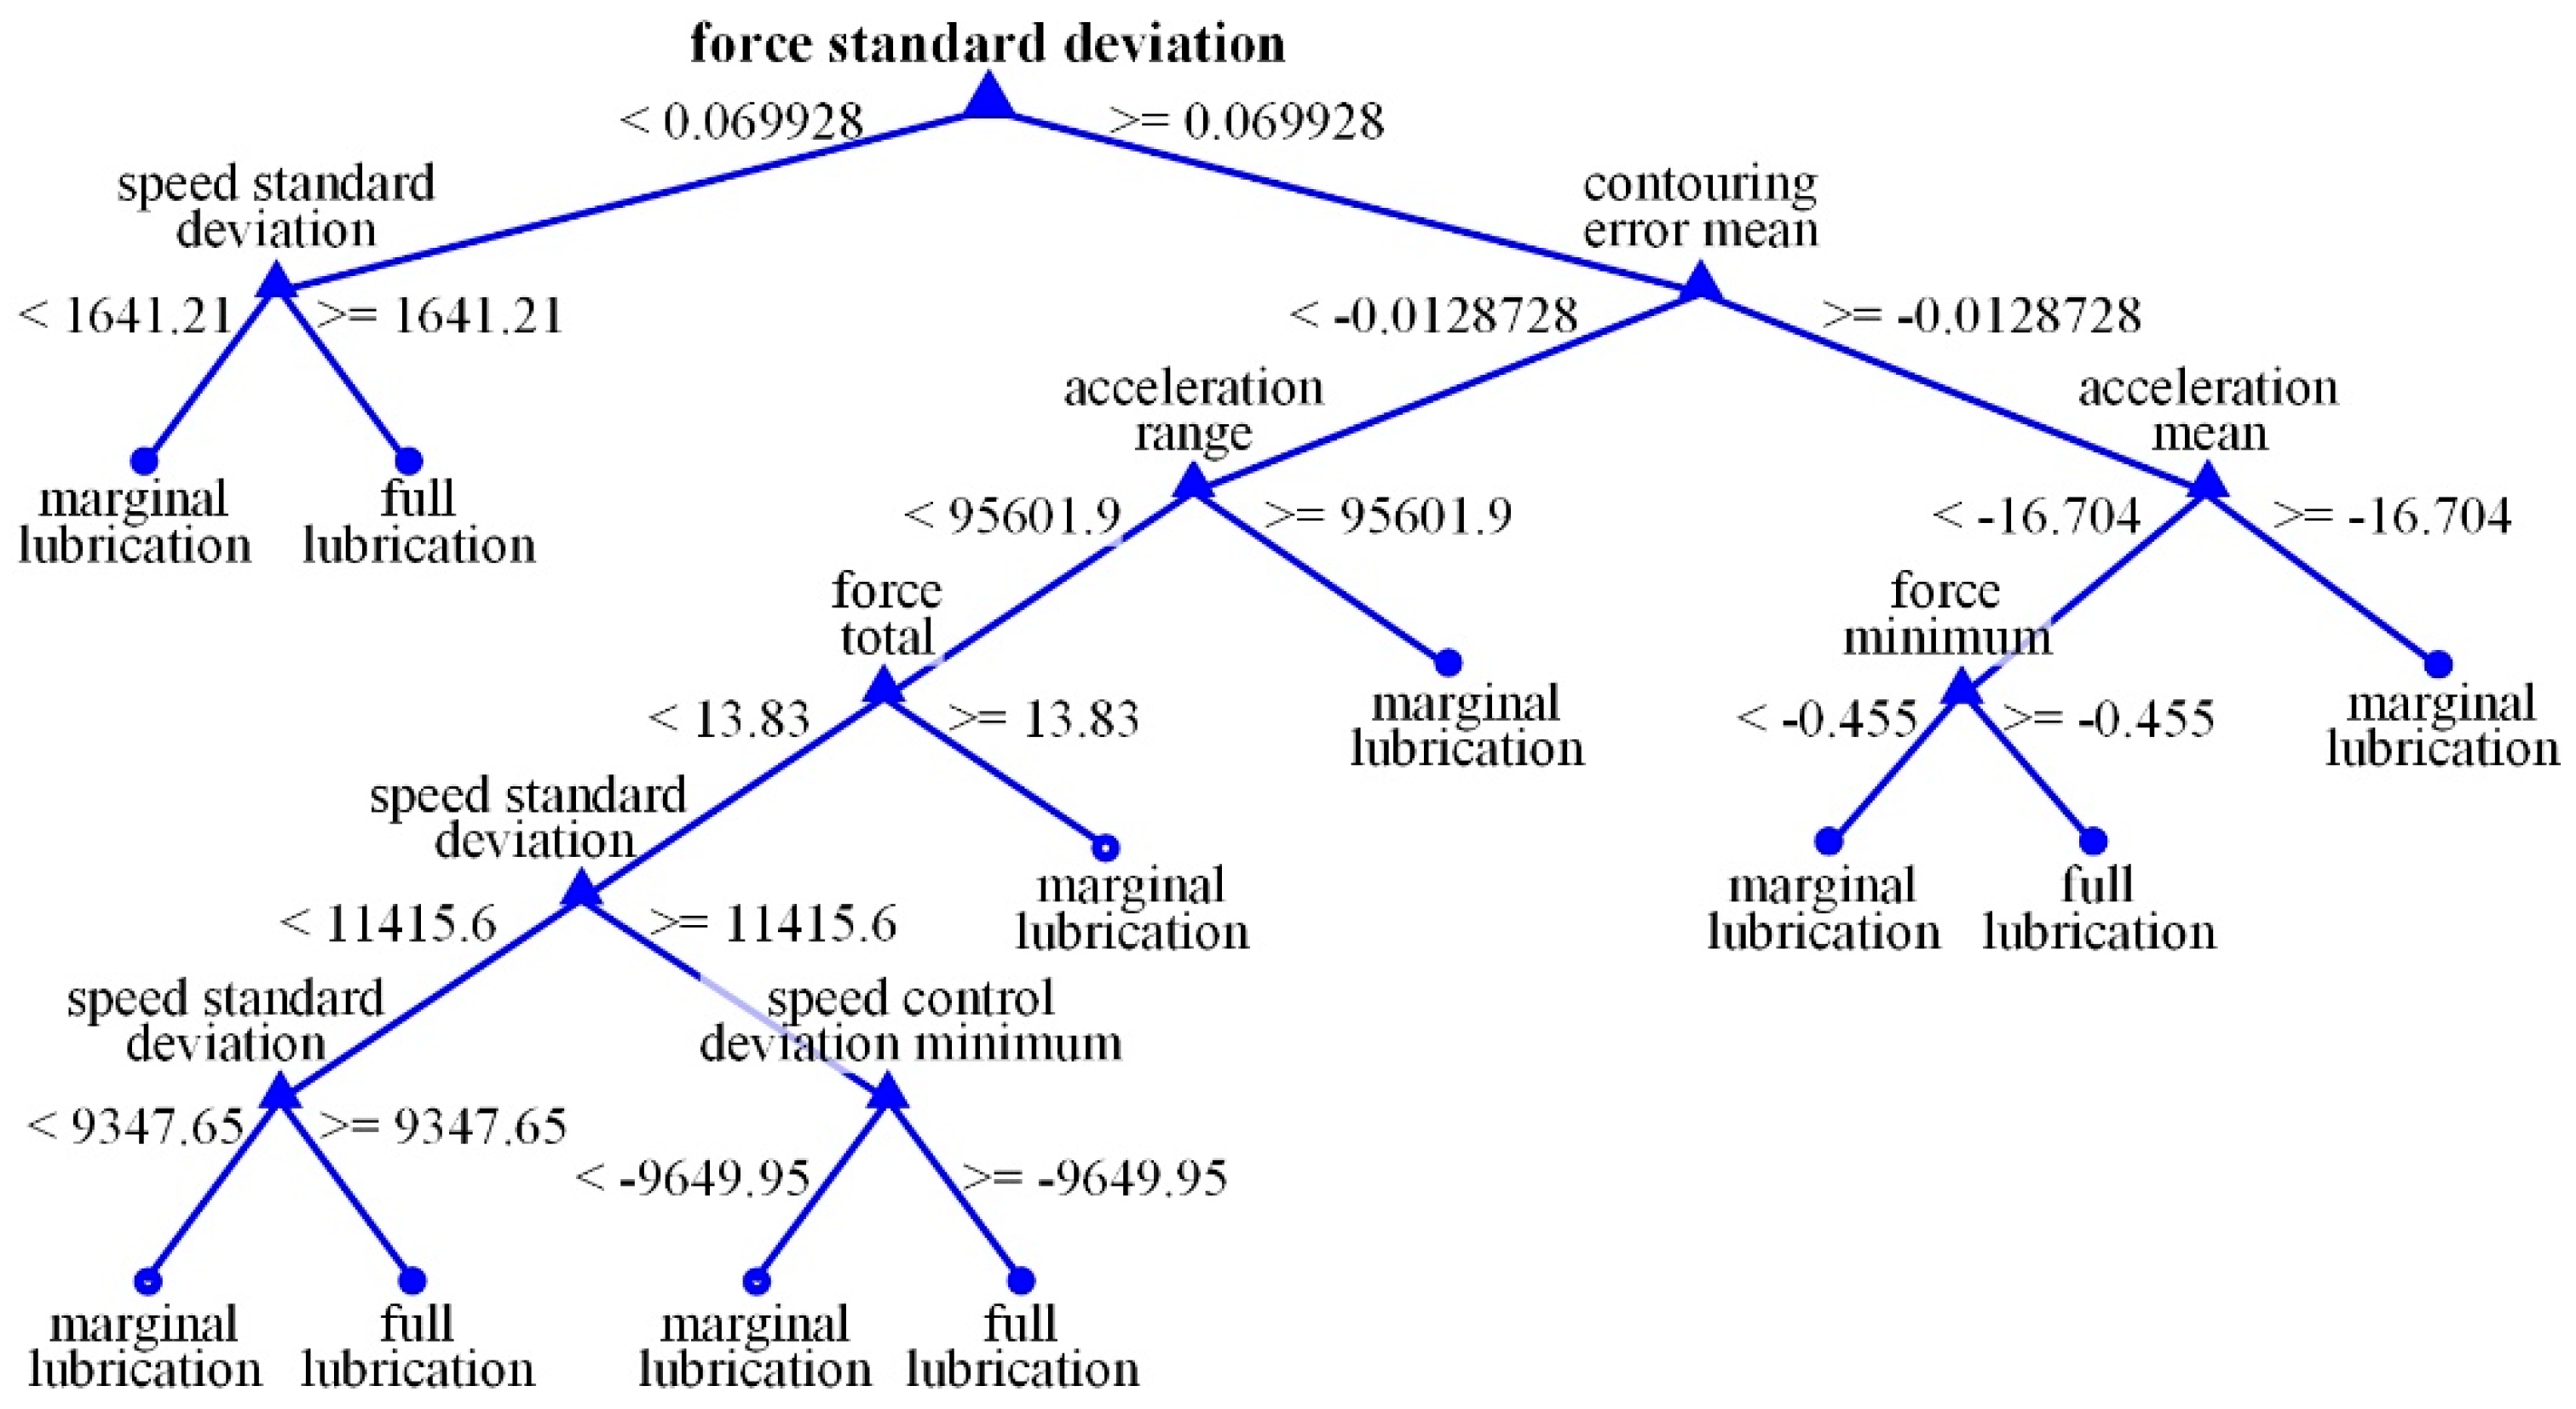
It is not the intention to describe or assess the data mining algorithms in detail. In this project, decision trees are chosen as modeling technique, because that led to adequate results in previous projects, to check whether the experimental data is suitable to do a binary detection in marginal and full lubrication state.
First, the data is labeled with an additional attribute, which represents whether it was recorded in marginal or full lubrication experiment. This attribute was missing in the raw data and can assess the result of the analysis model by comparing the detected condition with the original state by deriving an error rate.
The modeling dataset, containing all lubrication states and parameters, is divided in 80% training and 20% test data. Using cross-validation, the model is trained in MATLAB with the function “TreeBagger”. To minimize the error rate, multiple decision trees are trained and optimized, which leads to a final model using 20 decision trees. As an illustration, a data model with one decision tree was trained and is shown in
Figure 12.
5.7. Model Evaluation
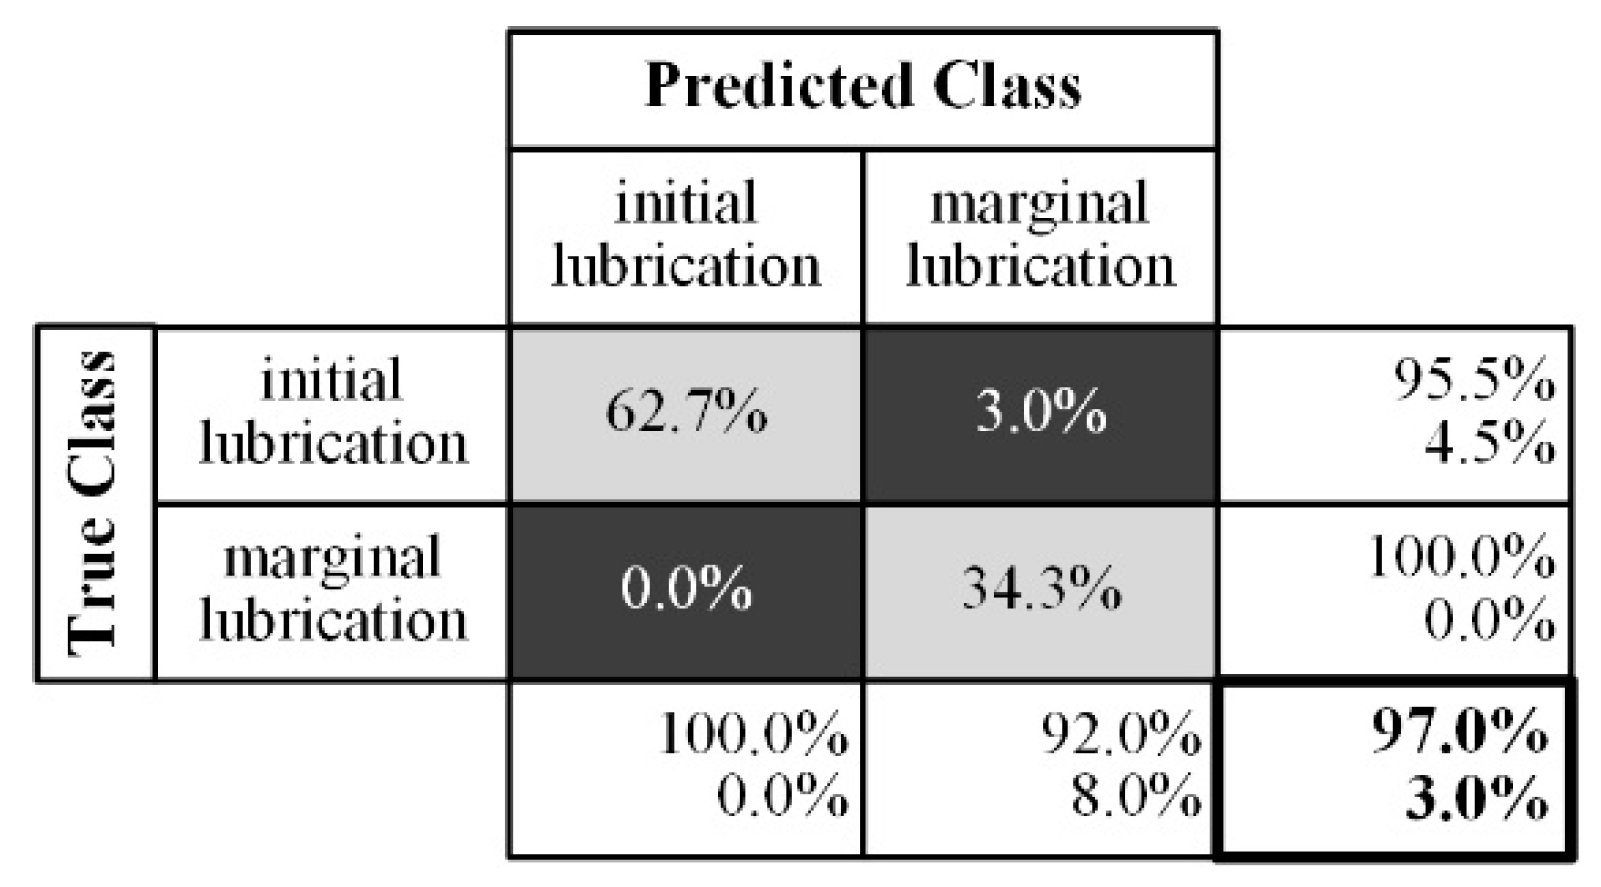
The final data model with 20 decision trees was validated with the remaining 20% of test data. The binary classification in marginal lubrication and full lubrication state works with an accuracy of 97% and an error rate of 3% (
Figure 13). That shows that a detection of critical lubrication states is possible. There is still potential to improve the accuracy, because the model was not optimized or trained with datasets of additional experiments, as it is a proof of concept.
The result fulfills the requirements on the proof of concept and achieves the DM objective. The next steps concentrate on the transfer and application of the generated data models for other sizes of linear axes and different installation conditions.
5.8. Deployment
The goal of the project was to prove whether a detection of different lubrication states of a linear axle based on drive parameters is possible. Before starting in the “Technical Implementation” task to build an industrial-suited solution, additional studies are necessary to ensure statistical certainty.
Furthermore, a transfer of the concept on other sizes of linear axes as well as other mounting conditions in machine tools are pending. These upcoming activities could be performed on the more complex “smart machine bed” [
23,
24]. In addition, analysis tools that match industrial requirements and support an easier automation should be worked out.
6. Conclusions
In this paper, an extension to the process model CRISP-DM was introduced, which supports applications of DM in engineering projects. This extension was developed based on the experiences from numerous previous projects at the chair of machine tools development and adaptive controls.
The DMME supports at data acquisition and the provision of context information on the data while keeping the advantages of the established CRISP-DM in the data mining part of the project. The new methodology is a target-orientated and structured approach for DM projects in the engineering domain and enables engineers, data analysts, and computer scientists to work together in such projects to reach the DM goals. The DMME supports unexperienced engineers in single DM projects because of the decomposition of data mining workflow in smaller steps with an assessment at the end of each task, which leads to usable results.
The full strength of this new methodology lies in the reusability of previous projects based on the lessons learned. Once a project is finished, it could be used as a template for future projects. The modular structure of the DMME allows to realize new DM projects easy and fast because previously executed tasks with satisfying results do not need to be worked out again.
The transfer of data acquisition concepts depending on parameters and effects to be measured, as well as data mining strategies that worked pretty well on other use cases, gets easier with a growing collection of finished projects.
It has turned out that DMME is advantageous to structure and support new projects and is successful also in educational use as a guide for student projects.
The increased complexity for the development of DM solutions by means of the procedure model presented here can be justified by the reusability of already existing solutions and thus an increase of the efficiency in future projects.
The DMME workflow was illustrated with the example of a condition monitoring application at monorail guidance. This DM project showed that the lubrication state based on drive controller data independent from load conditions like different motion profiles and moved inertia could be detected. The patterns containing the lubrication state were modeled with decision trees.
The example shows a typical DM project in the engineering domain where the preconditions first need to be developed to acquire the right data with the required quality from the target-system before starting the data mining. The DMME supported the project by structuring the whole process, giving advice at each task and by that, contributing to a more efficient work.
In current and following DM projects, the DMME process model will be validated and, if necessary, improved. Depending on the projects’ DM use case or application, tasks and activities will be expanded or more detailed.


