Study of Dynamic Response Characteristics of the Wind Turbine Based on Measured Power Spectrum in the Eyewall Region of Typhoons


Abstract
1. Introduction
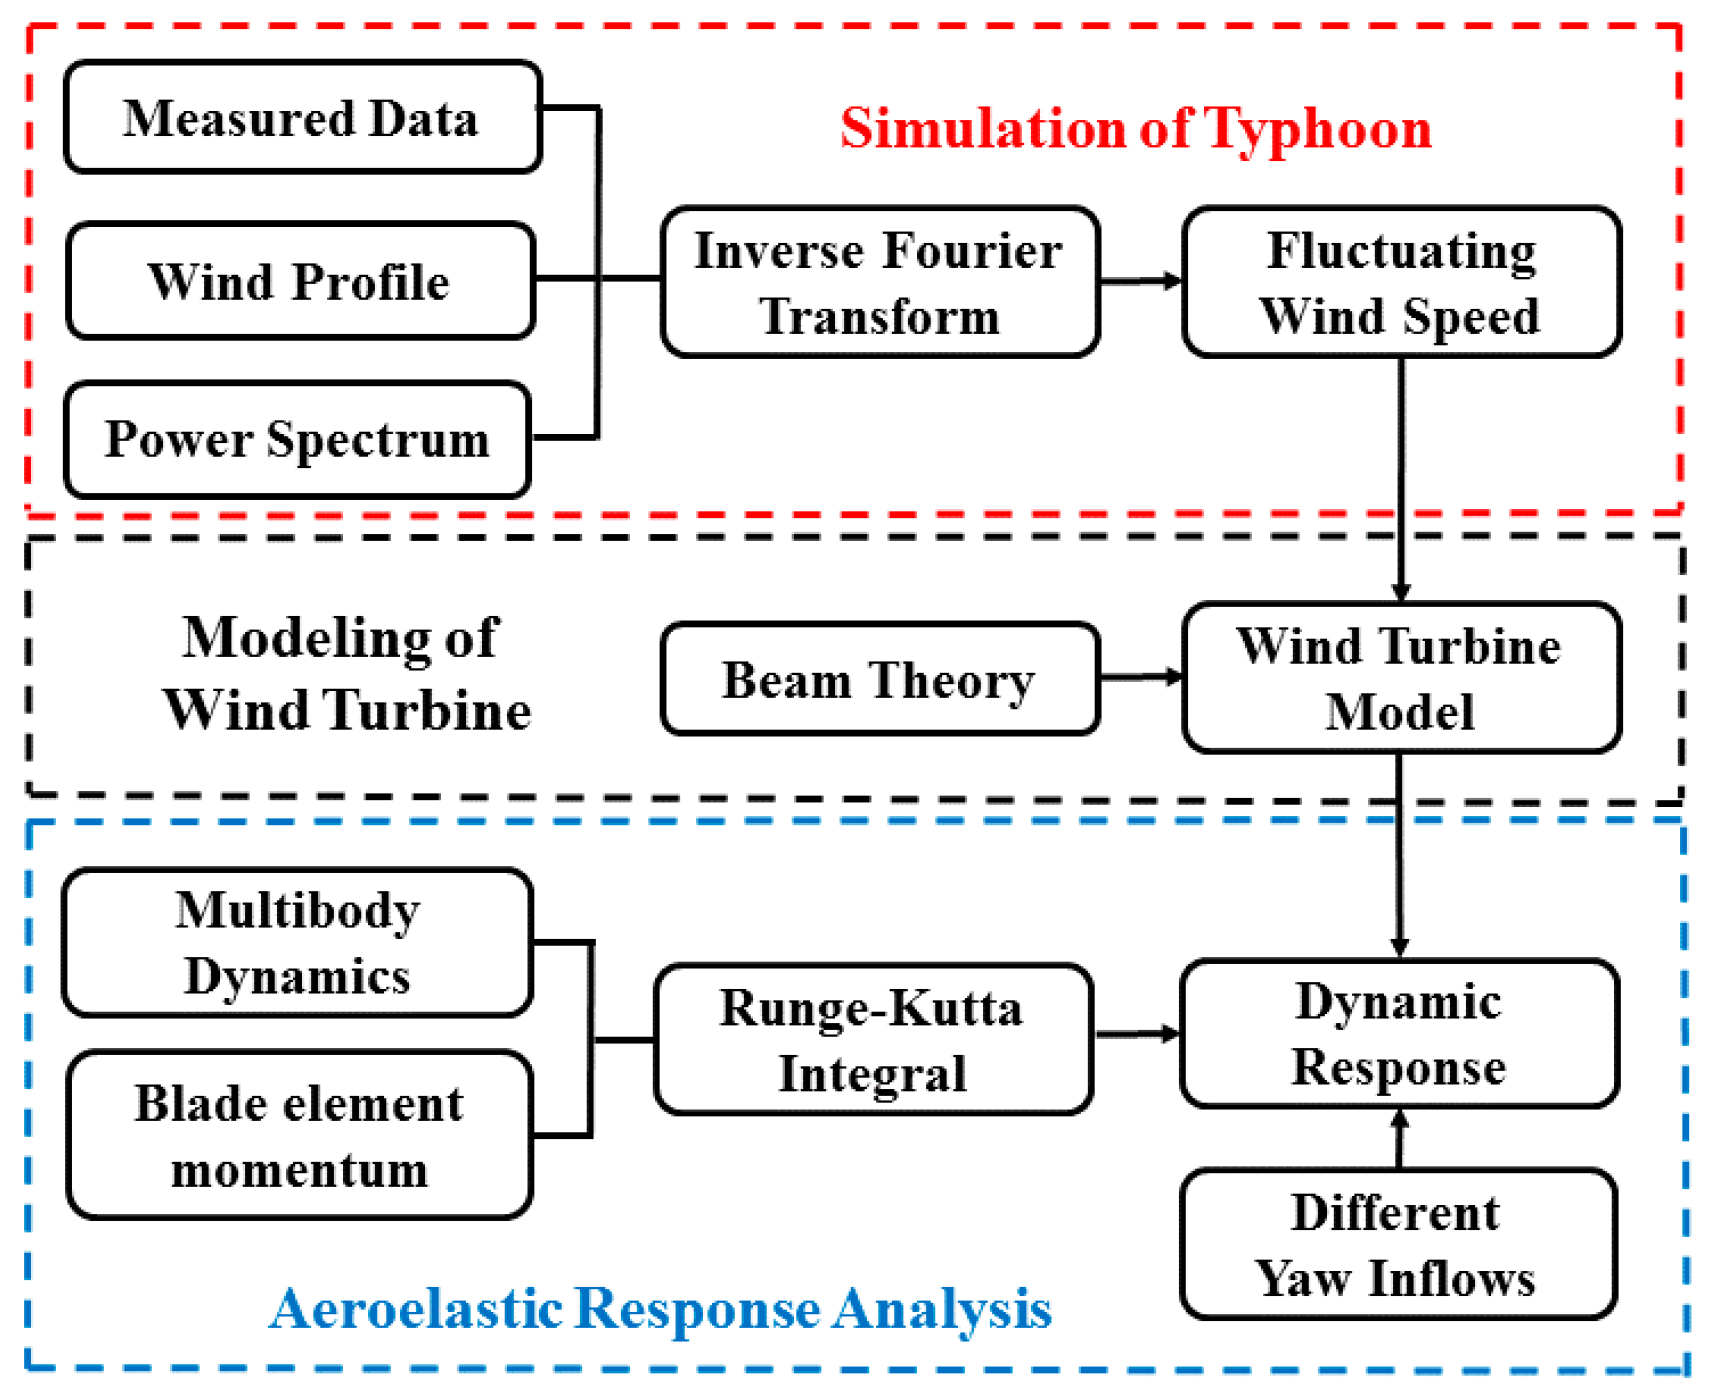
2. Methods
3. Results and Analysis
3.1. Wind Turbine Model
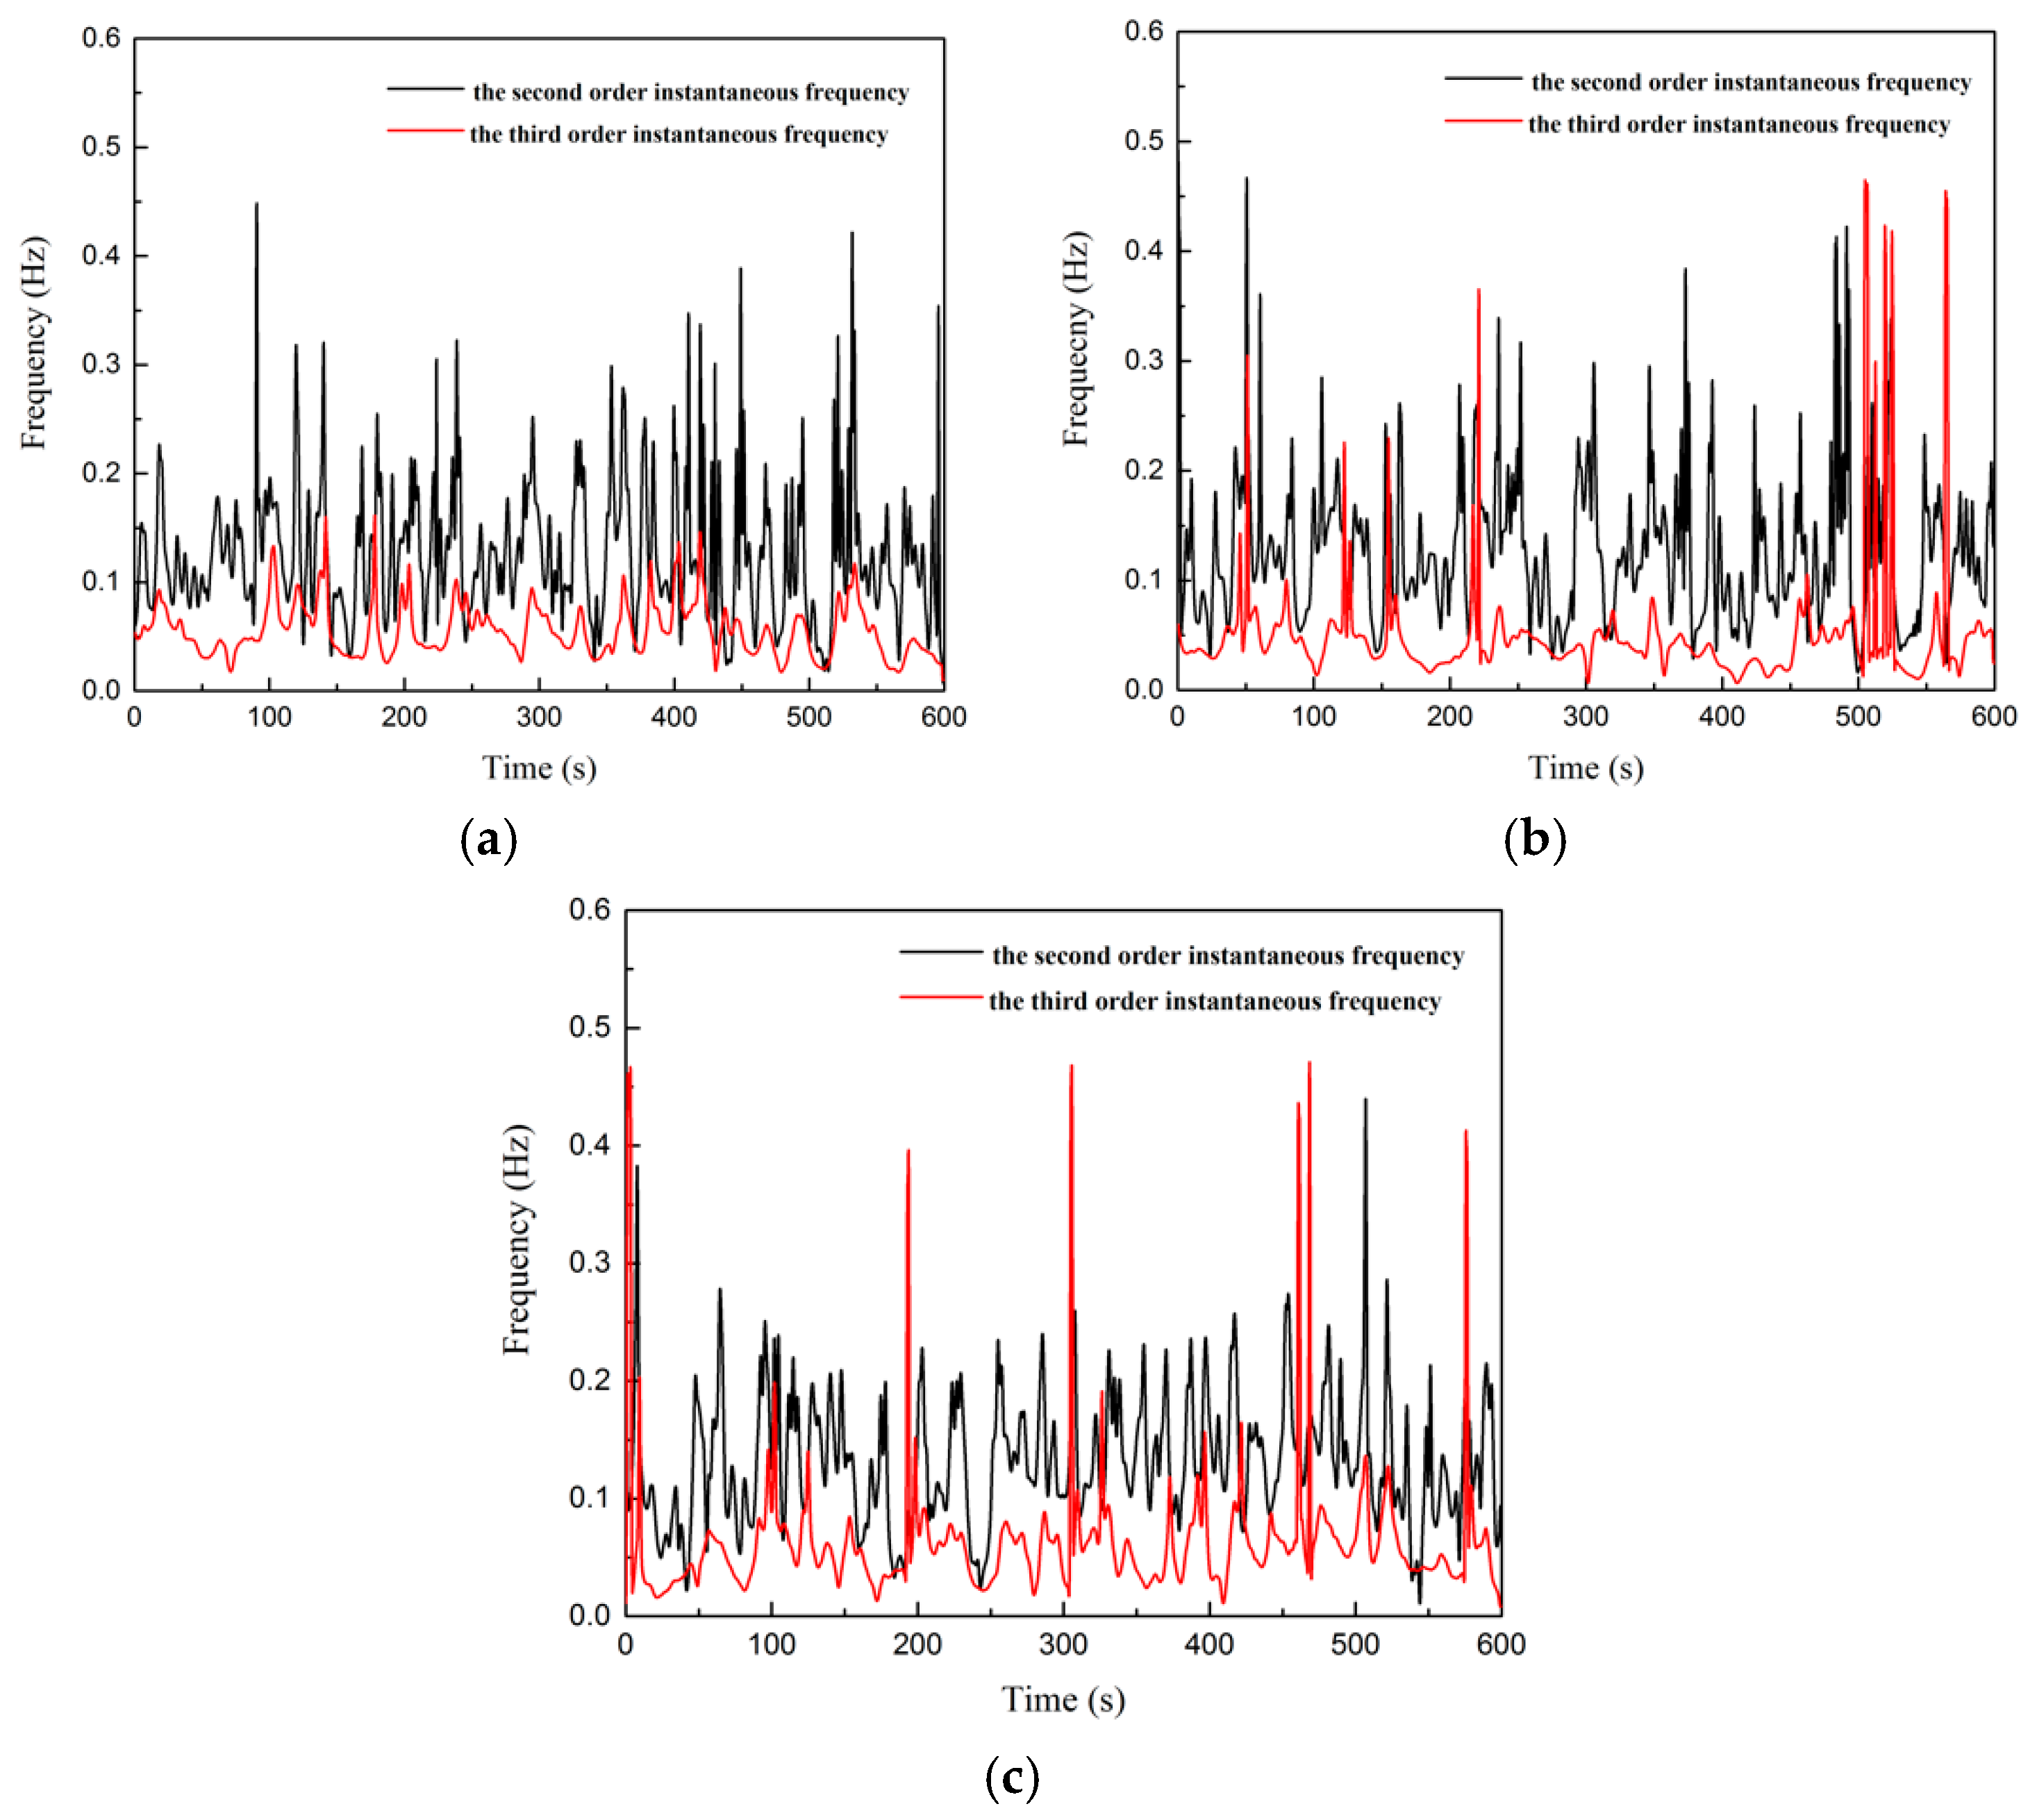
3.2. Analysis of Wind Characteristics
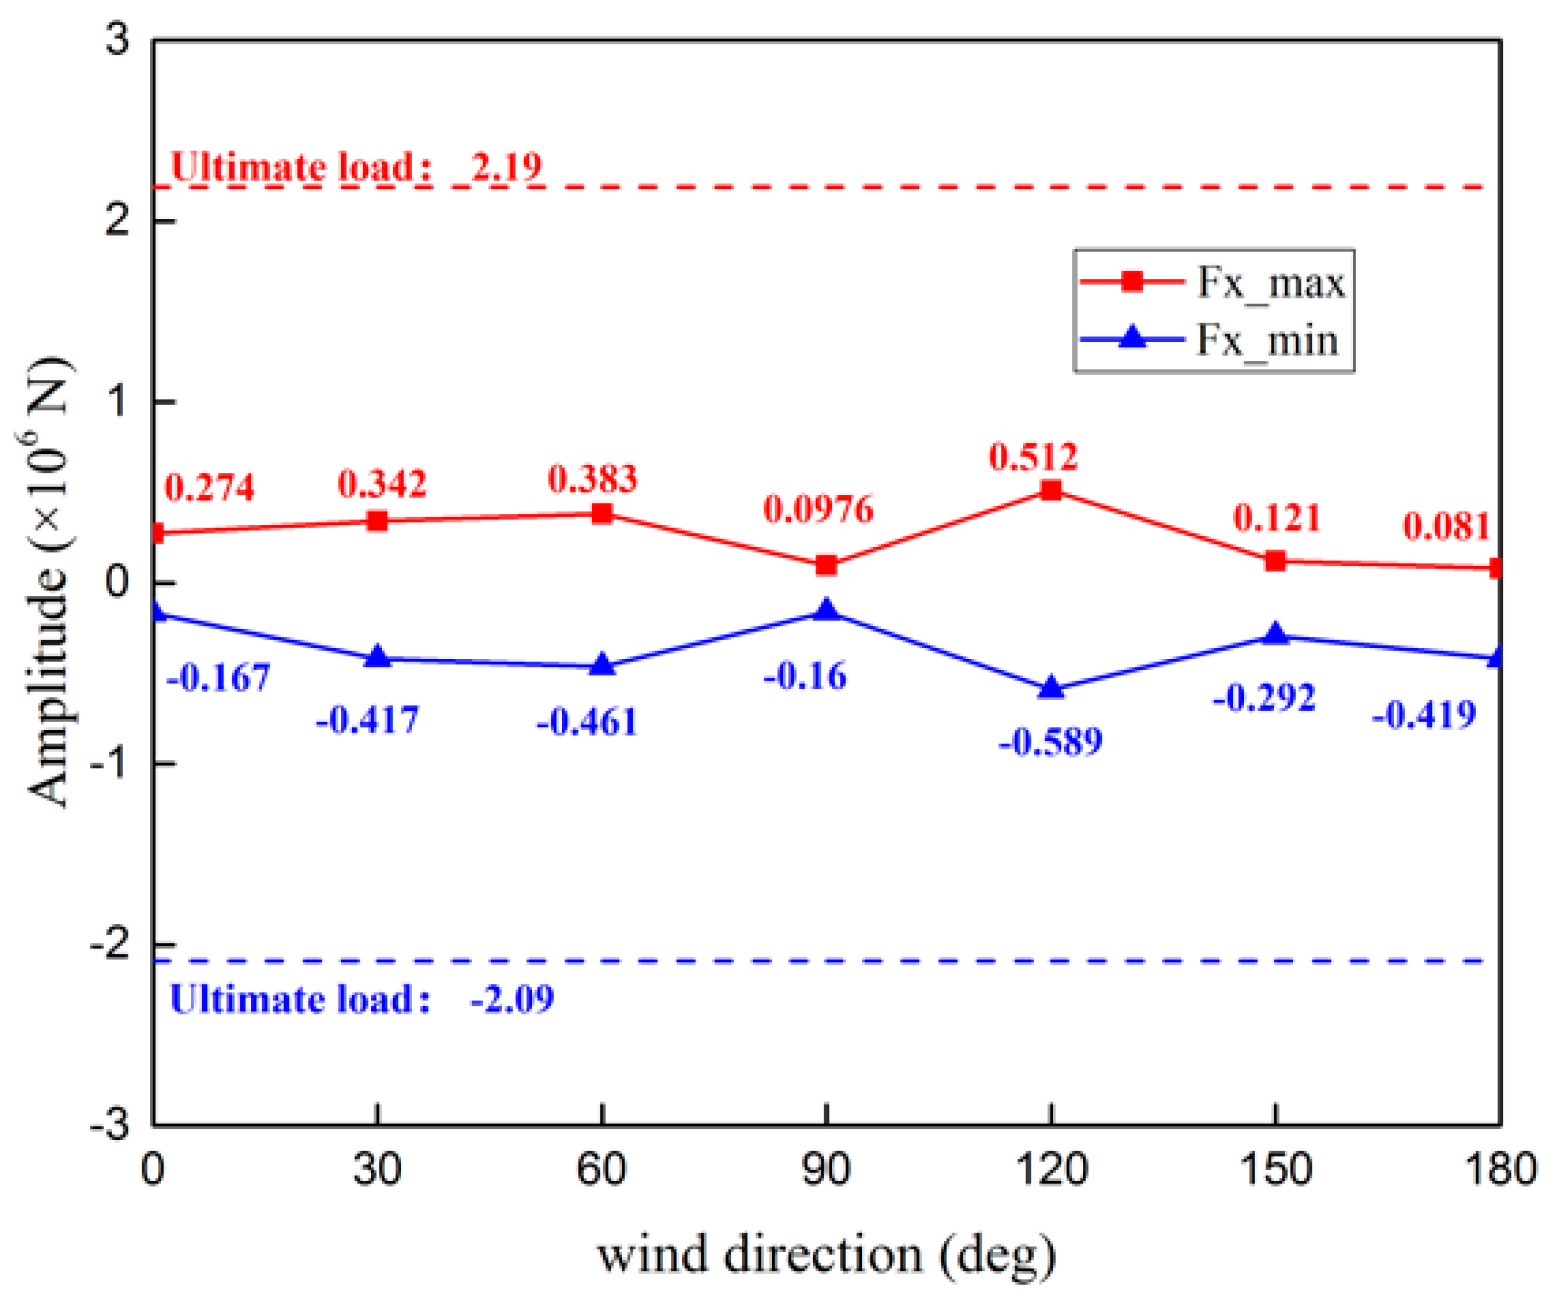
3.3. Analysis of Aeroelastic Response
4. Conclusions
- By analyzing the power spectrum and turbulence intensity of the simulated typhoon, it is found that the characteristics are similar to the measured results. Therefore, it can be considered that the simulated wind can represent the real-time fluctuating typhoon wind and establish the calculating reliability of the wind turbine response.
- The typhoon is simulated based on the measured spectrum and its energy mainly concentrates in the low frequency region, which is close to the natural frequency of wind turbines and it is easy to resonate with the structural coupling. There are more abrupt changes in the higher order instantaneous frequency, which reflects the non-stationary characteristics of typhoons.
- There are significant differences in the response characteristics of wind turbines at different yaw inflow angles. Especially when the inflow angle is 30 degrees, the blade exhibits the greatest load and shows the most violent vibration; when the yaw angle is 120 degrees, the extreme load of the tower exceeds the design ultimate value obtained according to the specification. The vibration energy of the tower is much higher than that of the other working conditions when the yaw angle is 30 degrees and 120 degrees. The simulation analysis of different sizes of wind turbine models shows that the vibration changes similarly under different inflow yaw angles, which indicates the universality of the influence of inflow yaw angles on the aeroelastic responses of wind turbines.
Author Contributions
Funding
Conflicts of Interest
References
- Li, Q.S.; Li, X.; He, Y.; Yi, J. Observation of wind fields over different terrains and wind effects on a super-tall building during a severe typhoon and verification of wind tunnel predictions. J. Wind Eng. Ind. Aerodyn. 2017, 162, 73–84. [Google Scholar] [CrossRef]
- Hazelton, A.T.; Rogers, R.F.; Hart, R.E. Analyzing Simulated Convective Bursts in Two Atlantic Hurricanes. Mon. Weather Rev. 2017, 145, 3073–3094. [Google Scholar] [CrossRef]
- Kepert, J.D. Time and space scales in the tropical cyclone boundary layer and the location of the eyewall updraft. J. Atmos. Sci. 2017, 74, 3305–3323. [Google Scholar] [CrossRef]
- Williams, G.J., Jr. The thermodynamic evolution of the hurricane boundary layer during eyewall replacement cycles. Meteorol. Atmos. Phys. 2017, 129, 611–627. [Google Scholar] [CrossRef]
- Liu, D.; Song, L.; Li, G. Study on Wind Profile of Typhoon HAGUPIT Using Wind Observed Tower and Wind Profile Radar Measurements. J. Trop. Meteorol. 2011, 27, 317–326. [Google Scholar]
- Song, L.; Pang, J.; Jiang, C. Measurement and Analysis of Turbulence Characteristics of Typhoon “Parrot”. J. Sci. Sin. Technol. 2010, 40, 1409–1419. [Google Scholar]
- Glauert, H. Airplane Propellers; Dover Publications: New York, NY, USA, 1963. [Google Scholar]
- Prandtl, L.; Betz, A. Vier Abhandlungen zur Hydrodynamik und Aerodynamik; Göttinger Nachr.: Göttingen, Germany, 1927; pp. 88–92. [Google Scholar]
- Gupta, S. Development of a Time-Accurate Viscous Lagrangian Vortex Wake Model for Wind Turbine Applications; University of Maryland: College Park, MD, USA, 2006. [Google Scholar]
- Saverin, J.; Peukert, J.; Marten, D.; Pechlivanoglou, G.; Paschereit, C.O.; Greenblatt, D. Aeroelastic simulation of multi-MW wind turbines using a free vortex model coupled to a geometrically exact beam model. J. Phys. Conf. Ser. 2016, 753, 082015. [Google Scholar] [CrossRef]
- Li, Y.; Paik, K.J.; Xing, T.; Carrica, P.M. Dynamic overset CFD simulations of wind turbine aerodynamics. Renew. Energy 2012, 37, 285–298. [Google Scholar] [CrossRef]
- Calaf, M.; Meneveau, C.; Meyers, J. Large eddy simulation study of fully developed wind-turbine array boundary layers. Phys. Fluids 2010, 22, 46–56. [Google Scholar] [CrossRef]
- Cai, G.P.; Hong, J.Z.; Yang, S.X. Dynamic analysis of a flexible hub-beam system with tip mass. Mech. Res. Commun. 2005, 32, 173–190. [Google Scholar] [CrossRef]
- Gao, Y.W.; Li, C.; Cheng, X. Research on foundation response of a tri-floater offshore wind turbine. Conf. Ser. Mater. Sci. Eng. 2013, 52, 66–71. [Google Scholar] [CrossRef]
- Rezaei, M.M.; Behzad, M.; Haddadpour, H.; Moradi, H. Aeroelastic analysis of a rotating wind turbine blade using a geometrically exact formulation. Nonlinear Dyn. 2017, 89, 2367–2392. [Google Scholar] [CrossRef]
- Ho, J.Y.L. Direct Path Method for Flexible Multibody Spacecraft Dynamics. J. Spacecr. Rocket. 2012, 14, 102–110. [Google Scholar] [CrossRef]
- Zhao, X.; Maißer, P.; Wu, J. A new multibody modelling methodology for wind turbine structures using a cardanic joint beam element. Renew. Energy 2007, 32, 532–546. [Google Scholar] [CrossRef]
- Wang, L.; Wang, T.; Wu, J.; Chen, G. Multi-objective differential evolution optimization based on uniform decomposition for wind turbine blade design. Energy 2017, 120, 346–361. [Google Scholar] [CrossRef]
- Han, T.; McCann, G.; Mücke, T.A.; Freudenreich, K. How can a wind turbine survive in tropical cyclone? Renew. Energy 2014, 70, 3–10. [Google Scholar] [CrossRef]
- Xiao, C.; Li, C. Failure investigation on a coastal wind farm damaged by super typhoon: A forensic engineering study. J. Wind Eng. Ind. Aerodyn. 2015, 147, 132–142. [Google Scholar]
- Chen, X.; Xu, J. Structural failure analysis of wind turbines impacted by super typhoon Usagi. Eng. Fail. Anal. 2016, 36, 391–404. [Google Scholar] [CrossRef]
- Chen, X. Structural integrity of wind turbines impacted by tropical cyclones: A case study from China. J. Phys. Conf. Ser. 2016, 753, 1–12. [Google Scholar] [CrossRef]
- Zhang, Z.; Li, J.; Ping, Z. Failure Analysis of Large-Scale Wind Power Structure under Simulated Typhoon. Math. Probl. Eng. 2003, 4, 30–32. [Google Scholar] [CrossRef]
- Dai, K.; Sheng, C.; Zhao, Z. Nonlinear response history analysis and collapse mode study of a wind turbine tower subjected to tropical cyclonic winds. Wind Struct. 2017, 25, 79–100. [Google Scholar]
- Lian, J.; Jia, Y.; Wang, H.; Liu, F. Numerical Study of the Aerodynamic Loads on Offshore Wind Turbines under Typhoon with Full Wind Direction. Energies 2016, 9, 613. [Google Scholar] [CrossRef]
- Fang, P.; Zhao, B.; Zeng, Z.; Yu, H.; Lei, X.; Tan, J. Effects of Wind Direction on Variations in Friction Velocity WithWind Speed Under Conditions of Strong Onshore Wind. J. Geophys. Res. Atmos. 2018, 123, 7340–7353. [Google Scholar]
- Dai, L.; Zhou, Q.; Zhang, Y.; Yao, S.; Kang, S.; Wang, X. Analysis of wind turbine blades aeroelastic performance under yaw conditions. J. Wind Eng. Ind. Aerodyn. 2017, 171, 273–287. [Google Scholar] [CrossRef]
- Wen, B.; Tian, X.; Dong, X.; Peng, Z.; Zhang, W.; Wei, K. A numerical study on the angle of attack to the blade of a horizontal-axis offshore floating wind turbine under static and dynamic yawed conditions. Energy 2019, 168, 1138–1156. [Google Scholar] [CrossRef]
- Chen, J.; Shen, X.; Zhu, X.; Du, Z. Influence of wake asymmetry on wind turbine blade aerodynamic and aeroelastic performance in shear/yawed wind. J. Renew. Sustain. Energy 2018, 10, 053309. [Google Scholar] [CrossRef]
- Chen, X.M.; Kang, S. Numerical Simulation of the Unsteady Aerodynamic of Wind Turbine under Yaw Condition. Adv. Mater. Res. 2015, 1070, 1883–1887. [Google Scholar] [CrossRef]
- Yin, L.L.; Lo, K.H.; Wang, S.S. Effects of Blade Pitch, Rotor Yaw, and Wind–Wave Misalignment on a Large Offshore Wind Turbine Dynamics in Western Gulf of Mexico Shallow Water in 100-Year Return Hurricane. J. Offshore Mech. Arct. Eng. 2017, 139, 011901. [Google Scholar] [CrossRef]
- Ebrahimi, A.; Sekandari, M. Transient response of the flexible blade of horizontal-axis wind turbines in wind gusts and rapid yaw changes. Energy 2018, 145, 261–275. [Google Scholar] [CrossRef]
- Dong, X.; Lian, J.; Wang, H.; Yu, T.; Zhao, Y. Structural vibration monitoring and operational modal analysis of offshore wind turbine structure. Ocean Eng. 2018, 150, 280–297. [Google Scholar] [CrossRef]
- Bassett, K.; Carriveau, R.; Ting, D.S. Ting1 Vibration response of a 2.3 MW wind turbine to yaw motion and shut down events. Wind Energy 2011, 14, 939–952. [Google Scholar] [CrossRef]
- Uzunoglu, E.; Soares, C.G. Yaw motion of floating wind turbine platforms induced by pitch actuator fault in storm conditions. Renew. Energy 2019, 134, 1056–1070. [Google Scholar] [CrossRef]
- Song, L.; Chen, W.; Wang, B.; Zhi, S.; Liu, A. Characteristics of wind profiles in the land falling typhoon boundary layer. J. Wind Eng. Ind. Aerodyn. 2016, 49, 77–88. [Google Scholar] [CrossRef]
- Tony, B.; David, S.; Nick, J.; Ervin, B. Wind Energy; John Wiley & Sons, Ltd.: Hoboken, NJ, USA, 2001. [Google Scholar]
- Li, L.; Xiao, Y.; Kareem, A.; Song, L.; Qin, P. Modeling typhoon wind power spectra near sea surface basedon measurements in the South China sea. J. Wind Eng. Ind. Aerodyn. 2012, 104, 565–576. [Google Scholar] [CrossRef]
- Hu, S.; Song, L.; Li, Q. Monitoring of typhoons in surface boundary layer and analysis of wind turbulence characteristics. J. Build. Struct. 2011, 32, 1–8. [Google Scholar]
- Rossi, R.; Lazzari, M.; Vitaliani, R. Wind field simulation for structural engineering purposes. Int. J. Numer. Methods Eng. 2004, 61, 738–763. [Google Scholar] [CrossRef]
- Shiotani, M.; Avai, H. Lateral Structures of Gusts of High Winds. In Proceedings of the International Research Seminar on Wind Effects on Buildings and Structures, Ottawa, ON, Canada, 11–15 September 1967; pp. 535–555. [Google Scholar]
- Bossanyi, E.A. GH Bladed Theory Manual; Garrad Hassan; Garrad Hassan and Partners: Bristol, UK, 2009; pp. 13–19. [Google Scholar]
- Huang, N.E.; Shen, Z.; Long, S.R. The Empirical Mode Decomposition and the Hilbert Spectrum for Nonlinear and non-Stationary Time Series Analysis. Math. Phys. Eng. Sci. 1998, 454, 903–995. [Google Scholar] [CrossRef]


| Parameter | Value | Parameter | Value |
|---|---|---|---|
| Rated speed | 10.5 m/s | Hub height | 100 m |
| Number of blades | 3 | Blade length | 78 m |
| Diameter of rotor | 160.7 m | Tip prebending | 4.5 m |
| First-order natural frequency (out of plane) | 0.438 Hz | First-order natural | 0.826 Hz |
| frequency (in plane) | |||
| Second-order natural frequency (out of plane) | 1.364 Hz | Second-order natural | 2.565 Hz |
| frequency (in plane) | |||
| First-order natural frequency of tower | 0.217 Hz | Second-order natural | 1.321 Hz |
| Frequency of tower |
| Direction | Measurement | Proposed | Kaimal | Von Karman |
|---|---|---|---|---|
| x | 18% | 17.7% | 12.63% | 15.45% |
| y | 15% | 14.3% | 10.66% | 12.36% |
| z | 7% | 5.8% | 5.89% | 7.87% |
| Inflow Yaw Angle (Deg) | 0 | 30 | 60 | 90 | 120 | 150 | 180 |
|---|---|---|---|---|---|---|---|
| Deflection Amplitude of Blade 1 (m) | 4.16 | 5.99 | 5.31 | 5.31 | 4.95 | 4.5 | 2.61 |
| Fy Maximum of Tower (×105N) | 2.81 | 7.38 | 2.31 | 2.27 | 7.09 | 4.54 | 2.74 |
| Fy Minimum of Tower (×105N) | −3.48 | −5.05 | −5.33 | −4.24 | −4.61 | −3.75 | −2.38 |
© 2019 by the authors. Licensee MDPI, Basel, Switzerland. This article is an open access article distributed under the terms and conditions of the Creative Commons Attribution (CC BY) license (http://creativecommons.org/licenses/by/4.0/).
Share and Cite
Han, R.; Wang, L.; Wang, T.; Gao, Z.; Wu, J. Study of Dynamic Response Characteristics of the Wind Turbine Based on Measured Power Spectrum in the Eyewall Region of Typhoons. Appl. Sci. 2019, 9, 2392. https://doi.org/10.3390/app9122392
Han R, Wang L, Wang T, Gao Z, Wu J. Study of Dynamic Response Characteristics of the Wind Turbine Based on Measured Power Spectrum in the Eyewall Region of Typhoons. Applied Sciences. 2019; 9(12):2392. https://doi.org/10.3390/app9122392
Chicago/Turabian StyleHan, Ran, Long Wang, Tongguang Wang, Zhiteng Gao, and Jianghai Wu. 2019. "Study of Dynamic Response Characteristics of the Wind Turbine Based on Measured Power Spectrum in the Eyewall Region of Typhoons" Applied Sciences 9, no. 12: 2392. https://doi.org/10.3390/app9122392
APA StyleHan, R., Wang, L., Wang, T., Gao, Z., & Wu, J. (2019). Study of Dynamic Response Characteristics of the Wind Turbine Based on Measured Power Spectrum in the Eyewall Region of Typhoons. Applied Sciences, 9(12), 2392. https://doi.org/10.3390/app9122392