Article

Intensity-Modulated PM-PCF Sagnac Loop in a DWDM Setup for Strain Measurement

by
Mateusz Mądry
1,*,
Lourdes Alwis
2 and
Elżbieta Bereś-Pawlik
1
1
Telecommunications and Teleinformatics Department, Faculty of Electronics, Wroclaw University of Science and Technology, Wyb. Wyspiańskiego 27, 50-370 Wrocław, Poland
2
School of Engineering and The Built Environment, Edinburgh Napier University, 10 Colinton Road, Edinburgh EH10 5DT, UK
*
Author to whom correspondence should be addressed.
Appl. Sci. 2019, 9(11), 2374; https://doi.org/10.3390/app9112374
Submission received: 9 April 2019 / Revised: 22 May 2019 / Accepted: 1 June 2019 / Published: 11 June 2019

Abstract

:

Featured Application

Potential application of the presented setup for strain measurement in a DWDM configuration.

Abstract

A novel intensity-modulated Sagnac loop sensor based on polarization-maintaining photonic crystal fiber (PM-PCF) in a setup with a dense wavelength division multiplexer (DWDM) for strain measurement is presented. The sensor head is made of PM-PCF spliced to single-mode fibers. The interferometer spectrum shifts in response to the longitudinal strain experienced by the PM-PCF. After passing the Sagnac loop, light is transmitted by a selected DWDM channel, resulting in a change in the output optical power due to the elongation of PM-PCF. Hence, appropriate adjustment of spectral characteristics of the DWDM channel and the PM-PCF Sagnac interferometer is required. However, the proposed setup utilizes an optical power measurement scheme, simultaneously omitting expensive and complex optical spectrum analyzers. An additional feature is the possibility of multiplexing of the PM-PCF Sagnac loop in order to create a fiber optic sensor network.

1. Introduction

Optical fiber sensors have been widely explored due to their potential advantages, i.e., immunity to electromagnetic interferences, compact size, lightweight and high sensitivity [1]. They could be applied as sensors for temperature [2,3], refractive index [4,5], humidity [6,7] or strain [8,9,10,11,12,13,14]. In fact, strain determination is one of the most important factors in structural health monitoring (SHM) [8]. So far, different fiber strain sensors have been presented, for example Mach–Zehnder interferometers [9,10], Fabry–Pérot interferometers [11], fiber Bragg gratings [12] or long period gratings [13,14]. In addition, Sagnac interferometers with highly birefringent fibers are also used for strain measurement. For instance, polarization-maintaining fibers (PMF) were proposed to be sensor heads for strain detection [15]. However, conventional PMFs, i.e., PANDA or bow-tie, are susceptible not only to strain, but also to ambient temperature. To overcome the temperature cross-sensitivity of PMF, Dong et al. [16] and Han [17] demonstrated the use of polarization-maintaining photonic crystal fiber (PM-PCF) in order to achieve strain sensing, which is inherently not sensitive to ambient temperature. Fu et al. presented a pressure sensor by applying PM-PCF within a Sagnac loop achieving a sensitivity of 3.42 nm/MPa [18]. The PM-PCF Sagnac loop was also incorporated within a fiber ring laser (FRL) to evaluate its environmental stability [19]. However, current setups based on spectral analysis in order to convert shifts in the transmission spectrum of the interferometer in response to elongation or pressure are not convenient and portable. Therefore, intensity-modulated optical fiber sensor setups are of interest in order to avoid expensive and advanced spectral analysis instruments [10,20]. Hence a novel, cost-effective, highly sensitive PM-PCF Sagnac loop strain sensor connected to a DWDM (Dense Wavelength Division Multiplexer) based on optical power measurement is herewith proposed. The incident light is modulated by the interferometer and output optical power is measured after passing through the DWDM. The elongation of PM-PCF causes a shift in the interferometer spectrum, resulting in different output spectra. Dong et al. showed a possibility of ~30 mε elongation of PM-PCF, which indicates good sensitivity, durability and efficient application in the field of strain sensing [16]. In the meantime, PM-PCF has low temperature sensitivity due to its structure, which was previously shown to be ~0.3 pm/1 °C [16,21].
The idea of the presented setup relies on a shift in the interferometer spectrum, which has an influence on the transmitted light modulated by DWDM. Therefore, investigation of axial strain is performed only by optical power meters. Approximately 11 dB of output optical power change was experimentally measured for elongation in a range of 0–2000 µε, which proves good sensing capabilities. The highest achieved sensitivity is approximately 0.01 dB/µε with maximal resolution of 1 µε. By applying reference measurement, incident light fluctuation could be eliminated. Additionally, the proposed setup may be easily multiplexed to create a sensor network consisting of PM-PCF Sagnac interferometers.
The work presented here considers one possible sensor configuration utilizing PM-PCF. It sheds light on a new approach with the use of PM-PCF Sagnac loops and optical power meters in order to determine the elongation of the fiber itself. One great advantage of the proposed system is that it is cost-effective in comparison to the current literature that utilizes spectral analysis measurement, where an interrogation unit is also quite expensive [16,17,22]. Currently, the PM-PCF fabrication technology is well developed as evidenced by the wide commercial availability of these fibers. Only a small length of PM-PCF is needed to complete a single sensor unit. Another feature of the proposed setup is its fairly high resolution compared to other wavelength-based setups employing this type of photonic crystal fiber [16,17,22]. A disadvantage of the demonstrated setup is the need for careful adjustment of PM-PCF Sagnac interferometer spectrum with the DWDM channel. However, preparation of proper PM-PCF length to correlate the spectrum should not to be a challenging problem. Another issue, which needs to be taken into consideration regarding practical implementation, is the protection of single-mode fibers in order to avoid any bending and elongation of the non-sensing length of the fiber.
This paper, for the first time to the best of the authors’ knowledge, presents a PM-PCF Sagnac loop sensor setup connected to a DWDM for sensing applications. The paper presents the theoretical background followed by the proposal for a sensor network as well as experimental results.

2. Theory

The Sagnac interferometer relies on the phase difference between two counter propagating light beams. Introducing highly birefringent fibers inside a loop provide different light paths, which results in a specific interferometer pattern at the output. The phase difference can be formulated as follows [16]:
φ = 2 π BL λ
where B is the birefringence of the PM-PCF known as the difference between effective refractive indices of the fast and slow axis, respectively, L is the length of the fiber and λ refers to the light wavelength. Due to the determination of the phase difference (φ), the transmission spectrum of the interferometer could be presented according to the following equation [16]:
T = 1 cos φ 2
Indeed, the transmission spectrum is a period function depending on the phase difference (φ). The wavelength spacing between two adjacent interferometer fringes could be approximated by the following function [16]:
Δ λ = λ 2 BL
According to Equation (3), the wavelength spacing of interferometer fringes directly depends on parameters of the fiber, i.e., birefringence and length. Elongation of the fiber leads to a change of phase difference ( Δ φ ) between counter propagating light waves, which could be expressed by the following formula [16]:
Δ φ = 2 π λ ( Δ LB + L Δ B )
As a consequence, this change of phase difference causes the interferometer spectrum to red-shift due to an increase in longitudinal strain. The temperature effect is negligible because of the PCF structure. In the proposed setup, the output power could be estimated as an integral over the common spectrum of the Sagnac interferometer (TINT) and filter function of a given DWDM channel (TDWDM) with respect to incident broadband light emission (TBLS):
P out T BLS ( λ ) T DWDM ( λ ) T INT ( λ ) d λ
The strain induces change in phase difference, which results in a shift in the interferometer spectrum. Thus, the change of optical power could be approximated as follows:
Δ P T BLS ( λ ) T DWDM ( λ ) ( 1 cos Δ φ 2 ) d λ
Change of phase difference caused by elongation has an influence on the transmitted power. Both the sensitivity and the measurement range are related to the edge slope of the interferometer and the spectral characteristics of DWDM. According to Equation (3), the wavelength spacing of interferometer fringes depends on both incident light wavelength and parameters of the fiber, i.e., birefringence and length. Thus, by the adjustment of the length of the PM-PCF, the measurement range could be modified.

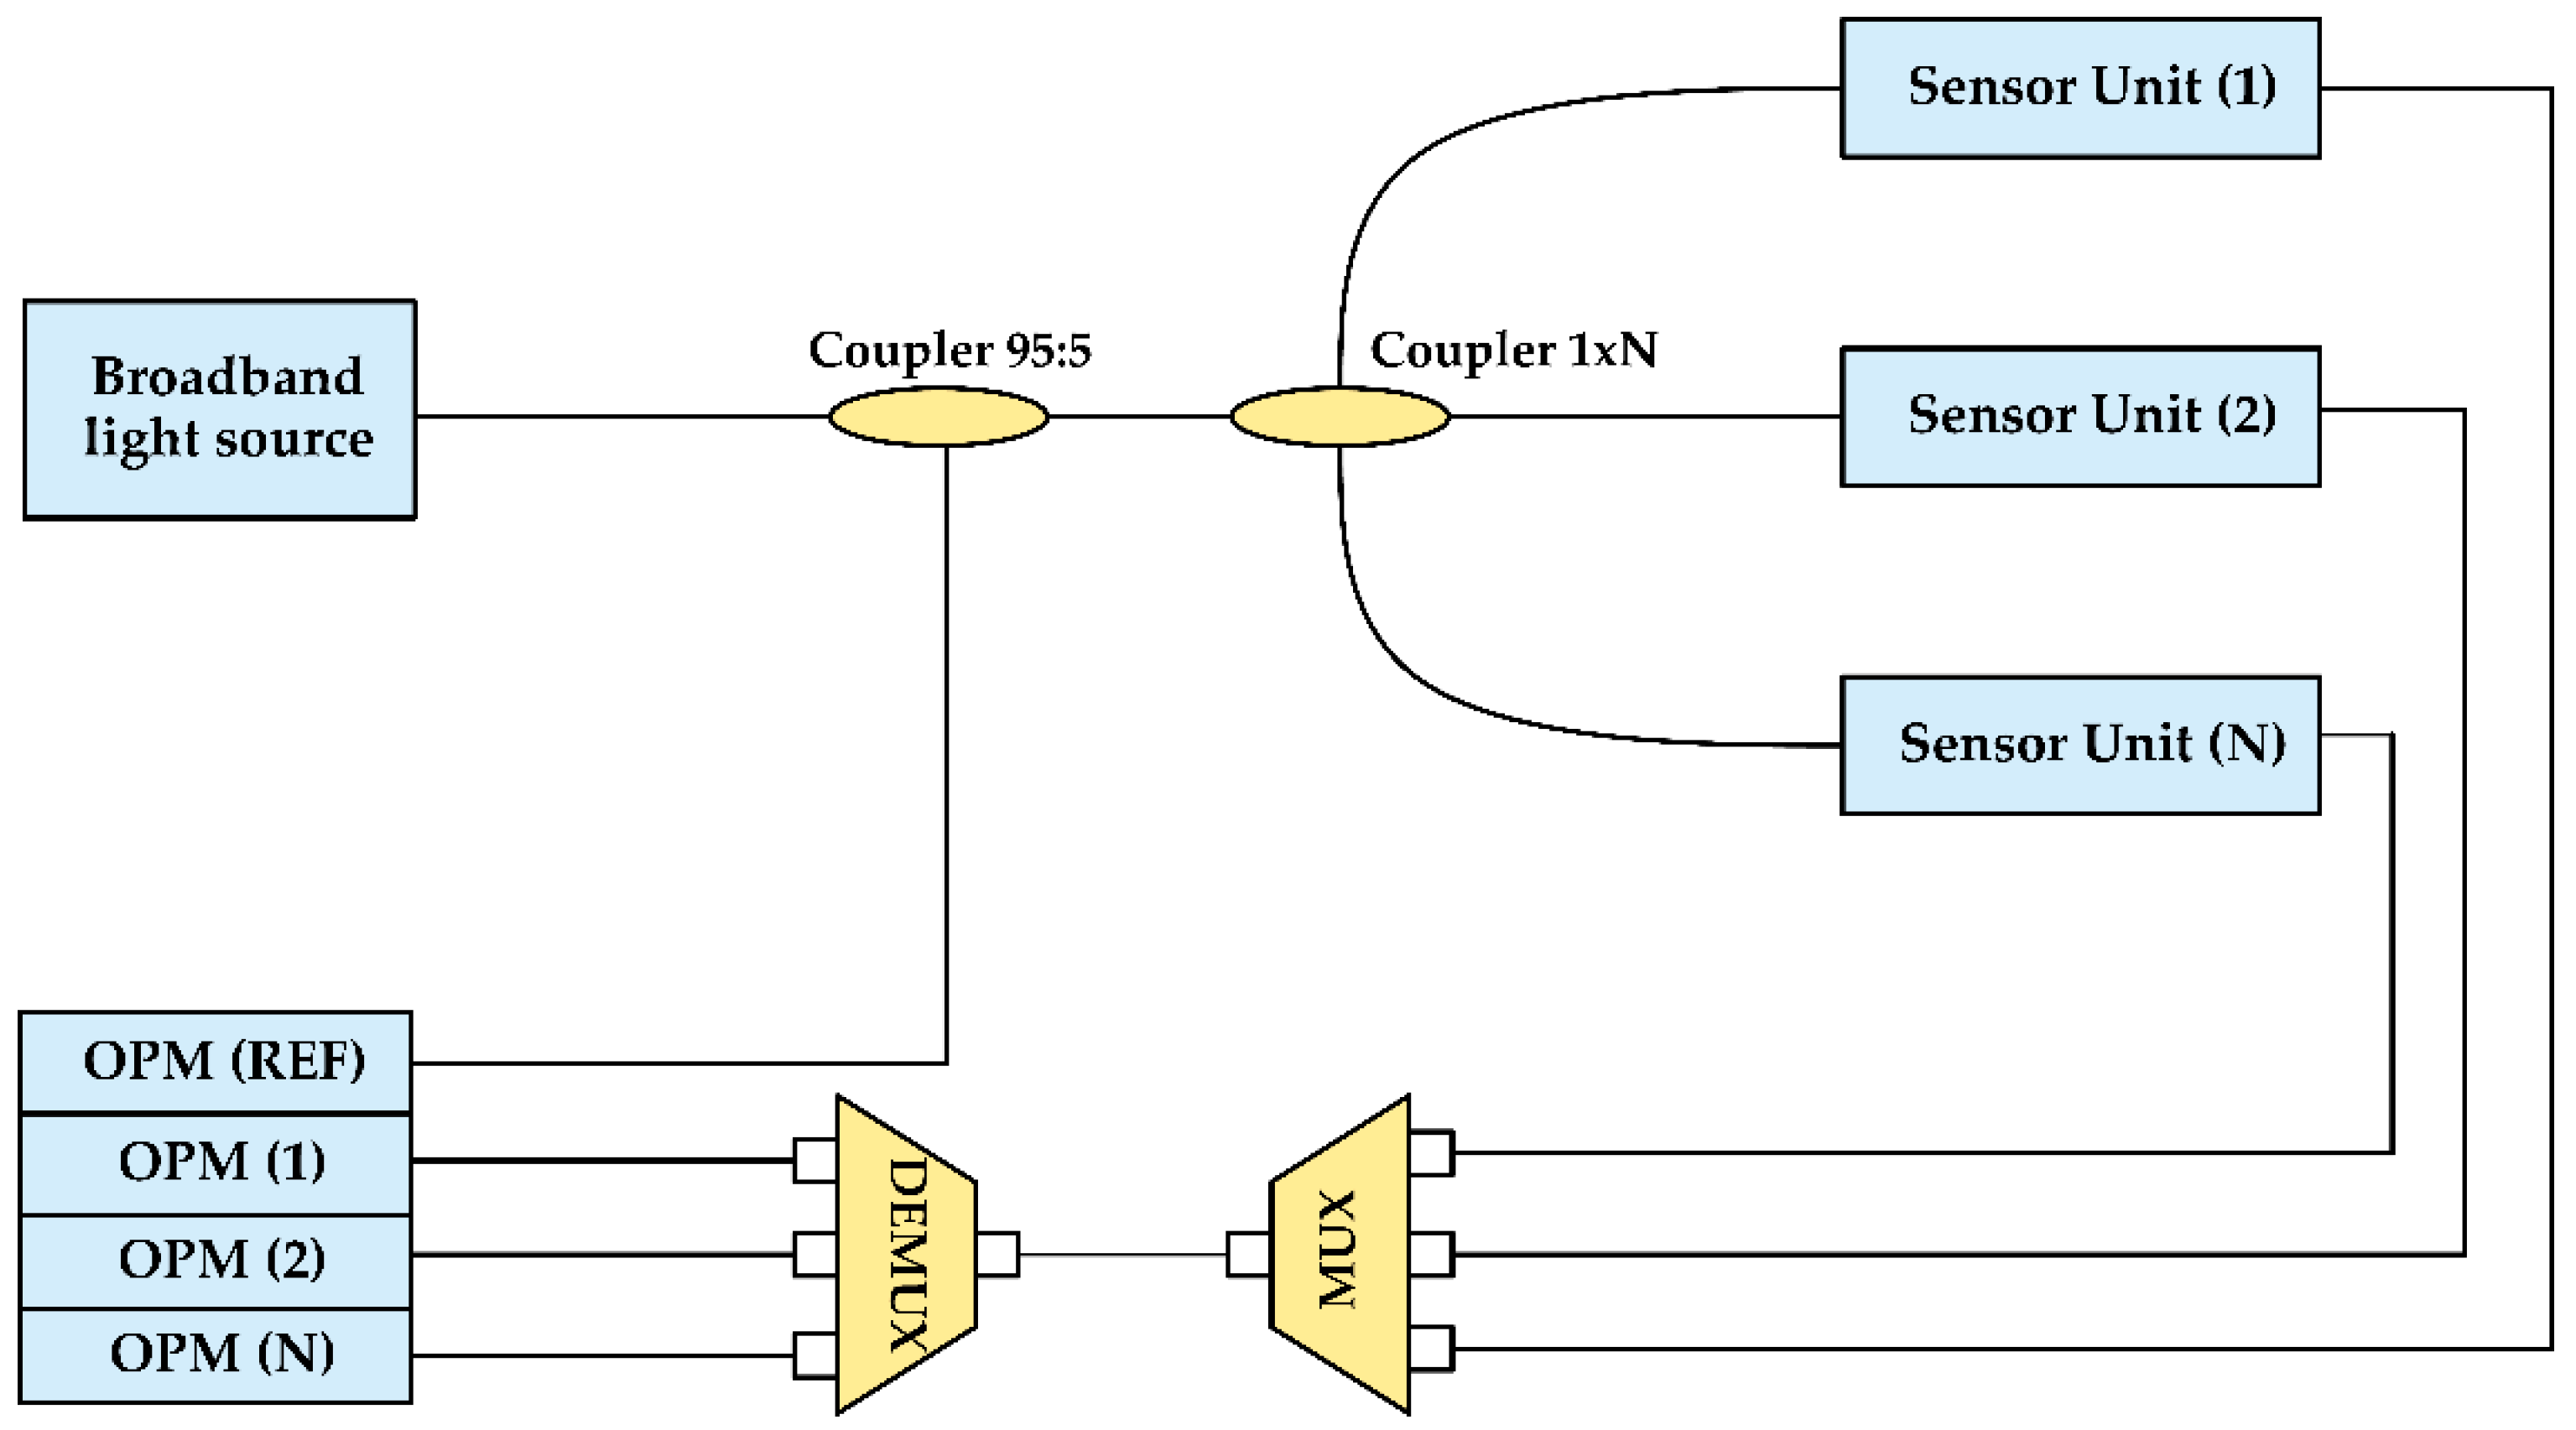
3. Proposed Sensor Network

The sensor network consists of a broadband light source, which is split into N number of Sensor Units. A small fraction of light is coupled out to the optical power reference measurement in order to eliminate power fluctuations. One sensor unit refers simply to the PM-PCF Sagnac loop. The main part of light propagates through the fiber coupler, demultplexer (DEMUX) and multiplexer (MUX). At the end, each DWDM channel is assigned to a given detector, which corresponds to the PM-PCF Sagnac loop. The whole scheme of the sensor network proposed is shown in the Figure 1.
In Figure 1 the OPM (REF) refers to the optical power meter used for reference measurement. OPM corresponds to the optical power meter used for measurement of optical power at the output of the n-th sensor unit, MUX is a multiplexer and DEMUX is a demultiplexer. The experimental setup was performed with one PM-PCF Sagnac loop (sensor unit) in order to prove the concept of the sensor network. Multiplexing of sensor units could lead to the obtaining of the proposed sensor network by selecting different wavelengths as it operates on a wavelength division multiplexing scheme. The presented sensor network proposal could then be implemented practically. The operating wavelength range of DWDM is consistent with the International Telecommunication Union (ITU) recommendations.

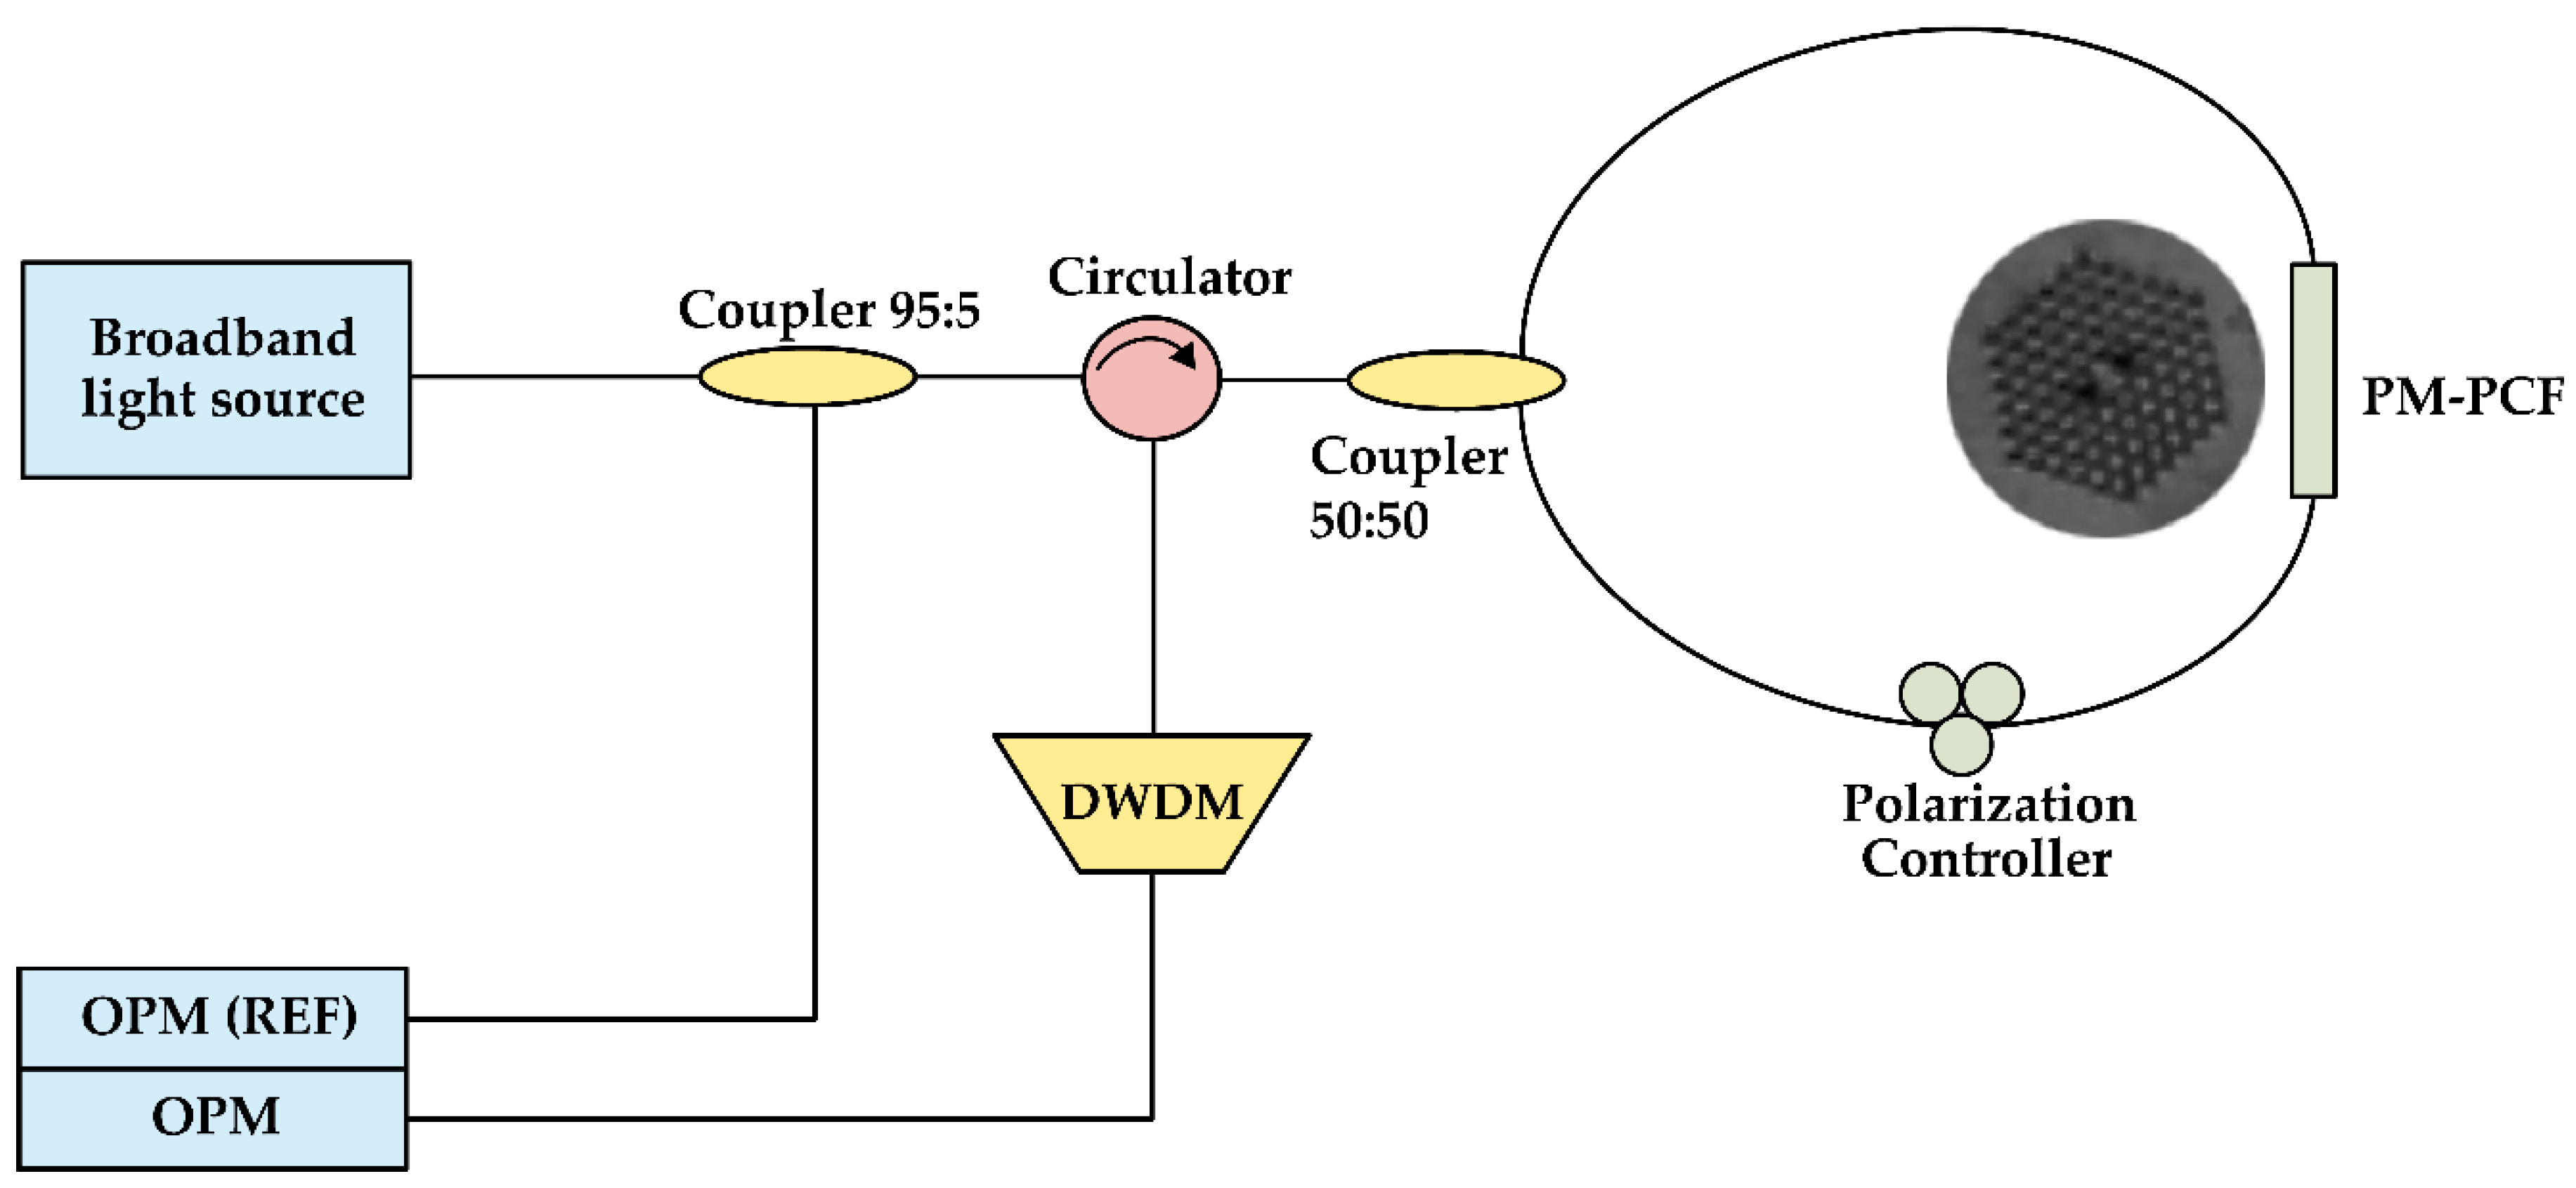
4. Experimental Setup

The experimental sensor setup is presented in Figure 2 and consists of a broadband light source (superluminescent light-emitting diode, λpeak = 1544.4 nm, FWHM = 45.5 nm, Thorlabs), two fiber couplers 1 × 2 (split ratio—95:5), a 3-port circulator, a fiber coupler 1 × 2 (split ratio—50:50), a polarization controller, polarization-maintaining photonic crystal fiber (PM-PCF), a dense wavelength division multiplexer (DWDM, 100 GHz, 8 channels, Fiberon) and two hand-held optical power meters (OPM, Detector: InGaAs, Resolution 0.01 dB, Grandway).
The used PM-PCF is commercially available and its properties are herein presented: core diameter 6.3/4.4 ± 0.5 µm, outer cladding 125 ± 5 µm, coating diameter 240 ± 10 µm, length—40 cm, birefringence: ≥4 × 10⁻⁴, attenuation ≤3 dB/km at 1550 nm. The image of the cross-section of fiber is fully presented as an inset in Figure 2.
The first fiber coupler 1 × 2 (95:5) was used to eliminate fluctuations from the light source. The fluctuation of any light source output power could be observed in a function of time. In order to prevent fluctuations, the fiber coupler is proposed to be implemented in the setup. Otherwise, the sensor output power value could be disturbed by light source power variation, thereby affecting strain determination accuracy. A circulator was placed within the sensor setup so as to provide the light propagation in the proper direction and to prevent any light reflections from affecting the superluminescent diode. In order to prepare the Sagnac interferometer, the splicing process of PM-PCF to SMF (single-mode fiber) was taken into consideration to enhance repeatability and minimize losses. Following the parameters presented by Xiao et al. [23], the PM-PCF was spliced to SMF using a commercial fusion splicer (FSU975, Ericsson). Additionally, appropriate adjustment of the polarization state within the Sagnac loop was made to provide adequate interferometer fringe visibility. A DWDM was incorporated to modulate the intensity of light by adjusting its spectrum with the edge slope of the PM-PCF Sagnac interferometer. Both spectrum of the DWDM channel and the Sagnac loop interferometer are shown in Figure 3.
Spectral analysis from Figure 3 reveals that the interferometer fringe spacing is approximately 6.5 nm (near λ = 1550 nm) with a fringe visibility of ~20 dB. The selected DWDM channel spectrum overlaps the slope of the interferometer spectrum, which ensures adequate operation of the proposed sensor. A shift in the interferometer spectrum provides different values of output optical power. The slope of the interferometer spectrum is also crucial for sensor setup capabilities as it is directly related to the fringe spacing and the measurement range of the sensor. Hence, the length of the PM-PCF needs to be controlled in order to meet specific requirements.
In summary, Table 1 presents all components used within the experimental sensor setup with specified parameters.

5. Results and Discussion

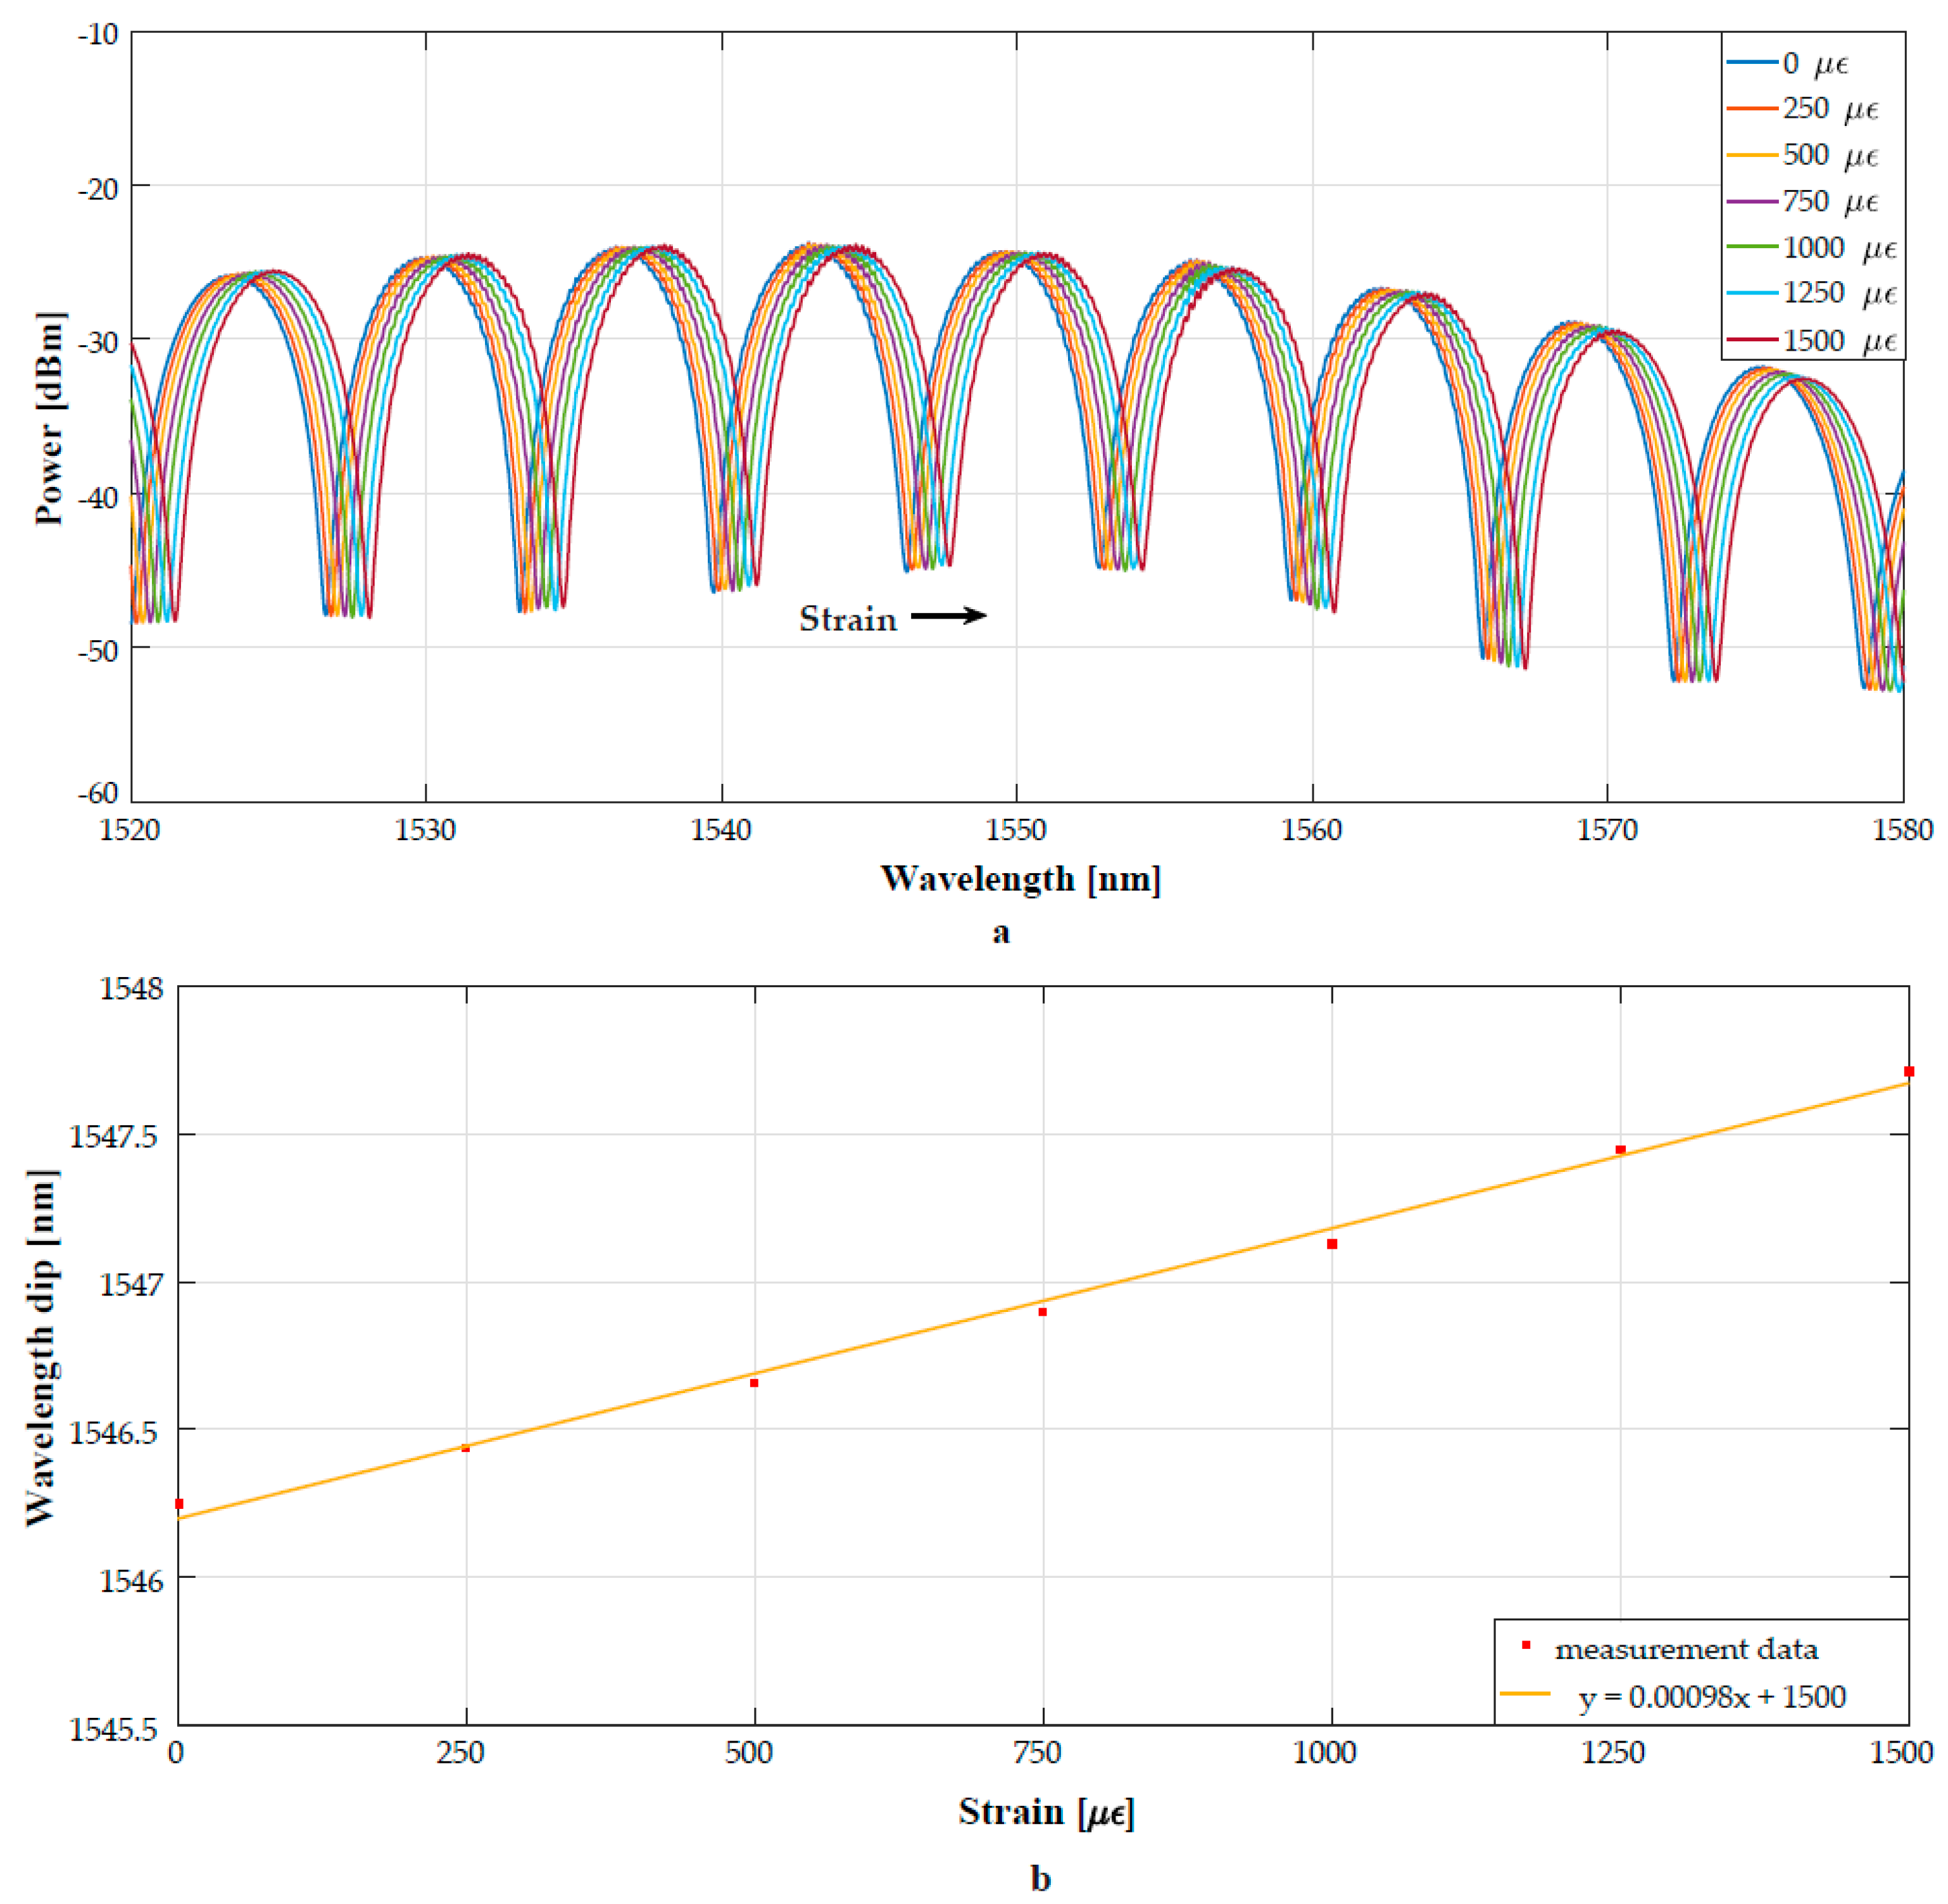
5.1. Strain Response of the PM-PCF Sagnac Interferometer

Firstly, the strain response of the PM-PCF Sagnac interferometer was investigated over the range of 0–1500 µε in steps of 250 µε through the use of translation stages in order to prove the sensing idea. The spectra of the interferometers are presented in Figure 4 as well as the wavelength shift as a function of elongation.
An interferometer fringe at 1546.3 nm was selected to analyze shifts due to elongation of the PM-PCF. A linear response to strain is observed, which is in agreement with the literature. The sensitivity of the PM-PCF Sagnac loop is determined to be approximately 0.98 pm/µε.

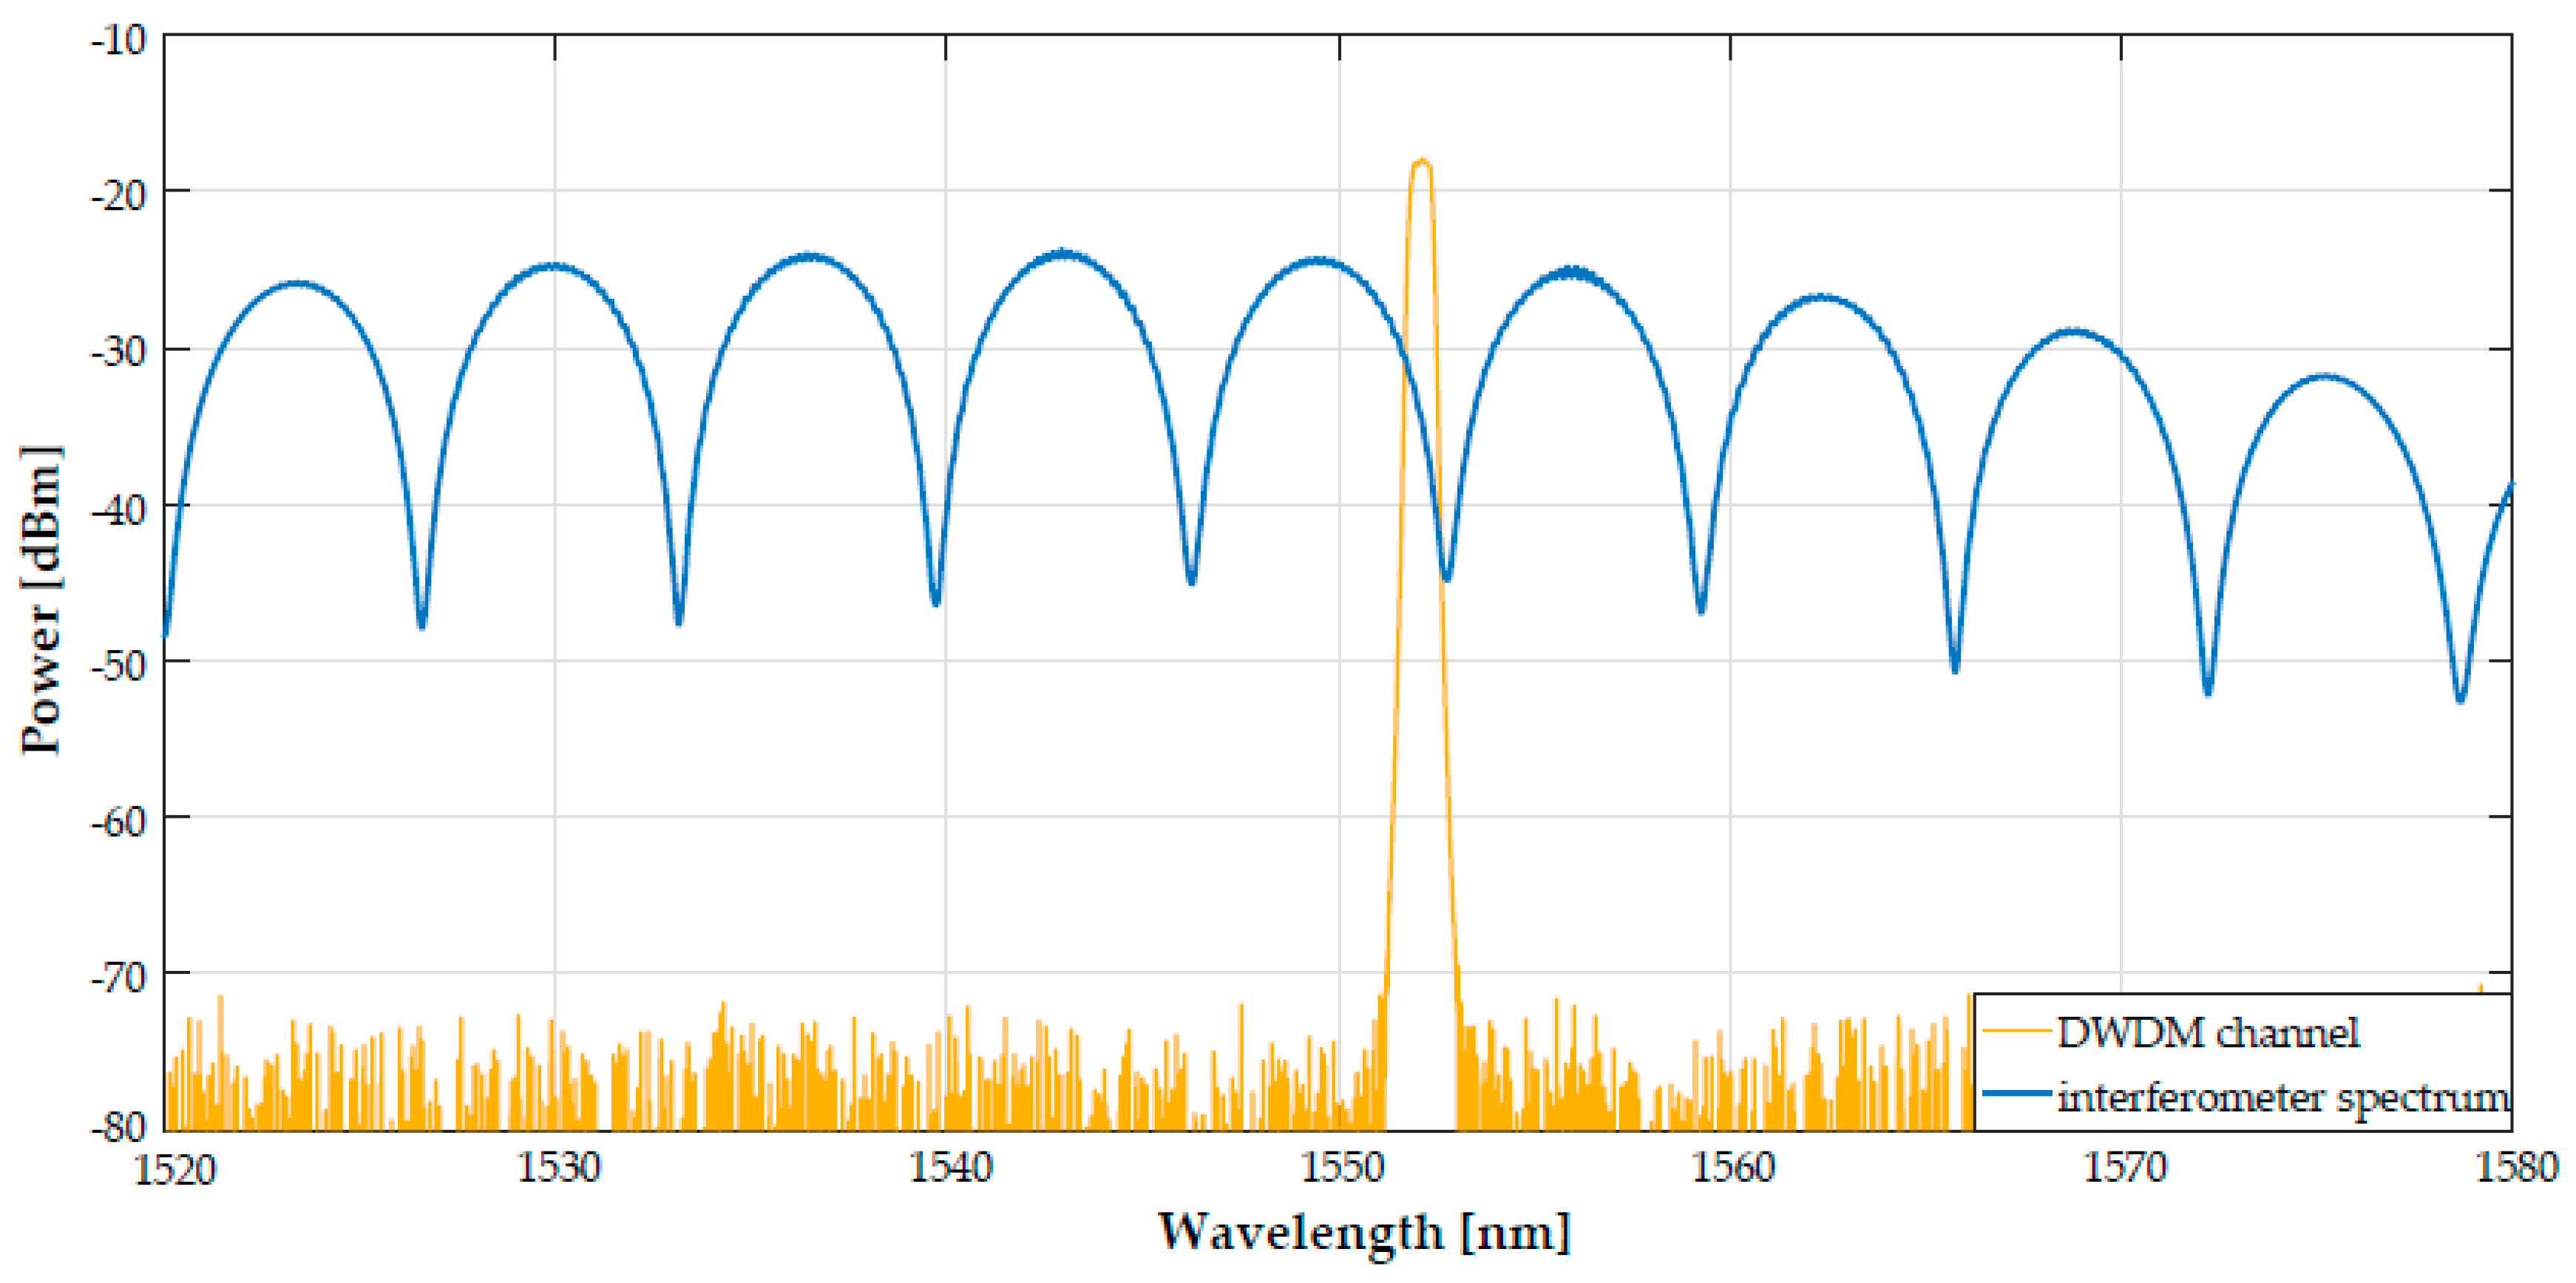
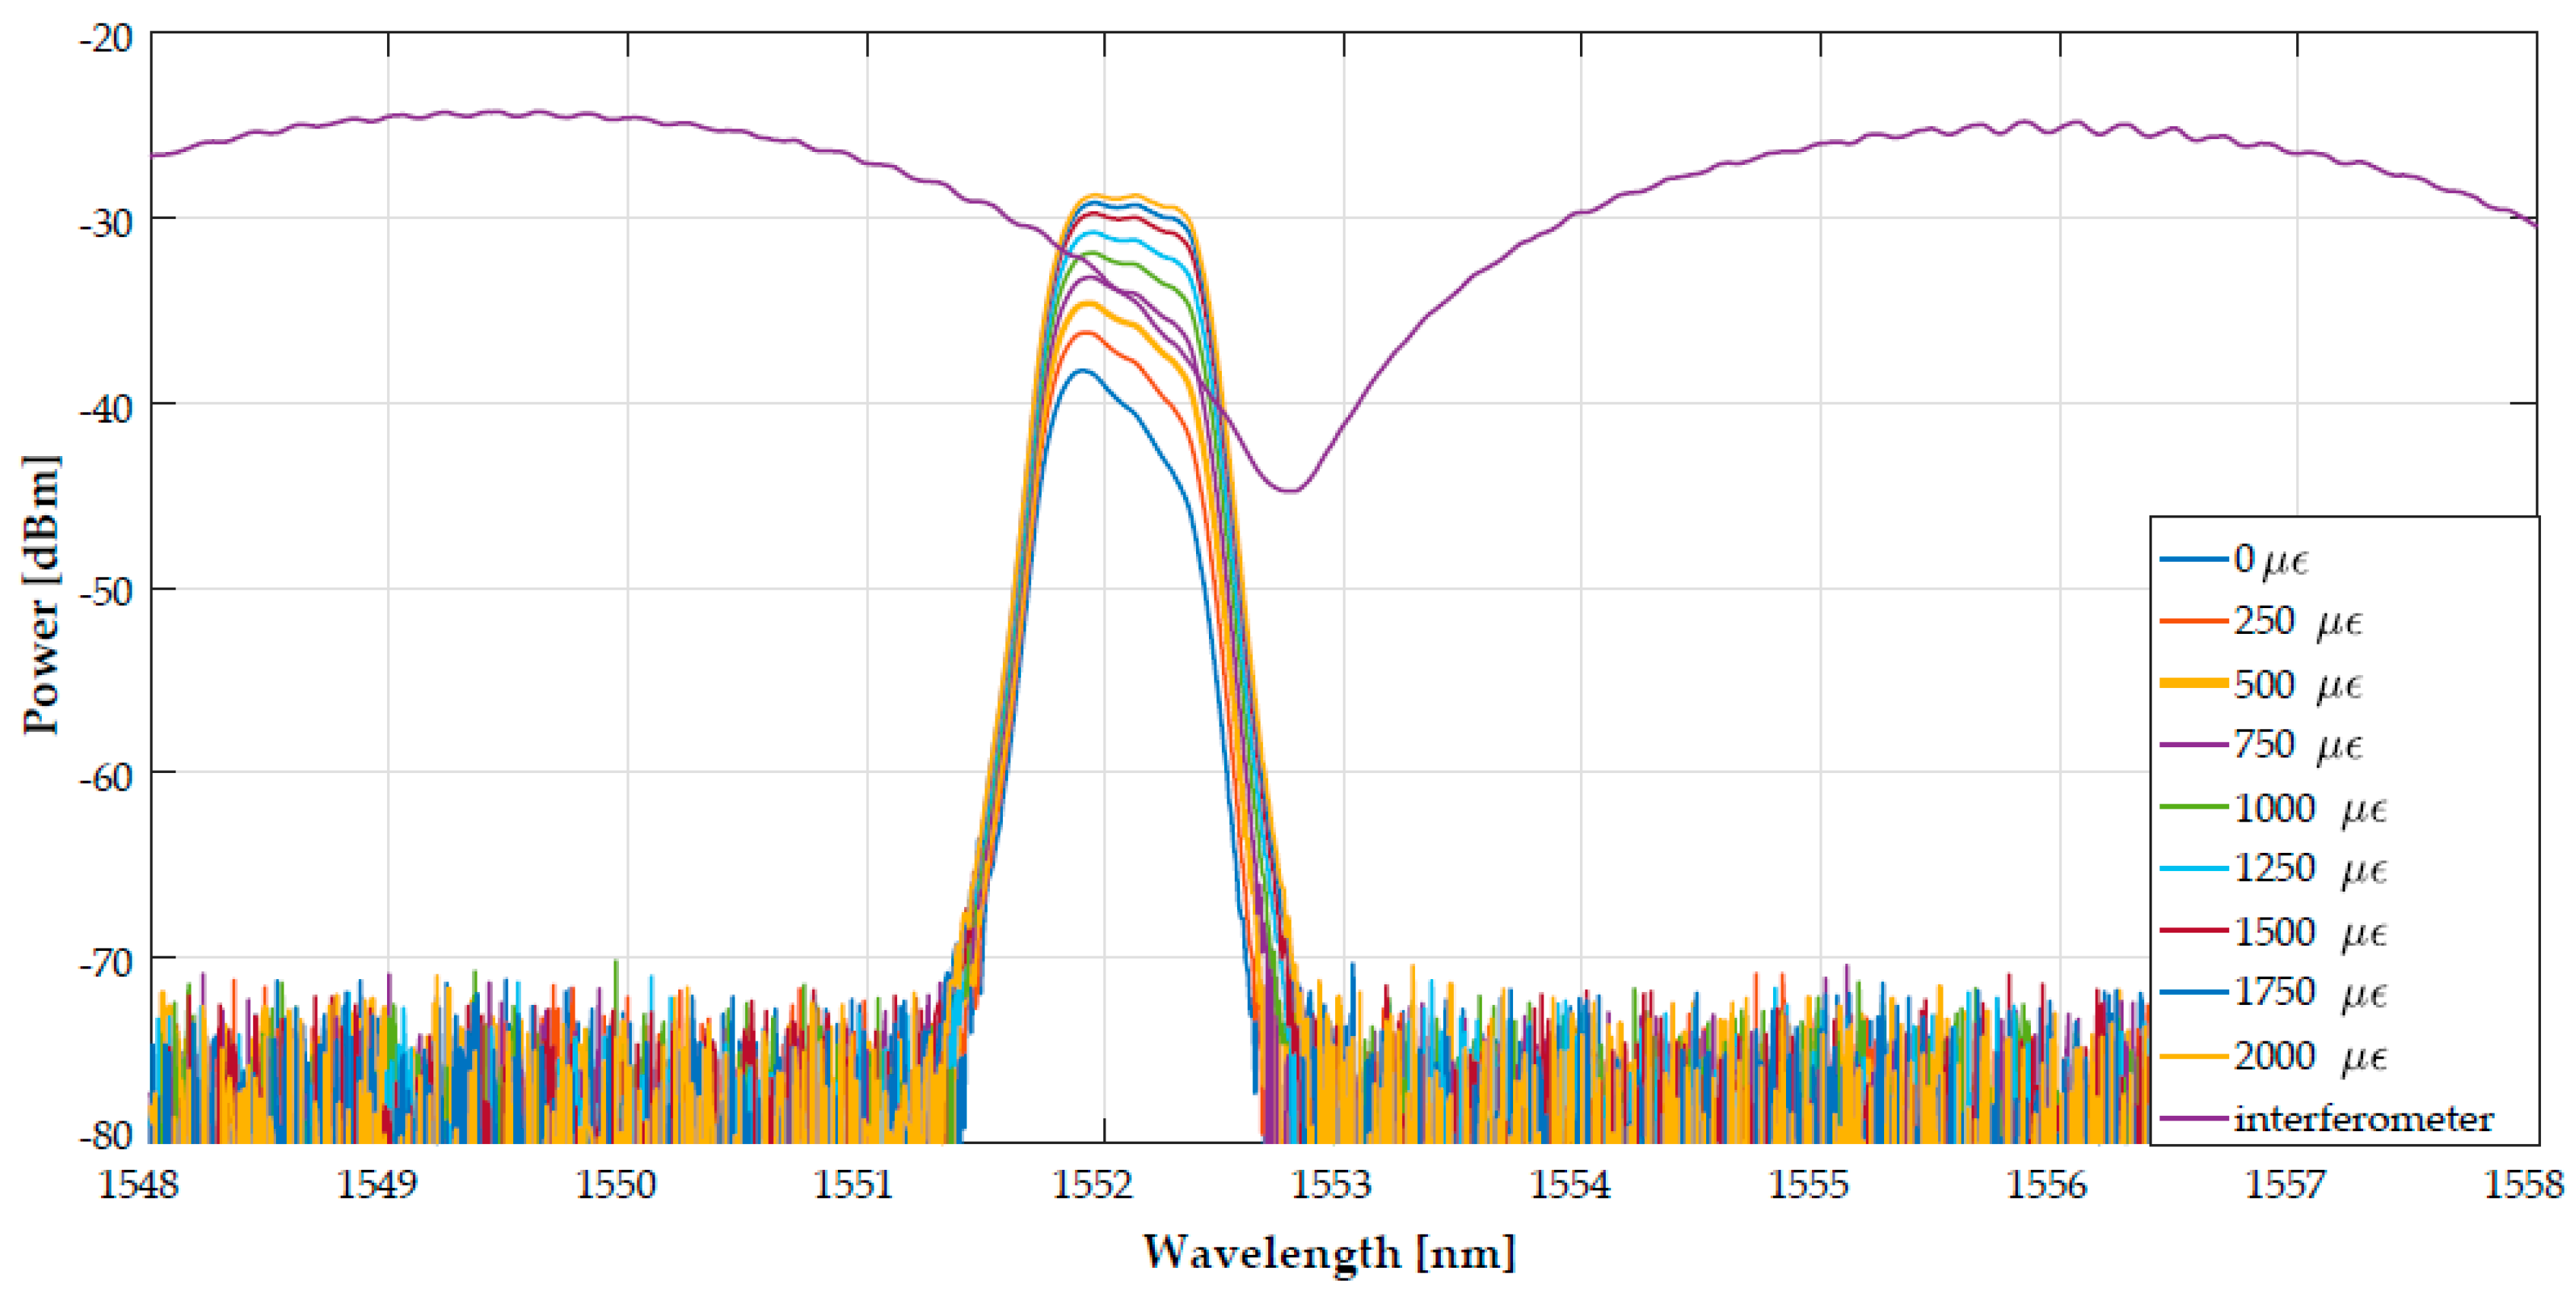
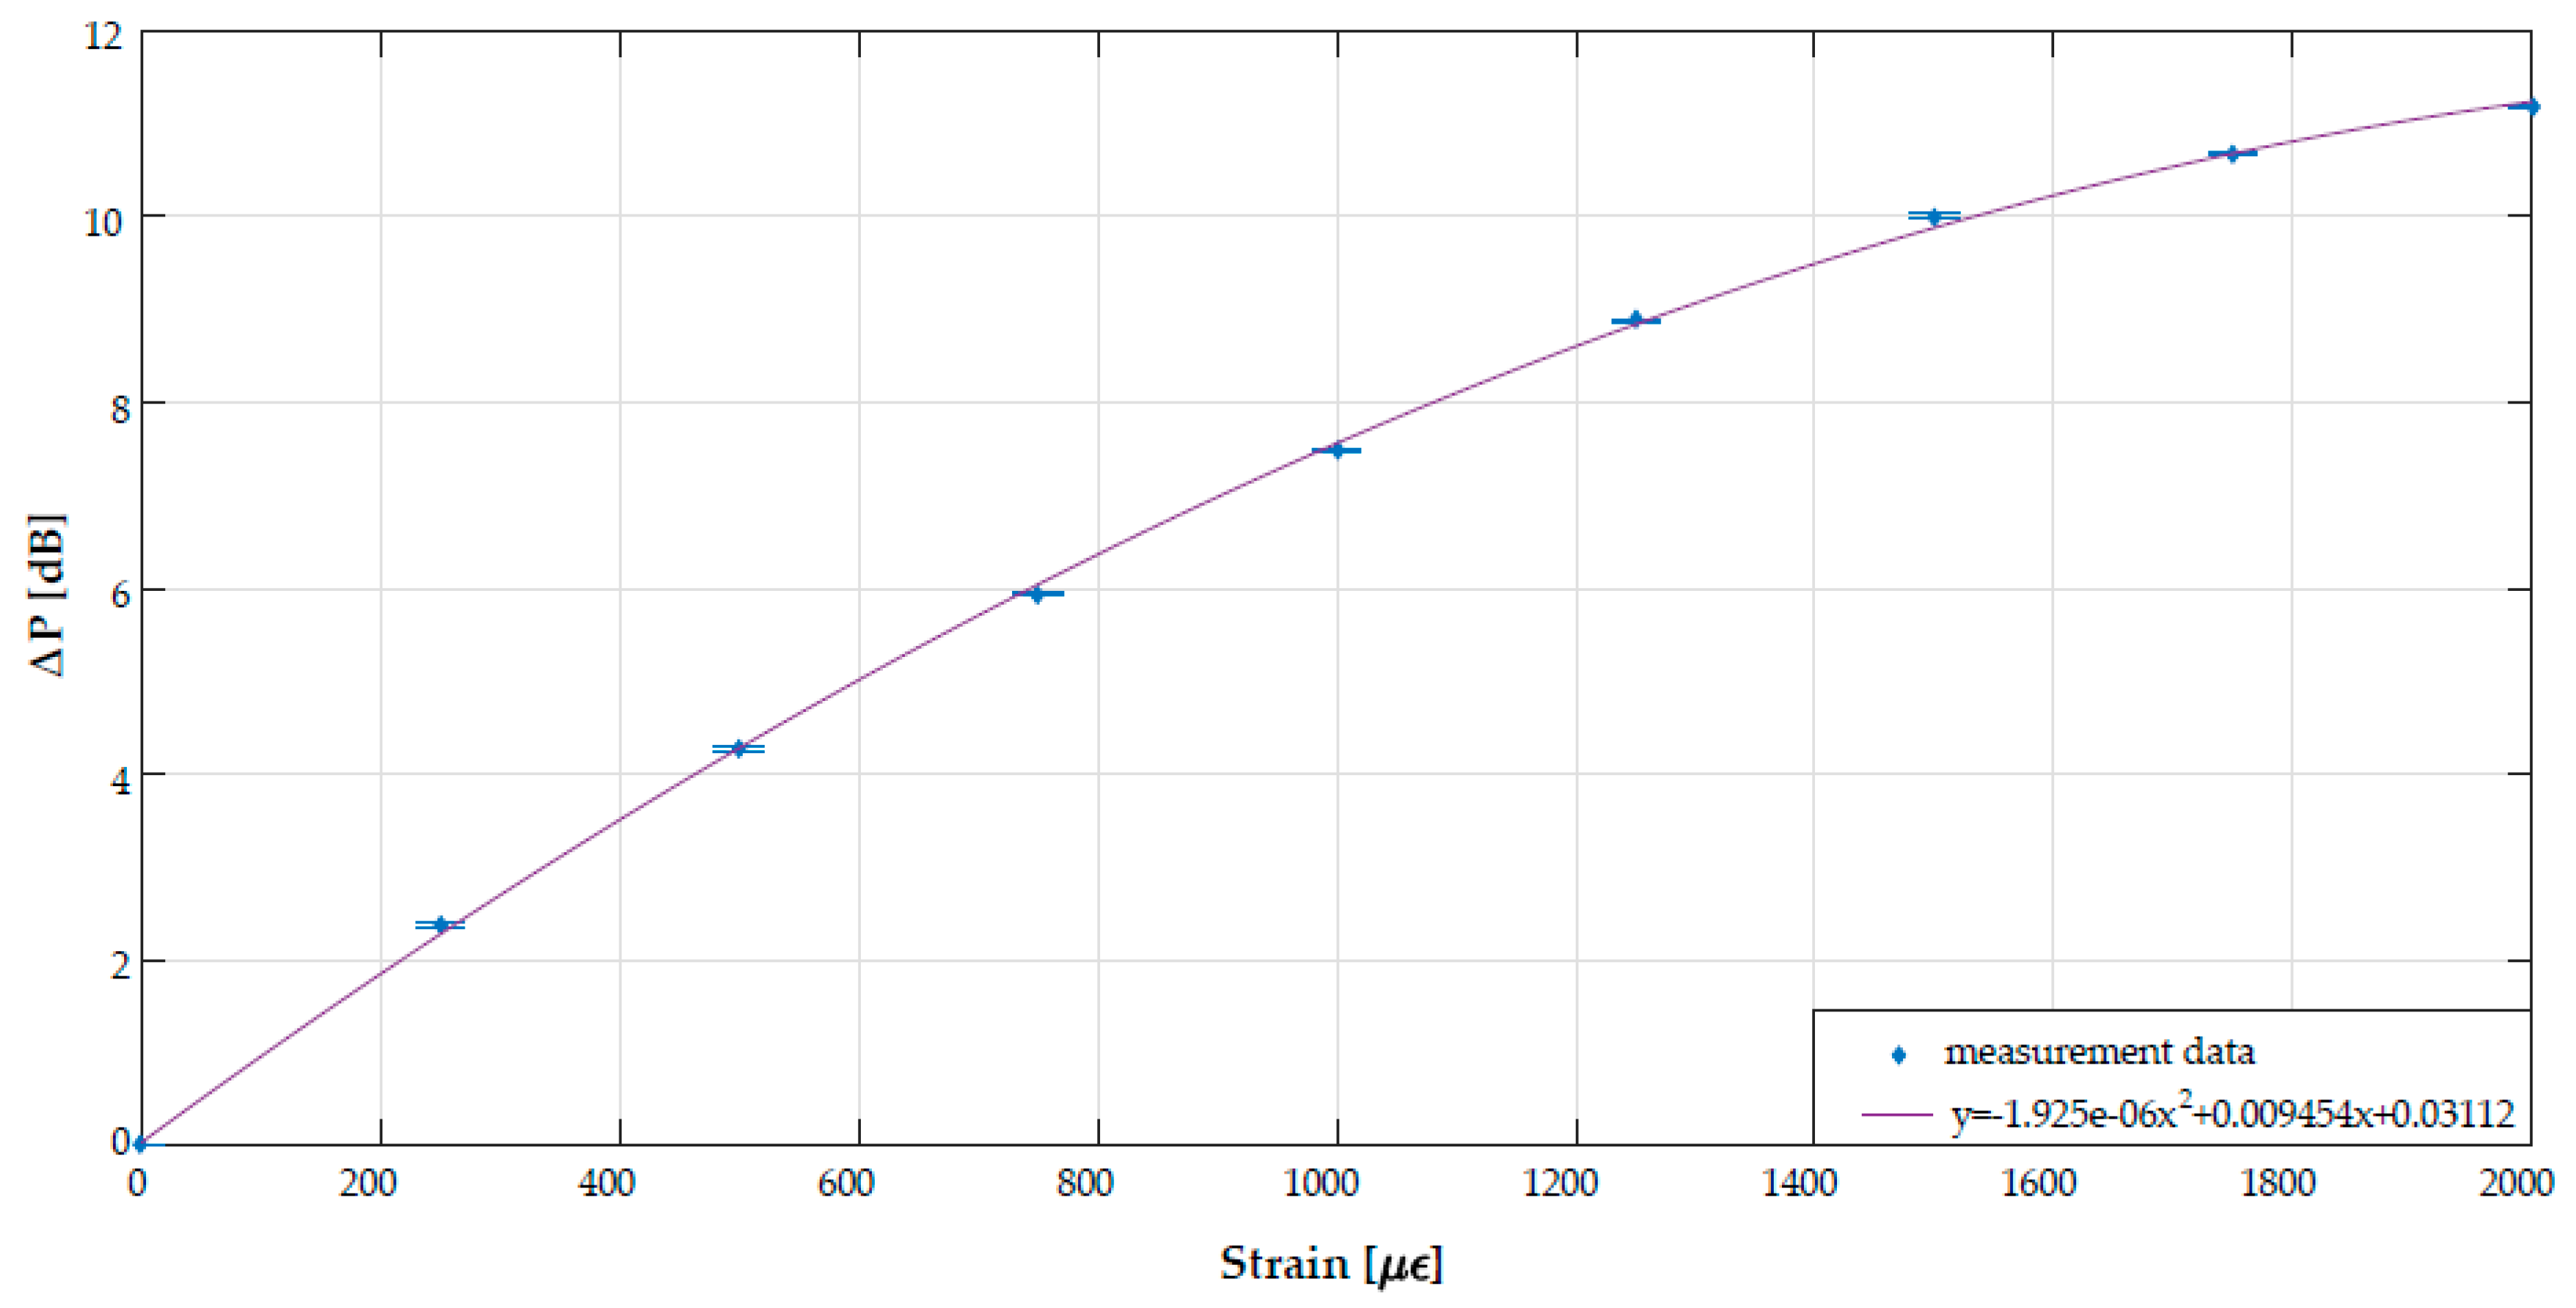
5.2. Strain Response of the Intensity-Modulated DWDM PM-PCF Sagnac Loop Sensor

The proposed sensor setup as depicted in Figure 2 was investigated by monitoring the output light after passing the Sagnac loop and the DWDM due to elongation of PM-PCF. The fiber was stretched over a range of 0–2000 µε in steps of 250 µε. The output transmission spectra are shown in Figure 5.
It could be observed from Figure 5 that the intensity of the output light is different due to the applied strain, i.e., the elongation of PM-PCF influences the spectrum of PM-PCF, which shifts towards longer wavelengths and thus the light coupling out from the Sagnac loop is accordingly modulated by the DWDM. The integral over the output spectrum corresponds to measured optical power, which determines the elongation of the fiber. An increase in strain causes an increase in output light. The intensity levels of the output spectrum are different due to the influence of edge slope spectrum of the interferometer. Thus, an investigation into the optical power change was conducted using the reference (Pref) and output power (Pout), which eliminates the fluctuation of incident light. Multiple measurements were performed in order to examine the proposed experimental setup. The relationship between the change of optical power and the axial strain is presented in Figure 6.
The analysis of measurement data shows that the change in optical power exceeds 11 dB (~11.2 dB) within 2000 µε with a negligible deviation between the performed measurements, maximally ± 0.03 dB. A nonlinear response to strain is observed, which could be a result of the spectral correlation between the interferometer and DWDM. The quadratic function was selected as a fitting function (R2 = 0.999) determined by the following equation:
Δ P = 1.925 · 10 6 · S 2 + 0.009454 · S + 0.03112
In the equation above S refers to the strain value applied on PM-PCF (µε) and ∆P corresponds to the change in output power (dB). To determine sensitivity at given strain values, the first order derivative of the fitting function was calculated as follows:
( Δ P ) S = 3.85 · 10 6 · S + 0.009454
Thus, the sensitivity is approximately 0.01 dB/µε at the initial value (0 µε) and 0.002 dB/µε at 2 mε, respectively. Assuming the resolution of the standard optical power meter used in the experiment (0.01 dB), the resolution of the proposed setup changes within the range of 1 µε to 5 µε was the result of the measurement.
Due to the use of an optical spectrum analyzer with a resolution of 0.01 nm and assuming the use of the experimental PM-PCF Sagnac interferometer (sensitivity of 0.98 pm/με according to the Figure 4), the possible resolution could be ~10 µε, which is lower than expected from the proposed intensity-modulated sensor setup.
The setup presented by Dong et al. had a sensitivity of 0.23 pm/με and a resolution of ~43 με [16]. A similar setup demonstrated by Han achieved a sensitivity of ∼1.3 pm/με [17]. Another comparable sensitivity was achieved by Orlando et al. [22], i.e., 1.21 pm/με or 1.11 pm/με depending on whether PM-PCF is uncoated or coated (acrylate). Thus, compared to wavelength-based sensor setups employing this type of PCF [16,17], the presented sensor exhibits a higher resolution (~1 to 5 με) and reduces system cost through the replacement of OSA (Optical Spectrum Analyzer) by optical power meters. Moreover, an easy multiplication of PM-PCF Sagnac loops is possible in order to create a sensor network as its operation relies on DWDM.
It is also necessary to account for possible error resulting from temperature effects. This constraint had already been thoroughly investigated in the literature regarding this type of fiber, [16,21,22] where almost inherent insensitivity to ambient temperature had been found in PM-PCF (~0.3 pm/°C). Assuming a temperature variation of 50 °C (0–50 °C), the induced error could be approximately 15 µε. It evidently shows that thermal effect could be negligible in the proposed setup. Nevertheless, the advantage of this setup is the utilization of cost-effective optical power measurement instead of spectral analysis. The measurement range is related to physical parameters of PM-PCF. An increase of PM-PCF length causes relatively smaller spacing of interferometer fringes, which reduces the measurement range of the sensor setup.

6. Conclusions

An intensity-modulated PM-PCF Sagnac loop for strain measurement has been presented and experimentally verified. The sensing part contains a Sagnac interferometer using a PM-PCF, which was subjected to axial strain. Due to the elongation of the PM-PCF, the interferometer spectrum shifts. By adjusting the DWDM, elongation of PM-PCF could be determined by direct output optical power measurement without a need for an OSA. Experimental results pointed out an increase in the output optical power as a function of longitudinal strain experienced by the PM-PCF. The setup has a maximal sensitivity of 0.01 dB/µε and resolution of 1 µε when measured using standard optical power meters. Additionally, this setup could be multiplexed in order to build a fiber sensor network by exploiting different DWDM wavelengths. It greatly reduces cost due to replacement of expensive and advanced OSA with optical power meters.

Author Contributions

Conceptualization, M.M. and E.B.-P.; investigation, M.M.; methodology, M.M.; supervision, E.B.-P.; validation, L.A.; writing—original draft, M.M.; writing—review & editing, L.A. and E.B.-P.

Acknowledgments

This research was co-financed by the Designated Subsidy for Young Scientists, no. 0402/0159/18 and statutory funds of the Telecommunications and Teleinformatics Department, Wrocław University of Science and Technology, no. 0401/0023/18.

Conflicts of Interest

The authors declare no conflict of interest.

References

  1. Chin, K.; Fang, Z.; Qu, R. Fundamentals of Optical Fiber Sensors, 1st ed.; John Wiley & Sons, Inc.: Hoboken, NJ, USA, 2012; pp. 1–6. [Google Scholar]
  2. Zhu, T.; Ke, T.; Rao, Y.; Chiang, K.S. Fabry–Perot optical fiber tip sensor for high temperature measurement. Opt. Commun. 2010, 283, 3683–3685. [Google Scholar] [CrossRef]
  3. Geng, Y.; Li, X.; Tan, X.; Deng, Y.; Yu, Y. High-Sensitivity Mach–Zehnder Interferometric Temperature Fiber Sensor Based on a Waist-Enlarged Fusion Bitaper. IEEE Sens. J. 2011, 11, 2891–2894. [Google Scholar] [CrossRef]
  4. Zhou, J.; Wang, Y.; Liao, C.; Sun, B.; He, J.; Yin, G.; Liu, S.; Li, Z.; Wang, G.; Zhong, X.; et al. Intensity modulated refractive index sensor based on optical fiber Michelson interferometer. Sens. Actuators B Chem. 2015, 208, 315–319. [Google Scholar] [CrossRef]
  5. Wo, J.; Wang, G.; Cui, Y.; Sun, Q.; Liang, R.; Shum, P.P.; Liu, D. Refractive index sensor using microfiber-based Mach–Zehnder interferometer. Opt. Lett. 2012, 37, 67–69. [Google Scholar] [CrossRef] [PubMed]
  6. Alwis, L.; Sun, T.; Grattan, K.T.V. Fibre optic long period grating-based humidity sensor probe using a Michelson interferometric arrangement. Sens. Actuators B Chem. 2013, 178, 694–699. [Google Scholar] [CrossRef]
  7. Chen, L.H.; Li, T.; Chan, C.C.; Menon, R.; Balamurali, P.; Shaillender, M.; Neu, B.; Ang, X.M.; Zu, P.; Wong, W.C.; et al. Chitosan based fiber-optic Fabry–Perot humidity sensor. Sens. Actuators B Chem. 2012, 169, 167–172. [Google Scholar] [CrossRef]
  8. López-Higuera, J.M.; Cobo, L.R.; Incera, A.Q.; Cobo, A. Fiber optic sensors in structural health monitoring. J. Lightwave Technol. 2011, 29, 587–608. [Google Scholar] [CrossRef]
  9. Hu, L.M.; Chan, C.C.; Dong, X.Y.; Wang, Y.P.; Zu, P.; Wong, W.C.; Qian, W.W.; Li, T. Photonic Crystal Fiber Strain Sensor Based on Modified Mach–Zehnder Interferometer. IEEE Photonics J. 2012, 4, 114–118. [Google Scholar] [CrossRef]
  10. Zhou, J.; Wang, Y.; Liao, C.; Yin, G.; Xu, X.; Yang, K.; Zhong, X.; Wang, Q.; Li, Z. Intensity-Modulated Strain Sensor Based on Fiber In-Line Mach–Zehnder Interferometer. IEEE Photonics Technol. Lett. 2014, 26, 508–511. [Google Scholar] [CrossRef]
  11. Liu, S.; Wang, Y.; Liao, C.; Wang, G.; Li, Z.; Wang, Q.; Zhou, J.; Yang, K.; Zhong, X.; Zhao, J.; et al. High-sensitivity strain sensor based on in-fiber improved Fabry-Perot interferometer. Opt. Lett. 2014, 39, 2121–2124. [Google Scholar] [CrossRef]
  12. Lima, H.F.; Antunes, P.F.; de Lemos Pinto, J.; Nogueira, R.N. Simultaneous Measurement of Strain and Temperature with a Single Fiber Bragg Grating Written in a Tapered Optical Fiber. IEEE Sens. J. 2010, 10, 269–273. [Google Scholar] [CrossRef]
  13. Wang, Y.-P.; Xiao, L.; Wang, D.N.; Jin, W. Highly sensitive long-period fiber-grating strain sensor with low temperature sensitivity. Opt. Lett. 2006, 31, 3414–3416. [Google Scholar] [CrossRef] [Green Version]
  14. Zhong, X.; Wang, Y.; Qu, J.; Liao, C.; Liu, S.; Tang, J.; Wang, Q.; Zhao, J.; Yang, K.; Li, Z. High-sensitivity strain sensor based on inflated long period fiber grating. Opt. Lett. 2014, 39, 5463–5466. [Google Scholar] [CrossRef] [PubMed]
  15. Frazão, O.; Baptista, J.M.T.; Santos, J.L. Recent Advances in High-Birefringence Fiber Loop Mirror Sensors. Sensors 2007, 7, 2970–2983. [Google Scholar] [CrossRef] [PubMed] [Green Version]
  16. Dong, X.; Tam, H.Y. Temperature-insensitive strain sensor with polarization-maintaining photonic crystal fiber based Sagnac interferometer. Appl. Phys. Lett. 2007, 90, 151113. [Google Scholar] [CrossRef] [Green Version]
  17. Han, Y.G. Temperature-insensitive strain measurement using a birefringent interferometer based on a polarization-maintaining photonic crystal fiber. Appl. Phys. B 2009, 95, 383–387. [Google Scholar] [CrossRef]
  18. Fu, H.Y.; Tam, H.Y.; Shao, L.-Y.; Dong, X.; Wai, P.K.A.; Lu, C.; Khijwania, S.K. Pressure sensor realized with polarization-maintaining photonic crystal fiber-based Sagnac interferometer. Appl. Opt. 2008, 47, 2835–2839. [Google Scholar] [CrossRef] [PubMed]
  19. Tang, Z.; Lou, S.; Wang, X. Experimental investigation on environmental stability of erbium-doped fiber laser based on Sagnac interferometer with a polarization-maintaining photonic crystal fiber. Opt. Laser Technol. 2018, 107, 186–191. [Google Scholar] [CrossRef]
  20. Qian, W.W.; Zhao, C.L.; Dong, X.Y.; Jin, W. Intensity measurement based temperature-independent strain sensor using a highly birefringent photonic crystal fiber loop mirror. Opt. Commun. 2010, 283, 5250–5254. [Google Scholar] [CrossRef]
  21. Zhao, C.-L.; Yang, X.; Lu, C.; Jin, W.; Demokan, M.S. Temperature-insensitive Interferometer using a highly birefringent photonic Crystal fiber loop mirror. IEEE Photonics Technol. Lett. 2004, 16, 2535–2537. [Google Scholar] [CrossRef]
  22. Frazão, O.; Baptista, J.M.; Santos, J.L. Temperature-Independent Strain Sensor Based on a Hi-Bi Photonic Crystal Fiber Loop Mirror. IEEE Sens. J. 2007, 7, 1453–1455. [Google Scholar] [CrossRef]
  23. Xiao, L.; Demokan, M.S.; Jin, W.; Wang, Y.; Zhao, C. Fusion Splicing Photonic Crystal Fibers and Conventional Single-Mode Fibers: Microhole Collapse Effect. J. Lightwave Technol. 2007, 25, 3563–3574. [Google Scholar] [CrossRef] [Green Version]
Figure 1. The proposed sensor network based on DWDM (Dense Wavelength Division Multiplexer) PM-PCF (Polarization-Maintaining Photonic Crystal Fiber) Sagnac loops.
Applsci 09 02374 g001
Figure 2. The scheme for the intensity-modulated PM-PCF based Sagnac loop strain sensor. Inset: The image of PM-PCF cross-section.
Applsci 09 02374 g002
Figure 3. The spectrum of selected DWDM channel and PM-PCF Sagnac loop interferometer.
Applsci 09 02374 g003
Figure 4. (a) The interferometer spectrum shift due to strain, (b) the strain response of a selected wavelength dip from the interferometer.
Applsci 09 02374 g004
Figure 5. The output light spectra for different stretched PM-PCF.
Applsci 09 02374 g005
Figure 6. The optical power change as a function of axial strain.
Applsci 09 02374 g006
Table 1. The parameters of used components.
Components of Sensor SetupParameters
Broadband light source (Thorlabs)Superluminescent light emitting diode, λpeak = 1544.4 nm, FWHM = 45.5 nm, Noise: <0.1%
Optical power meter (Grandway)InGaAs detector, resolution: 0.01 dB, measuring range: −70 to +10 dBm (1550 nm)
Polarization maintaining photonic crystal fiber (PM-1550-01, Thorlabs) Core diameter 6.3/4.4 ± 0.5 µm, outer cladding 125 ± 5 µm, coating diameter 240 ± 10 µm, length—40 cm, attenuation ≤3 dB/km (1550 nm), birefringence: ≥4·× 10−4.
Fiber coupler (Cellco)Single mode, 1 × 2, split ratio: 50:50
Fiber coupler (Cellco)Single mode, 1 × 2, split ratio: 95:5
Fiber circulator (Cellco)3-Port circulator, operating wavelength range: 1520–1580 nm
Dense wavelength division multiplexer (DWDM) (Fiberon)Channel spacing: 100 GHz, transmission insertion loss: typical—1.2 dB, transmission isolation: 28 dB

