Fabrication and Luminescent Properties of Zn–Cu–In–S/ZnS Quantum Dot Films under UV Excitation

 ,
,  ,
,  ,
, 


Abstract
1. Introduction
2. Materials and Methods
3. Results
4. Discussion
Author Contributions
Funding
Conflicts of Interest
References
- Feng, Q.; Wei, W.; Zhang, B.; Wang, H.; Wang, J.; Cong, H.; Wang, T.; Zhang, J. O-Band and C/L-Band III-V quantum dot lasers monolithically grown on ge and si substrate. Appl. Sci. 2019, 9, 385. [Google Scholar] [CrossRef]
- Qin, Y.; Feng, X.; Liu, Y. Nonlinear refractive index in rectangular graphene quantum dots. Appl. Sci. 2019, 9, 325. [Google Scholar] [CrossRef]
- Ganesan, A.A.; Houtepen, A.J.; Crisp, R.W. Quantum dot solar cells: Small beginnings have large impacts. Appl. Sci. 2018, 8, 1867. [Google Scholar] [CrossRef]
- Zych, E.; Meijerink, A.; Doneg, C.d.M. Quantum efficiency of europium emission from nanocrystalline powders of Lu2O3:Eu. J. Phys. Condens. Matter 2003, 15, 5145–5155. [Google Scholar] [CrossRef]
- Kim, S.; Park, J.; Kang, S.; Cha, B.; Cho, S.; Shin, J.; Son, D.; Nam, S. Investigation of the imaging characteristics of the Gd2O3: Eu nanophosphor for high-resolution digital X-ray imaging system. Nucl. Instrum. Methods Phys. Res. Sect. A Accel. Spectrom. Detect. Assoc. Equip. 2007, 576, 70–74. [Google Scholar] [CrossRef]
- Konstantatos, G.; Clifford, J.; Levina, L.; Sargent, E.H. Sensitive solution-processed visible-wavelength photodetectors. Nat. Photonics 2007, 1, 531–534. [Google Scholar] [CrossRef]
- Konstantatos, G.; Sargent, E.H. Colloidal quantum dot photodetectors. Infrared Phys. Technol. 2011, 54, 278–282. [Google Scholar] [CrossRef]
- Del Sordo, S.; Abbene, L.; Caroli, E.; Mancini, A.M.; Zappettini, A.; Ubertini, P. Progress in the development of CdTe and CdZnTe semiconductor radiation detectors for astrophysical and medical applications. Sensors 2009, 9, 3491–3526. [Google Scholar] [CrossRef]
- Rauch, T.; Böberl, M.; Tedde, S.F.; Fürst, J.; Kovalenko, M.V.; Hesser, G.; Lemmer, U.; Heiss, W.; Hayden, O. Near-infrared imaging with quantum-dot-sensitized organic photodiodes. Nat. Photonics 2009, 3, 332–336. [Google Scholar] [CrossRef]
- Stodilka, R.Z.; Carson, J.J.L.; Yu, K.; Zaman, M.B.; Li, C.; Wilkinson, D. Optical Degradation of CdSe/ZnS Quantum Dots upon Gamma-Ray Irradiation. J. Phys. Chem. C 2009, 113, 2580–2585. [Google Scholar] [CrossRef]
- Baharin, R.; Hobson, P.R.; Smith, D.R. Simulation of MeV electron energy deposition in CdS quantum dots absorbed in silicate glass for radiation dosimetry. J. Phys. Conf. Ser. 2010, 245, 012007. [Google Scholar] [CrossRef]
- Öberg, V.A.; Zhang, X.; Johansson, M.B.; Johansson, E.M.J. Solution-processed environmentally friendly Ag2S colloidal quantum dot solar cells with broad spectral absorption. Appl. Sci. 2017, 7, 1020. [Google Scholar] [CrossRef]
- Chan, W.C. Quantum Dot Bioconjugates for Ultrasensitive Nonisotopic Detection. Science 1998, 281, 2016–2018. [Google Scholar] [CrossRef] [PubMed]
- Ballou, B.; Lagerholm, B.C.; Ernst, L.A.; Bruchez, M.P.; Waggoner, A.S. Noninvasive imaging of quantum dots in mice. Bioconjug. Chem. 2004, 15, 79–86. [Google Scholar] [CrossRef]
- Jamieson, T.; Bakhshi, R.; Petrova, D.; Pocock, R.; Imani, M.; Seifalian, A.M. Biological applications of quantum dots. Biomaterials 2007, 28, 4717–4732. [Google Scholar] [CrossRef]
- Yu, W.W.; Chang, E.; Drezek, R.; Colvin, V.L. Water-soluble quantum dots for biomedical applications. Biochem. Biophys. Res. Commun. 2006, 348, 781–786. [Google Scholar] [CrossRef]
- Son, D.I.; Kwon, B.W.; Park, D.H.; Seo, W.-S.; Yi, Y.; Angadi, B.; Lee, C.-L.; Choi, W.K. Emissive ZnO–graphene quantum dots for white-light-emitting diodes. Nat. Nanotechnol. 2012, 7, 465–471. [Google Scholar] [CrossRef]
- Lawrence, W.G.; Thacker, S.; Palamakumbura, S.; Riley, K.J.; Nagarkar, V.V. Quantum dot-organic polymer composite materials for radiation detection and imaging. IEEE Trans. Nucl. Sci. 2012, 59, 215–221. [Google Scholar] [CrossRef]
- Wu, T.; Sher, C.-W.; Lin, Y.; Lee, C.-F.; Liang, S.; Lu, Y.; Huang Chen, S.-W.; Guo, W.; Kuo, H.-C.; Chen, Z. Mini-LED and Micro-LED: Promising candidates for the next generation display technology. Appl. Sci. 2018, 8, 1557. [Google Scholar] [CrossRef]
- Nikolopoulos, D.; Valais, I.; Michail, C.; Bakas, A.; Fountzoula, C.; Cantzos, D.; Bhattacharyya, D.; Sianoudis, I.; Fountos, G.; Yannakopoulos, P.; et al. Radioluminescence properties of the CdSe/ZnS Quantum Dot nanocrystals with analysis of long-memory trends. Radiat. Meas. 2016, 92, 19–31. [Google Scholar] [CrossRef]
- Fiaczyk, K.; Zych, E. On peculiarities of Eu3+ and Eu2+ luminescence in Sr2GeO4 host. RSC Adv. 2016, 6, 91836. [Google Scholar] [CrossRef]
- Zeler, J.; Cybinska, J.; Zych, E. A new photoluminescent feature in LuPO4: Eu thermoluminescent sintered materials. RSC Adv. 2016, 6, 57920. [Google Scholar] [CrossRef]
- Public Health England. Cadmium: Health Effects, Incident Management and Toxicology. Information on Cadmium, for Responding to Chemical Incidents. Published 1 July 2014, Last updated 25 October 2016. Available online: https://www.gov.uk/government/publications/cadmium-properties-incident-management-and-toxicology (accessed on 10 April 2019).
- Valais, I.; Kandarakis, I.; Nikolopoulos, D.; Michail, C.; David, S.; Loudos, G.; Cavouras, D.; Panayiotakis, G. Luminescence properties of (Lu,Y)2SiO5:Ce and Gd2SiO5:Ce single crystal scintillators under X-ray excitation for use in medical imaging systems. IEEE Trans. Nucl. Sci. 2007, 54, 11–18. [Google Scholar] [CrossRef]
- Michail, C.; Fountos, G.; Liaparinos, P.; Kalyvas, N.; Valais, I.; Kandarakis, I.; Panayiotakis, G. Light emission efficiency and imaging performance of Gd2O2S:Eu powder scintillator under X-ray Radiography conditions. Med. Phys. 2010, 37, 3694–3703. [Google Scholar] [CrossRef] [PubMed]
- Valais, I.; Michail, C.; David, S.; Liaparinos, P.; Fountos, G.; Paschalis, T.; Kandarakis, I.; Panayiotakis, G. Comparative Investigation of Ce3+ doped Scintillators in a wide Range of Photon Energies covering X-ray CT, Nuclear Medicine and Megavoltage Radiation Therapy Portal Imaging applications. IEEE Trans. Nucl. Sci. 2010, 57, 3–7. [Google Scholar] [CrossRef]
- Michail, C.; Karpetas, G.; Kalyvas, N.; Valais, I.; Kandarakis, I.; Agavanakis, K.; Panayiotakis, G.; Fountos, G. Information Capacity of Positron Emission Tomography Scanners. Crystals 2018, 8, 459. [Google Scholar] [CrossRef]
- Michail, C.; Valais, I.; Fountos, G.; Bakas, A.; Fountzoula, C.; Kalyvas, N.; Karabotsos, A.; Sianoudis, I.; Kandarakis, I. Luminescence Efficiency of Calcium Tungstate (CaWO4) under X-ray radiation: Comparison with Gd2O2S:Tb. Measurement 2018, 120, 213–220. [Google Scholar] [CrossRef]
- Dong, X.; Xu, J.; Shi, S.; Zhang, X.; Li, L.; Yin, S. Electroluminescence from ZnCuInS/ZnS quantum dots/poly(9-vinylcarbazole) multilayer films with different thicknesses of quantum dot layer. J. Phys. Chem. Solids 2017, 104, 133–138. [Google Scholar] [CrossRef]
- Seferis, I.E.; Zeler, J.; Michail, C.; Valais, I.; Fountos, G.; Kalyvas, N.; Bakas, A.; Kandarakis, I.; Zych, E. On the response of semitransparent nanoparticulated films of LuPO4:Eu in poly-energetic X-ray imaging applications. Appl. Phys. A 2016, 122, 526. [Google Scholar] [CrossRef][Green Version]
- Seferis, I.E.; Zeler, J.; Michail, C.; David, S.; Valais, I.; Fountos, G.; Kalyvas, N.; Bakas, A.; Kandarakis, I.; Zych, E.; et al. Grains size and shape dependence of luminescence efficiency of Lu2O3:Eu thin screens. Results Phys. 2017, 7, 980–981. [Google Scholar] [CrossRef]
- Seferis, I.E.; Michail, C.; Zeler, J.; Kalyvas, N.; Valais, I.; Fountos, G.; Bakas, A.; Kandarakis, I.; Zych, E.; Panayiotakis, G.S. Detective quantum efficiency (DQE) of high X-ray absorption Lu2O3:Eu thin screens: The role of shape and size of nano- and micro-grains. Appl. Phys. A 2018, 124. [Google Scholar] [CrossRef]
- Allcock, H.R.; Bender, J.D.; Chang, Y.; McKenzie, M.; Fone, M.M. Controlled Refractive Index Polymers: Polyphosphazenes with Chlorinated- and Fluorinated-, Aryloxy- and Alkoxy- Side-Groups. Chem. Mater. 2003, 15, 473–477. [Google Scholar] [CrossRef]
- Balamurugan, A.; Kannan, S.; Selvaraj, V.; Rajeswari, S. Development and Spectral Characterization of Poly (Methyl Methacrylate)/Hydroxyapatite Composite for Biomedical Applications. Trends Biomater. Artif. Organs 2004, 18, 41–45. [Google Scholar]
- Valais, I.; Michail, C.; Fountzoula, C.; Tseles, D.; Yannakopoulos, P.; Nikolopoulos, D.; Bakas, A.; Fountos, G.; Saatsakis, G.; Sianoudis, I.; et al. On the response of alloyed ZnCdSeS quantum dot films. Results Phys. 2017, 7, 1734–1736. [Google Scholar] [CrossRef]
- Thomson, L.A.; Law, F.C.; James, K.H.; Matthew, C.A.; Rushton, N. Biocompatibility of particulate polymethylmethacrylate bone cements: A comparative study in vitro and in vivo. Biomaterials 1992, 13, 811–818. [Google Scholar] [CrossRef]
- Hollick, E.J.; Spalton, D.J.; Ursell, P.G.; Pande, M.V.; Barman, S.A.; Boyce, J.F.; Tilling, K. The effect of polymethylmethacrylate, silicone, and polyacrylic intraocular lenses on posterior capsular opacification 3 years after cataract surgery. Ophthalmology 1999, 106, 49–55. [Google Scholar] [CrossRef]
- Gautam, R.; Singh, R.D.; Sharma, V.P.; Siddhartha, R.; Chand, P.; Kumar, R. Biocompatibility of polymethylmethacrylate resins used in dentistry. J. Biomed. Mater. Res. Part B Appl. Biomater. 2012, 100B, 1444–1450. [Google Scholar] [CrossRef]
- Huettig, F.; Prutscher, A.; Goldammer, C.; Kreutzer, C.A.; Weber, H. First clinical experiences with CAD/CAM-fabricated PMMA-based fixed dental prostheses as long-term temporaries. Clin. Oral Investig. 2016, 20, 161–168. [Google Scholar] [CrossRef]
- Kong, L.B.; Huang, Y.Z.; Que, W.X.; Zhang, T.S.; Li, S.; Zhang, J.; Dong, Z.L.; Tang, D.Y. Transparent Ceramics (Topics in Mining, Metallurgy and Materials Engineering); Springer International Publishing: Cham, Switzerland, 2015; ISBN 978-3-319-18955-0. [Google Scholar]
- Clapp, A.R.; Medintz, I.L.; Mattoussi, H. Förster resonance energy transfer investigations using quantum-dot fluorophores. ChemPhysChem 2006, 7, 47–57. [Google Scholar] [CrossRef]
- Litvin, A.P.; Ushakova, E.V.; Parfenov, P.S.; Cherevkov, S.A.; Fedorov, A.V.; Baranov, A.V. Förster resonant energy transfer in lead sulfide QD assemblies. In Proceedings of the SPIE Photonics Europe, Brussels, Belgium, 14–17 April 2014; Volume 9126, p. 912626. [Google Scholar]
- Roncali, J.; Garnier, F. Photon-transport properties of luminescent solar concentrators: Analysis and optimization. Appl. Opt. 1984, 23, 2809–2817. [Google Scholar] [CrossRef]
- Krumer, Z.; Pera, S.J.; van Dijk-Moes, R.J.A.; Zhao, Y.; de Brouwer, A.F.P.; Groeneveld, E.; van Sark, W.G.J.H.M.; Schropp, R.E.I.; de Mello Donegá, C. Tackling self-absorption in luminescent solar concentrators with type-II colloidal quantum dots. Sol. Energy Mater. Sol. Cells 2013, 111, 57–65. [Google Scholar] [CrossRef]
- Krumer, Z.; van Sark, W.G.J.H.M.; Schropp, R.E.I.; de Mello Donegá, C. Compensation of self-absorption losses in luminescent solar concentrators by increasing luminophore concentration. Sol. Energy Mater. Sol. Cells 2017, 167, 133–139. [Google Scholar] [CrossRef]
- Kumar, V.B.; Sahu, A.K.; Mohsin, A.S.M.; Li, X.; Gedanken, A. Refractive-Index Tuning of Highly Fluorescent Carbon Dots. ACS Appl. Mater. Interf. 2017, 9, 28930–28938. [Google Scholar] [CrossRef] [PubMed]
- Chen, J.; Chen, X.; Xu, R.; Zhu, Y.; Shi, Y.; Zhu, X. Refractive index of aqueous solution of CdTe quantum dots. Opt. Commun. 2008, 281, 3578–3580. [Google Scholar] [CrossRef]
- Giepmans, B.N.G.; Deerinck, T.J.; Smarr, B.L.; Jones, Y.Z.; Ellisman, M.H. Correlated light and electron microscopic imaging of multiple endogenous proteins using Quantum dots. Nat. Methods 2005, 2, 743–749. [Google Scholar] [CrossRef] [PubMed]
- Luo, T.; Huang, P.; Gao, G.; Shen, G.; Fu, S.; Cui, D.; Zhou, C.; Ren, Q. Mesoporous silica-coated gold nanorods with embedded indocyanine green for dual mode X-ray CT and NIR fluorescence imaging. Opt. Express 2011, 19, 17030–17039. [Google Scholar] [CrossRef] [PubMed]
- Michalet, X. Quantum Dots for Live Cells, in Vivo Imaging, and Diagnostics. Science 2005, 307, 538–544. [Google Scholar] [CrossRef] [PubMed]
- Martín-García, B.; Paulo, P.M.R.; Costa, S.M.B.; Velázquez, M.M. Photoluminescence dynamics of CdSe QD/Polymer langmuir–blodgett thin films: morphology effects. J. Phys. Chem. C 2013, 117, 14787–14795. [Google Scholar] [CrossRef]
- Alejo, T.; Paulo, P.M.R.; Merchán, M.D.; Garcia-Fernandez, E.; Costa, S.M.B.; Velázquez, M.M. Influence of 3D aggregation on the photoluminescence dynamics of CdSe quantum dot films. J. Lumin. 2017, 183, 113–120. [Google Scholar] [CrossRef]
- Liu, J.; Yang, X.; Wang, K.; He, X.; Wang, Q.; Huang, J.; Liu, Y. Aggregation control of quantum dots through ion-mediated hydrogen bonding shielding. ACS Nano 2012, 6, 4973–4983. [Google Scholar] [CrossRef] [PubMed]
- Matvienko, O.O.; Savin, Y.N.; Kryzhanovska, A.S.; Vovk, O.M.; Dobrotvorska, M.V.; Pogorelova, N.V.; Vashchenko, V.V. Dispersion and aggregation of quantum dots in polymer–inorganic hybrid films. Thin Solid Films 2013, 537, 226–230. [Google Scholar] [CrossRef]
- Gondoni, P.; Ghidelli, M.; Di Fonzo, F.; Russo, V.; Bruno, P.; Martí-Rujas, J.; Bottani, C.E.; Li Bassi, A.; Casari, C.S. Structural and functional properties of Al:ZnO thin films grown by Pulsed Laser Deposition at room temperature. Thin Solid Films 2012, 520, 4707–4711. [Google Scholar] [CrossRef]
- Gondoni, P.; Ghidelli, M.; Di Fonzo, F.; Carminati, M.; Russo, V.; Li Bassi, A.; Casari, C.S. Structure-dependent optical and electrical transport properties of nanostructured Al-doped ZnO. Nanotechnology 2012, 23, 365706. [Google Scholar] [CrossRef] [PubMed]
- Perret, N.; Morris, D.; Franchomme-Fossé, L.; Côté, R.; Fafard, S.; Aimez, V.; Beauvais, J. Origin of the inhomogenous broadening and alloy intermixing in InAs/GaAs self-assembled quantum dots. Phys. Rev. B 2000, 62, 5092–5099. [Google Scholar] [CrossRef]
- Ngo, C.Y.; Yoon, S.F.; Fan, W.J.; Chua, S.J. Effects of size and shape on electronic states of quantum dots. Phys. Rev. B 2006, 74, 245331. [Google Scholar] [CrossRef]
- Xie, H.; Prioli, R.; Torelly, G.; Liu, H.; Fischer, A.M.; Jakomin, R.; Mourão, R.; Kawabata, R.; Pires, M.P.; Souza, P.L.; et al. Correlation between size distribution and luminescence properties of spool-shaped InAs quantum dots. Semicond. Sci. Technol. 2017, 32, 055013. [Google Scholar] [CrossRef]


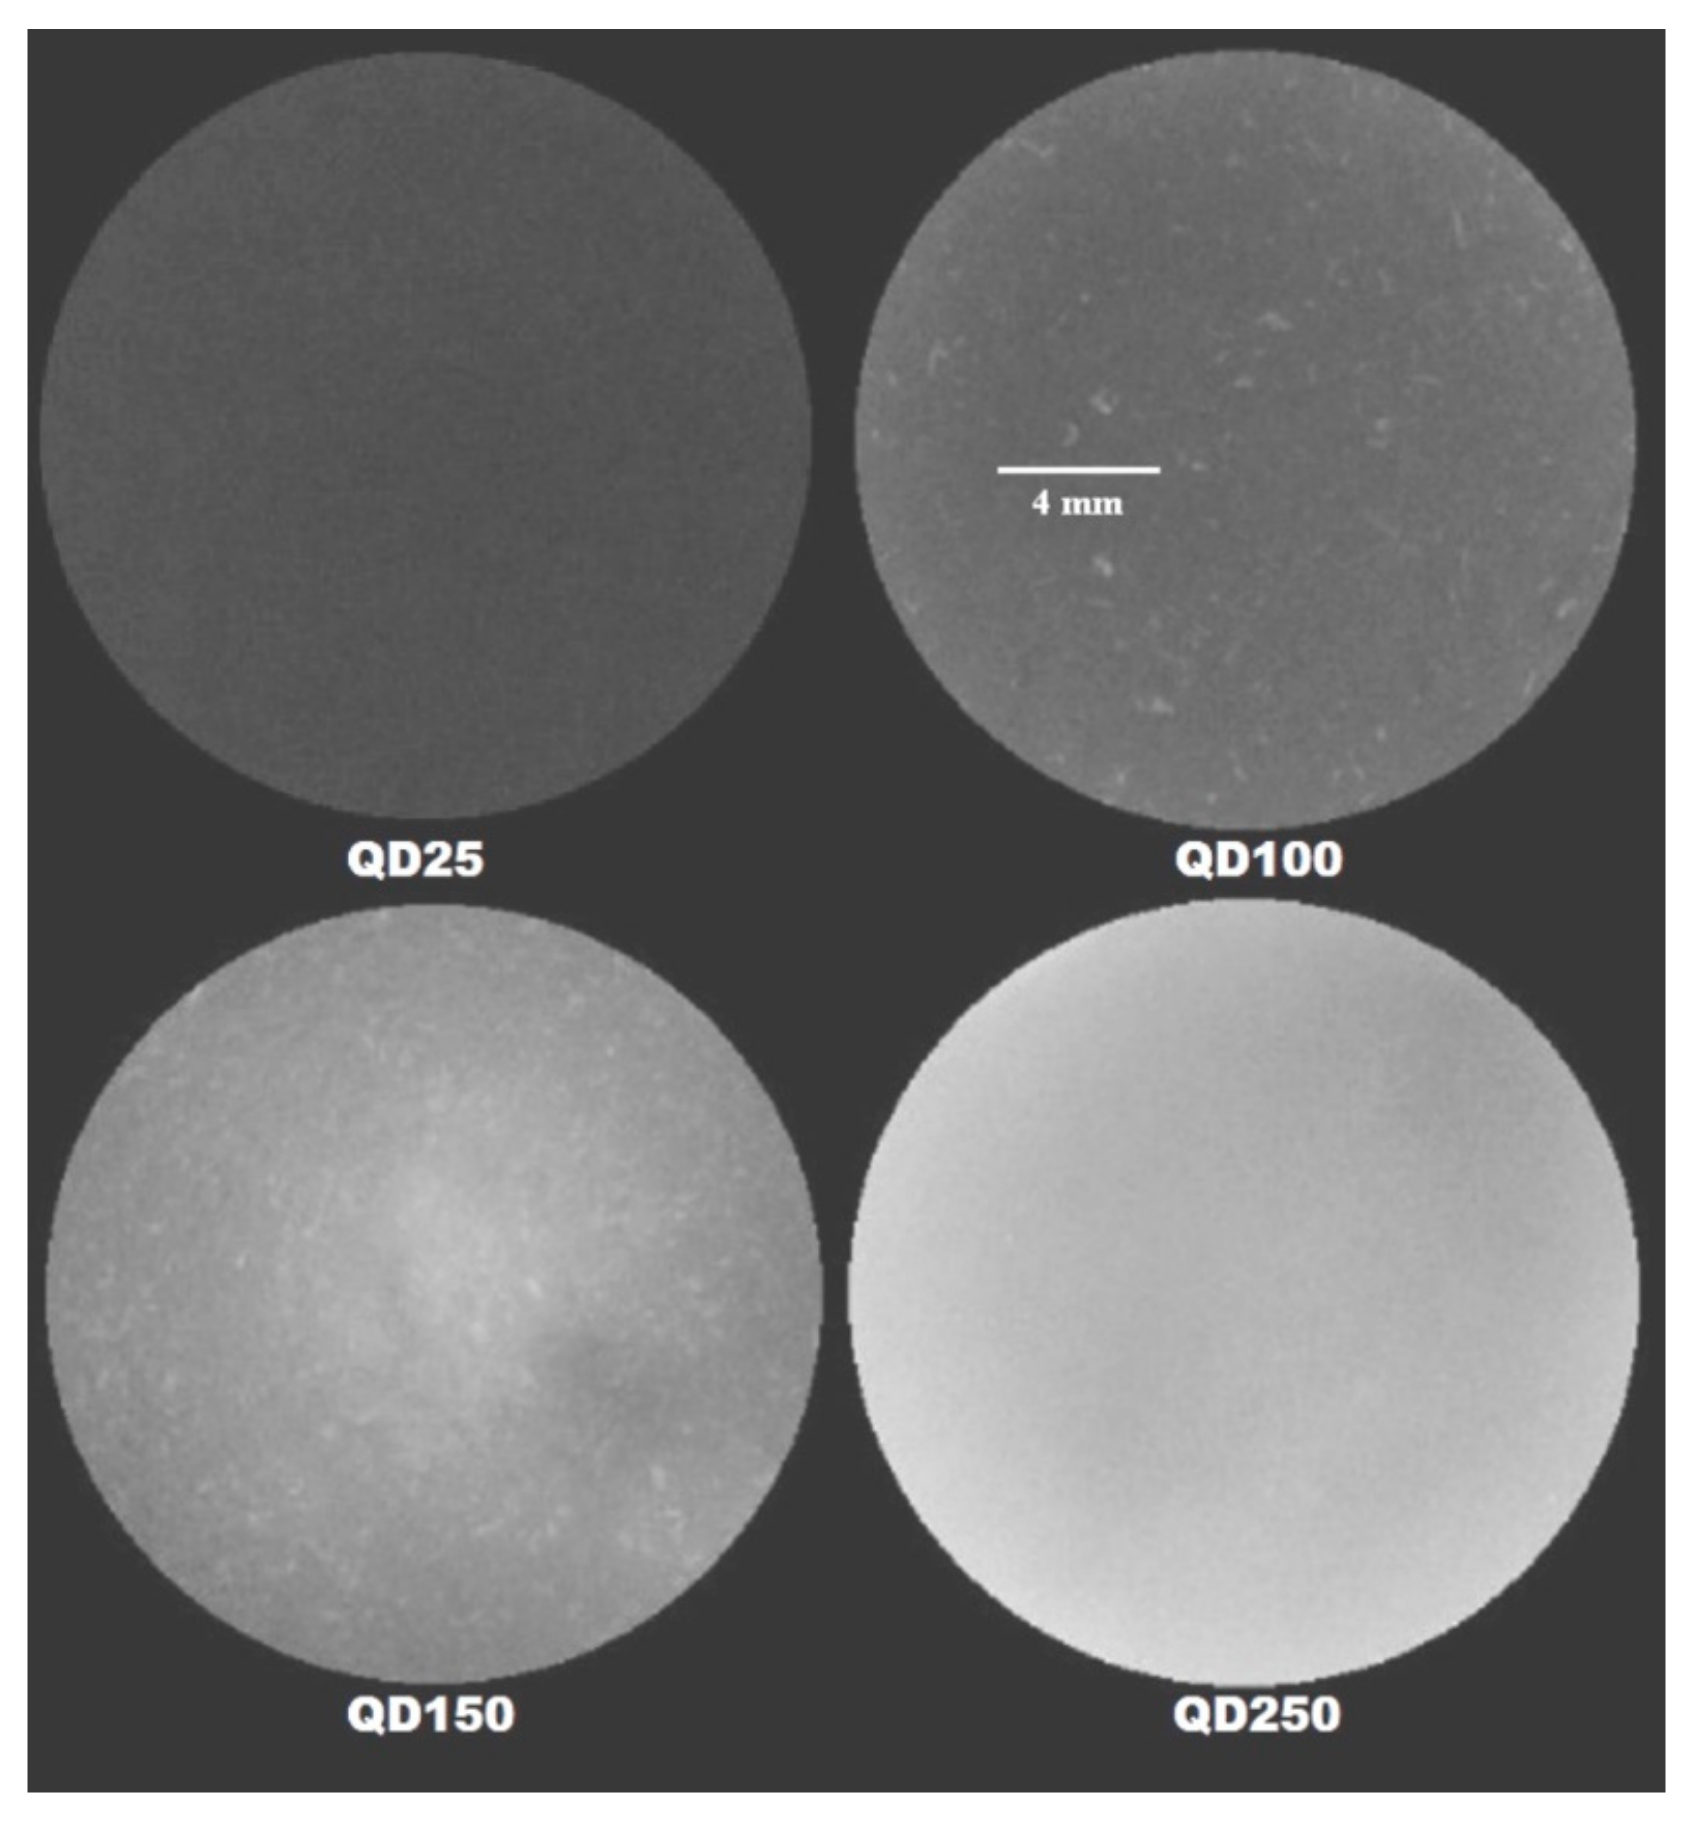
| Ref. | mg QD/mL Toluene | %w/v in QD * |
|---|---|---|
| QD25 | 25 | 1.0 |
| QD100 | 100 | 4.0 |
| QD150 | 150 | 6.0 |
| QD250 | 250 | 10.0 |
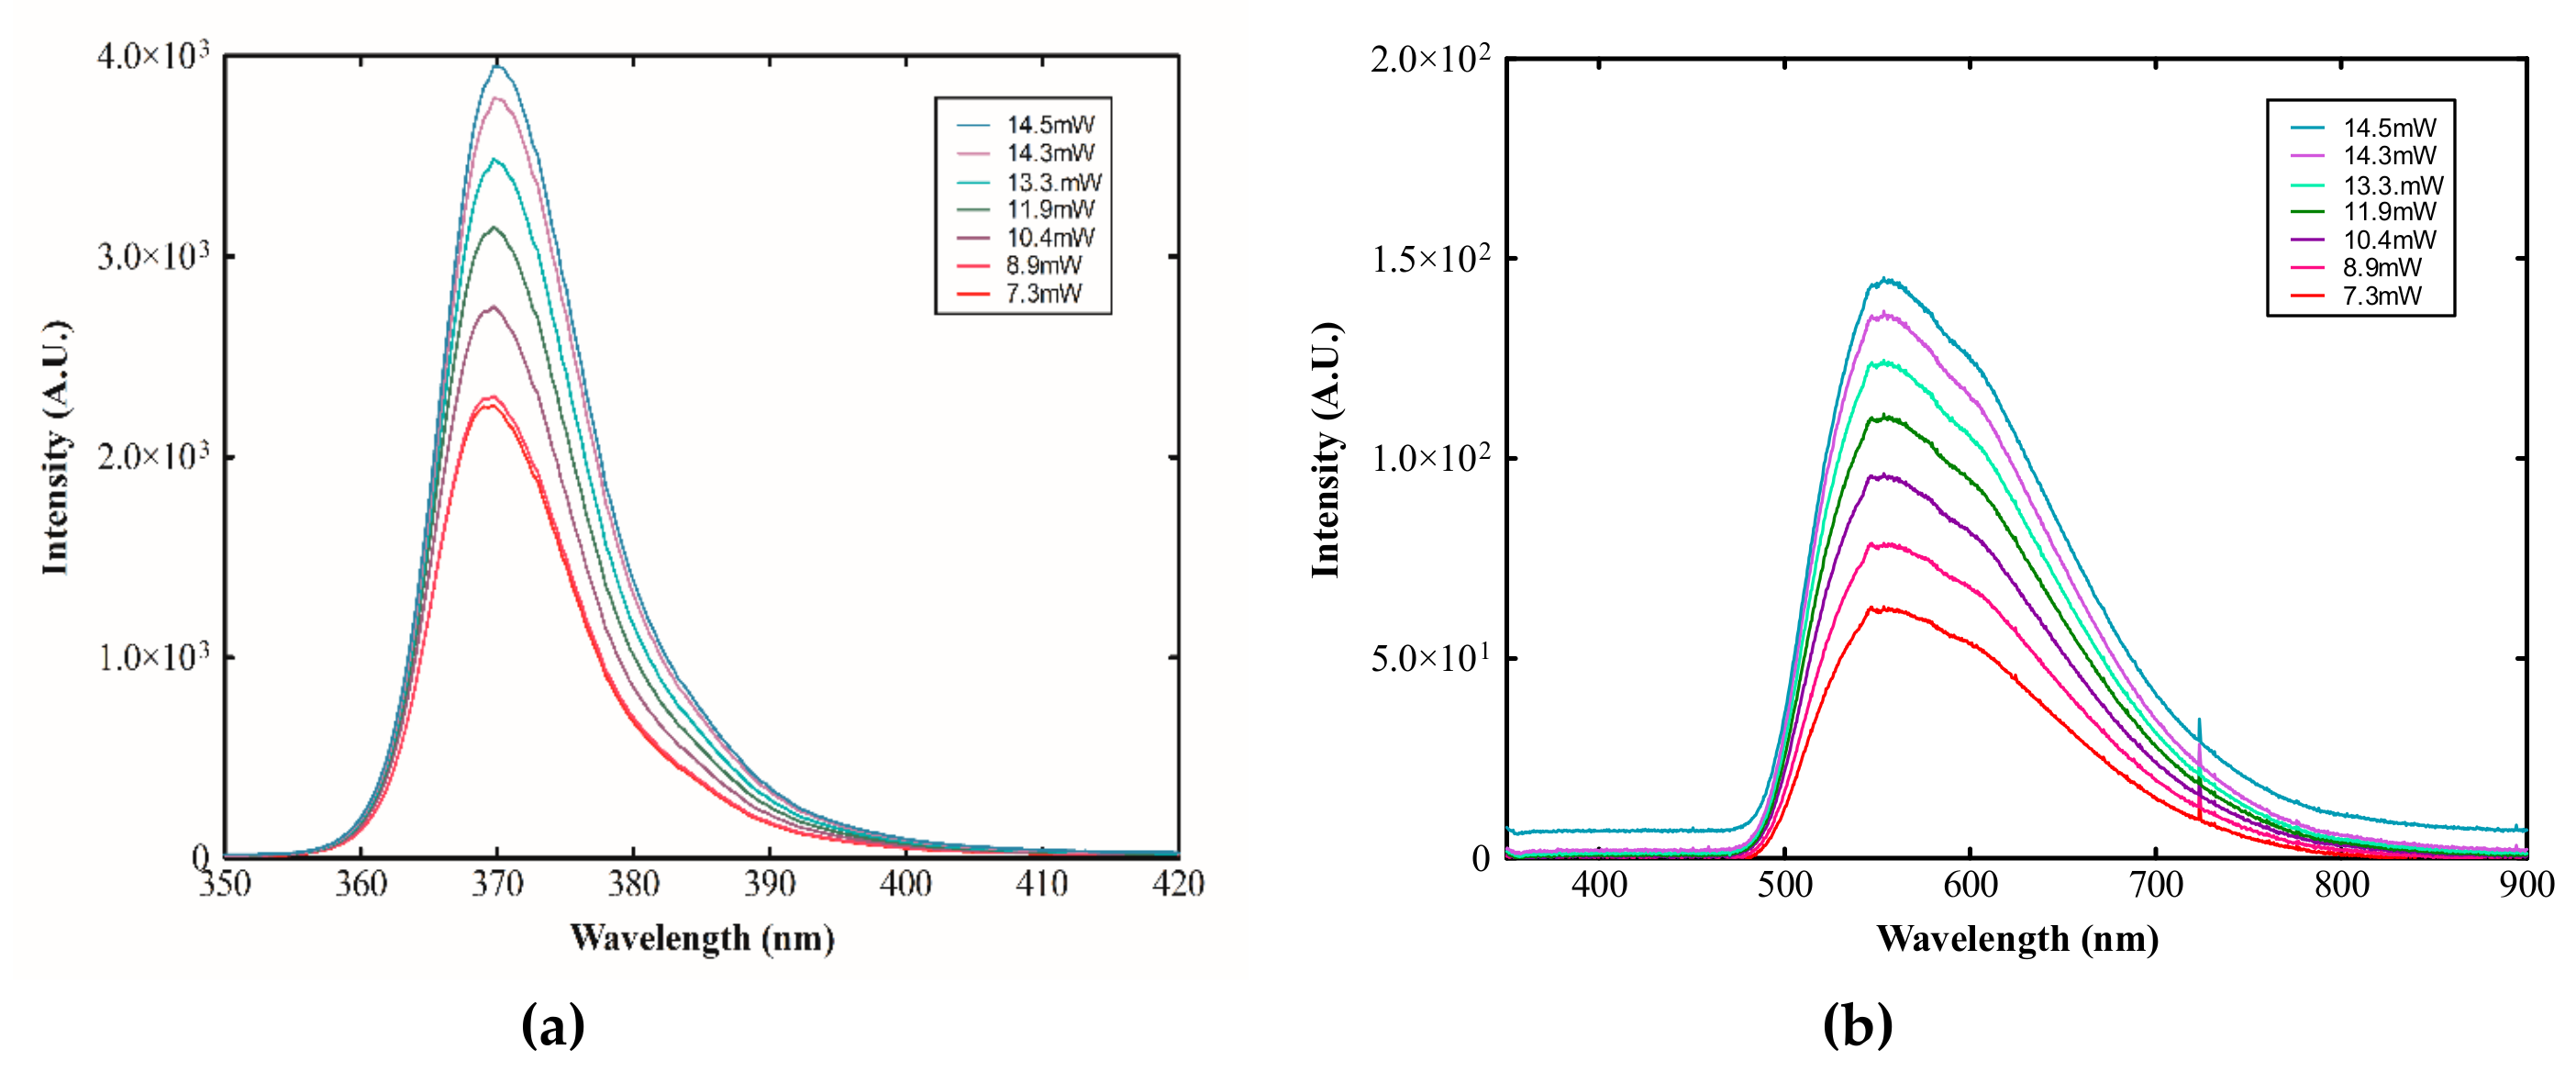
| Power Steps | Output (mW) |
|---|---|
| 1 | 7.3 |
| 2 | 8.9 |
| 3 | 10.4 |
| 4 | 11.9 |
| 5 | 13.3 |
| 6 | 14.3 |
| 7 | 14.5 |
| Concentration | Mean | SD | Min. | Max. | CV |
|---|---|---|---|---|---|
| 25 mg | 226.518 | 3.578 | 211.5 | 241.404 | 0.015796 |
| 100 mg | 203.964 | 5.365 | 161.334 | 220.509 | 0.026304 |
| 150 mg | 153.34 | 12.504 | 108.301 | 186.088 | 0.081544 |
| 250 mg | 131.948 | 6.328 | 100.062 | 136.14 | 0.047958 |
| R2 | Slope |
|---|---|
| 0.9804 | 0.6530 ± 0.04126 |
| 0.9983 | 10.39 ± 0.1892 |
| 0.9970 | 28.64 ± 0.6978 |
| 0.9978 | 29.45 ± 0.6175 |
© 2019 by the authors. Licensee MDPI, Basel, Switzerland. This article is an open access article distributed under the terms and conditions of the Creative Commons Attribution (CC BY) license (http://creativecommons.org/licenses/by/4.0/).
Share and Cite
Saatsakis, G.; Michail, C.; Fountzoula, C.; Kalyvas, N.; Bakas, A.; Ninos, K.; Fountos, G.; Sianoudis, I.; Kandarakis, I.; Panayiotakis, G.S.; et al. Fabrication and Luminescent Properties of Zn–Cu–In–S/ZnS Quantum Dot Films under UV Excitation. Appl. Sci. 2019, 9, 2367. https://doi.org/10.3390/app9112367
Saatsakis G, Michail C, Fountzoula C, Kalyvas N, Bakas A, Ninos K, Fountos G, Sianoudis I, Kandarakis I, Panayiotakis GS, et al. Fabrication and Luminescent Properties of Zn–Cu–In–S/ZnS Quantum Dot Films under UV Excitation. Applied Sciences. 2019; 9(11):2367. https://doi.org/10.3390/app9112367
Chicago/Turabian StyleSaatsakis, G., C. Michail, C. Fountzoula, N. Kalyvas, A. Bakas, K. Ninos, G. Fountos, I. Sianoudis, I. Kandarakis, G.S. Panayiotakis, and et al. 2019. "Fabrication and Luminescent Properties of Zn–Cu–In–S/ZnS Quantum Dot Films under UV Excitation" Applied Sciences 9, no. 11: 2367. https://doi.org/10.3390/app9112367
APA StyleSaatsakis, G., Michail, C., Fountzoula, C., Kalyvas, N., Bakas, A., Ninos, K., Fountos, G., Sianoudis, I., Kandarakis, I., Panayiotakis, G. S., & Valais, I. (2019). Fabrication and Luminescent Properties of Zn–Cu–In–S/ZnS Quantum Dot Films under UV Excitation. Applied Sciences, 9(11), 2367. https://doi.org/10.3390/app9112367