The Influence of Clay Content on Cave-ins in Tank Model Tests and Monitoring Indicators of Sinkhole Formation

Abstract
1. Introduction
2. Materials and Methods
2.1. Materials
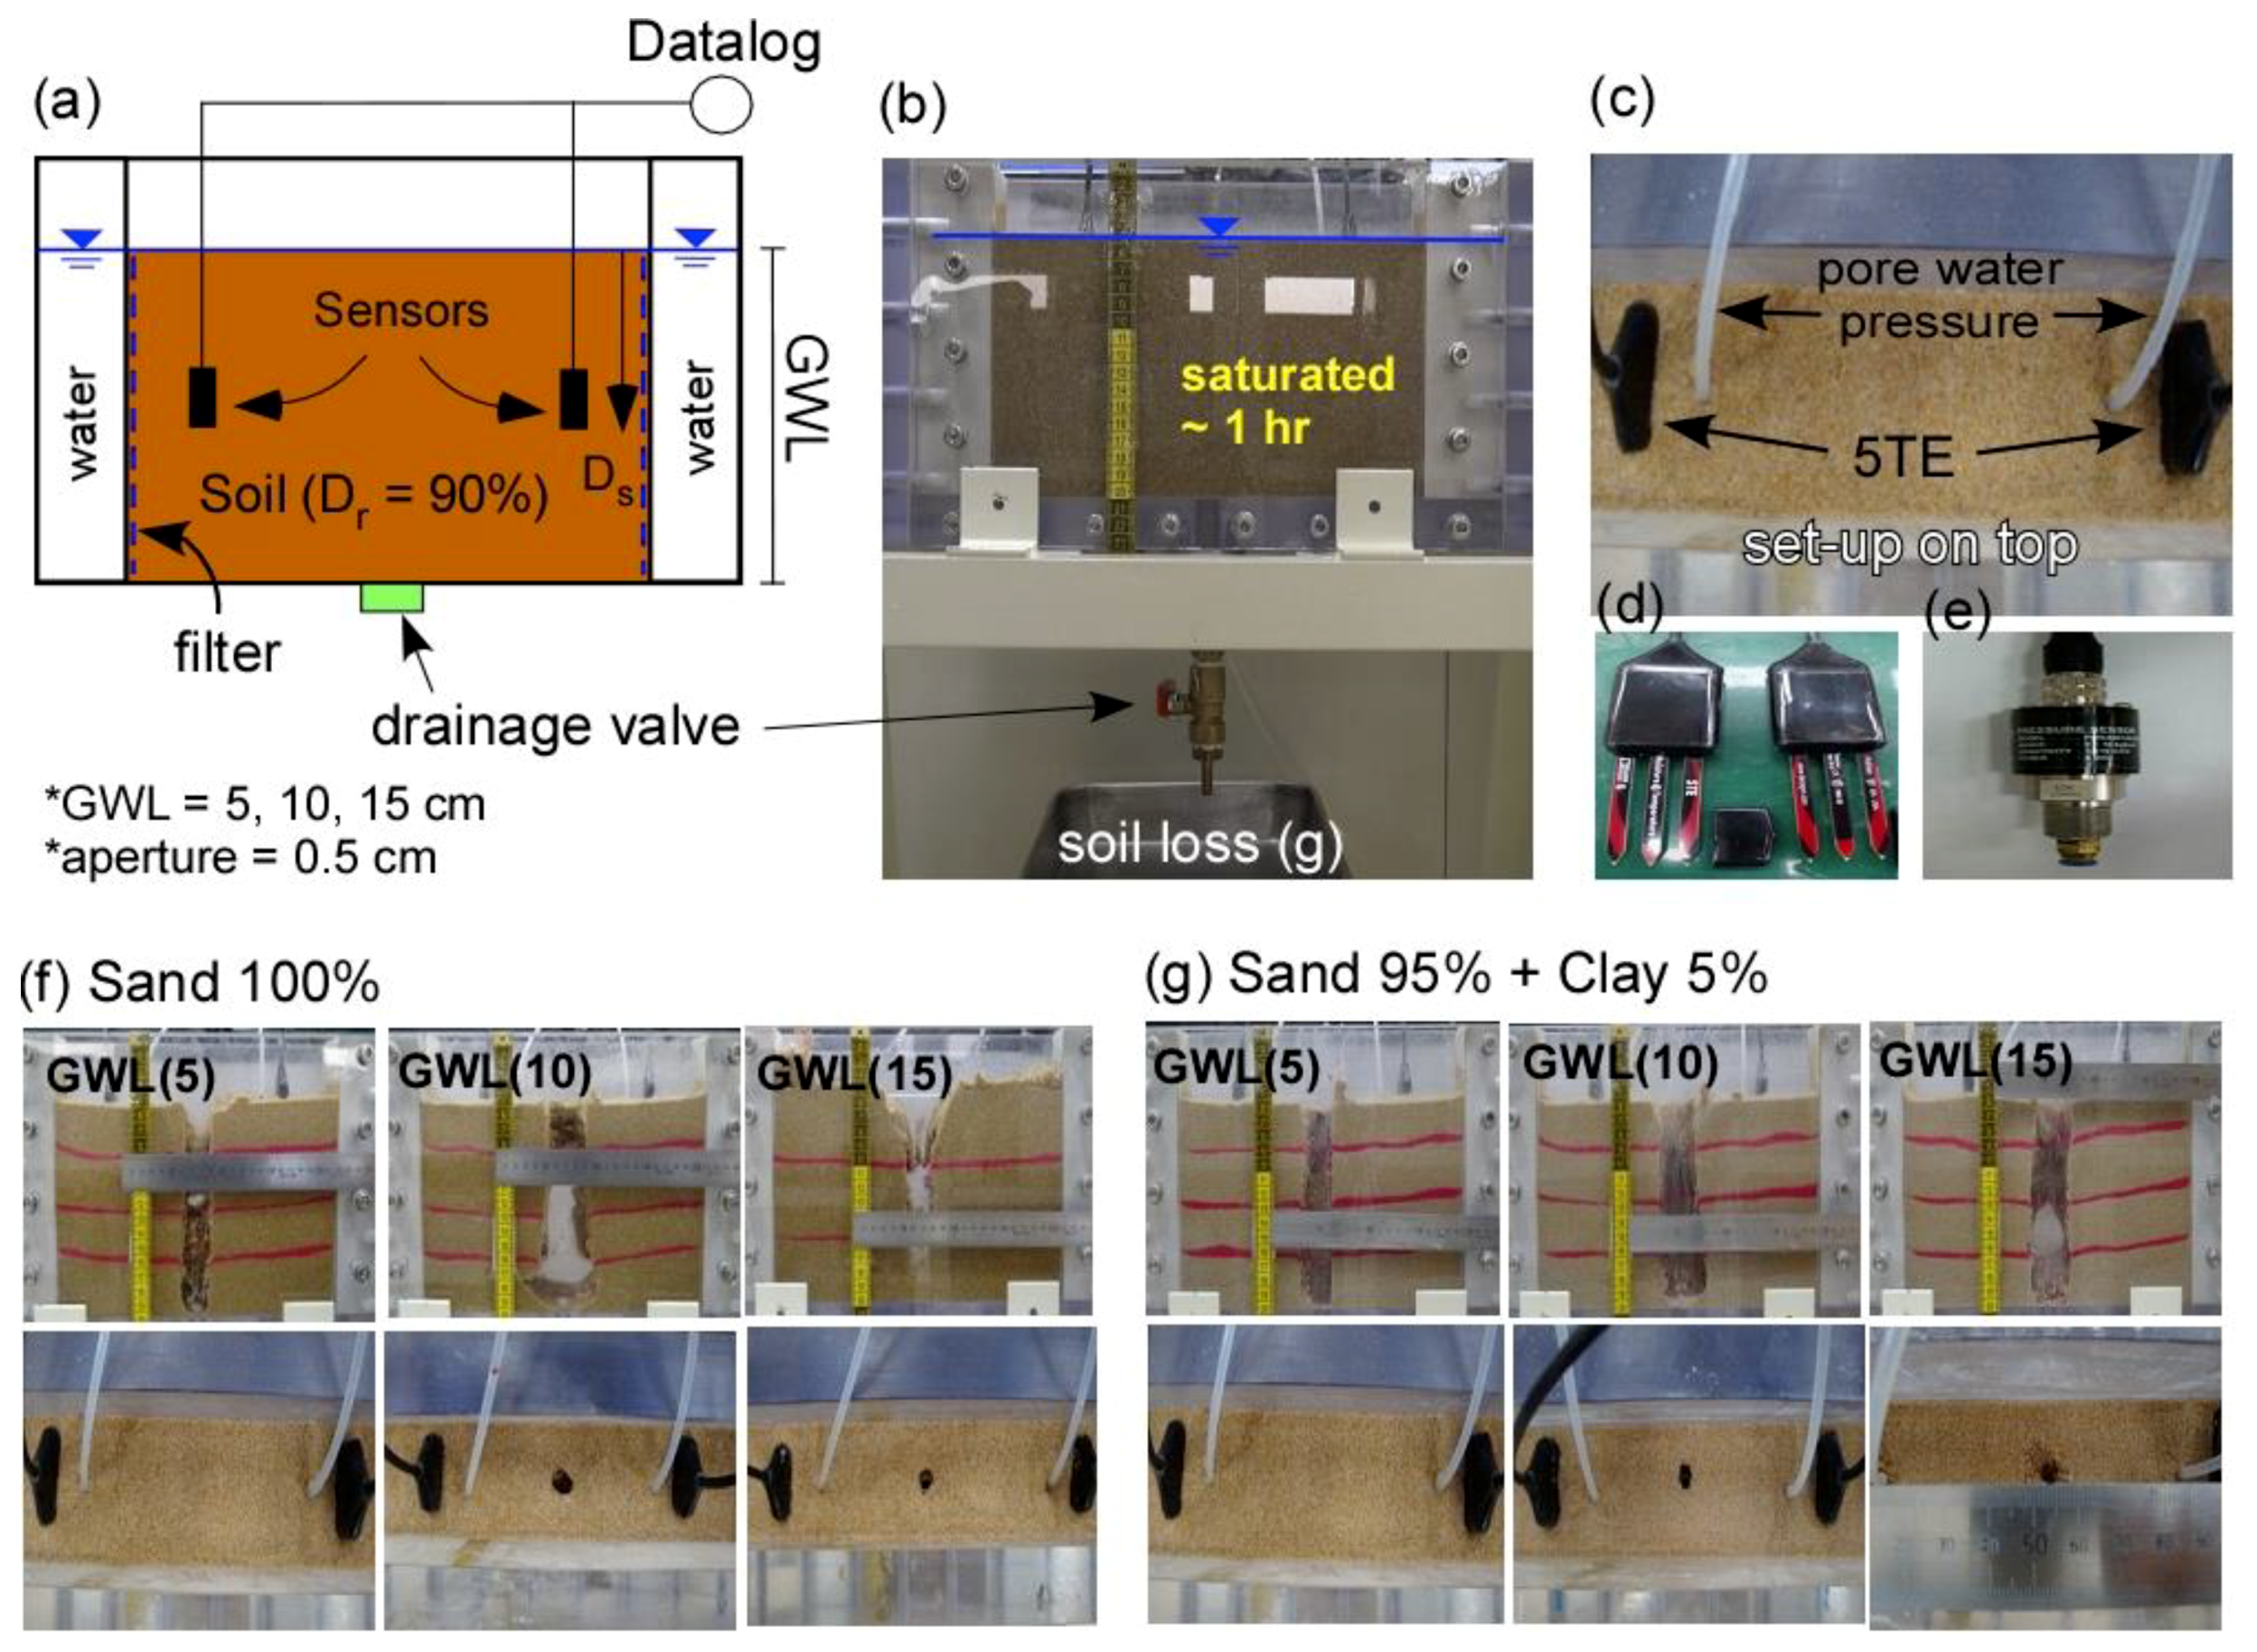
2.2. Methods
3. Results
3.1. Variations in Groundwater Level and Sinkhole Occurrence
3.2. Role of Clay Content in Sinkhole Risk
4. Conclusions
- (1)
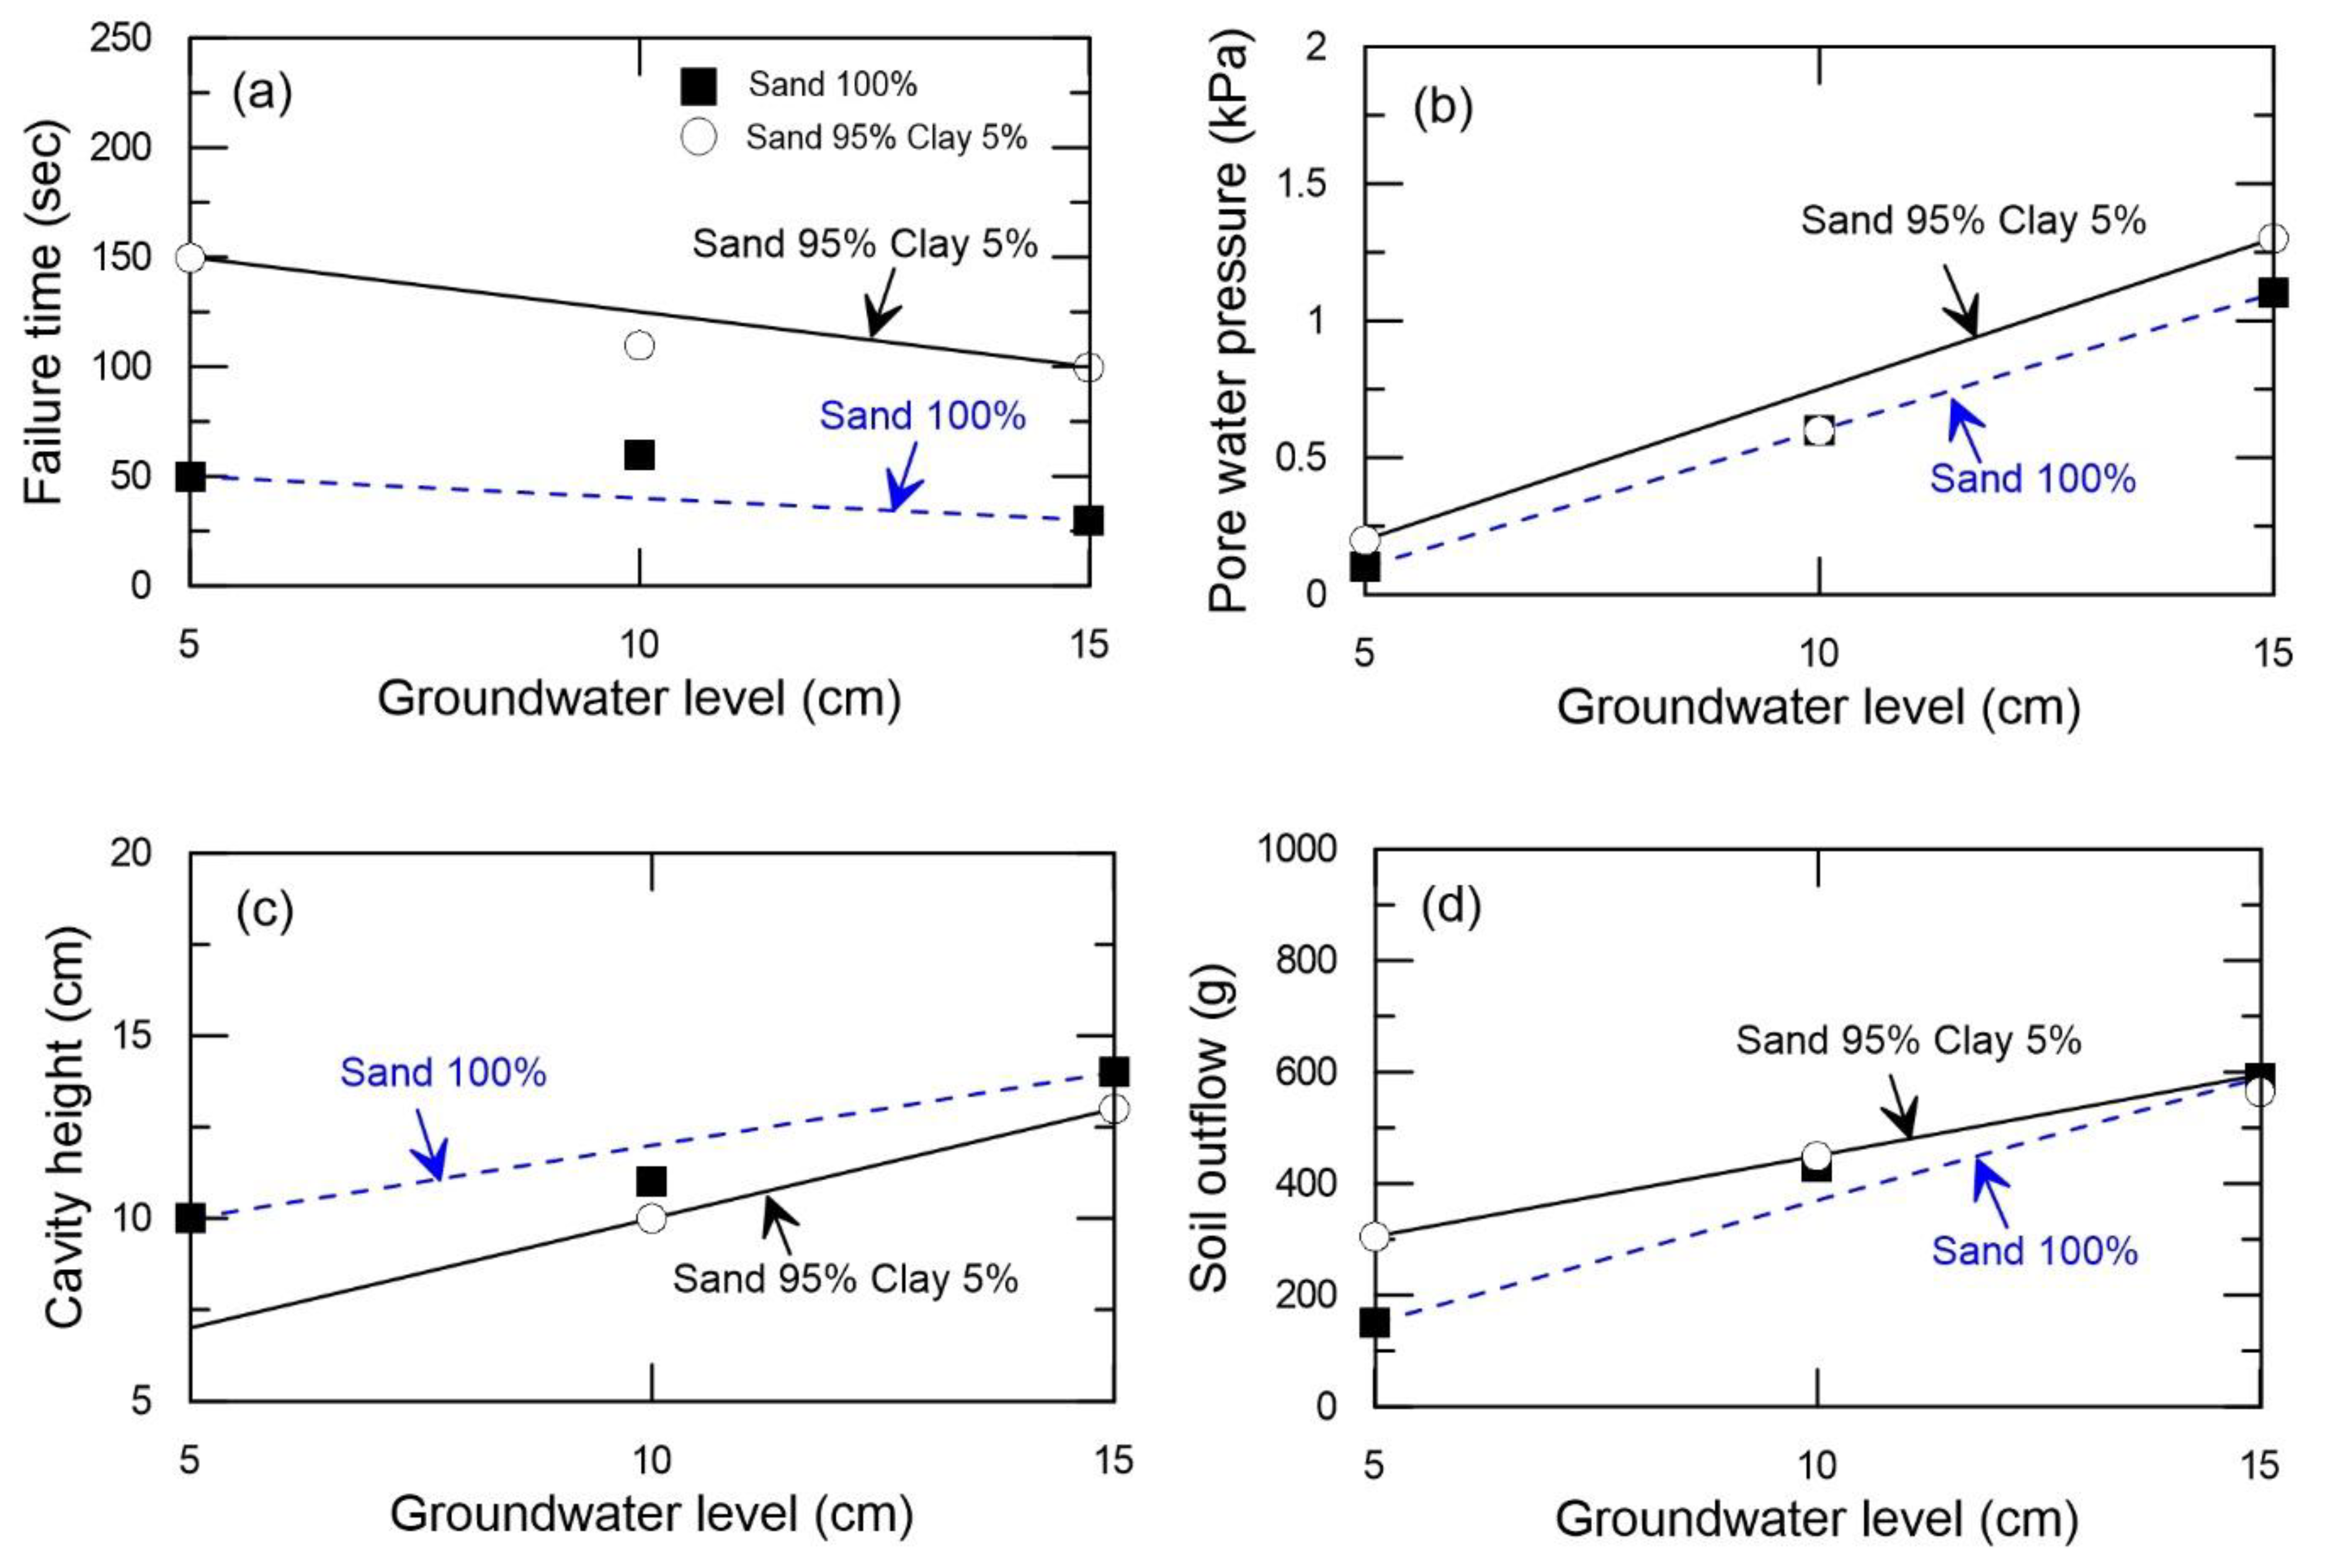
- Soil compaction and water level are very important factors in the assessment of sinkhole risks. For the same soil density, the cavities in the sand-rich materials in the small tank model tests expanded and reached the surface more easily, because the sinkhole characteristics were strongly influenced by the groundwater level. The cavities expanded until they reached the groundwater level. All the cases tested showed sensitivity to variations in the groundwater level: the higher the groundwater level is, the higher the risk of a sinkhole, in terms of the speed of upward migration of the underground cavity, the size of the cavity and the influencing zones of the cavity, which include zones of ground loosening.
- (2)
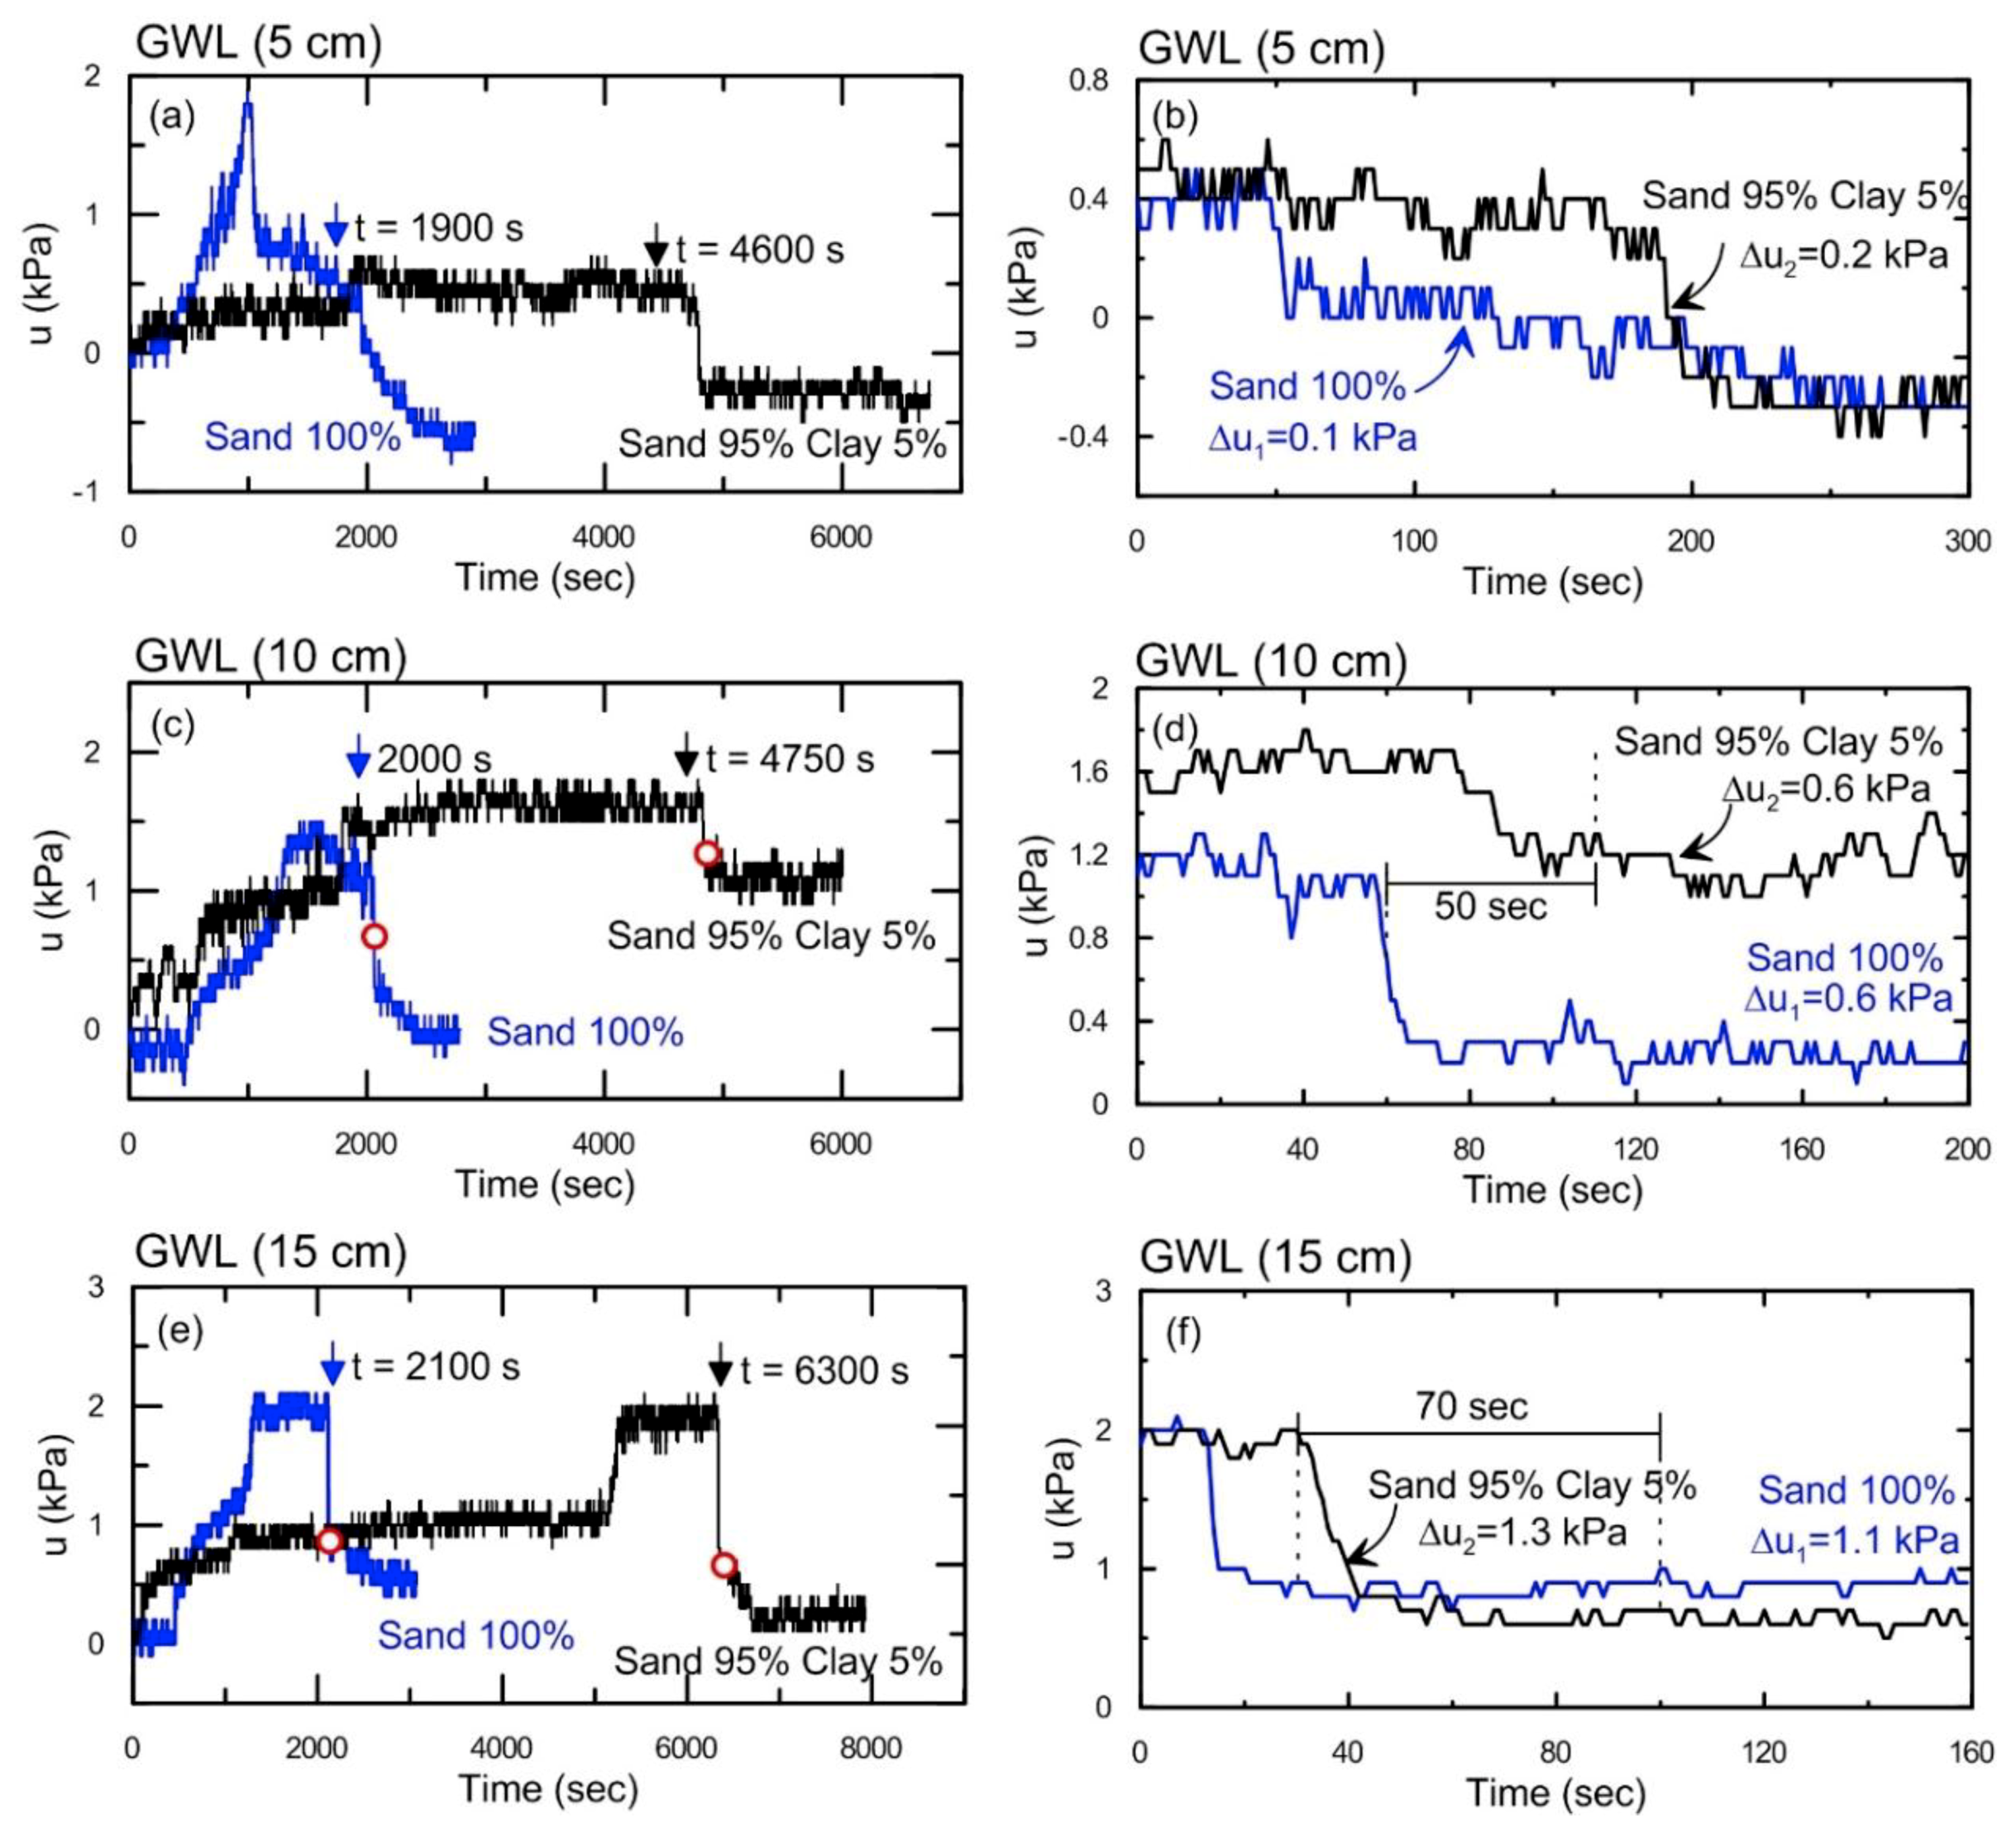
- Sand-rich materials exhibited a typical punching type of sinkhole failure and were vulnerable to changes in the groundwater level. The clay content in the sand-rich materials played a significant role in the sinkhole risk. A small clay content can delay sinkhole occurrence and decrease the size of the cover collapse sinkhole, even for only 5% clay content in sandy materials.
- (3)
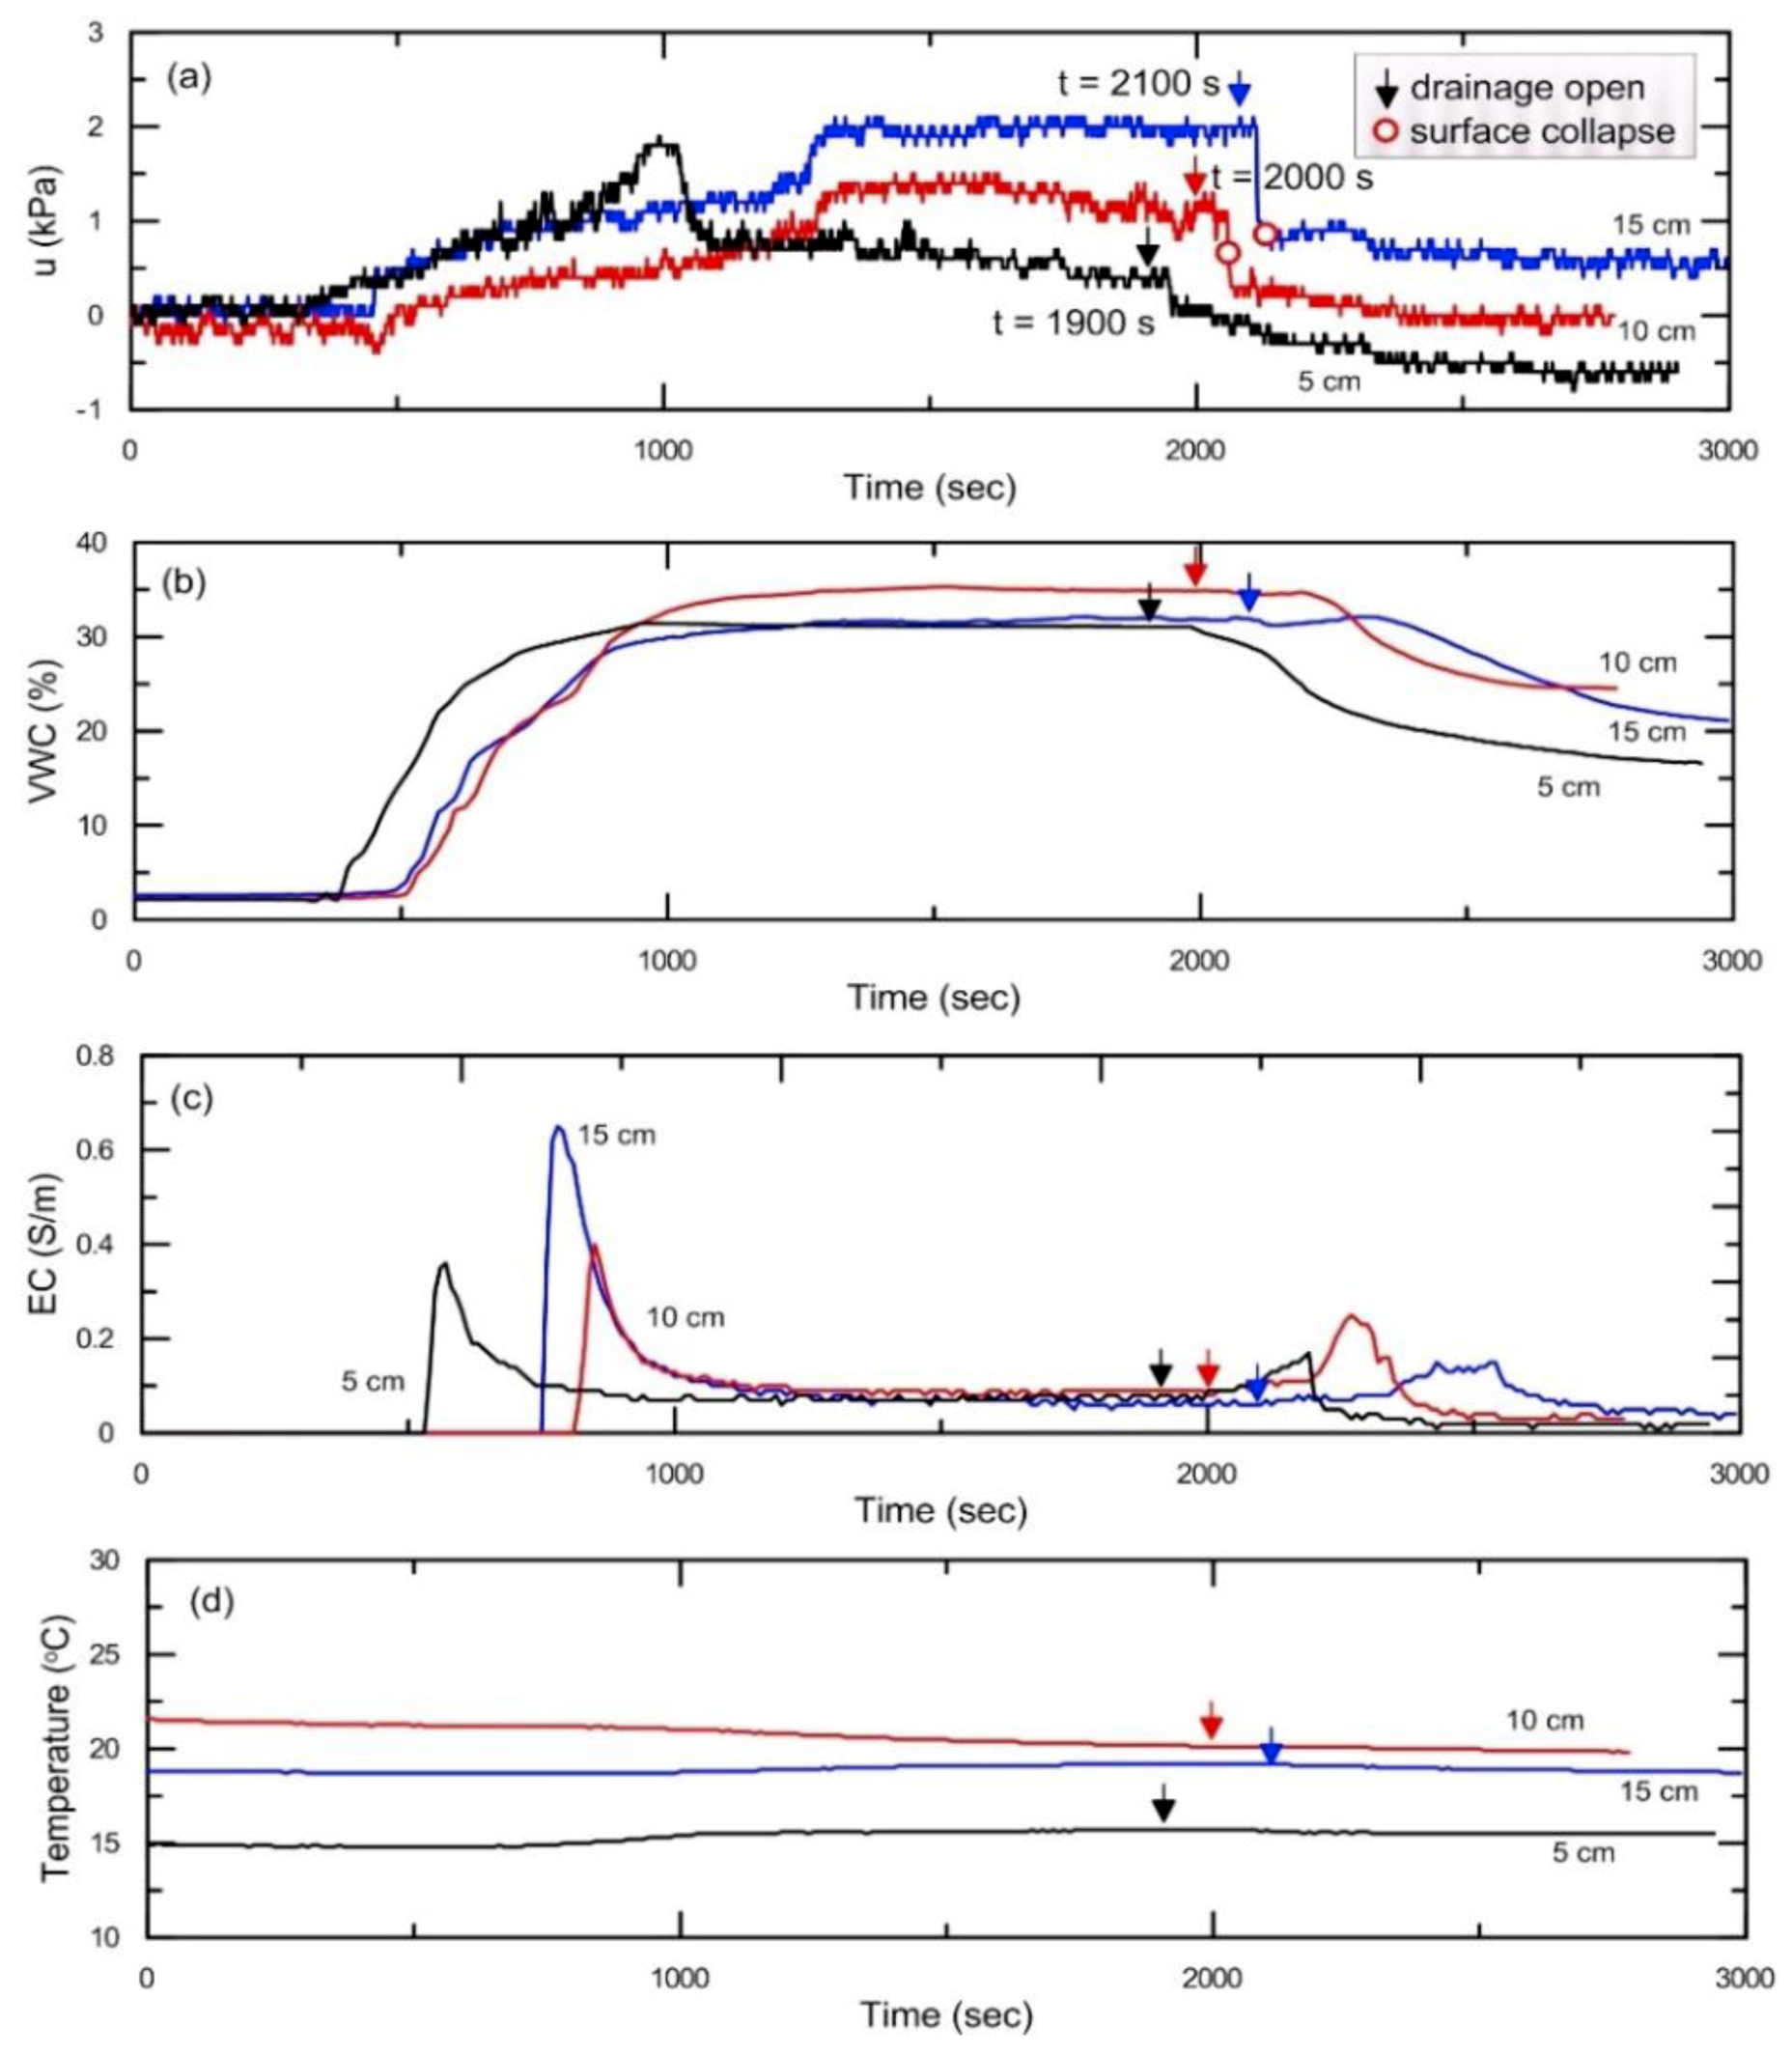
- In the sinkhole monitoring system, continuous measurements may be collected for pore water pressure below the groundwater level, and for suction stress above the groundwater level. Over long periods or during the development of a deep underground cavity, the volumetric water content, electrical conductivity and temperature can be used as secondary ground deformation indicators because they change slowly with deformation, but they do not necessarily indicate ground collapse.
Author Contributions
Funding
Acknowledgments
Conflicts of Interest
References
- Kuwano, R.; Sera, R.; Sato, M. Formation of subsurface cavity and loosening due to defeated old sewer pipe. Jpn. Geotech. J. 2010, 5, 219–229. [Google Scholar] [CrossRef][Green Version]
- Sato, M.; Kuwano, R. Influence of location of subsurface structures on development of underground cavities induced by internal erosion. Soils Found. 2015, 55, 829–840. [Google Scholar] [CrossRef]
- Waltham, T.; Bell, F.; Culshaw, M. Sinkhole and Subsidence: Karst and Cavernous Rocks in Engineering and Construction; Springer: Berlin, Germany, 2005; p. 384. [Google Scholar]
- Gutiérrez, F.; Parise, M.; De Waele, J.; Jourde, H. A review on natural and human-induced geohazards and impacts in karst. Earth Sci. Rev. 2014, 138, 61–88. [Google Scholar]
- Guarino, P.; Santo, A.; Forte, G.; De Falco, M.; Niceforo, M. Analysis of a database for anthropogenic sinkhole triggering and zonation in the Naples hinterland (southern Italy). Nat. Hazards 2017, 91, 173–192. [Google Scholar] [CrossRef]
- Scotto di Santolo, A.; Forte, G.; Santo, A. Analysis of sinkholes triggering mechanisms in the hinterland of Naples (southern Italy). Eng. Geol. 2018, 237, 42–52. [Google Scholar] [CrossRef]
- Sato, M.; Kuwano, R. Effects of buried structures on the formation of underground cavity. In Proceedings of the 18th International Conference on Soil Mechanics and Geotechnical Engineering, Paris, France, 2–6 September 2013; pp. 1769–1772. [Google Scholar]
- Castellazzi, P.; Arroyo-Domínguez, N.; Martel, R.; Calderhead, A.I.; Normand, J.C.L.; Gárfias, J.; Rivera, A. Land subsidence in major cities of Central Mexico: Interpreting InSAR-derived land subsidence mapping with hydrogeological data. Int. J. App. Earth Observ. Geoinform. 2016, 47, 102–111. [Google Scholar] [CrossRef]
- Fan, H.; Deng, K.; Ju, C.; Zhu, C.; Xue, J. Land subsidence monitoring by D-InSAR technique. Min. Sci. Tech. 2011, 21, 869–872. [Google Scholar] [CrossRef]
- Intrieri, E.; Gigli, G.; Nocentini, M.; Lombardi, L.; Mugnai, F.; Fidolini, F.; Casagli, N. Sinkhole monitoring and early warning: An experimental and successful GB-InSAR application. Geomorphology 2015, 241, 304–314. [Google Scholar] [CrossRef]
- van Schoor, M. Detection of sinkholes using 2D electrical resistivity imaging. J. Appl. Geophys. 2002, 50, 393–399. [Google Scholar] [CrossRef]
- Youssef, A.M.; El-Kaliouby, H.M.; Zabramawi, Y.A. Integration of remote sensing and electrical resistivity methods in sinkhole investigation in Saudi Arabia. J. Appl. Geophys. 2012, 87, 28–39. [Google Scholar] [CrossRef]
- Zini, L.; Calligaris, C.; Forte, E.; Petronio, L.; Zavagno, E.; Boccali, C.; Cucchi, F. A multidisciplinary approach in sinkhole analysis: The Quinis village case study (NE-Italy). Eng. Geol. 2015, 197, 132–144. [Google Scholar] [CrossRef]
- Perez, A.; Nam, B.; Alrowaimi, M.; Chopra, M.; Lee, S.; Youn, H. Experimental Study on Sinkholes: Soil-Groundwater Behaviors Under Varied Hydrogeological Conditions. J. Test. Eval. 2017, 45, 208–219. [Google Scholar] [CrossRef]
- Nof, R.N.; Abelson, M.; Raz, E.; Magen, Y.; Atzori, S.; Salvi, S.; Baer, G. SAR interferometry for sinkhole early warning and susceptibility assessment along the Dead Sea, Israel. Remote Sens. 2019, 11, 89. [Google Scholar] [CrossRef]
- Nof, R.N.; Baer, G.; Ziv, A.; Raz, E.; Atzori, S.; Salvi, S. Sinkhole precursors along the Dead Sea, Israel, revealed by SAR interferometry. Geology 2013, 41, 1019–1022. [Google Scholar] [CrossRef]
- Baer, G.; Magen, Y.; Nof, R.N.; Raz, E.; Lyakhovsky, V.; Shalev, E. InSAR measurements and viscoelastic modeling of sinkhole precursory subsidence: Implications for sinkhole formation, early warning, and sediment properties. J. Geophys. Res. Earth Surf. 2018, 123, 678–693. [Google Scholar] [CrossRef]
- Jones, C.E.; Blom, R.G. Bayou Corne, Louisiana, sinkhole: Precursory deformation measured by radar interferometry. Geology 2014, 42, 111–114. [Google Scholar] [CrossRef]
- Jeong, S.W.; Kim, S.W.; Yum, B.W.; Kuwano, R. Experimental results on compaction and groundwater level dependent ground subsidence using a small-sized laboratory tank model. J. Korean Soc. Hazard Mitig. 2016, 16, 311–319. [Google Scholar] [CrossRef]
- Kuwano, R.; Kohata, Y.; Sato, M. A case study of ground cave-in due to large scale subsurface erosion in old land fill. In Proceedings of the 6th International Conference on Scour and Erosion, Paris, France, 27–31 August 2012; pp. 56–92. [Google Scholar]
- Toulkeridis, T.; Rodríguez, F.; Arias Jiménez, N.; Baile, D.S.; Martínez, R.S.; Addison, A.; Carreón Freyre, D.; Mato, F.; Díaz Perez, C. Causes and consequences of the sinkhole at El Trébol of Quito, Ecuador—Implications for economic damage and risk assessment. Nat. Hazards Earth Syst. Sci. 2016, 16, 2031–2041. [Google Scholar] [CrossRef]
- Verachtert, E.; Maetens, W.; Van Den Eeckhaut, M.; Poesen, J.; Deckers, J. Soil loss rates due to piping erosion. Earth Surf. Process. Landf. 2011, 36, 1715–1725. [Google Scholar] [CrossRef]
- Abdelaziz, A.; Zhao, Q.; Grasselli, G. Grain based modelling of rocks using the combined finite-discrete element method. Comput. Geotech. 2018, 103, 73–81. [Google Scholar] [CrossRef]
- Chen, K.T.; Wu, J.H. Simulating the failure process of the Xinmo landslide using discontinuous deformation analysis. Eng. Geol. 2018, 239, 269–281. [Google Scholar] [CrossRef]
- Wu, J.H.; Lin, W.K.; Hu, H.T. Post-failure simulations of a large slope failure using 3DEC: The Hsien-du-shan slope, Eng. Geol. 2018, 242, 92–107. [Google Scholar] [CrossRef]


| Measurements | Sand 100% | Sand 95% + Clay 5% | ||||
|---|---|---|---|---|---|---|
| GWL (cm) | 5 | 10 | 15 | 5 | 10 | 15 |
| uf (kPa) | 0.5 | 1.3 | 2 | 0.6 | 1.6 | 2 |
| Δu (kPa) | 0.1 | 0.6 | 1.1 | 0.2 | 0.6 | 1.33 |
| tf (sec) | 50* | 60 | 30 | 150* | 110 | 100 |
| Surface collapse | X | O | O | X | O | O |
| Cavity (cm × cm) | 2.5 × 10 | 4 × 11 | 4 × 14 | - | 3 × 10 | 3 × 13 |
| Failure type | - | Punching | Punching | - | Punching | Punching |
| Soil loss (g) | 150 | 430 | 560 | 305 | 450 | 565 |
© 2019 by the authors. Licensee MDPI, Basel, Switzerland. This article is an open access article distributed under the terms and conditions of the Creative Commons Attribution (CC BY) license (http://creativecommons.org/licenses/by/4.0/).
Share and Cite
Jeong, S.-W.; Yum, B.-W.; Ryu, D.-W.; Lee, H.-J.; Jung, B. The Influence of Clay Content on Cave-ins in Tank Model Tests and Monitoring Indicators of Sinkhole Formation. Appl. Sci. 2019, 9, 2346. https://doi.org/10.3390/app9112346
Jeong S-W, Yum B-W, Ryu D-W, Lee H-J, Jung B. The Influence of Clay Content on Cave-ins in Tank Model Tests and Monitoring Indicators of Sinkhole Formation. Applied Sciences. 2019; 9(11):2346. https://doi.org/10.3390/app9112346
Chicago/Turabian StyleJeong, Sueng-Won, Byoung-Woo Yum, Dong-Woo Ryu, Hong-Jin Lee, and Byeongju Jung. 2019. "The Influence of Clay Content on Cave-ins in Tank Model Tests and Monitoring Indicators of Sinkhole Formation" Applied Sciences 9, no. 11: 2346. https://doi.org/10.3390/app9112346
APA StyleJeong, S.-W., Yum, B.-W., Ryu, D.-W., Lee, H.-J., & Jung, B. (2019). The Influence of Clay Content on Cave-ins in Tank Model Tests and Monitoring Indicators of Sinkhole Formation. Applied Sciences, 9(11), 2346. https://doi.org/10.3390/app9112346