Article

Comparative Analysis of Flood Vulnerability Indicators by Aggregation Frameworks for the IPCC’s Assessment Components to Climate Change

Department of Civil Engineering, Yeungnam University, 280 Daehak-Ro, Gyeongsan, Gyeongbuk 38541, Korea
*
Author to whom correspondence should be addressed.
Appl. Sci. 2019, 9(11), 2321; https://doi.org/10.3390/app9112321
Submission received: 14 May 2019 / Revised: 31 May 2019 / Accepted: 3 June 2019 / Published: 5 June 2019
(This article belongs to the Special Issue Climate Change and Water Resources)

Abstract

:
As severe flood damages have been increasing due to climate change, the flood vulnerability assessment is needed in the flood mitigation plans to cope with climate-related flood disasters. Since the Intergovernmental Panel on Climate Change Third Assessment Report (IPCC TAR) presented the three assessment components, such as exposure, sensitivity, and adaptability for the vulnerability to climate change, several aggregation frameworks have been used to compile individual components into the composite indicators to measure the flood vulnerability. It is therefore necessary to select an appropriate aggregation framework for the flood vulnerability assessments because the aggregation frameworks can have a large influence on the composite indicator outcomes. For a comparative analysis of flood vulnerability indicators across different aggregation frameworks for the IPCC’s assessment components, the composite indicators are derived by four representative types of aggregation frameworks with all the same proxy variable set in the Republic of Korea. It is found in the study site that there is a key driver component of the composite indicator outcomes and the flood vulnerability outcomes largely depend on whether the key component is treated independently or dependently in each aggregation framework. It is concluded that the selection of an aggregation framework can be based on the correlation and causality analysis to determine the relative contribution of the assessment components to the overall performance of the composite indicators across different aggregation frameworks.

1. Introduction

The Intergovernmental Panel on Climate Change (IPCC) reports have reported that a significant increase in greenhouse gas emissions is likely to be one of the main causes of climate change, as represented by global warming and it has accelerated frequent and intense disasters in many countries [1,2,3]. Natural disasters are one of the serious threats that can lead to the destruction or deterioration of social and economic development. With global warming, there has been a continuous rise in intense climate-related disasters mainly floods and storms worldwide [4]. Moreover, urbanization along with more precipitation has been increasing the risk of runoff and flooding in many parts of the world [4]. The Emergency Events Database (EM-DAT) data [5] over the past 20 years between 1998 and 2017 indicate that floods were the majority of all disasters type accounting for about 43% of all recorded events; they affected the largest number of people at more than two billion people; and storms were also the costliest type of disaster amounting to US$ 1300 billion in recorded damage. Such floods have been aimed at reducing the risk of damage and frequency through mainly various structural measures such as dams and river improvement works in many research and development projects on disaster mitigation plans. It has been however found that the structural flood mitigation alone has significant limitations in the reduction of flood damage caused by super typhoons and local torrential storms due to climate change [6]. In order to provide preemptive information on the process of prioritization and selection of flood mitigation alternatives, non-structural measures become a more essential tool rather than structural measures that are likely to even threaten the ecosystem [7,8,9].
The flood vulnerability assessment is one of the main components in the non-structural measures of flood mitigation especially to climate change [10], and one of the best-known definitions of the vulnerability to climate change is proposed in the IPCC Third Assessment Report (TAR) [1]. Based on the IPCC’s conceptual framework for the vulnerability to climate change, many studies have conducted vulnerability assessments in various areas such as drought, heat wave, tidal wave, sea level rise, earthquake, biodiversity, fishery, etc. as well as floods [11,12,13,14,15,16,17,18,19,20,21,22,23,24,25,26,27,28,29,30,31,32,33,34,35,36,37,38,39,40,41,42,43,44,45]. The IPCC’s framework consists of the three components such as exposure, sensitivity, and adaptability for the vulnerability assessment to climate change [1]. Note that adaptability is usually treated as a synonym for adaptive capacity [1]. According to some literature [11,12,13,14,15,28,29,30,31,32,33,34,35] sensitivity is expressed in other words as fragility or susceptibility, and adaptability is regarded as response capacity, coping capacity, or resilience with a slight difference in meaning between words. As multidimensional concepts are usually measured by a single composite indicator compiled from individual conflicting criteria [46], the vulnerability assessments to climate change have been commonly conducted by a composite indicator compiled from the constituent assessment components. Hence, several methods have been proposed to implement the mathematical and causal relations among the assessment components in measuring the vulnerability of a system to climate change. An approach for assessing the vulnerability was designed as a general equation form by integrating the IPCC’s three primary assessment components independently contributing to the vulnerability as representatively suggested by Adger [12]. As such, many flood vulnerability indicators have been derived from the three primary components with equal weights by multiplicative utility functions [13,14,15,16,17]. In addition to the framework for the IPCC’s three primary components, other frameworks have been proposed by incorporating some intermediate components as combinations of the two components for a different objective, subjective, scope, or context in measuring the vulnerability. Metzger et al. [18] representatively presents a vulnerability assessment framework for combining a primary component of adaptability and an intermediate component of the potential impact from a composite function of exposure and sensitivity. The potential impact was already addressed as all possible impacts on environmental change of a system with no consideration for the planned adaptation in the IPCC TAR [1]. This framework has been employed in some flood vulnerability assessments [19,20,21]. Another framework for the vulnerability assessment is representatively proposed by Hahn et al. [22], focusing on livelihood vulnerability as a function of exposure and adaptability to be combined with sensitivity in measuring the vulnerability. Note that a similar approach was already implemented in the Republic of Korea to evaluate the potential flood damage [23]. This framework has been generally used in measuring the vulnerability to multiple natural disasters including floods [22,23,24,25,26,27]. Besides, in the MOVE (Method for the Improvement of Vulnerability in Europe) framework [28] the average of sensitivity and lack of adaptability is combined with exposure for the vulnerability assessment as representatively presented in Depietri et al. [29]. The MOVE framework has been used to generate the vulnerability indicators not only for flooding disasters [30,31], but also for multiple natural hazards such as flooding, storm surges, salinity intrusion, heat waves, earthquakes, etc. [32,33].
Since multiple aggregation frameworks for the IPCC’s vulnerability assessment components have been identified and applied across the globe, it is desired to have a comprehensive investigation of characteristics and differences of their outcomes. It is deemed appropriate to have such an investigation before their application in relevant agencies in preparing flood mitigation plans to reduce vulnerable people and systems exposed to flood damages. Such assessments are necessary more now than ever, as severe floods are likely to increase with changes in climate [47]. Thus, this study aims to compare four different flood vulnerability indicators under different aggregation frameworks using the IPCC’s standard assessment components (exposure, sensitivity, and adaptability) over the 231 administrative districts of the Republic of Korea. For this purpose, proxy variables are initially selected and compiled for the standard primary components of exposure, sensitivity, and adaptability. Secondly, additional intermediate components are constructed in different aggregation frameworks for each vulnerability indicator. Simple correlation and causality analyses are then carried out to examine the similarity between vulnerability indicators and to identify the effect of individual constituent components on the vulnerability indicators. This study can provide stakeholders with the fundamental information on the nature and limitations of flood vulnerability indicators by aggregation frameworks to help in decision-making as well as in improving the assessment methodology.

2. Aggregation Frameworks

As climate change has widespread impacts on almost every facet of natural and social systems, the vulnerability assessments in various fields to climate change have been conducted based on the conceptual framework in IPCC TAR [1]. Vulnerability to complex phenomenon such as floods and other multi-dimensional issues has been generally quantified using a single composite indicator [46], which can be estimated using IPCC’s standard components of exposure, sensitivity, and adaptability. The adaptability component functions as a resilient force against the vulnerability while the exposure and sensitivity components represent a positive elasticity to the vulnerability. The composite indicators are usually derived by additive or multiplicative multi-attribute utility functions, and these two types of utility functions will produce composite indicators with utterly different attributes [46]. Some compensation between assessment components is allowed in the composite indicators aggregated by additive utility functions, such that the contribution of lower values in some components can be compensated for by much higher values in the other components. On the contrary, no compensation occurs between assessment components in the composite indicators aggregated by multiplicative utility functions, such that a low value in one of the components can dramatically reduce the composite indicator outcomes. It is preferable that the flood vulnerability assessment is measured by a non-compensatory composite indicator for which no trade-off occurs in the constituent components [13,34], and also a non-compensatory composite indicator needs to be aggregated from all the assessment components with the same directional elasticity to vulnerability for robustness and confidence in composite indicator outcomes [35]. Thus, this study investigates various construction frameworks for non-compensatory composite indicators aggregated from the assessment components with all the same positive elasticity to the vulnerability, such as exposure, sensitivity, lack of adaptability, and combinations of the two of them as below.
Given the above considerations of the aggregation schemes for composite indicators, the first flood vulnerability indicator F V I 1 can be expressed in Equation (1) by compiling the three primary assessment components, exposure E, sensitivity S, and lack of adaptability A independently, as presented in previous studies [13,14,15,16,17]:
F V I 1 = E   ×   S   ×   A .
As the vulnerability is also defined in terms of adaptability to cope with potential impacts of other global changes as well as climate change [1,36,37], potential impact PI is undertaken as a function of exposure and sensitivity [18]. Hence, the second flood vulnerability indicator F V I 2 can be expressed in Equation (2) by the potential impact PI linearly aggregated from the exposure E and sensitivity S [19,38,39,40] along with a lack of adaptability A, following the framework in previous studies [20,21,41,42,43]:
F V I 2 =   P I   ×   A = f ( E , S ) ×   A .
Other approaches for vulnerability assessment integrating climate exposures and adaptation practices are developed in the Republic of Korea to evaluate the potential flood damage used in the comprehensive national water resource plan for water resources [23], and also established in Mozambique for comprehensively assessing coastal communities’ livelihood vulnerability to climate change [22]. Since households with limited assets are at an increased exposure to climate-induced variability and their ability to cope is restricted [48], livelihood vulnerability can be expressed as the sum of exposure and adaptability. Hence, the third flood vulnerability indicator F V I 3 can be obtained from livelihood vulnerability LV linearly aggregated from exposure E and lack of adaptability A along with sensitivity S in Equation (3), by adopting the framework in previous studies [22,23,24,25,26,27]:
F V I 3 =   L V   ×   S = f ( E , A ) ×   S .
The framework in the MOVE is developed for an improved vulnerability assessment to the multi-faceted natural disasters and climate change adaptation [28]. In the MOVE framework, the average of sensitivity S and lack of adaptability A is engaged in the vulnerability assessment for natural and socio-natural hazards as well as climate change. This study defines the integration of sensitivity S and lack of adaptability A as the internal factor I F in the light of that sensitivity and adaptability are involved in internal processes of the system unlike exposure for an attribute between the system and the external perturbation [11]. Hence, the fourth flood vulnerability indicator F V I 4 can be obtained from internal factor I F linearly aggregated from sensitivity S and lack of adaptability A along with exposure E in Equation (4), by following previous studies [29,30,31,32,33]:
F V I 4 = I F   ×   E = f ( S , A )   ×   E .

3. Data and Processes
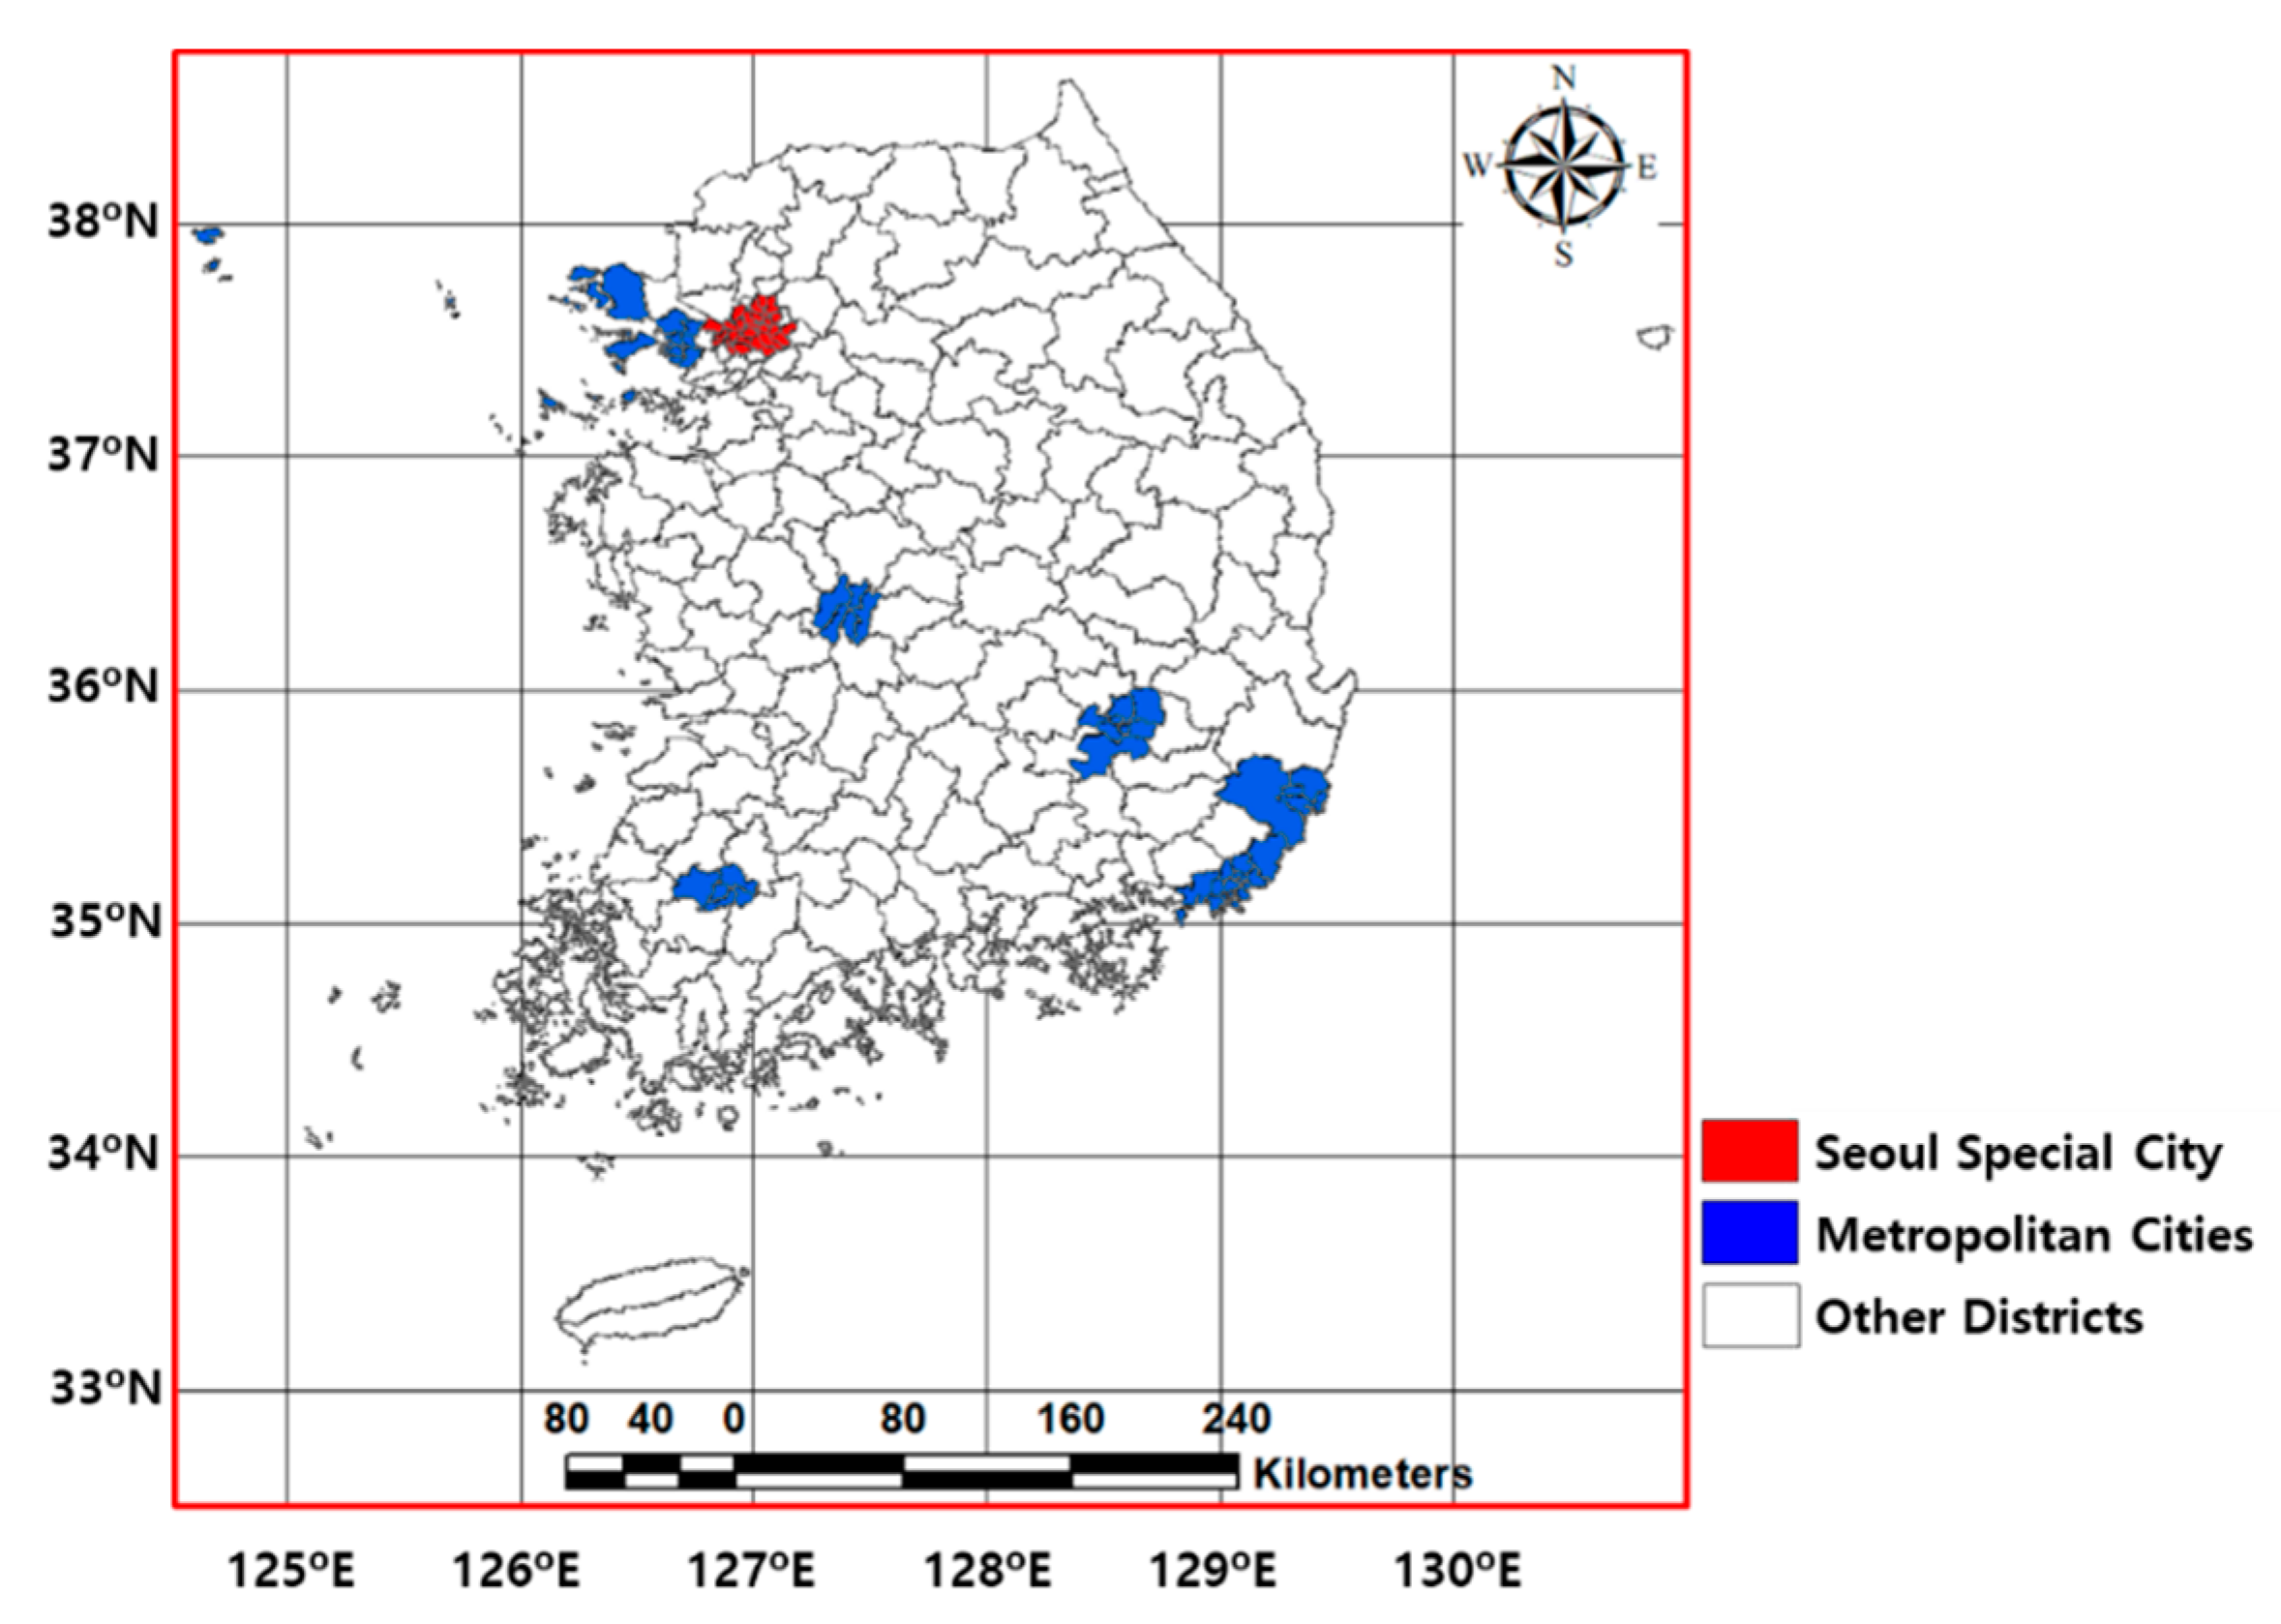
3.1. Study Site

As shown in Figure 1, the 231 administrative districts of the Republic of Korea were selected as the study site for the comparative analysis of flood vulnerability indicator outcomes across the four conventional aggregation frameworks for the assessment components by the IPCC [1]. The study site located between 33–43 °N and 124–131 °E lies in the temperate zone at the East Asian monsoon, and the three sides of the mountainous terrain are in contact with the coast, which is likely vulnerable to severe flood damage by climate change. The average annual precipitation was 1253.9 mm in the last decade between 2008 and 2017 [49], and most of the rainfall is concentrated in the rainy season from June to September along with a recent increase in the frequency of local heavy storms and typhoons. As there are recently distinct signs of transition to a subtropical climate by global warming in the Korean Peninsula, many extraordinary and extreme climate-related records have been reported, such as torrential heavy rainfall of 301.5 mm (the annual maximum daily rainfall is 157.3 mm) around the Seoul Special City in July 2011, by far the heaviest daily rainfall ever recorded in the meteorological history [49,50]. The population and infrastructure densities are so high in the Seoul Special City the national capital and the six metropolitan cities, including Busan, Incheon, Daegu, Daejeon, Ulsan, and Gwangju that 49.6% of the total population resides in the Seoul metropolitan area and 81.5% of the total population lives in urban areas and cities, according to the 2017 Population and Housing Census of the Statistics Geographic Information Service [51].

3.2. Proxy Variable Selection

For feasible and reasonable outcomes in vulnerability assessments, the proxy variables should be carefully selected for each assessment component relevant to the objective of the vulnerability assessment. This study employed the three constituent components such as exposure, sensitivity, and adaptability in the conceptual framework by the IPCC [1] as primary assessment components. Exposure is defined as “the nature and degree to which a system is exposed to significant climatic variations” in the IPCC [1], and also described as “degree, duration, and/or extent in which the system is in contact with, or subject to, the perturbation” by Gallopín [11]. Sensitivity is defined as “the degree to which a system is affected, either adversely or beneficially, by climate-related stimuli” in the IPCC [1], and also described as “the elements exposed within the system (e.g., people, property, infrastructure, etc.), which influence the probabilities of being harmed at times of hazardous floods” by Holmes and Croot [44]. Adaptability is defined as “the ability of a system to adjust to climate change, to moderate potential damages, to take advantage of opportunities, or to cope with the consequences” in the IPCC [1], and also described as “the collective capacity of the human actors in the system to manage resilience” by Walker et al. [45]. The possible available efforts are required to reduce the controversy and difficulties in selecting proxy variables for the vulnerability assessments. Thus, two proxy variables, which are deemed relevant to human and properties are identified based on the IPCC’s widely referred assessment components. A comprehensive review was carried out for previously published flood vulnerability assessment articles [13,14,15,16,17,19,20,21,23,30,31,32,34,35] to select each proxy variable for the study site, as presented in Table 1.
To represent the duration and extent to which the study site is influenced by flood events, the proxy variables for the exposure component comprised of days of heavy rainfall greater than 80 mm per day [52] and ratio of flooded area to each administrative district area. The heavy rainy days were temporally averaged for the past decade during 2008 to 2017 years and then computed by Thiessen polygons method [53] as the mean areal values for the 231 administrative districts from the 50 gauge stations managed by the Korea Meteorological Administration [49]. The flooded area ratio data were constructed as the annual average of the past decade data during 2008 to 2017 years for the 231 administrative districts from the flood damage data by the National Disaster Information Center [54].
On behalf of the people and property that are likely to be damaged by hazardous floods, the sensitivity component was evaluated by the density of population that are under four years old or over 65 years old, along with the density of major facilities and infrastructure for each administrative district. The children and elderly population data in 2017 were collected from age-specific populations for the 231 administrative districts by the Korean Statistical Information Service [55]. The major facilities and infrastructure data were constructed for the 231 administrative districts from the land cover and use map by the National Environment Information Network System [56].
The adaptability component included the two proxy variables for each administrative district such as the number of medical institutions and evacuation services for a representative measure against the casualty loss, and the drainage capacity of stormwater pumping stations for a representative coping with the property damage. Note that the lower the two proxy variables of adaptability, the greater A (lack of adaptability) is generated, which can increase the flood vulnerability. The emergency service data for the 231 administrative districts were provided by the Korean Statistical Information Service [55]. The drainage system capacity data were collected and constructed for the 231 administrative districts, based on the sewerage statistics report [57] by the Ministry of Environment.

3.3. Indicator Construction

A normalization method was necessary to transform proxy variables generally measured at different scales and units into a common domain. This study adopts the min–max normalization method as used in previous studies [19,22,25,27,30,31,35,38,40], and all proxy variables ranged from 1 to 100 by Equations (5) and (6). Note that 1.0 was taken for the normalized minimum score to avoid the zero composite outcomes by multiplicative aggregation forms in Equations (1)–(4). Equation (5) transforms variables with the functional relationship for increasing vulnerability such as proxy variables for the exposure and sensitivity components, while proxy variables for the adaptability component decreasing vulnerability are transformed by Equation (6):
u i = s m i n + x i min ( x i ) max ( x i ) min ( x i ) ( s m a x s m i n ) ,
u i = s m a x x i min ( x i ) max ( x i ) min ( x i ) ( s m a x s m i n ) ,
where u i is the normalized value of the original value x i for the proxy variable i , max ( x i ) and min ( x i ) are the maximum and the minimum values, respectively of the proxy variable i , and s m a x and s m i n are the maximum of 100 and the minimum of 1, respectively of the normalized value u i .
Following previous studies [19,22,23,24,25,26,27,29,30,31,32,33,34,35,38,39], the normalized proxy variables are then linearly aggregated into each component indicator such as exposure E , sensitivity S , lack of adaptability A , potential impact P I , livelihood vulnerability L V , or internal factor I F , respectively with the weighting factor w i for the total number k of proxy variables for each component indicator:
( E ; S ; A ; P I ; L V ; I F ) = i = 1 k w i u i ,
where equal weights are applied to compiling each component indicator in Equation (7) to avoid unexpected effects of weights on flood vulnerability outcomes in this study. Note that it can be valid to assign equal weights to assessment components in the lack of information, resources, or consensus for different weights [38,46].
The four types of flood vulnerability indicators F V I 1 , F V I 2 , F V I 3 , and F V I 4 are finally constructed by the four aggregation frameworks in Equations (1), (2), (3), and (4), respectively.

4. Results

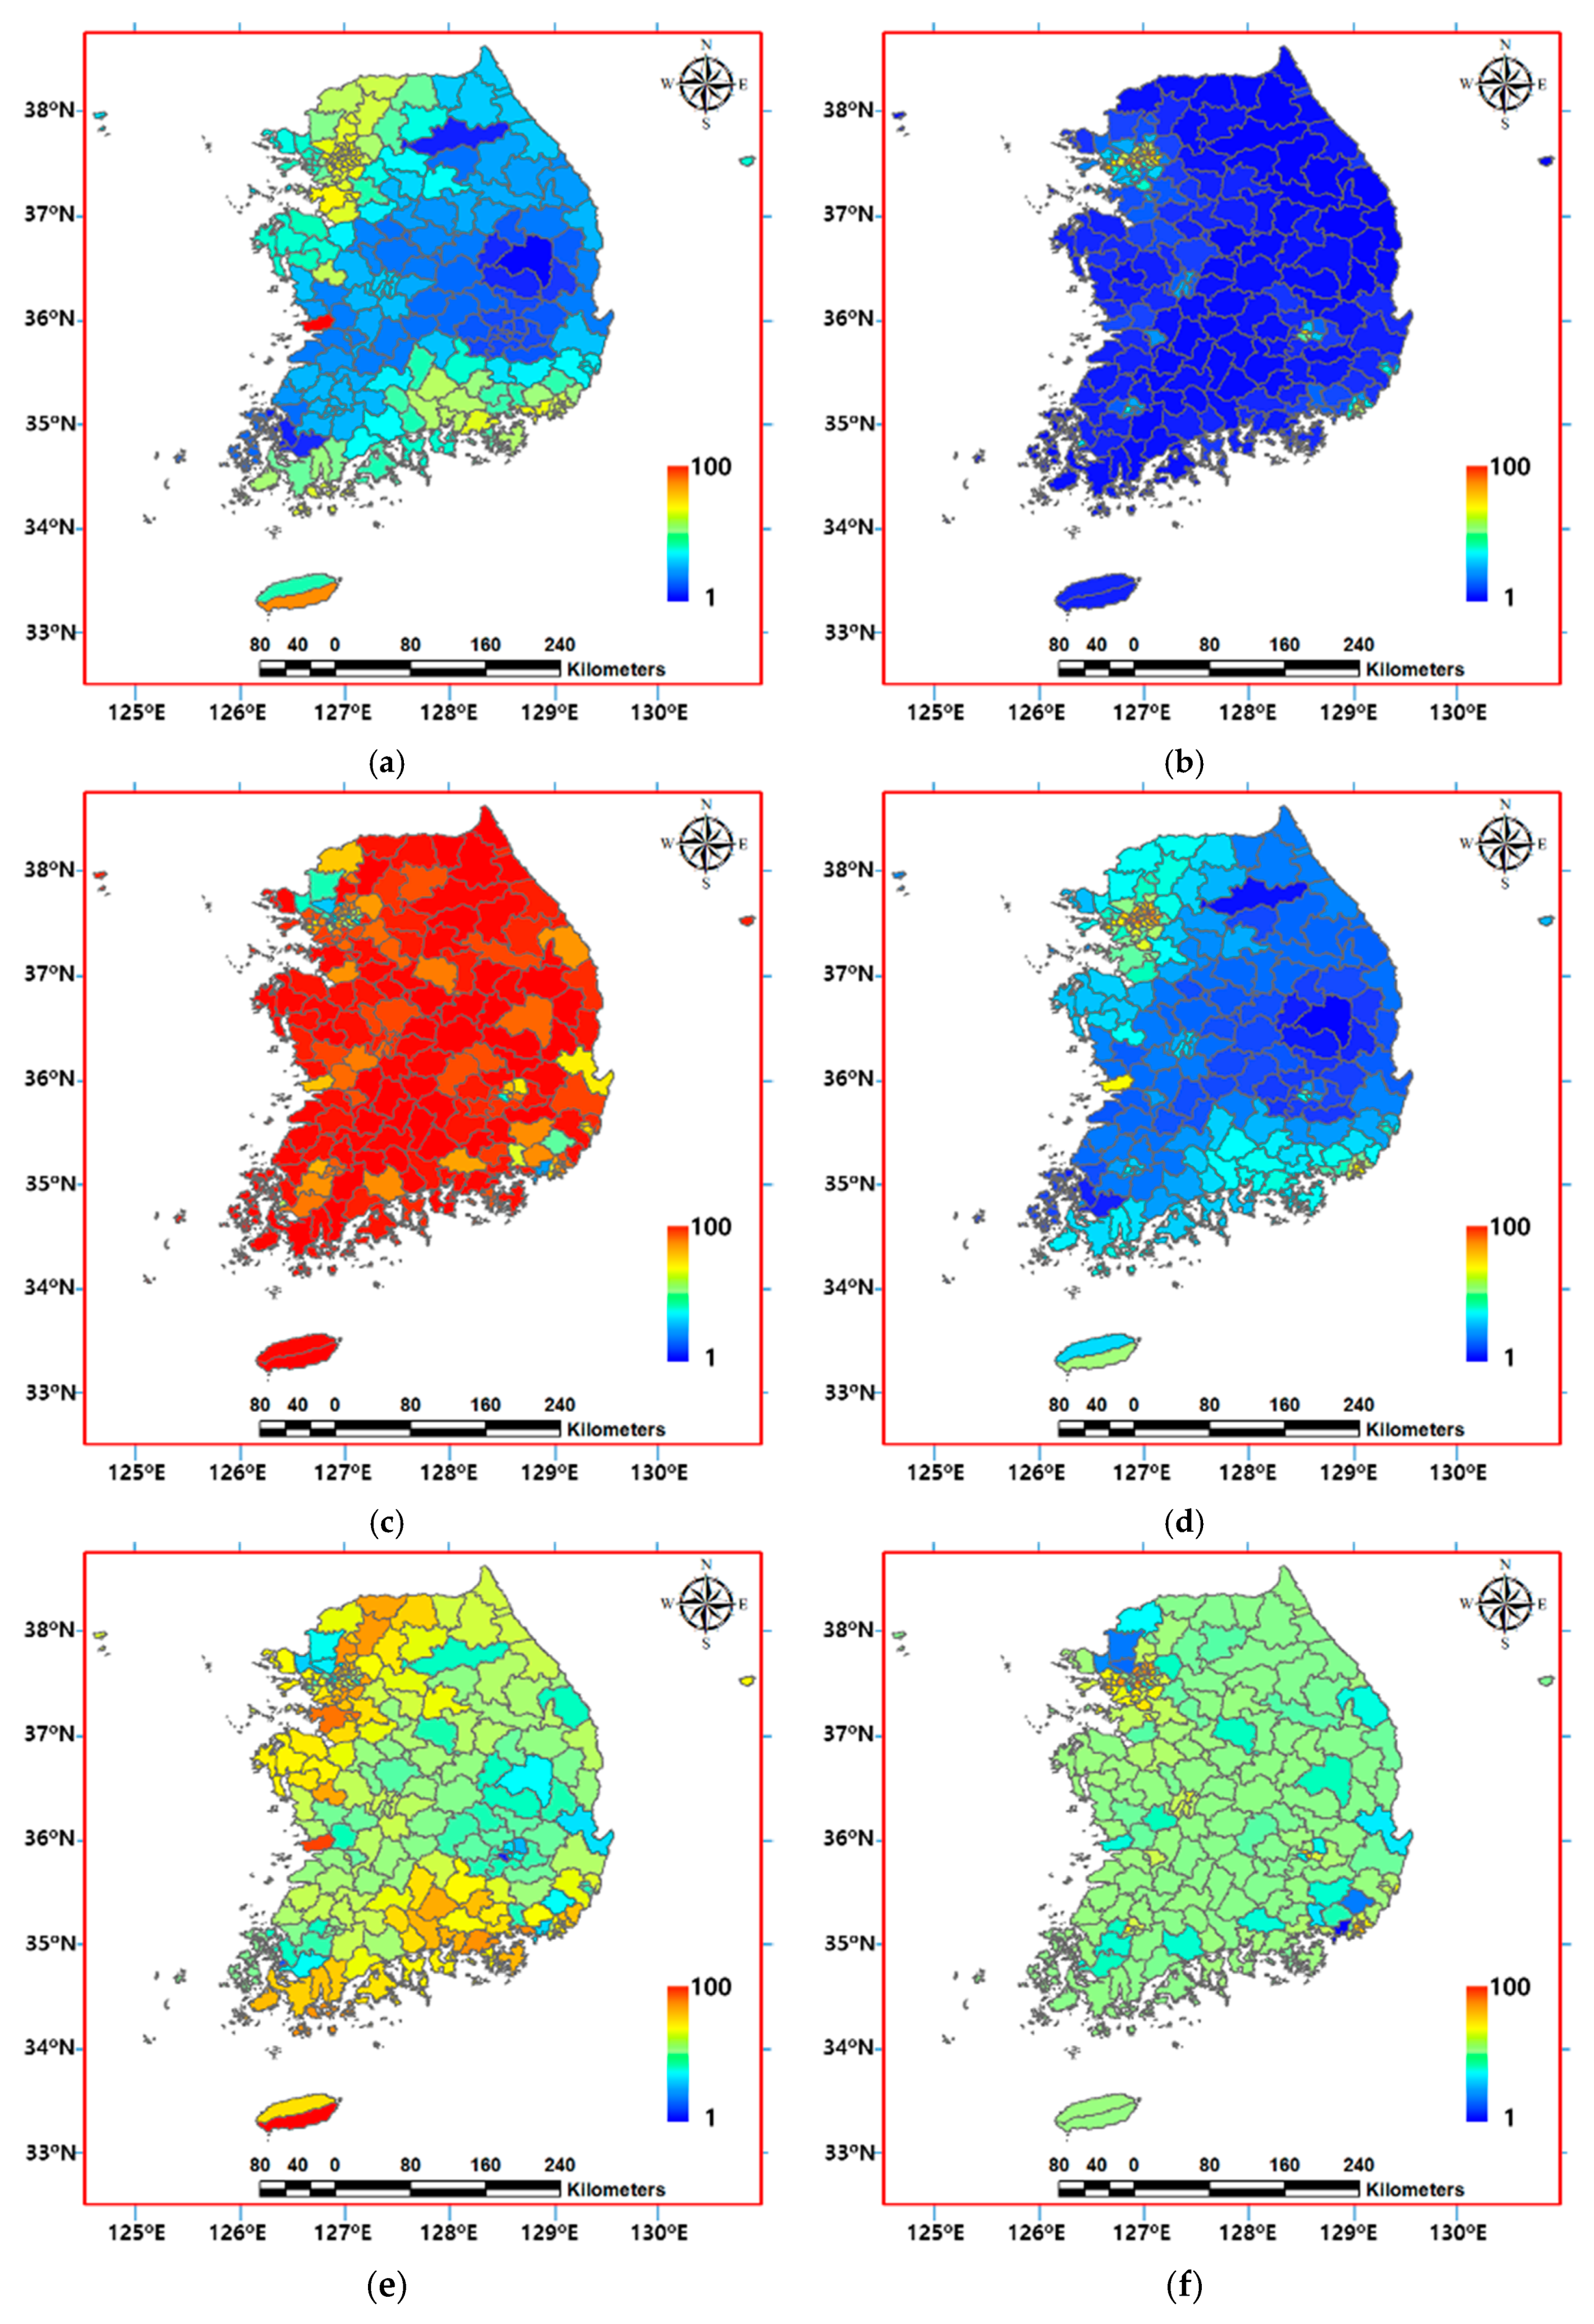
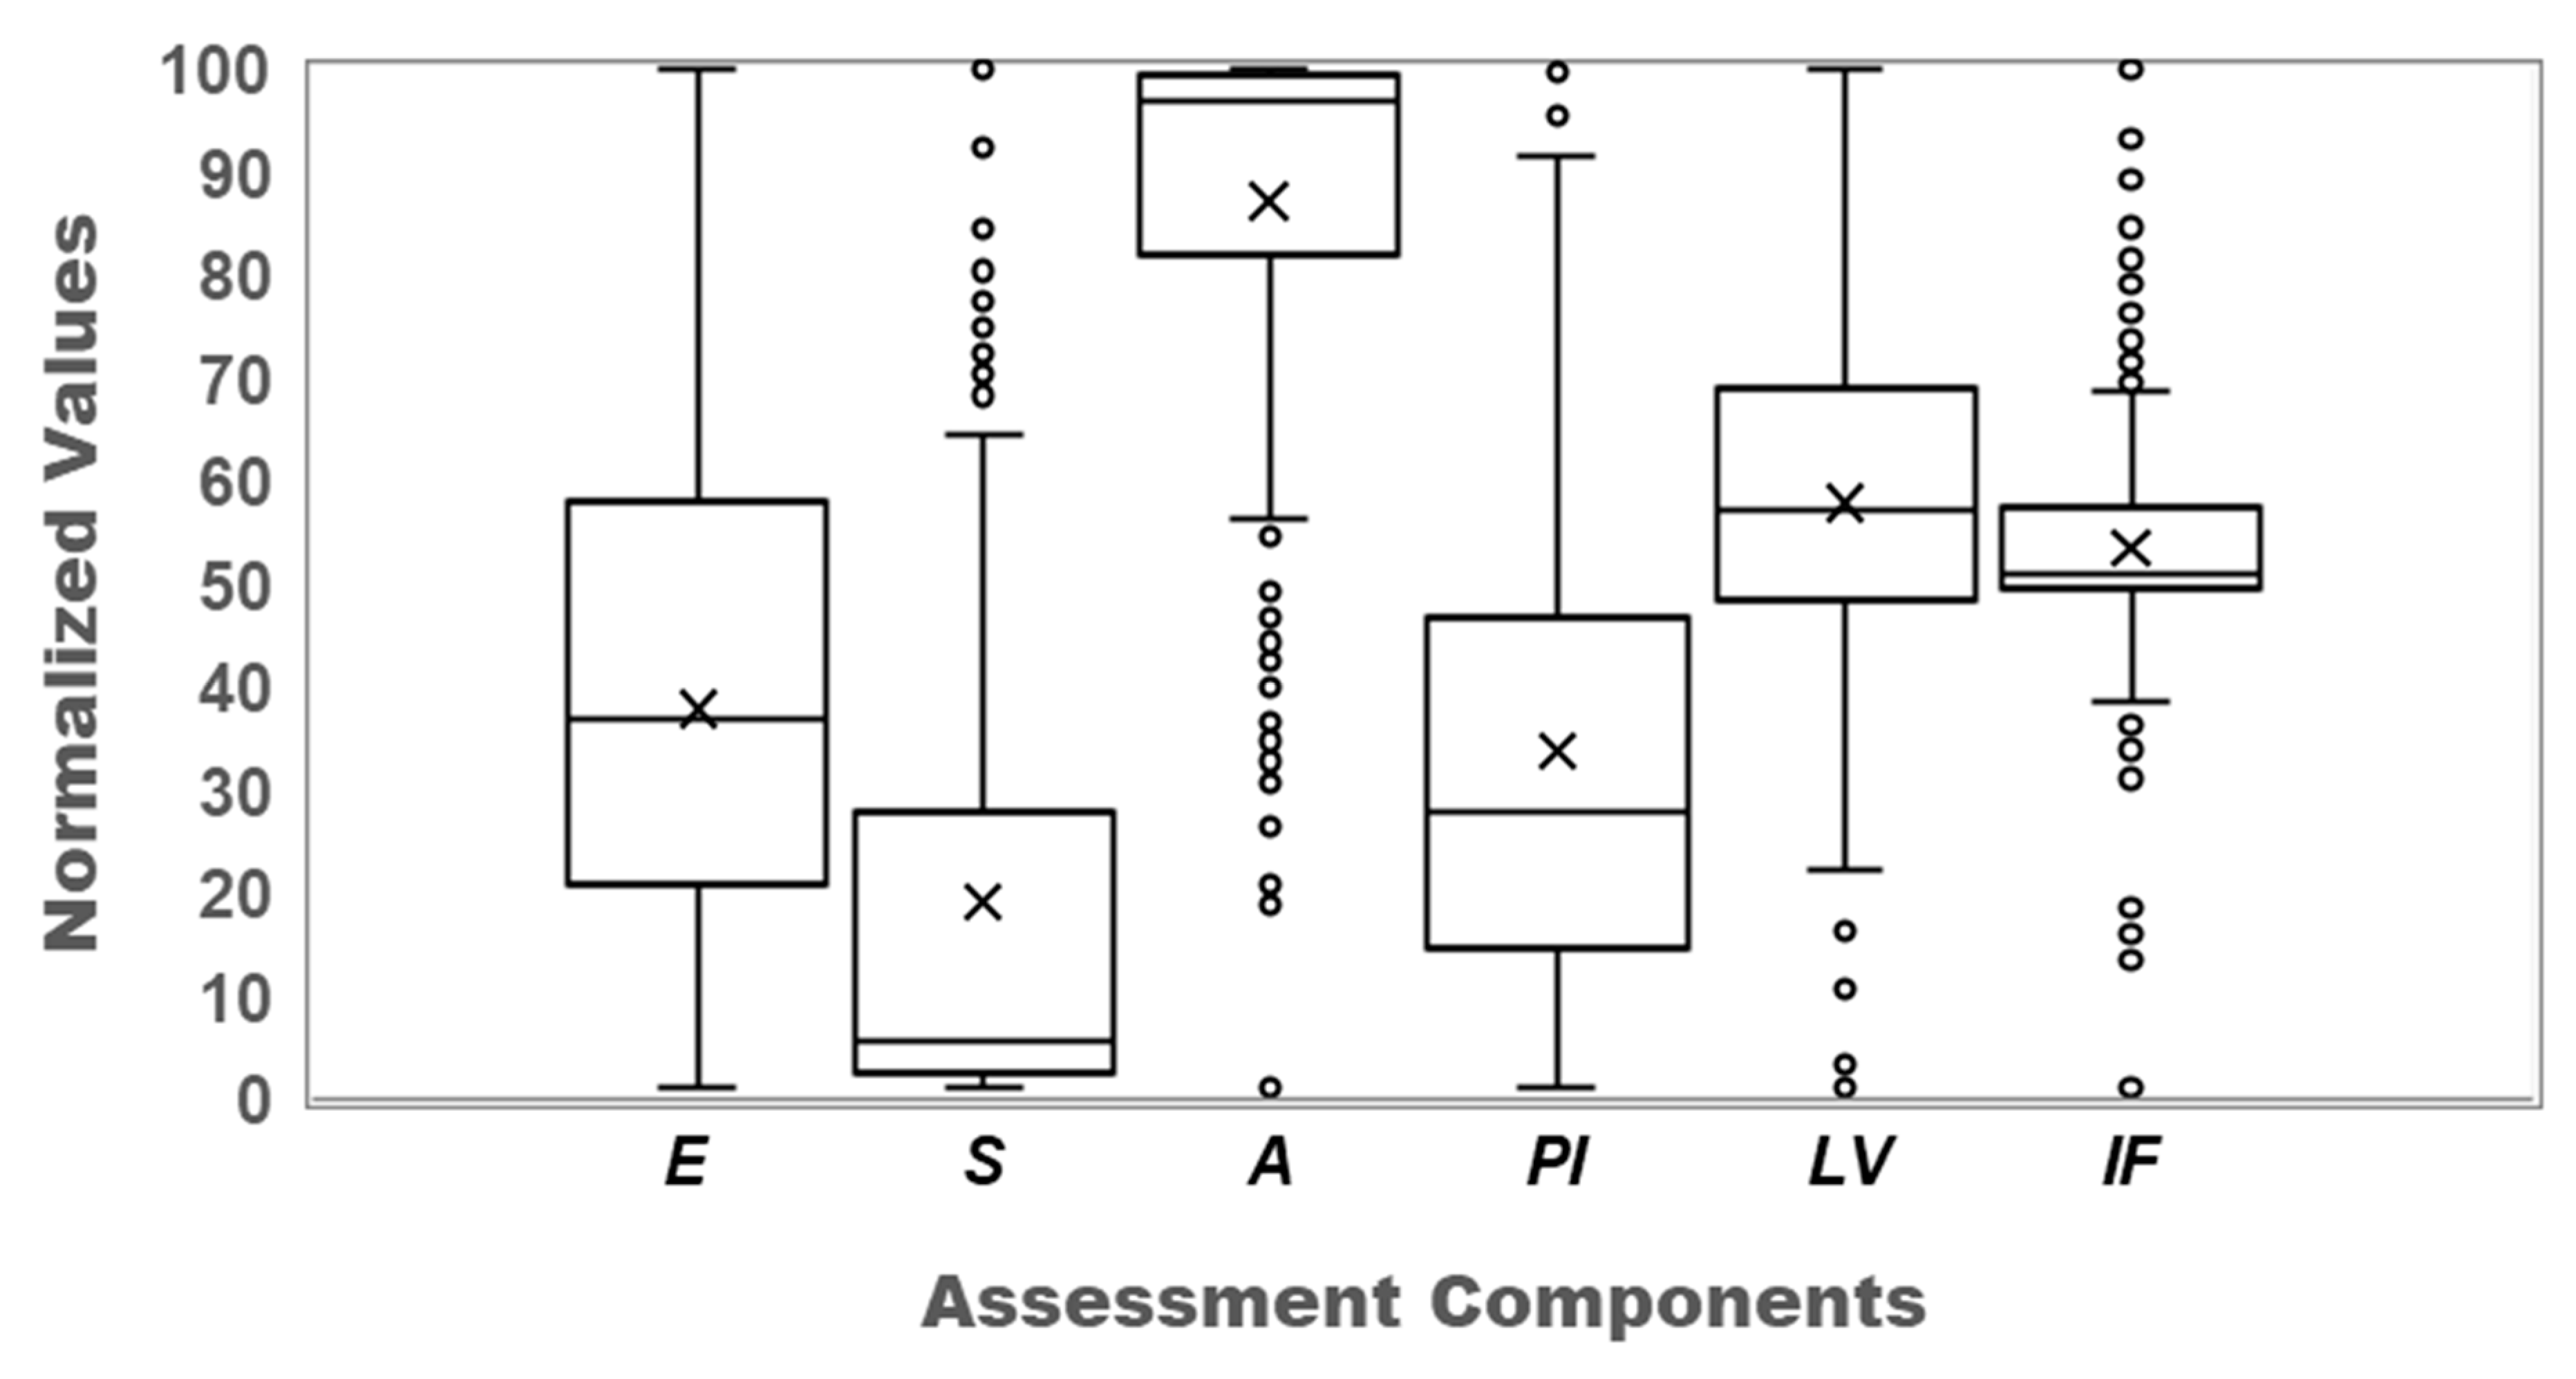
4.1. Assessment Components

Figure 2 denotes the spatial distribution of the primary assessment components such as exposure E, sensitivity S, and lack of adaptability A, along with the intermediate assessment components such as the potential impact PI, livelihood vulnerability LV, and internal factor IF over the study site. Figure 3 denotes the box and whisker plots to present variation and skewness of data distribution for each assessment component in the study site. Table 2 shows relationships between primary components E, S, and A, and relationships of each primary component to intermediate components PI, IF, and LV, which are measured by values for the coefficient of correlation.
As shown in Figure 2a, the values of exposure E were higher in the northwestern part around the Seoul metropolitan area where flooding damage from heavy rainfalls frequently occurred due to the recent abnormal weather conditions. Exposure E also showed higher values in the southern part near the coastline located on the main path of intense typhoons and severe storms due to regional climatic and topographic features. The values of sensitivity S were much higher in metropolitan cities such as Seoul, Busan, Incheon, Daegu, Daejeon, Ulsan, and Gwangju with the high population and infrastructure densities, whereas most of the other areas (75% of total districts) had lower values of sensitivity S less than 30 as shown in Figure 2b and Figure 3. On the contrary, the values of the lack of adaptability A were low in most metropolitan area, whereas most of the other areas (75% of total districts) had higher values greater than 80 as shown in Figure 2c and Figure 3. In terms of data distribution characteristics of assessment components, Figure 3 denotes that the variation of exposure E was spread out over the administrative districts with a relatively smooth gradation of values. Meanwhile, the values of sensitivity S or the lack of adaptability A were concentrated in a quite low level or a quite high level, respectively as shown in Figure 3. The composite data of the potential impact PI was influenced by both exposure E and sensitivity S, resulting in a high relationship with each of the two primary components that had a positive correlation with each other as listed in Table 2. The composite data of the livelihood vulnerability LV compiled by exposure E and lack of adaptability A becomes a third one with another distribution of values not like either of the two primary components as shown in Figure 3, because of a negative correlation with each other as denoted in Table 2. Similarly, most of internal factor IF were concentrated in the middle level values as shown in Figure 3, because this intermediate component was an average of the sensitivity S and lack of adaptability A in a reversed relationship (a negative correlation coefficient) with each other as denoted in Table 2.

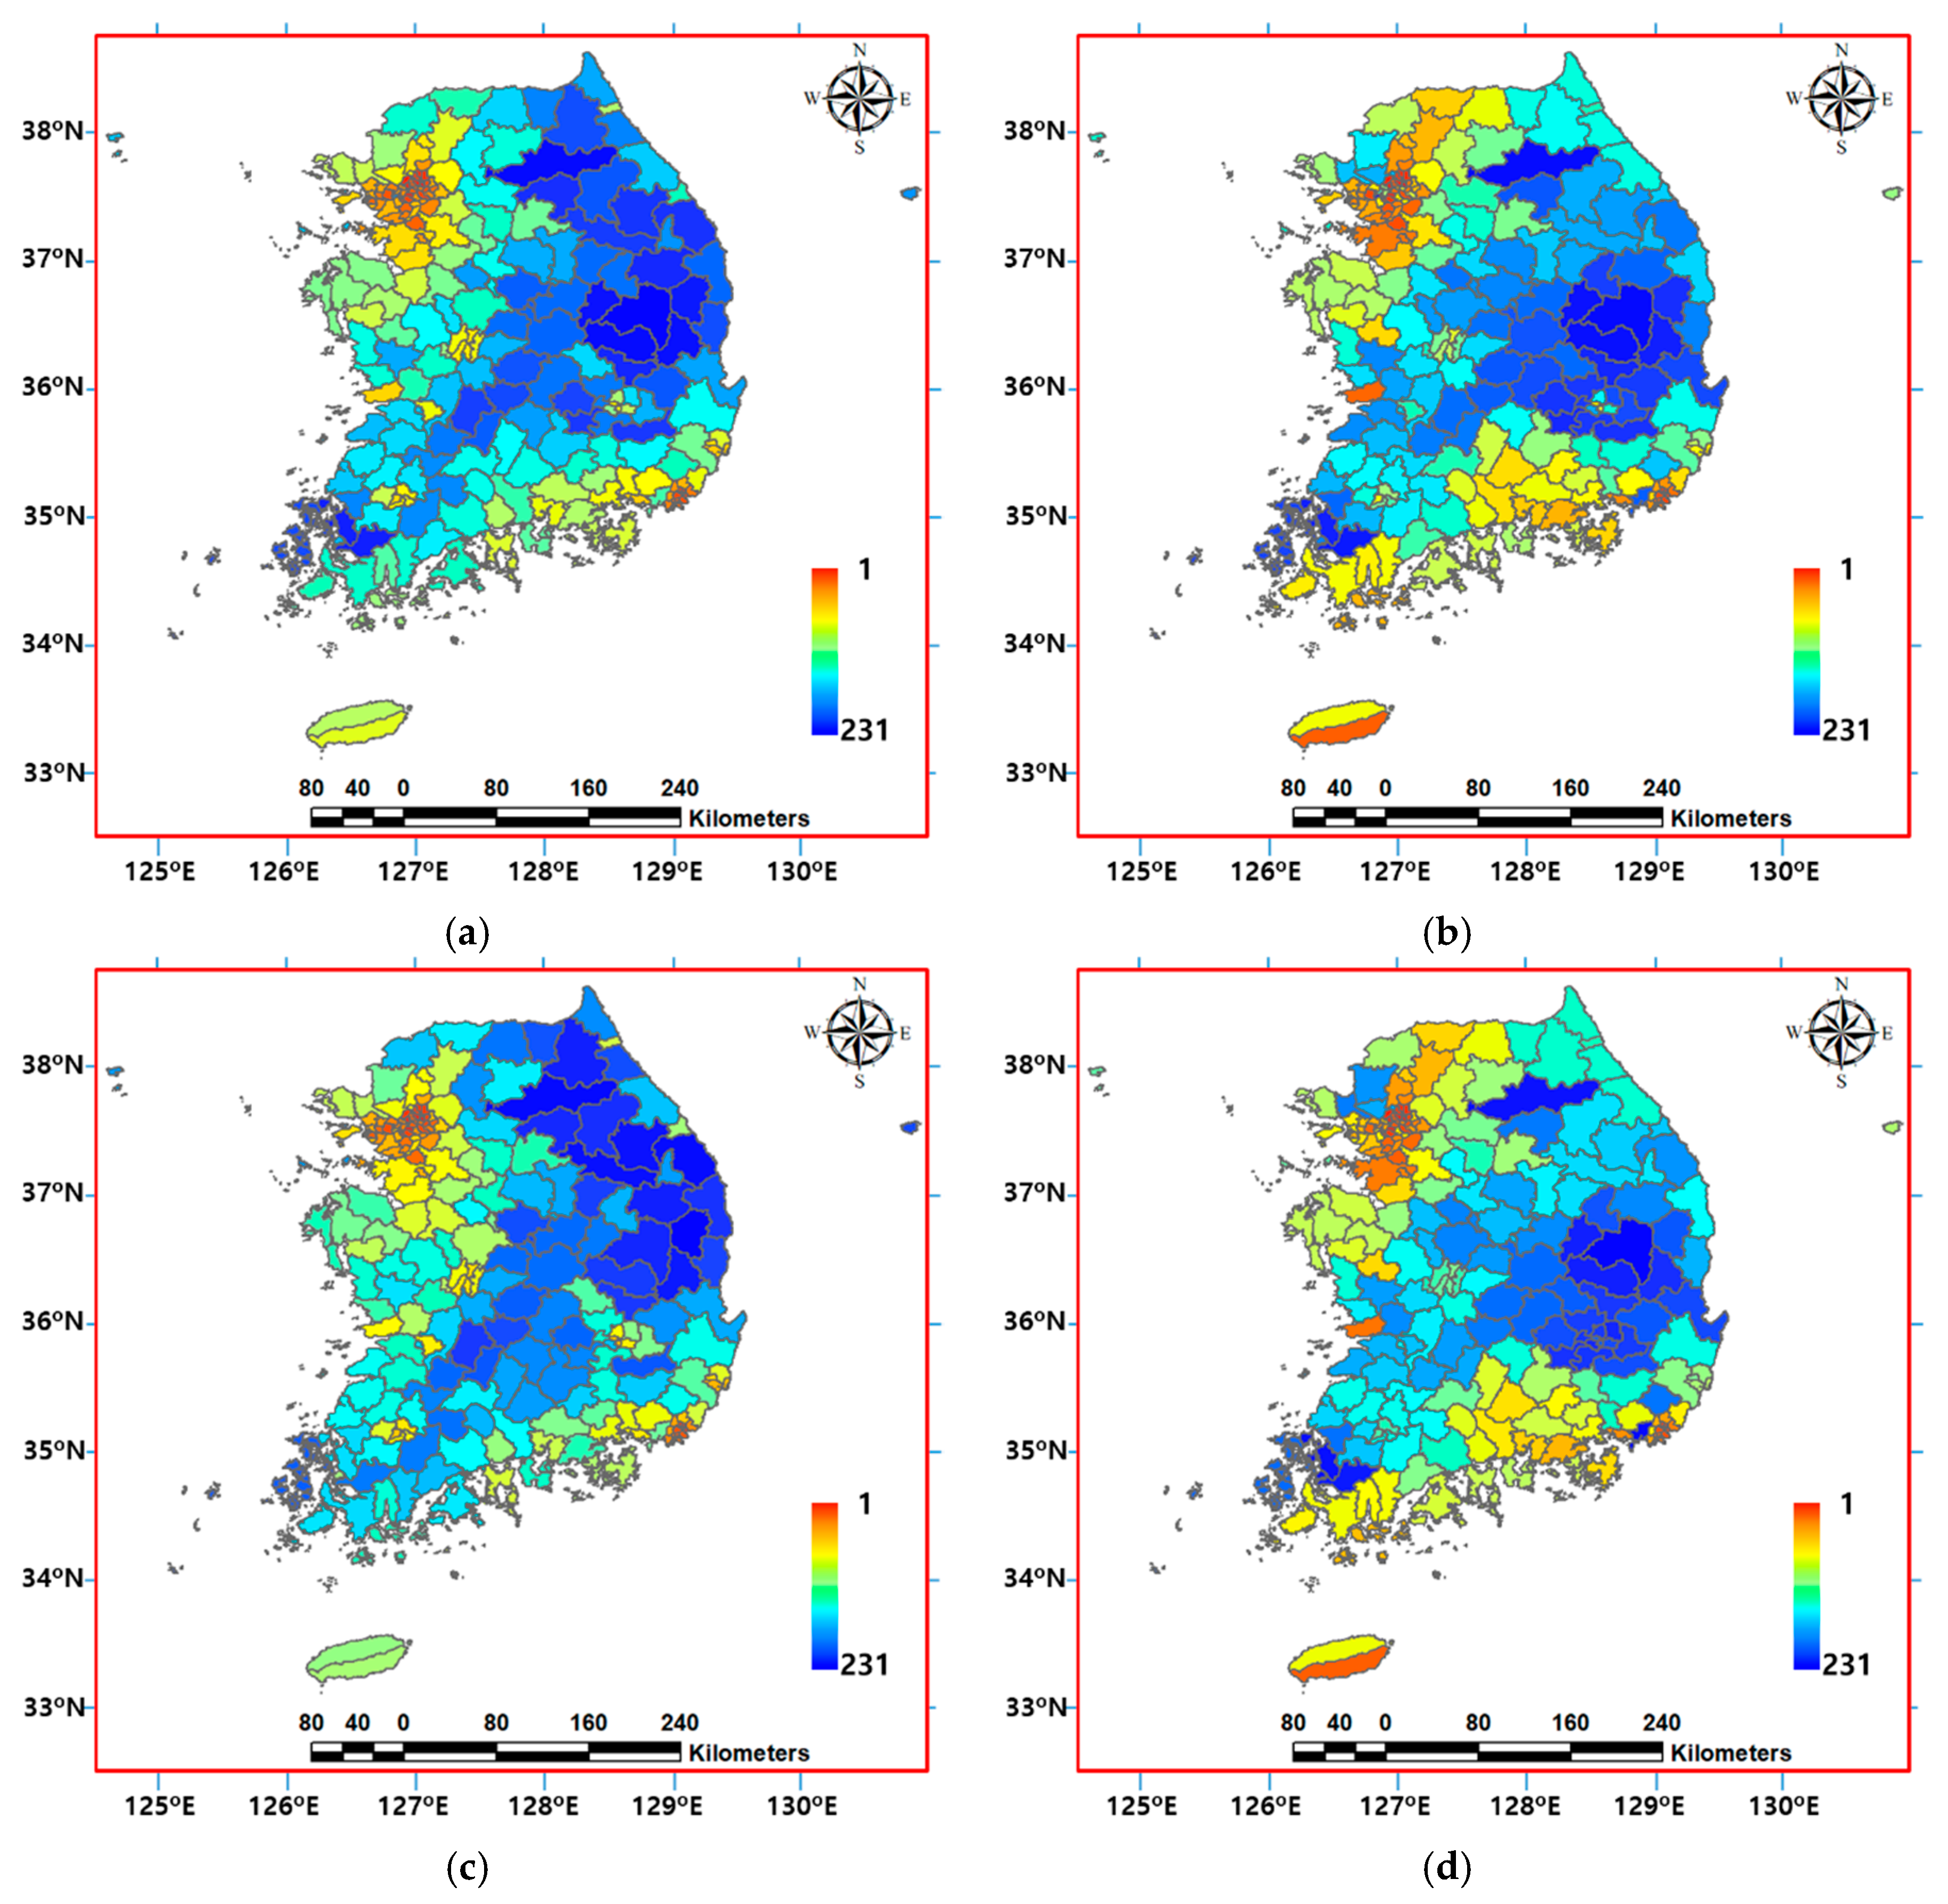
4.2. Flood Vulnerability Indicators

The flood vulnerability for the 231 administrative districts was ranked in descending order of vulnerability values for each indicator F V I 1 , F V I 2 , F V I 3 , and F V I 4 in order to compare the four flood vulnerability indicator outcomes across different aggregation frameworks in Equations (1)–(4). Figure 4 indicates that all four flood vulnerability indicators provided a common spatial pattern for relatively higher vulnerability outcomes in the northwestern part around the Seoul metropolitan area with large population and major facility densities and in the southern coast region more affected by typhoons. Figure 4 and Table 3 denote great similarities for the two pairs of flood vulnerability outcomes, between F V I 1 and F V I 3 both more highly correlated with sensitivity S, and between F V I 2 and F V I 4 both more highly correlated with exposure E, respectively.
For the interpretation of similarities between the two sets of each two flood vulnerability indicators, the framework of each flood vulnerability indicator was taken apart as the shared common element and the other different element, and then correlations were measured between heterogeneous portions of the two indicators producing similar flood vulnerability outcomes. The similarities of F V I 1 and F V I 3 could be interpreted by a high correlation between different elements of each other, such as E   ×   A and E + A respectively in F V I 1 and F V I 3 with the correlation coefficient of 0.910 as shown in Table 4. For the explication of similarities between F V I 2 and F V I 4 , the framework of F V I 2 could be expanded as ( S + E )   ×   A = S   ×   A   + E   ×   A , and the framework of F V I 4 could be expanded as ( S + A )   ×   E = S   ×   E   + E   ×   A . There was substantial identity with negligible differences between the flood vulnerability outcomes from each original framework and each expansion form. Hence, the similarities of F V I 2 and F V I 4 could be explained by a high correlation between different elements of each other, such as S   ×   A and S   ×   E respectively in F V I 2 and F V I 4 with the correlation coefficient of 0.833 as shown in Table 4. Such high similarities between the each two different indicators corresponded to a high correlation between even heterogeneous portions of the each two indicators. Meanwhile, the flood vulnerability indicators were more affected by the nested portions such that F V I 1 and F V I 3 were more correlated with sensitivity S, and F V I 2 and F V I 4 were more correlated with exposure E (or E   ×   A ) as denoted in Table 3.

5. Discussion and Conclusions

There have been four types of conventional aggregation frameworks for the IPCC’s assessment components in previous studies on the flood vulnerability assessments. The IPCC’s three assessment components are independently aggregated with equal weights for F V I 1 in Equation (1), or the potential impact as a function of exposure and sensitivity components is compiled with the lack of adaptability for F V I 2 in Equation (2), livelihood vulnerability as a sum of exposure and lack of adaptability is compiled with sensitivity for F V I 3 in Equation (3), or internal factor as an average of sensitivity and lack of adaptability is compiled with exposure for F V I 4 in Equation (4).
As for the data characteristics of the IPCC’s three primary components for the study site, the data distribution of the exposure component (by heavy rainy days and flooded area ratio) was relatively spread out over the study site while the other two components had skewed data distributions where the high level or low level values were concentrated in most metropolitan areas for sensitivity data (by vulnerable population and major facility densities) or lack of adaptability data (by emergency service density and drainage system capacity), respectively. In the comparison of the four flood vulnerability outcomes ranked corresponding to the composite indicator scores, there were great similarities for the two pairs of flood vulnerability indicators between F V I 1 and F V I 3 , and between F V I 2 and F V I 4 . The similarities of F V I 1 and F V I 3 were due to a high correlation between heterogeneous parts ( E   ×   A and E + A ) of the two different aggregation frameworks. Both E   ×   A and E + A outcomes were affected by exposure E , which was more sensitive than lack of adaptability A (values were over 80 in 75% of total districts). The similarities of F V I 2 and F V I 4 were due to a high correlation between heterogeneous parts ( S   ×   A and S   ×   E ) of the two different aggregation frameworks. Both S   ×   A and S   ×   E outcomes were affected by sensitivity S (values were under 30 in 75% of total districts), which was more sensitive than the lack of adaptability A or exposure E . The sensitivity component typically much higher in the metropolitan areas turned out to be a key factor that had the greatest effect on the flood vulnerability outcomes for the study site. It was interpreted that F V I 1 and F V I 3 where sensitivity can play a key role as an independent component were most highly correlated with sensitivity, while exposure could have the largest influence on F V I 2 and F V I 4 where sensitivity was combined with one of the other components as an intermediate component. According to the purpose and function of a flood vulnerability assessment for this study site, the sensitivity component may or may not be treated as the key driver for overall performance by deliberately selecting an aggregation framework. It should be of course explained for the reasons and needs in increasing or decreasing the relative importance of a certain assessment component in the composite indicator. In case this flood vulnerability assessment will be used to prioritize the investment in flood mitigation schemes for the study site, it is preferable to adopt the composite indicator outcomes F V I 2 or F V I 4 in which the exposure component is more influential than the sensitivity component. Accordingly, higher priority can be given more to the small and medium towns and cities that in general tend to have relatively fewer flood control facilities than metropolitan areas. A strong negative correlation between sensitivity and lack of adaptability indicators implies that most of metropolitan areas have higher emergency services and drainage systems in this study site.
As such, different aggregation frameworks can result in different vulnerability outcomes even under the use of all the same proxy variables. It is therefore necessary and important to carefully select an aggregation framework for the assessment components in the vulnerability assessments. The selection of a competent aggregation framework can be based on the correlation and causality analysis for identifying the relative contribution of assessment components to the overall composite indicator outcomes. As proposed in this study, a comparative analysis of various aggregation frameworks will prevent the composite indicator outcomes from providing misleading information of volatility or reversals in priority orders on policy and decision-making. Although the analysis presented in this study can provide the basis and information in the flood vulnerability assessments, it is also necessary for agreement and consensus of users and stakeholders in the final selection of the aggregation framework. This study carefully selects proxy variables relevant to individual components, and applies normalized scores between 1 and 100 and equal weights to all proxy variables, which can affect the vulnerability outcomes as well. There are limitations and drawbacks in vulnerability assessment studies especially for the selection of proxy variables and weights that can reflect their relative importance and influence on the overall vulnerability outcomes. It is more difficult to select appropriate proxy variables and weights when the availability of the desired data and the information of causal relationships are limited. Hence, further comparative analysis of various composite indicators needs to focus on other processes required for the vulnerability assessment, such as the selection of representative proxy variables, normalization methods for proxy variables measured at different scales and units, and weighting methods for proxy variables and assessment components, which can have influences on composite indicator outcomes.

Author Contributions

J.S.L. and H.I.C. conceived and designed the comparison of the conventional aggregation frameworks for flood vulnerability assessments. J.S.L. collected and constructed the proxy variables, and evaluated the flood vulnerability to climate change for the study site; H.I.C. analyzed the feature of composite indicator outcomes across different aggregation frameworks and wrote the manuscript draft.

Funding

This work was supported by the 2016 Yeungnam University Research Grant (216A380182).

Conflicts of Interest

The authors declare no conflict of interest.

References

  1. Intergovernmental Panel on Climate Change (IPCC). Climate Change 2001: Impacts, Adaptation, and Vulnerability. Contribution of Working Group II to the Third Assessment Report of the Intergovernmental Panel on Climate Change; McCarthy, J.J., Canziani, O.F., Leary, N.A., Dokken, D.J., White, K.S., Eds.; Cambridge University Press: Cambridge, UK; New York, NY, USA, 2001. [Google Scholar]
  2. Intergovernmental Panel on Climate Change (IPCC). Climate Change 2007: Synthesis Report. Contribution of Working Groups I, II and III to the Fourth Assessment Report of the Intergovernmental Panel on Climate Change; Core Writing Team, Pachauri, R.K., Reisinger, A., Eds.; IPCC: Geneva, Switzerland, 2007. [Google Scholar]
  3. Intergovernmental Panel on Climate Change (IPCC). Climate Change 2014: Synthesis Report. Contribution of Working Groups I, II and III to the Fifth Assessment Report of the Intergovernmental Panel on Climate Change; Core Writing Team, Pachauri, R.K., Meyer, L.A., Eds.; IPCC: Geneva, Switzerland, 2014. [Google Scholar]
  4. Stott, P.A.; Gillett, N.P.; Hegerl, G.C.; Karoly, D.J.; Stone, D.A.; Zhang, X.; Zwiers, F. Detection and attribution of climate change: A regional perspective. Wiley Interdiscip. Rev. Clim. Chang 2010, 1, 1–20. [Google Scholar] [CrossRef]
  5. Centre for Research on the Epidemiology of Disasters (CRED) & United Nations International Strategy for Disaster Reduction (UNISDR). Economic Losses, Poverty & Disasters, 1998–2017. 2018. Available online: https://www.unisdr.org/we/inform/publications/61119 (accessed on 1 May 2019).
  6. Intergovernmental Panel on Climate Change (IPCC). Managing the Risks of Extreme Events and Disasters to Advance Climate Change Adaptation. A Special Report of Working Groups I and II of the Intergovernmental Panel on Climate Change; Field, C.B., Barros, V., Stocker, T.F., Qin, D., Dokken, D.J., Ebi, K.L., Mastrandrea, M.D., Mach, K.J., Plattner, G.-K., Allen, S.K., et al., Eds.; Cambridge University Press: Cambridge, UK; New York, NY, USA, 2012. [Google Scholar]
  7. Associated Programme on Flood Management (APFM) Technical Support Unit. Integrated Flood Management. CONCEPT Paper. APFM Technical Document No.1, 2nd ed.; APFM: Geneva, Switzerland, 2004. [Google Scholar]
  8. Nehren, U.; Sudmeier-Rieux, K.; Sandholz, S.; Estrella, M.; Lomarda, M.; Guillén, T. The Ecosystem-Based Disaster Risk Reduction Case Study and Exercise Source Book; Partnership for Environment and Disaster Risk Reduction and Center for Natural Resources and Development: Geneva, Switzerland; Cologne, Germany, 2014. [Google Scholar]
  9. Van Der Most, H.; Marchand, M. Selecting Measures and Designing Strategies for Integrated Flood Management, A Guidance Document; World Meteorological Organization (WMO): Geneva, Switzerland, 2017. [Google Scholar]
  10. Nasiri, H.; Mohd Yusof, M.J.; Mohammad Ali, T.A. An overview to flood vulnerability assessment methods. Sustain. Water Resour. Manag. 2016, 2, 331–336. [Google Scholar] [CrossRef] [Green Version]
  11. Gallopín, G. Linkages between vulnerability, resilience, and adaptive capacity. Glob. Environ. Chang. 2006, 16, 293–303. [Google Scholar] [CrossRef]
  12. Adger, W.N. Social Aspects of Adaptive Capacity; Smith, J.B., Klein, R.J.T., Huq, S., Eds.; Climate Change, Adaptive Capacity and Development; Imperial College Press: London, UK, 2003. [Google Scholar]
  13. Balica, S.F.; Douben, N.; Wright, N.G. Flood vulnerability indices at varying spatial scales. Water. Sci. Technol. 2009, 60, 2571–2580. [Google Scholar] [CrossRef] [PubMed]
  14. Balica, S.F.; Wright, N.G.; Van Der Meulen, F. A flood vulnerability index for coastal cities and its use in assessing climate change impacts. Nat. Hazards 2012, 64, 73–105. [Google Scholar] [CrossRef] [Green Version]
  15. Dinh, N.Q.; Balica, S.; Popescu, I.; Jonoski, A. Climate change impact on flood hazard, vulnerability and risk of the Long Xuyen Quadrangle in the Mekong Delta. Int. J. River Basin Manag. 2012, 10, 103–120. [Google Scholar] [CrossRef]
  16. Weis, S.W.M.; Agostini, V.N.; Roth, L.M.; Schill, S.R.; Knowles, J.E.; Blyther, R. Assessing vulnerability: An integrated approach for mapping adaptive capacity, sensitivity, and exposure. Clim. Chang. 2016, 136, 615–629. [Google Scholar] [CrossRef]
  17. Yang, W.C.; Xu, K.; Lian, J.J.; Ma, C.; Bin, L.L. Integrated flood vulnerability assessment approach based on TOPSIS and Shannon entropy methods. Ecol. Indic. 2018, 89, 269–280. [Google Scholar] [CrossRef]
  18. Metzger, M.J.; Leemans, R.; SchroTer, D. A multidisciplinary multi-scale framework for assessing vulnerabilities to global change. Int. J. Appl. Earth Obs. Geoinf. 2005, 7, 267. [Google Scholar] [CrossRef]
  19. Jung, Y.; Kim, D.; Choi, M.; Kim, S.; Park, M. Vulnerability resilience in the major watersheds of the Korean Peninsula. Terr. Atmos. Ocean. Sci. 2014, 25, 857–868. [Google Scholar] [CrossRef]
  20. Chang, L.F.; Huang, S.L. Assessing urban flooding vulnerability with an emergy approach. Landsc. Urban Plan. 2015, 143, 11–24. [Google Scholar] [CrossRef]
  21. Chang, Y.T.; Lee, Y.; Huang, S. Integrated spatial ecosystem model for simulating land use change and assessing vulnerability to flooding. Ecol. Model. 2017, 362, 87–100. [Google Scholar] [CrossRef]
  22. Hahn, M.B.; Riederer, A.M.; Foster, S.O. The livelihood vulnerability index: A pragmatic approach to assessing risks from climate variability and change—A case study in Mozambique. Glob. Environ. Chang. 2009, 19, 74–88. [Google Scholar] [CrossRef]
  23. Korea Institute of Construction Technology (KICT). Water Vision 2020; Ministry of Land, Infrastructure and Transportation of Korea: Seoul, Korea, 2001. (In Korean) [Google Scholar]
  24. Shah, K.U.; Dulal, H.B.; Johnson, C.; Baptiste, A. Understanding livelihood vulnerability to climate change: Applying the livelihood vulnerability index in Trinidad and Tobago. Geoforum 2013, 47, 125–137. [Google Scholar] [CrossRef]
  25. Amoatey, P.; Sulaiman, H. Assessing the climate change impacts of cocoa growing districts in Ghana: The livelihood vulnerability index analysis. Environ. Dev. Sustain. 2018, 1–22. [Google Scholar] [CrossRef]
  26. Williams, P.A.; Crespo, O.; Abu, M. Assessing vulnerability of horticultural smallholders’ to climate variability in Ghana: Applying the livelihood vulnerability approach. Environ. Dev. Sustain. 2018, 1–22. [Google Scholar] [CrossRef]
  27. Sarker, M.N.I.; Wu, M.; Alam, G.M.M.; Shouse, R.C. Livelihood Vulnerability of Riverine-Island Dwellers in the Face of Natural Disasters in Bangladesh. Sustainability 2019, 11, 1623. [Google Scholar] [CrossRef]
  28. Birkmann, J.; Cardona, O.D.; Carreño, M.L.; Barbat, A.H.; Pelling, M.; Schneiderbauer, S.; Kienberger, S.; Keiler, M.; Alexander, D.; Zeil, P.; et al. Framing vulnerability, risk and societal responses: The move framework. Nat. Hazards 2013, 67, 193–211. [Google Scholar] [CrossRef]
  29. Depietri, Y.; Welle, T.; Renaud, F.G. Social vulnerability assessment of the Cologne urban area (Germany) to heat waves: Links to ecosystem services. Int. J. Disaster Risk Reduct. 2013, 6, 98–117. [Google Scholar] [CrossRef]
  30. Kablan, M.K.A.; Dongo, K.; Coulibaly, M. Assessment of social vulnerability to flood in urban Côte d’Ivoire using the MOVE framework. Water 2017, 9, 292. [Google Scholar] [CrossRef]
  31. Morimoto, T. Spatial analysis of social vulnerability to floods based on the MOVE framework and information entropy method: Case study of Katsushika Ward, Tokyo. Sustainability 2019, 11, 529. [Google Scholar]
  32. Welle, T.; Depietri, Y.; Angignard, M.; Birkmann, J.; Renaud, F.; Greiving, S. Vulnerability assessment to heat waves, floods, and earthquakes using the MOVE framework, Test Case Cologne, Germany. Assess. Vulnerabil. Nat. Hazards 2014, 91–124. [Google Scholar]
  33. Hagenlocher, M.; Renaud, F.G.; Haas, S.; Sebesvari, Z. Vulnerability and risk of deltaic social-ecological systems exposed to multiple hazards. Sci. Total Environ. 2018, 631–632, 71–80. [Google Scholar] [CrossRef] [PubMed]
  34. Lee, J.S.; Choi, H.I. Comparison of Flood Vulnerability Assessments to Climate Change by Construction Frameworks for a Composite Indicator. Sustainability 2018, 10, 768. [Google Scholar]
  35. Lee, J.S.; Choi, H.I. Influence of Construction Schemes for a Non-compensatory Composite Indicator on Flood Vulnerability Assessments in the Korean Peninsula. Int. J. Civ. Eng. 2018, 1–9. [Google Scholar] [CrossRef]
  36. Schröter, D.; Polsky, C.; Patt, A. Assessing vulnerabilities to the effects of global change: An eight step approach. Mitig. Adapt. Strateg. Glob. Chang 2005, 10, 573–595. [Google Scholar] [CrossRef]
  37. Turner, B.L.; Kasperson, R.E.; Matson, P.A.; McCarthy, J.J.; Corell, R.W.; Christensen, L.; Eckley, N.; Kasperson, J.X.; Luers, A.; Martello, M.L. A framework for vulnerability analysis in sustainability science. Proc. Natl. Acad. Sci. USA 2003, 100, 8074–8079. [Google Scholar] [CrossRef] [Green Version]
  38. Fritzsche, K.; Schneiderbauer, S.; Bubeck, P.; Kienberger, S.; Buth, M.; Zebisch, M.; Kahlenborn, W. The Vulnerability Sourcebook: Concept and Guidelines for Standardised Vulnerability Assessments; Deutsche Gesellschaft für: Bonn, Germany, 2014. [Google Scholar]
  39. Stathatou, P.M.; Kampragou, E.; Grigoropoulou, H.; Assimacopoulos, D.; Karavitis, C.; Porto, M.F.A.; Gironás, J.; Vanegas, M.; Reyna, S. Vulnerability of water systems: A comprehensive framework for its assessment and identification of adaptation strategies. Desalin. Water Treat. 2016, 57, 2243–2255. [Google Scholar] [CrossRef]
  40. Dzoga, M.; Simatele, D.; Munga, C. Assessment of ecological vulnerability to climate variability on coastal fishing communities: A study of Ungwana Bay and Lower Tana Estuary, Kenya. Ocean Coast Manag. 2018, 163, 437–444. [Google Scholar] [CrossRef]
  41. Okey, T.A.; Agbayani, S.; Alidina, H.M. Mapping ecological vulnerability to recent climate change in Canada’s Pacific marine ecosystems. Ocean Coast. Manag. 2015, 106, 35–48. [Google Scholar] [CrossRef]
  42. Johnson, J.E.; Welch, D.J.; Maynard, J.A.; Bell, J.D.; Pecl, G.; Robins, J.; Saunders, T. Assessing and reducing vulnerability to climate change: Moving from theory to practical decision-support. Mar. Policy 2016, 74, 220–229. [Google Scholar] [CrossRef]
  43. Rogers, B.M.; Jantz, P.; Goetz, S.J. Vulnerability of eastern US tree species to climate change. Glob. Chang Biol. 2017, 23, 3302–3320. [Google Scholar] [CrossRef] [PubMed]
  44. Holmes, D.; Croot, D. Top Spec Geography: Flood Risk and Management; Geographical Association: Sheffield, UK, 2010; ISBN 978-1-84377-302-3. [Google Scholar]
  45. Walker, B.; Holling, C.S.; Carpenter, S.; Kinzig, A. Resilience, adaptability and transformability in social-ecological systems. Ecol. Soc. 2004, 9, 5. [Google Scholar] [CrossRef]
  46. Organisation for Economic Co-Operation and Development (OECD). The OECD-JRC Handbook on Practices for Developing Composite Indicators. In Proceedings of the OECD Committee on Statistics, Paris, France, 7–8 June 2004. [Google Scholar]
  47. Ghimire, U.; Babel, M.S.; Shrestha, S.; Srinivasan, G. A multi-temporal analysis of streamflow using multiple CMIP5 GCMs in the Upper Ayerawaddy Basin, Myanmar. Clim. Chang. 2019. [Google Scholar] [CrossRef]
  48. Dulal, H.B.; Brodnig, G.; Thakur, H.K.; Green-Onoriose, C. Do the poor have what they need to adapt to climate change? A case study of Nepal. Local Environ. 2010, 15, 621–635. [Google Scholar] [CrossRef]
  49. Korea Meteorological Administration. Available online: http://www.kma.go.kr (accessed on 1 May 2019).
  50. Ministry of the Interior and Safety. Disaster Yearbook 2011; Ministry of the Interior and Safety: Sejong, Korea, 2012. (In Korean)
  51. Statistics Geographic Information Service. Available online: https://sgis.kostat.go.kr (accessed on 1 May 2019).
  52. Korea Meteorological Society (KMS). Glossary of Atmospheric Science; KMS: Seoul, Korea, 2015. (In Korean)
  53. Thiessen, A.H. Precipitation averages for large areas. Mon. Weather Rev. 1911, 39, 1082–1084. [Google Scholar] [CrossRef]
  54. National Disaster Information Center. Available online: http://www.safekorea.go.kr (accessed on 1 May 2019).
  55. Korean Statistical Information Service. Available online: http://kosis.kr/index/index.do (accessed on 1 May 2019).
  56. National Environment Information Network System. Available online: http://www.neins.go.kr (accessed on 1 May 2019).
  57. Ministry of Environment. Sewerage Statistics Report 2017; Ministry of Environment: Seoul, Korea, 2017. (In Korean)
Figure 1. The location map of the study site with administrative districts in the Republic of Korea.
Applsci 09 02321 g001
Figure 2. Spatial distribution of the primary and intermediate assessment components for the study site: (a) Exposure E; (b) sensitivity S; (c) lack of adaptability A; (d) potential impact PI; (e) livelihood vulnerability LV; and (f) internal factor IF.
Applsci 09 02321 g002
Figure 3. Box and whisker diagrams for data distribution characteristics of primary components (exposure E, sensitivity S, and lack of adaptability A), and intermediate components (potential impact PI, livelihood vulnerability LV, and internal factor IF) for the study site.
Applsci 09 02321 g003
Figure 4. Spatial distribution of the four flood vulnerability outcomes for the study site: (a) Raking orders from F V I 1 ; (b) raking orders from F V I 2 ; (c) raking orders from F V I 3 ; and (d) raking orders from F V I 4 .
Applsci 09 02321 g004
Table 1. The proxy variables selected for the flood vulnerability assessment in the three primary components, exposure, sensitivity, and adaptability, based on the concept of the IPCC [1].
Primary ComponentsIntermediate ComponentsProxy VariablesUnits
ExposurePotential Impact-Livelihood VulnerabilityHeavy rainy daysDays
Flooded area ratiokm2/km2
SensitivityPotential ImpactInternal Factor-Children and elderly population densitypeople/km2
Major facilities and infrastructure densitykm2/km2
Adaptability-Internal FactorLivelihood VulnerabilityEmergency service densitynumber/km2
Drainage system capacitym3/min
Table 2. The comparison of relationships between primary components (exposure E, sensitivity S, and lack of adaptability A), and relationships of each primary component to intermediate components (potential impact PI, livelihood vulnerability LV, and internal factor IF), measured by the coefficient of correlation.
IndicatorESA
E-0.519−0.396
S0.519-−0.697
A−0.396−0.697-
PI0.8470.894−0.641
LV0.596−0.1200.501
IF0.2890.6280.120
Table 3. The comparison of relationships between each two different flood vulnerability indicators, and between flood vulnerability indicators and primary assessment components, measured by the coefficient of correlation.
F V I 1 F V I 2 F V I 3 F V I 4 ESA
F V I 1 -0.8760.9790.8560.7510.847−0.441
F V I 2 --0.7900.9370.8290.586−0.135
F V I 3 ---0.7880.6660.899−0.480
F V I 4 -- -0.9020.619−0.201
Table 4. The causality analysis of similarities between the two pairs of flood vulnerability indicators, F V I 1   and   F V I 3   and F V I 2   and   F V I 4   by the coefficient of correlation for heterogeneous portions of each pair of flood vulnerability indicators.
IndicatorFrameworkComparison PartCoefficient of Correlation
FVI1(E × A) × SE × A and E + A0.910
FVI3(E + A) × S
FVI2(S + E) × AS × A and S × E0.833
FVI4(S + A) × E

