Article

Fatigue Assessment of Prestressed Concrete Slab-Between-Girder Bridges

1
Politécnico, Universidad San Francisco de Quito, Quito 17015EC, Ecuador
2
Concrete Structures, Delft University of Technology, 2628 CN Delft, The Netherlands
3
BAM Infraconsult, 2801 SC Gouda, The Netherlands
4
Rijkswaterstaat, Ministry of Infrastructure and the Environment, 3526 LA Utrecht, The Netherlands
*
Author to whom correspondence should be addressed.
Appl. Sci. 2019, 9(11), 2312; https://doi.org/10.3390/app9112312
Submission received: 25 April 2019 / Revised: 27 May 2019 / Accepted: 1 June 2019 / Published: 5 June 2019
(This article belongs to the Special Issue Fatigue and Fracture of Non-metallic Materials and Structures)

Abstract

:

Featured Application

The results of this work can be used in the evaluation of existing prestressed concrete slab-between-girder bridges for fatigue.

Abstract

In the Netherlands, the assessment of existing prestressed concrete slab-between-girder bridges has revealed that the thin, transversely prestressed slabs may be critical for static and fatigue punching when evaluated using the recently introduced Eurocodes. On the other hand, compressive membrane action increases the capacity of these slabs, and it changes the failure mode from bending to punching shear. To improve the assessment of the existing prestressed slab-between-girder bridges in the Netherlands, two 1:2 scale models of an existing bridge, i.e., the Van Brienenoord Bridge, were built in the laboratory and tested monotonically, as well as under cycles of loading. The result of these experiments revealed: (1) the static strength of the decks, which showed that compressive membrane action significantly enhanced the punching capacity, and (2) the Wöhler curve of the decks, showed that the compressive membrane action remains under fatigue loading. The experimental results could then be used in the assessment of the most critical existing slab-between-girder bridges. The outcome was that the bridge had sufficient punching capacity for static and fatigue loads and, therefore, the existing slab-between-girder bridges in the Netherlands fulfilled the code requirements for static and fatigue punching.

1. Introduction

The majority of the bridges in the Dutch highway bridge stock were built in the decades following World War II, and this post-war period was an era of rapid and extensive expansion of the Dutch road network. These bridges were designed for the live loads of that era, which resulted in lower demands on the bridges compared to the recently introduced Eurocode live loads from the NEN-EN 1991-2:2003 standard [1]. In terms of capacity, the design capacities for shear and punching in the previously used Dutch codes (e.g., VBC 1995-NEN 6723 [2]) were larger than the capacities determined using the recently introduced Eurocode for concrete structures NEN-EN 1992-1-1:2005 [3]. With these higher demands and lower capacities according to the Eurocodes, the outcome of a bridge assessment is often that existing bridges will not meet the code requirements for brittle failure modes, such as shear [4] and punching [5]. This problem is not limited to the Netherlands, as similar discussions are taking place in Germany [6], Sweden [7], Switzerland [8], and other European countries, as well as in the United States [9], where bridge construction peaked during the 1930s (the New Deal) and between 1956 and 1992 (i.e., the construction of the Interstate Highway System). As one can see, the methods used for an accurate assessment of existing bridges are becoming increasingly important, as the safety of the traveling public should be protected, and at the same time, unnecessary bridge replacements or strengthening actions should be avoided [10].
The preliminary assessment of existing bridges in the Netherlands according to the new Eurocodes was based on hand calculations (Quick Scans [11,12]), where the categories of bridge types that required further study were identified. One such category is the prestressed slab-between-girder bridges; this subset contains about 70 bridges [5]. The structural system of these bridges is a combination of prestressed girders with the deck slab cast in between the girders and is transversely prestressed. As a result, the top of the flange of the girders is flush with the top of the deck. Additionally, prestressed diaphragm beams provide stiffness to the overall system. Upon assessment, the thin deck slabs did not fulfil the code requirements for punching shear. One mechanism that is not considered in the codes, but that enhances the capacity of these thin decks, is the compressive membrane action [13,14,15,16,17,18,19,20]. Additionally, the fatigue capacity of the thin decks is still subject to discussion, as it remains unknown whether progressive cracking and damage accumulation affect the capacity-enhancing effect of the compressive membrane action [21].
This work summarized the experimental results from testing 1:2 scale models of prestressed slab-between-girder bridges, and then it applied these results to the punching and fatigue assessment of an existing bridge. We demonstrated how compressive membrane action improves the assessment for punching shear, and how the Wöhler curve from the fatigue tests could be used for the assessment of the bridge deck under fatigue. The summarized experiments are unique in nature, as the tested specimens give us insights into the behavior of slab-between-girder bridges as a structural system. Most fatigue testing in the past has focused on testing small specimens [22,23] or structural elements [24,25,26,27,28,29,30,31], instead of the structural systems. The insights from these experiments are reported in this study for the first time within the context of bridge assessment. This analysis showed that, based on the experimental evidence, we found that the existing slab-between-girder bridges in the Netherlands satisfied the safety requirements of the code, and in particular, the requirements for punching shear under static and fatigue live loading.

2. Materials and Methods

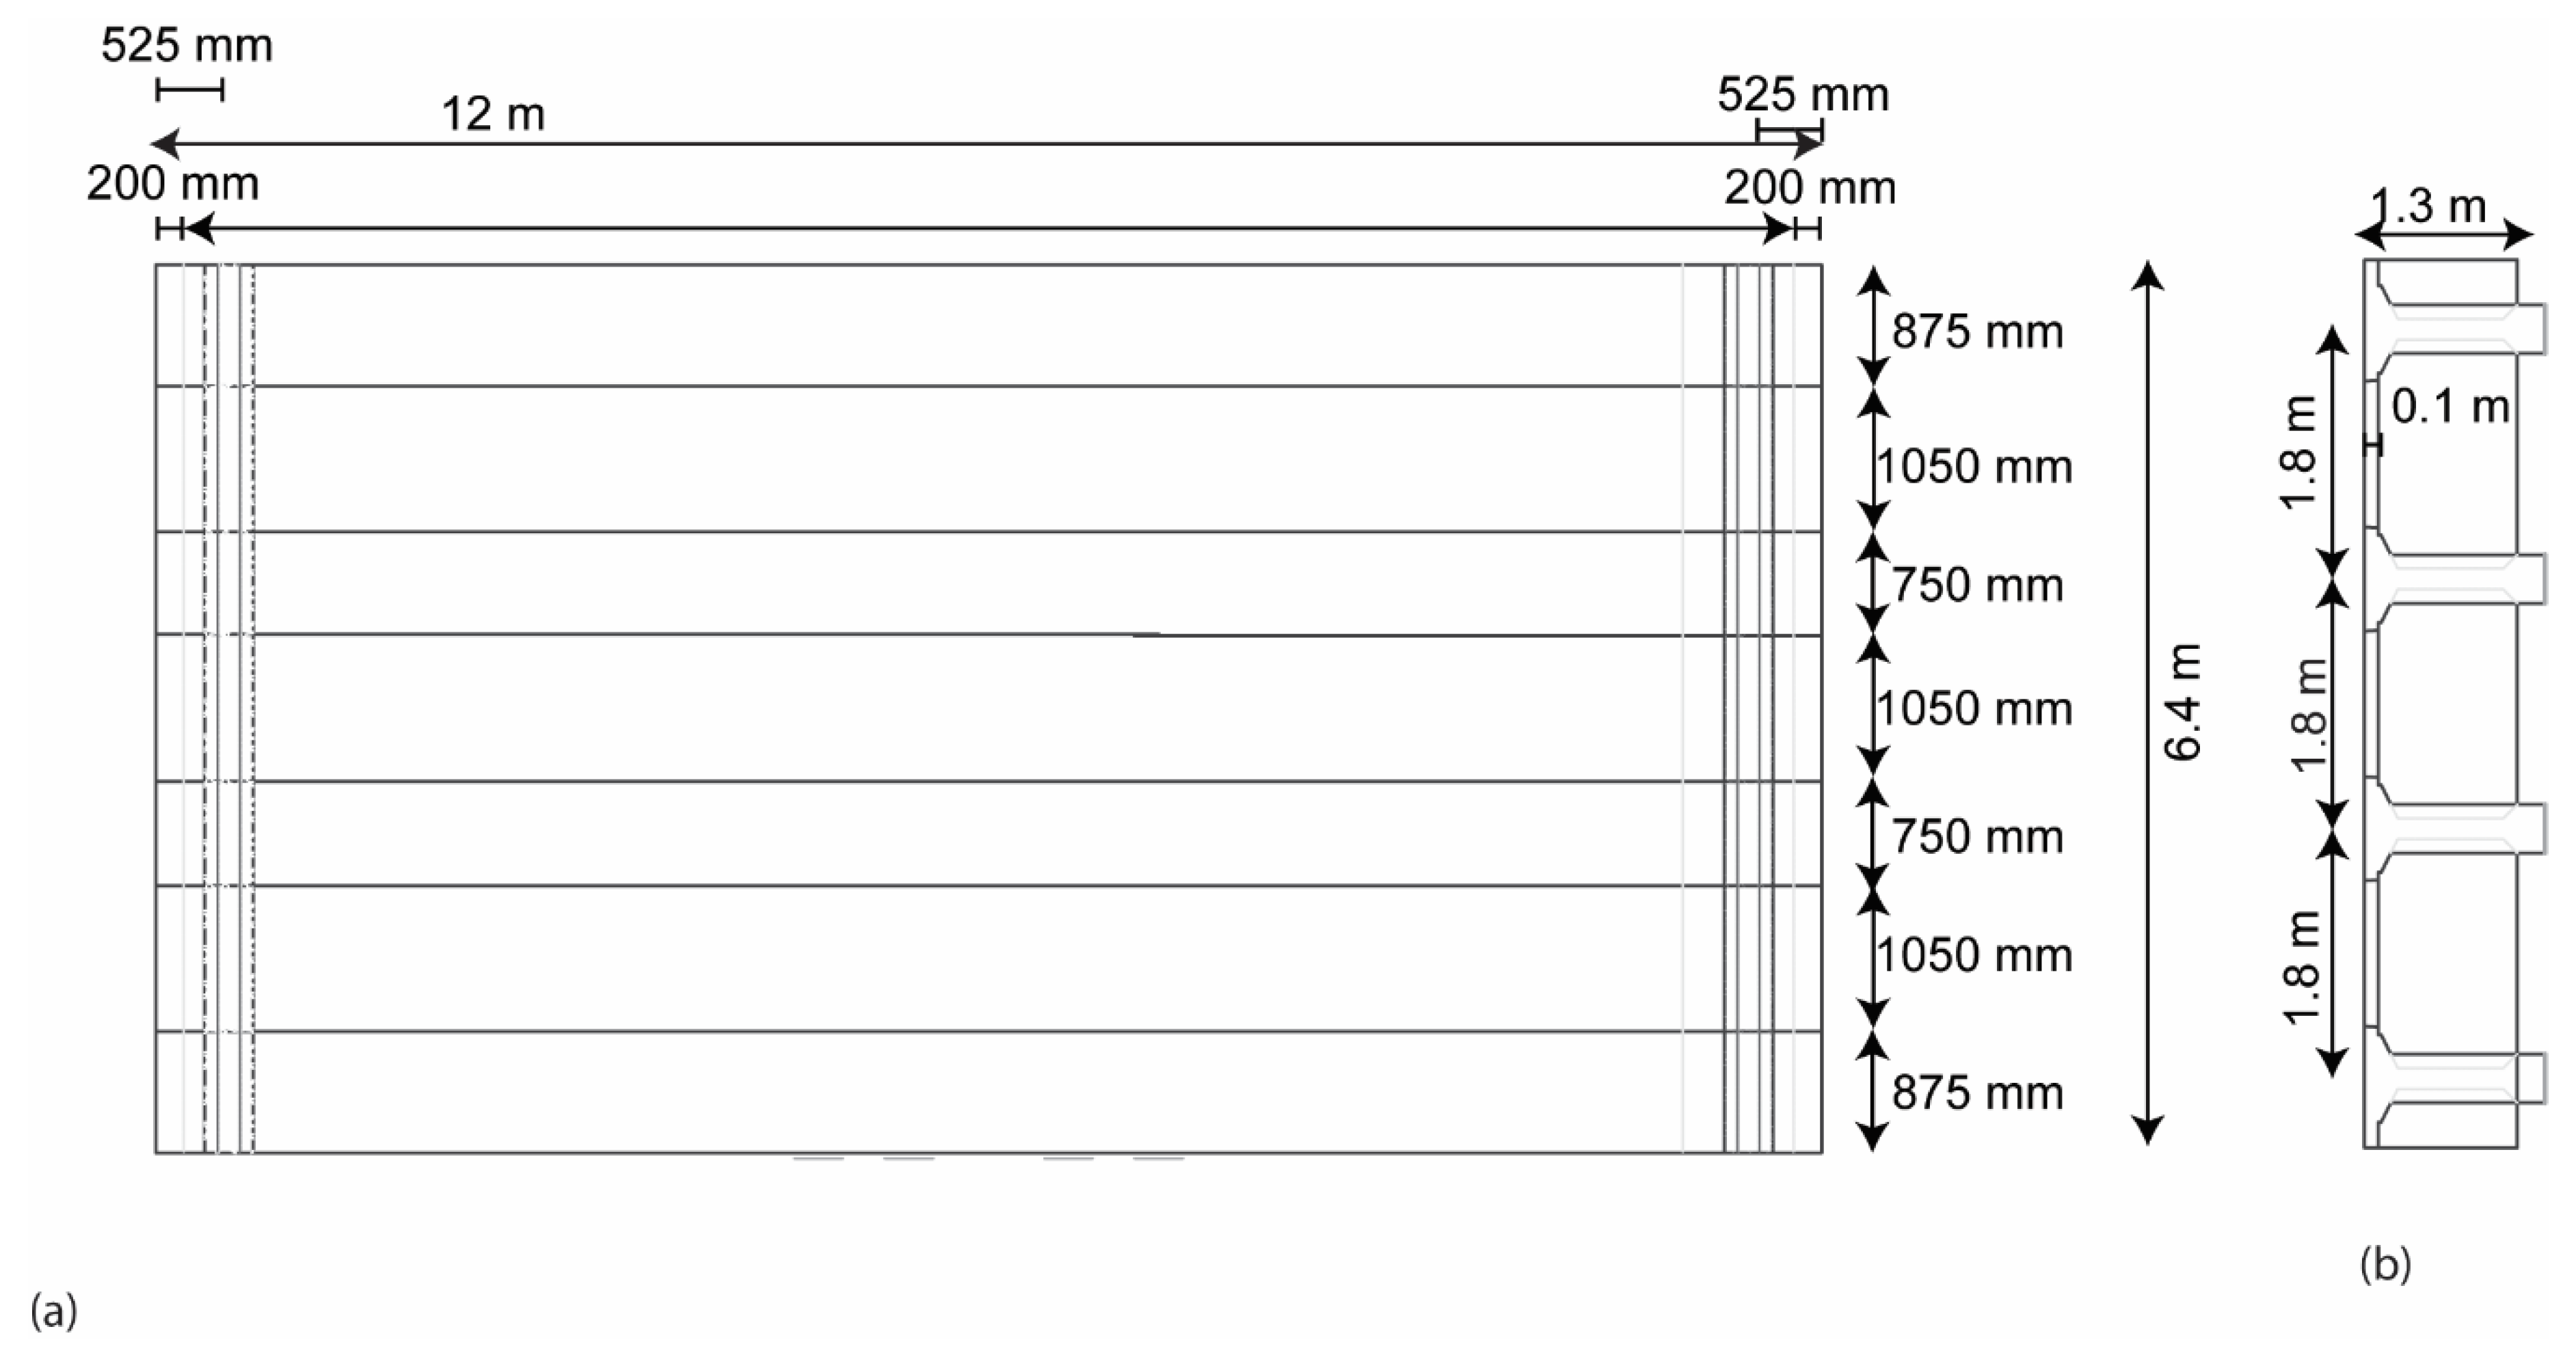
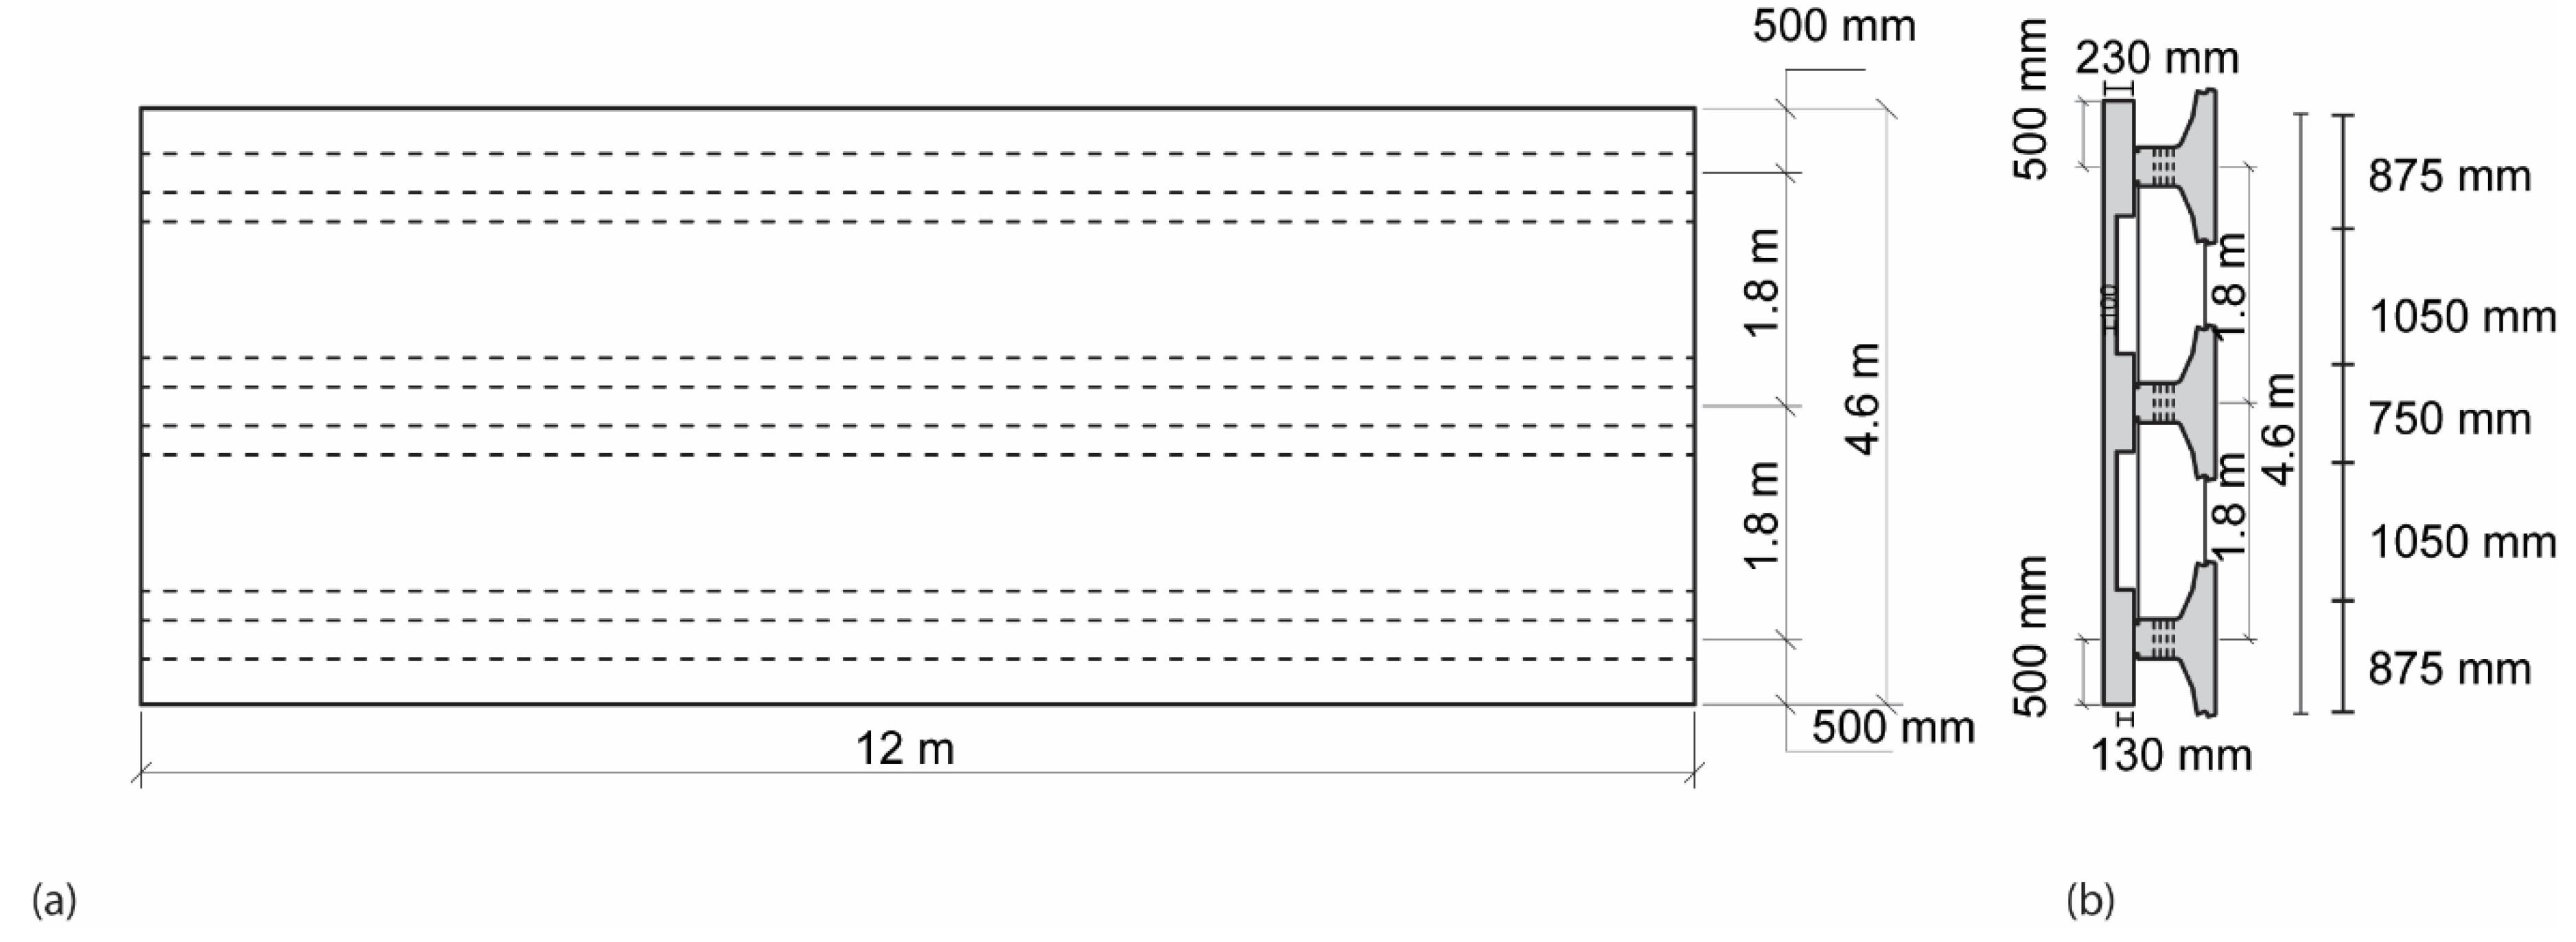
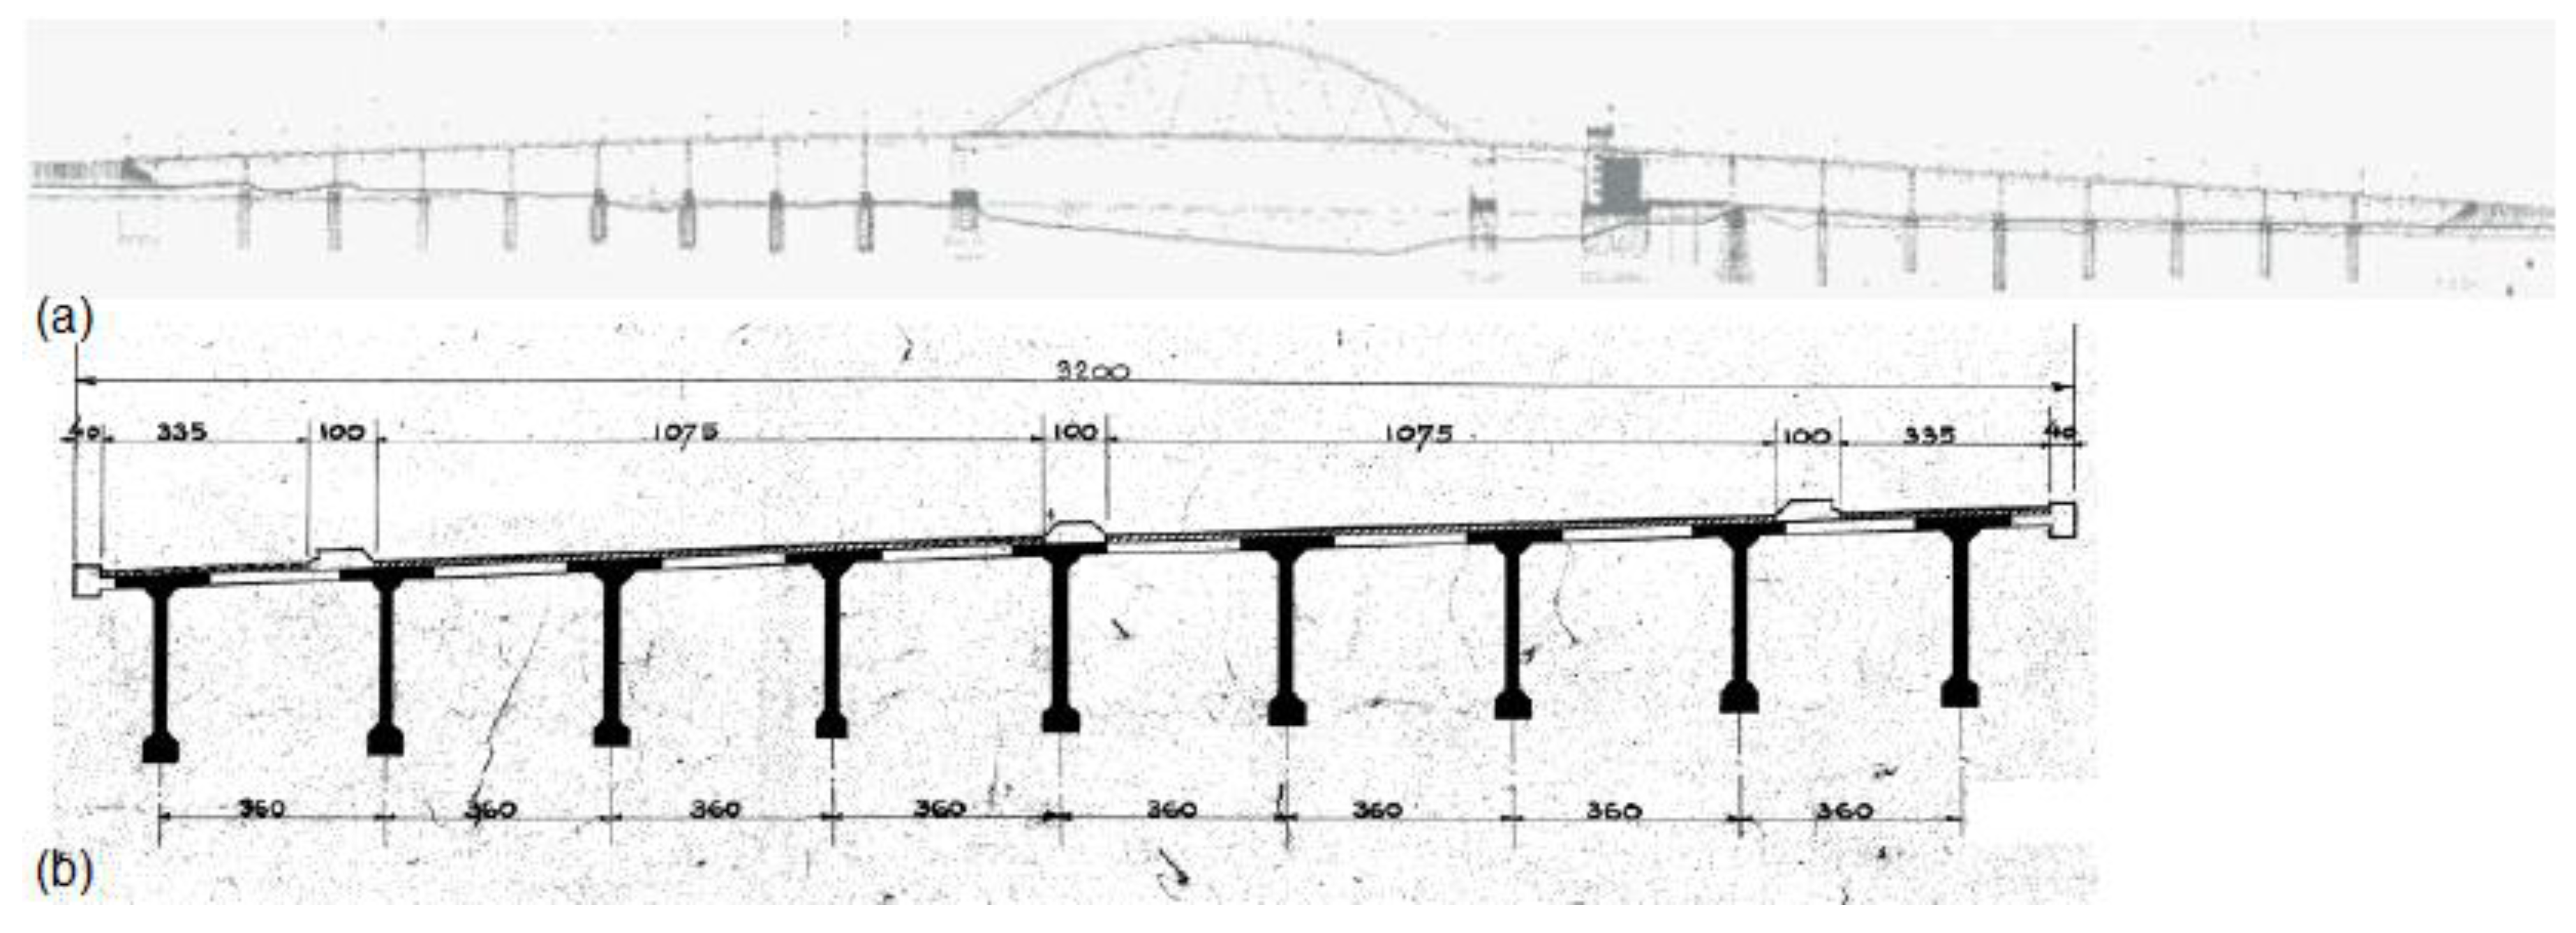
2.1. Description of Case Study Bridge

Of the 70 slab-between-girder bridges in the Netherlands, the bridge that has the most critical slab geometry (largest span to depth ratio of 3.6 m/0.2 m = 18) is the approach bridge of the Van Brienenoord Bridge in Rotterdam, see Figure 1a. The approach spans are 50 m in length and consist of thin, transversely post-tensioned decks that are cast between simply supported post-tensioned girders, see Figure 1b [13]. The clear span of the slab is 2100 mm. The transverse prestressing level is 2.5 MPa. The duct spacing on the deck is 650 mm at the center, and at some positions it is increased to 800 mm at the center. Table 1 gives the main properties of the geometry and reinforcement of the decks. Post-tensioned crossbeams are built at the end of the spans and post-tensioned diaphragm beams are provided at 1/3 and 2/3 of the span length.
At the time of construction, the design concrete compressive strength of the deck was B35 (fck,cube = 35 MPa) and B45 (fck,cube = 45 MPa) for the girders. Testing of the cores taken from the deck slab resulted in an average fcm,cube = 98.8 MPa (fck,cube = 84.6 MPa), as a result of the continued cement hydration. For the assessment calculations, we conservatively assumed that the mean compressive cylinder strength fcm = 65 MPa on the deck. The associated characteristic concrete compressive strength was fck = 53 MPa.

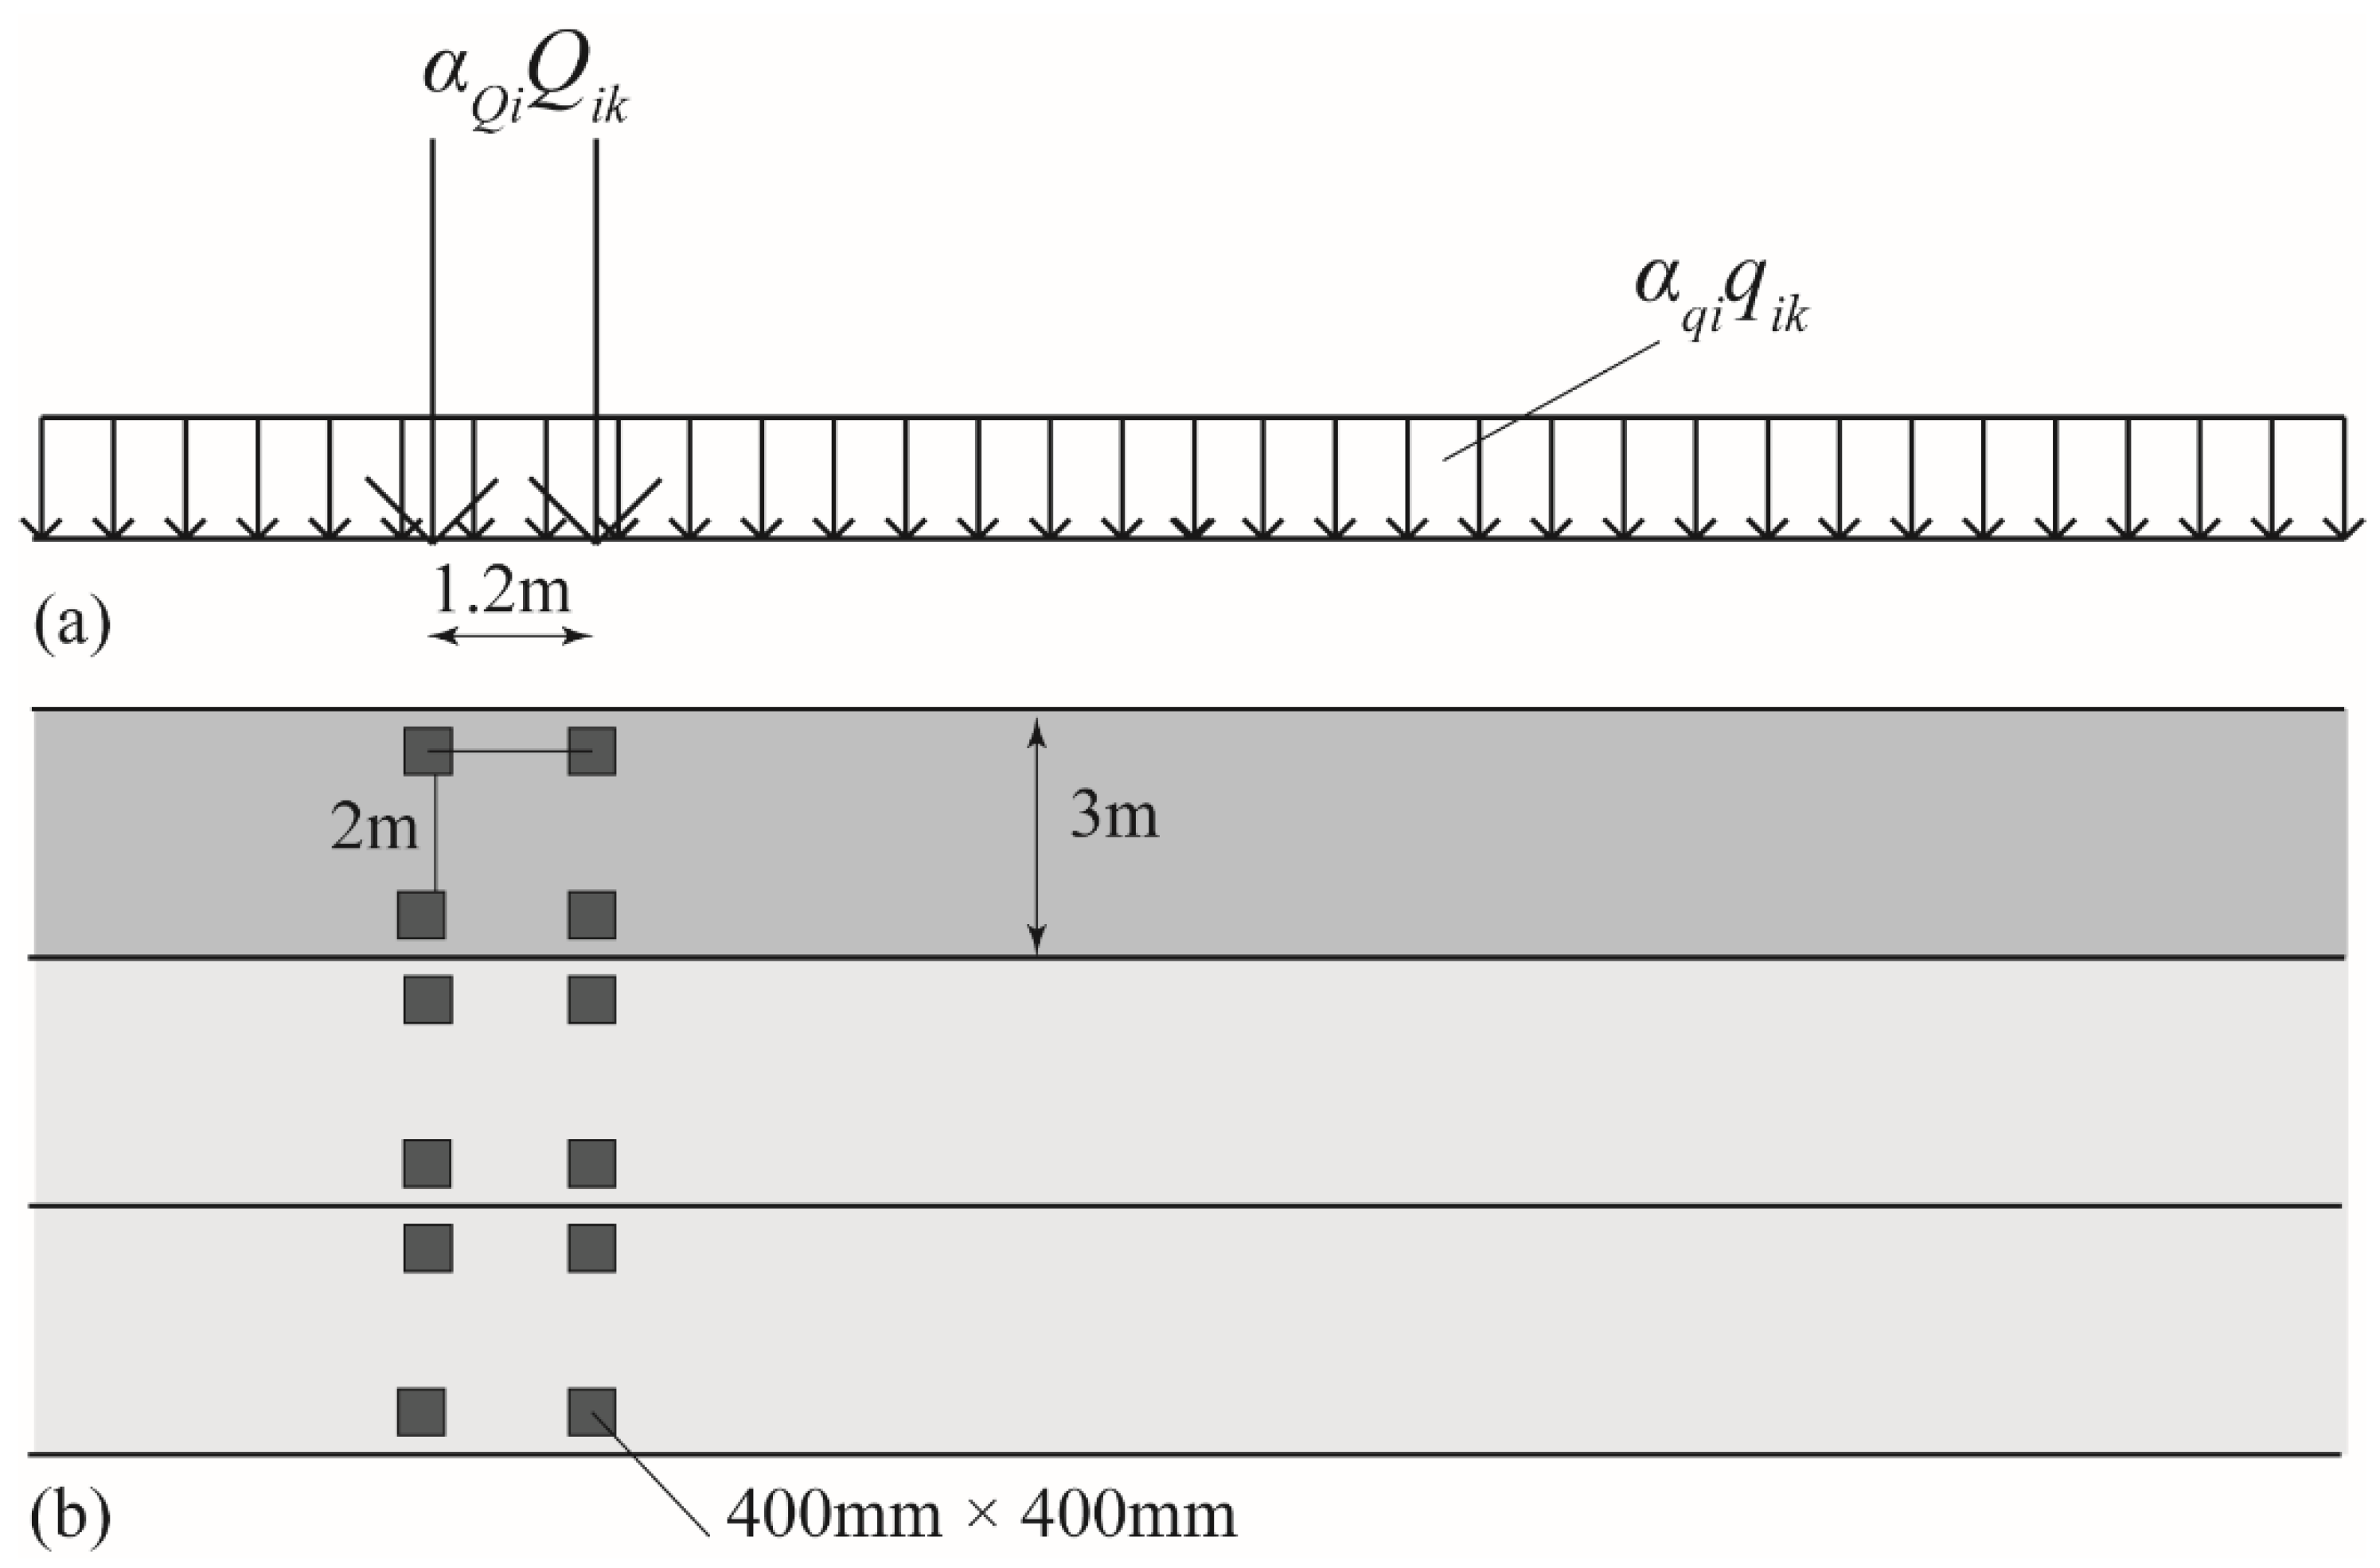
2.2. Live Load Models

We used two live load models for the assessment of the Van Brienenoord Bridge: Load model 1, for the assessment of the punching capacity, and fatigue load model 1, for the fatigue assessment, both adapted from the NEN-EN 1991-2:2003 [1].
Live load model 1 combines a distributed lane load with a design tandem. The design tandem has the following characteristics: (1) wheel print of 400 mm × 400 mm, (2) axle distance of 1.2 m, and (3) transverse spacing between wheels of 2 m. The magnitude of the axle load is αQ1 × 300 kN in the first lane, αQ2 × 200 kN in the second lane, and αQ3 × 300 kN in the third lane [12]. For the Netherlands, the values of all the αQi = 1, with i = 1 … 3. The uniformly distributed load acts over the full width of the notional lane of 3 m width, and it equals αq1 × 9 kN/m2 for the first lane, and αqi × 2.5 kN/m2 for all the other lanes. In the Netherlands, for bridges with three or more notional lanes, the value of αq1 = 1.15 and αqi = 1.4, with i > 1. Figure 2 shows a sketch of the live load model 1.
Fatigue load model 1 has the same configuration as load model 1, with 0.7Qik for the axle loads, and 0.3qik for the distributed lane loads. In other words, the axle load becomes 0.7 × 300 kN = 210 kN, and the load per wheel print becomes 105 kN. The distributed lane load is 0.3 × 1.15 × 9 kN/m2 = 3.105 kN/m2. The fatigue load model has as a reference load of 2 million trucks per year. In the Netherlands, the guidelines for the assessment of bridges (RBK [32]) uses a higher number of passages: 2.5 million trucks per year. Over a lifespan of 100 years, the result is 250 million truck passages.
In the Netherlands, assessment is carried out using both a wheel print of 400 mm × 400 mm (as prescribed by the Eurocode 1 NEN-EN 1991-2:2003 [1]) and a wheel print of 230 mm × 300 mm (used for the fatigue evaluation of joints, but also often used as an additional check in assessments).

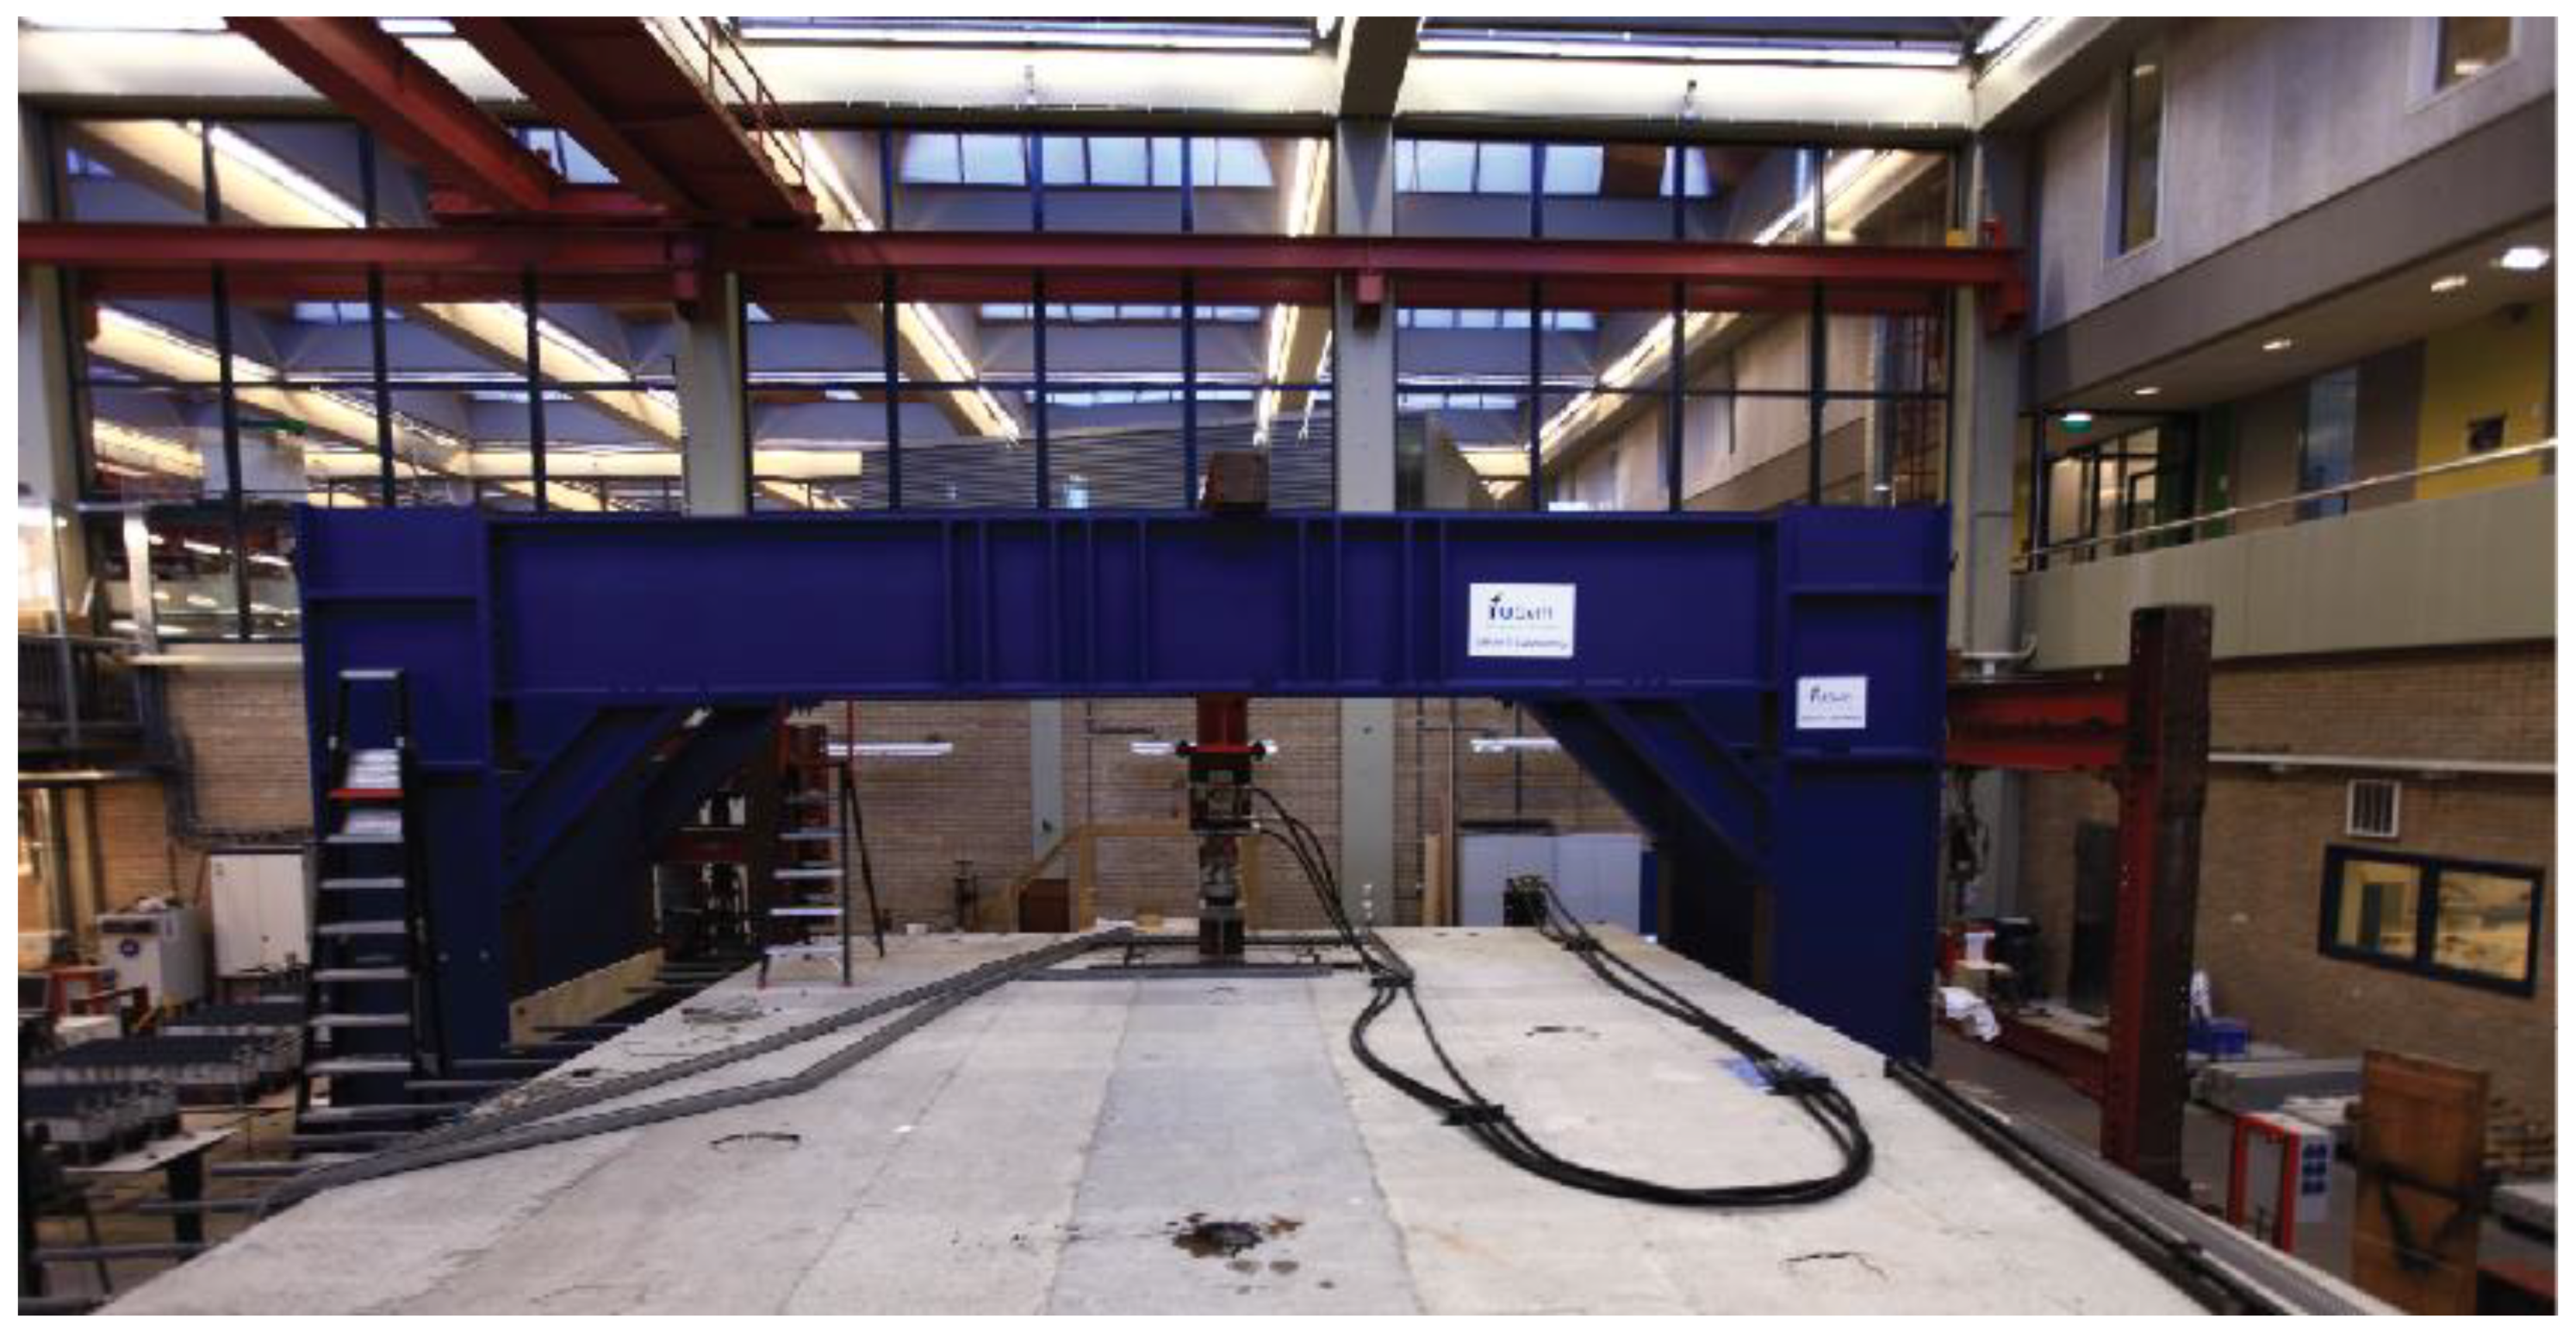
2.3. Description of Experiments

We built two 1:2 scale models of an existing bridge in the laboratory, which we tested monotonically, as well as under cycles of loading. Full descriptions of the first series of static tests [5,13], first series of fatigue tests [33,34,35], and second series of fatigue tests [36,37] can be found elsewhere. The description in this paper was limited to the information necessary to interpret the test results for application in assessment of the case study bridge.
The first 1:2 scale model (6.4 m × 12 m, see Figure 3) used four prestressed concrete T-girders with a center-to-center spacing of 1.8 m, length l = 10.95 m, and height h = 1.3 m; two post-tensioned crossbeams (b = 350 mm, h = 810 mm), and three transversely post-tensioned decks with h = 100 mm and b = 1050 mm between the girders. The choice of the size of the scale model and number of girders was determined as a function of the available test floor space in the laboratory. The post-tensioning of the deck was applied through prestressing bars placed in 30 ducts with a 40 mm diameter, and spaced 400 mm apart. To increase the number of experiments that could be carried out on this scale model, the middle deck was removed after testing and a new deck was cast. Therein, one segment of the new deck contained ducts of diameter 30 mm that were spaced 300 mm apart to study the influence of the duct spacing.
The second 1:2 scale model (4.6 m × 12 m, see Figure 4) used three prestressed concrete bulb T-girders and two post-tensioned decks. The dimensions of the girders, crossbeams, and decks were similar to the dimensions for the first 1:2 scale model, with the exception of the shape of the girders (T-girders in the first scale model and bulb T-girders in the second scale model). For the second scale model, the top flange of the girders was cast in the laboratory, monolithically with the deck. The advantage of this approach was that the weight of the girders was reduced, which facilitated transportation and handling.
Standard cube specimens were used to determine the concrete compressive strength for the concrete of the different casts. The results for the 28 days strength were as follows: fcm,cube = 75 MPa for the original slab in setup 1, fcm,cube = 68 MPa for the newly cast slab in setup 1, fcm,cube = 81 MPa for the first cast of setup 2, and fcm,cube = 79 MPa for the second cast of setup 2.
Mild steel reinforcement is used for the longitudinal and transverse reinforcement in the deck slabs. In setup 1, the longitudinal reinforcement was φ = 6 mm at 200 mm o.c. top and bottom, and the transverse reinforcement was φ = 6 mm at 250 mm o.c. top and bottom. In setup 2, the longitudinal reinforcement was φ = 8 mm at 200 mm o.c. top and bottom, and the transverse reinforcement was φ = 8 mm at 240 mm o.c. top and bottom. The clear cover to the reinforcement was 7 mm. The mild steel reinforcement in the setups was B500B steel, except for the bars of a 6 mm diameter, for which B500A steel was used. Stress–strain curves of the mild steel for all the bar diameter were measured in the laboratory, see References [33,36].
The prestressing steel in the girders were Y1860S tendons, and the prestressing steel in the crossbeams and slabs were Y1100H prestressing bars with a diameter of 15 mm. The transverse prestressing in the deck resulted in an axial compressive stress of 2.5 MPa.
The size of the concentrated load in the experiments was 200 mm × 200 mm for the experiments on the original first setup, which was a 1:2 scale of the wheel print of 400 mm × 400 mm from the design tandem of load model 1 in NEN-EN 1991-2:2003 [1]. For all the other experiments, the size of the loading plate was 115 mm × 150 mm, or the 1:2 scale wheel print of 230 mm × 300 mm that was used in the Netherlands for the assessment of bridge joints for fatigue.
The load was applied using a hydraulic jack mounted on a steel frame test setup. Figure 5 shows an overview photograph of the test setup. For the static tests, the load was applied in a stepwise monotonic loading protocol. In two experiments, a loading protocol with three cycles per load levels was used. For the static tests and the tests with three cycles per load level, the load was applied in a displacement-controlled way. For the fatigue tests, the load was cycled between a lower limit and an upper limit, with the lower limit Fmin being 10% of the upper limit. A sine function was used with a frequency of 1 Hz. In the fatigue tests, the load was applied in a force-controlled way. If fatigue failure did not occur after a large number of cycles, the upper load level was increased (and the associated lower limit of 10% of the upper limit was adjusted as well).

3. Results

3.1. Results of the Experiments

The complete results of all the experiments can be consulted in Reference [5] for the static tests on the first setup, in Reference [34] for the fatigue tests on the first setup, and in Reference [37] for the tests on the second setup. In this study, only the results that were relevant for the assessment of the case study bridge were summarized.
Table 2 gives an overview of the relevant static tests from the first setup (BB tests) and the second setup (FAT tests). For the BB series, all the experiments were consecutively numbered. For the FAT series, the test number provides information about the experiment: FAT (fatigue testing series of experiments on setup 2), followed by the test number, and then the S (static test) or D (dynamic test), and 1 (load applied through one loading plate representing a single wheel load) or 2 (load applied through two loading plates representing a double wheel load). The table gives the size of the loading plate used for testing, the load at failure Pmax, the age of the concrete of the slab at the moment of testing, and the concrete cube compressive strength fcm,cube determined at the day of testing the slab.
Table 3 gives an overview of the fatigue tests. Here, all the tests were considered relevant for the fatigue assessment, since all the fatigue tests were used to derive the Wöhler curves. The test number is given, with BB being the experiments on the first setup and FAT being the experiments on the second setup. Then, the number of the setup was listed, with “1, new” for the experiments that were carried out on the newly cast deck in the first setup. Next, the size of the loading plate used to apply the load on the slab was reported, followed by the “wheel”, which can be S (single wheel print) or D (double wheel print). Then, the upper load level used in the test, F/Pmax (with Pmax from the static test) was given, as well as N, the number of cycles. For the variable amplitude fatigue tests, N was the number of cycles for the associated load level F/Pmax. After N cycles at load level F/Pmax, given in one row of Table 3, the test was continued with N cycles at another load level F/Pmax, given in the next row. The column “age” gives the age of the slab at the age of testing, and fcm,cube gives the associated cube concrete compressive strength. For fatigue tests that lasted several days, a range of ages was given in the column “age”, indicating the age of the concrete in the slab at the beginning of testing and at the end of testing. Similarly, a range of compressive strengths was given for fcm,cube, representing the strength determined at the beginning and the end of testing.

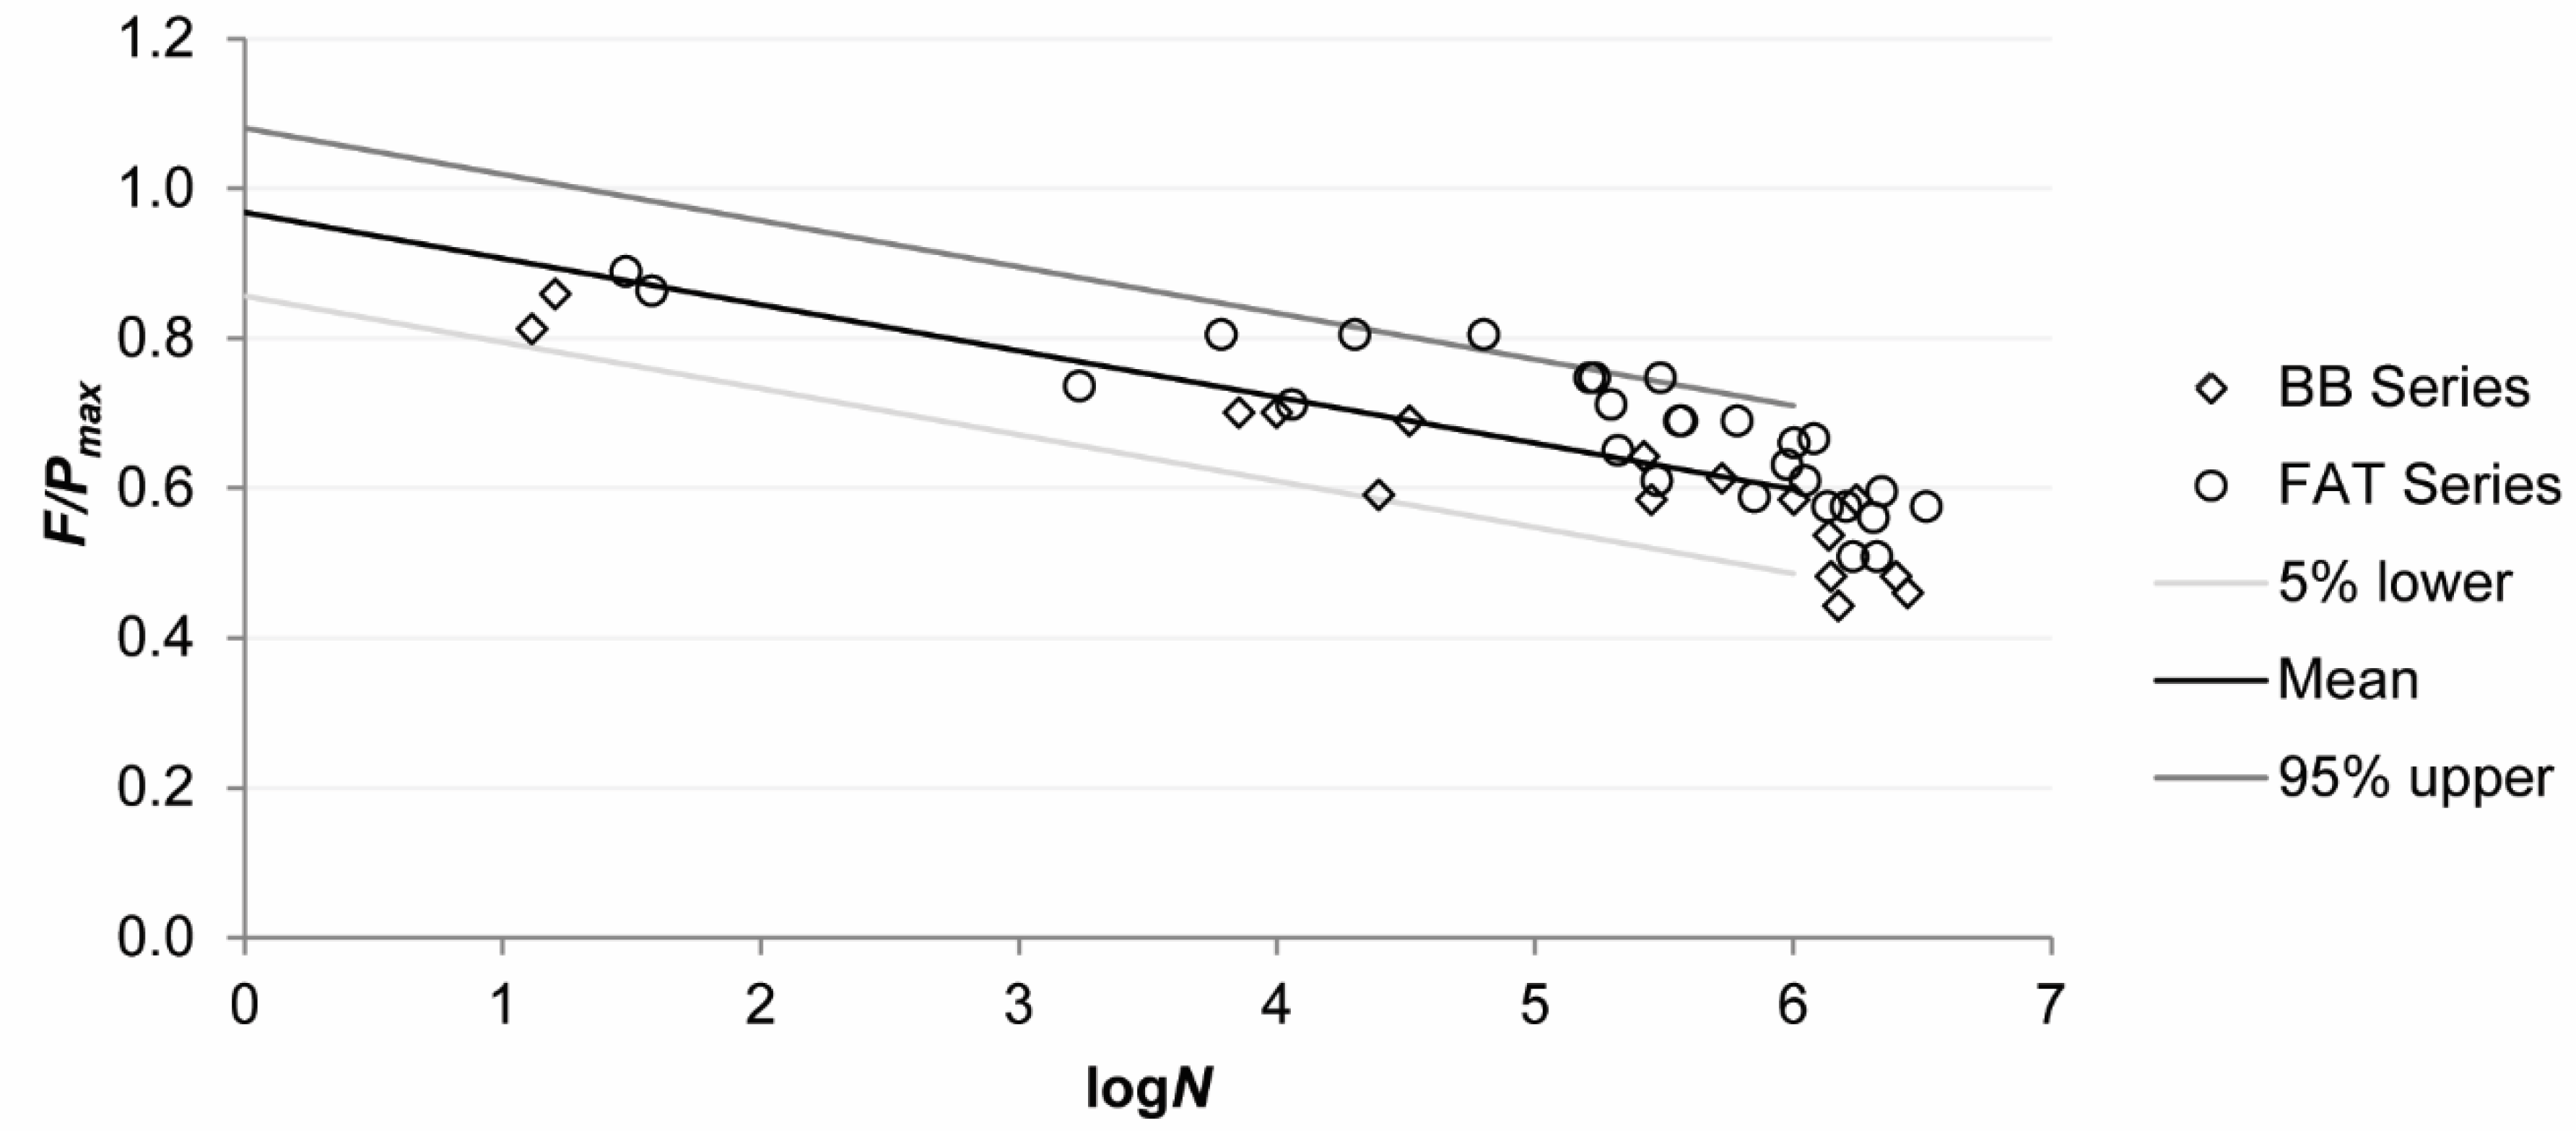
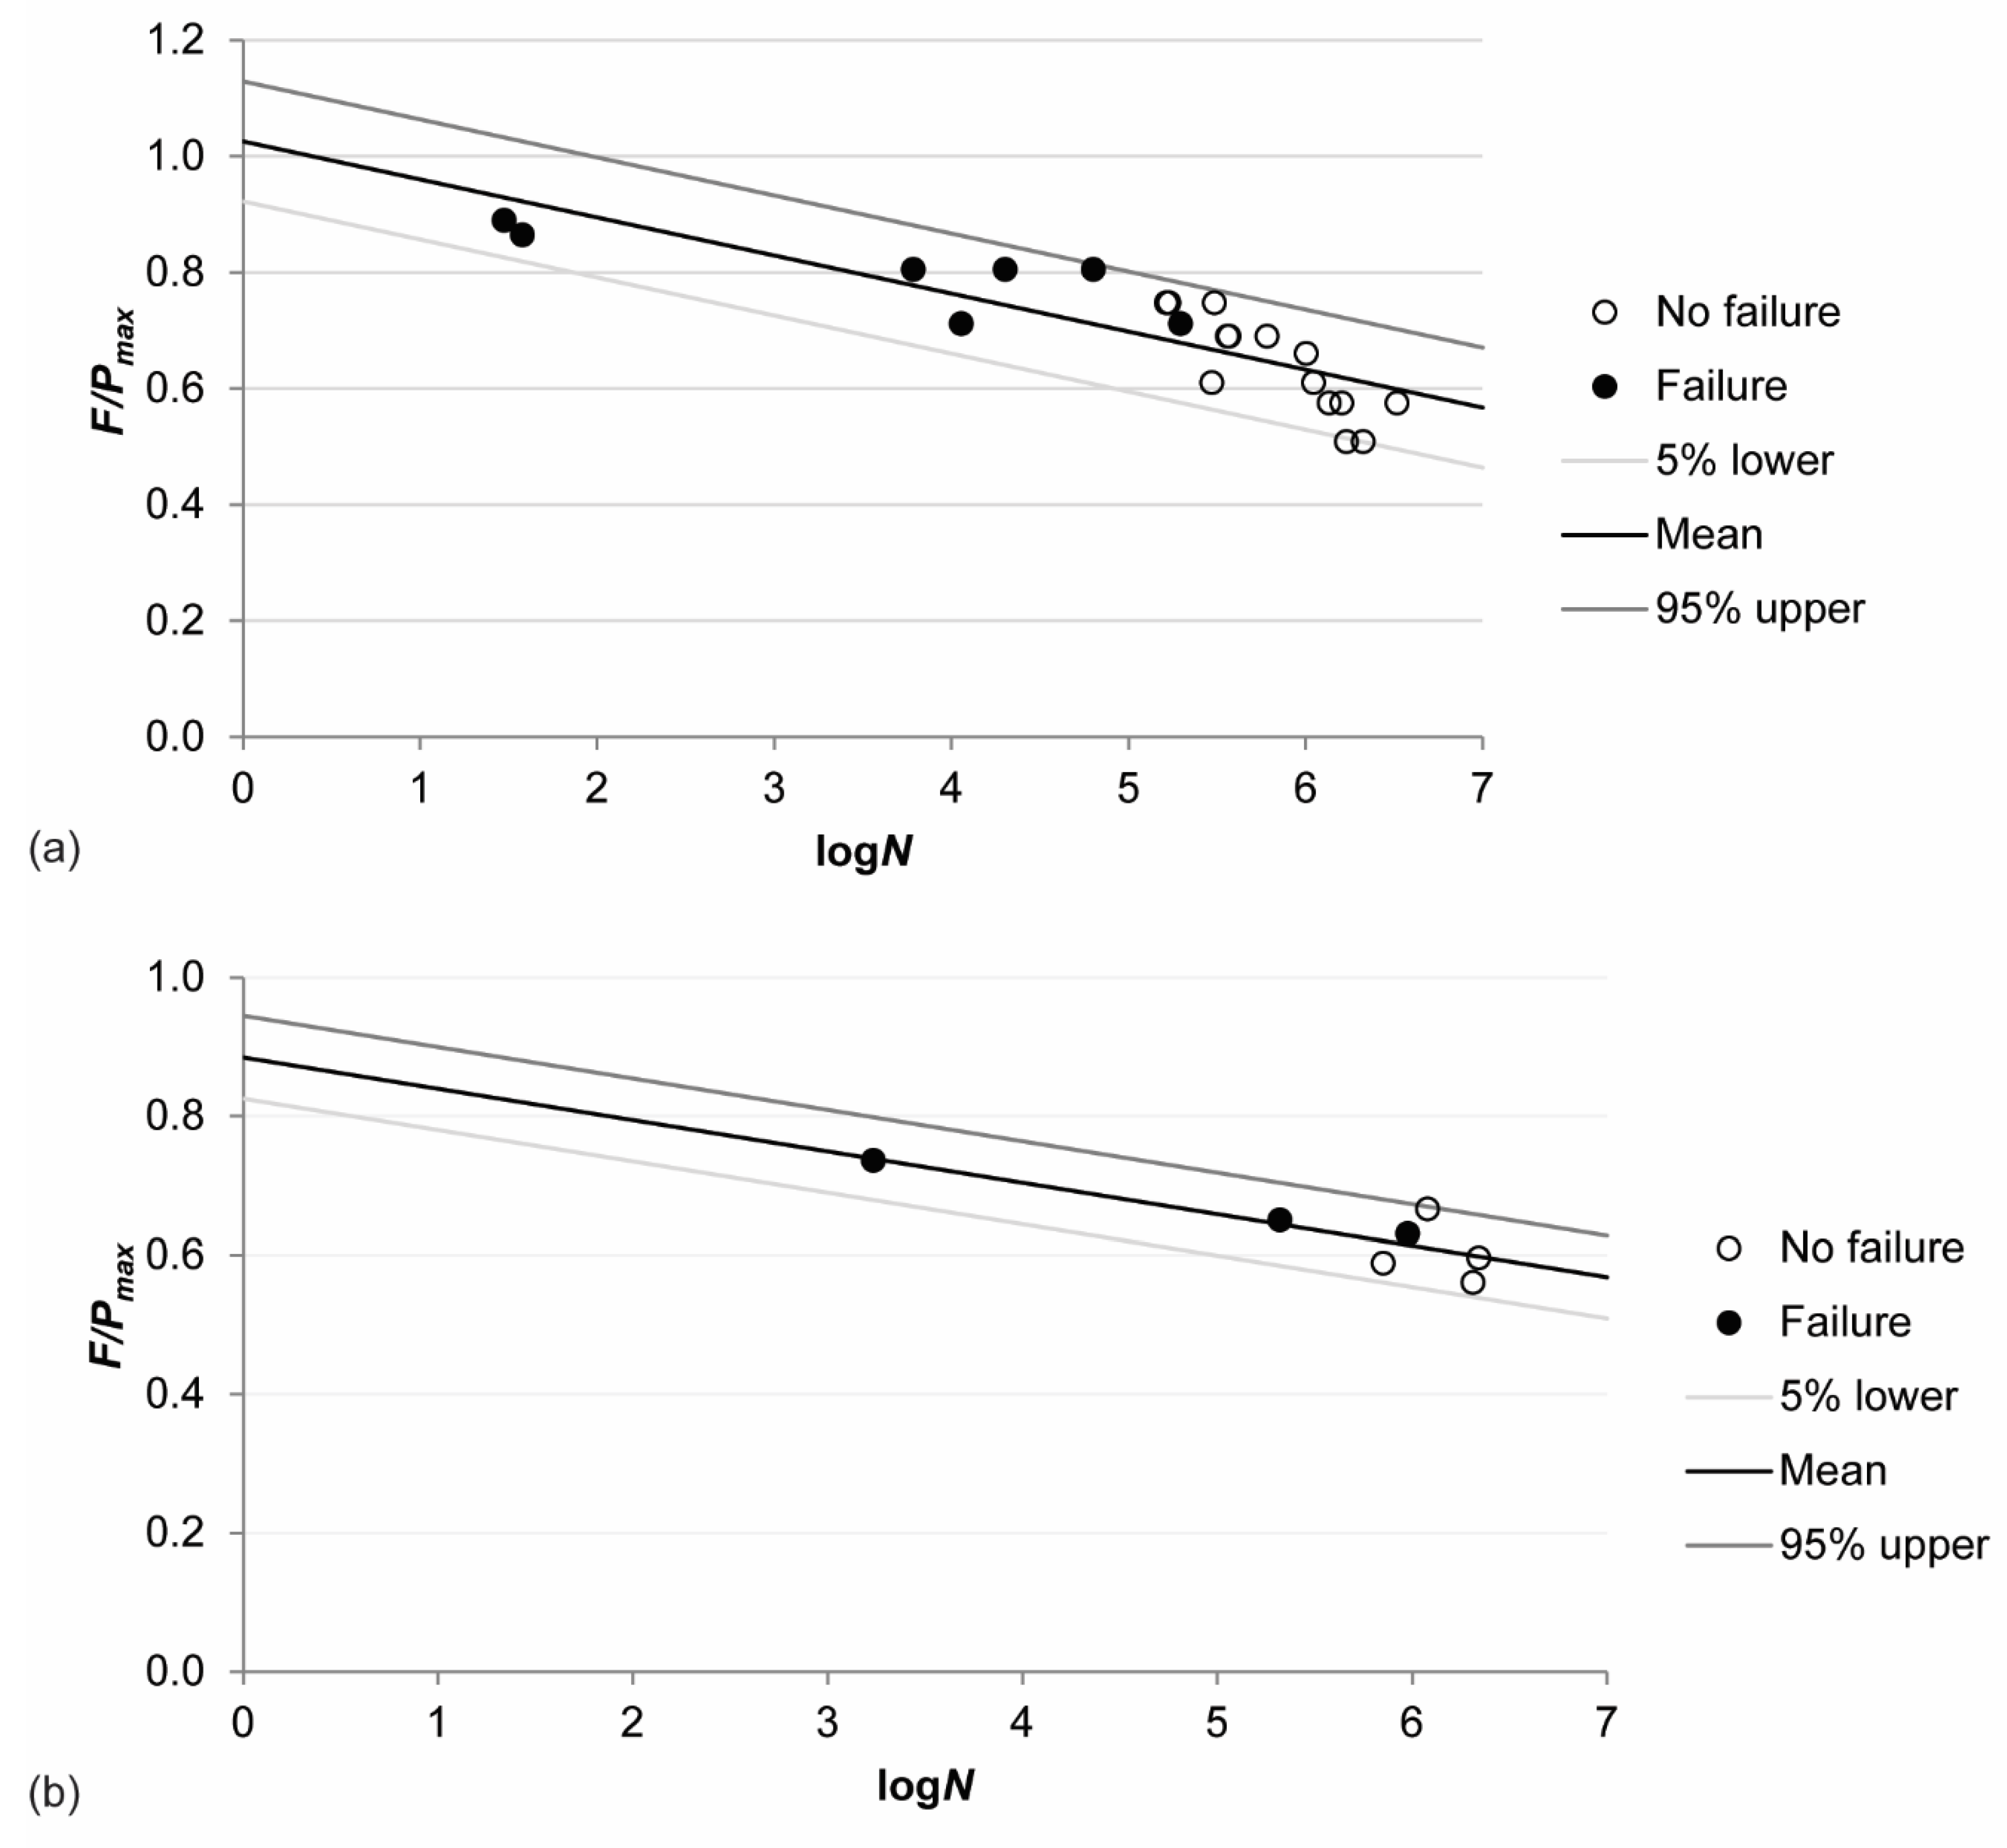
3.2. Resulting Wöhler Curve

To find the Wöhler curve of the fatigue experiments, the relation between the logarithm of the number of cycles N and the applied load ratio F/Pmax was plotted, see Figure 6. For this curve, we interpreted the variable amplitude loading tests as follows: if N1 cycles at load level F1 are applied, followed by N2 cycles at load level F2, and then N3 cycles to failure at F3, with increasing load levels F1 < F2 < F3, it is conservative to assume that the slab can withstand N1 + N2 + N3 cycles at the load level F1, N2 + N3 cycles at load level F2, and N3 cycles at load level F3. This approach led to three datapoints for one variable amplitude fatigue test. As a result of this approach, we obtained 16 datapoints on the first setup and 28 datapoints on the second setup, resulting in 44 datapoints in Figure 6. The average value of the Wöhler curve is shown as “mean” in Figure 6, and it is described with the following expression, using S for the load ratio and N for the number of cycles to failure:
S = 0.062 log N + 0.969
The current approach was based on a linear fit for the Wöhler curve. For an improved approach, two- and three-parameter Weibull distribution models could be used as in Reference [38]. In [39,40,41], the methodology for selecting the Weibull distribution models and the compatibility requirements over the whole S-N field are given. This approach may be suitable in ascertaining the predictive fatigue life assessment.
For the current approach, the goodness-of-fit was calculated using the chi-squared test. For all the fatigue tests (datapoints in Figure 6), the value equals 1. As such, the approach was considered satisfactory for our purposes.
Since the assessment was carried out separately for one and two wheel prints, it was interesting to examine the difference in the Wöhler curve for the experiments with one and two wheel prints. Figure 7 gives these results, with Figure 7a showing the datapoints from the FAT series for the single wheel print, and Figure 7b showing the datapoints for the double wheel print. The markers in Figure 7 are different for the datapoints obtained at a number of cycles that resulted in failure and a number of cycles that were calculated using the previously mentioned conservative assumption. The Wöhler curve for the datapoints with a single wheel load is:
S = 0.066 log N + 1.026
The 5% lower bound (characteristic value) of this expression, which can be used for the assessment, is:
S c h a r = 0.066 log N + 0.922
The Wöhler curve for the datapoints with a double wheel load is:
S = 0.045 log N + 0.885
The 5% lower bound of this expression is:
S c h a r = 0.045 log N + 0.825
The slope of the Wöhler curve for the case with two wheel loads is lower compared to the case with a single wheel load. However, for the case with a double wheel load, no low-cycle fatigue experimental results are available. For one load cycle Equation (2) gives a load ratio of 1.026, and Equation (4) gives a load ratio of 0.885. The difference between the two Wöhler curves for one cycle is significant. However, for 1 million load cycles, Equation (2) gives a load ratio of 0.63 and Equation (4) gives a load ratio of 0.62. Therefore, for a large number of load cycles, the difference between the two Wöhler curves becomes smaller. For the assessment of existing bridges, a large number of cycles need to be considered.

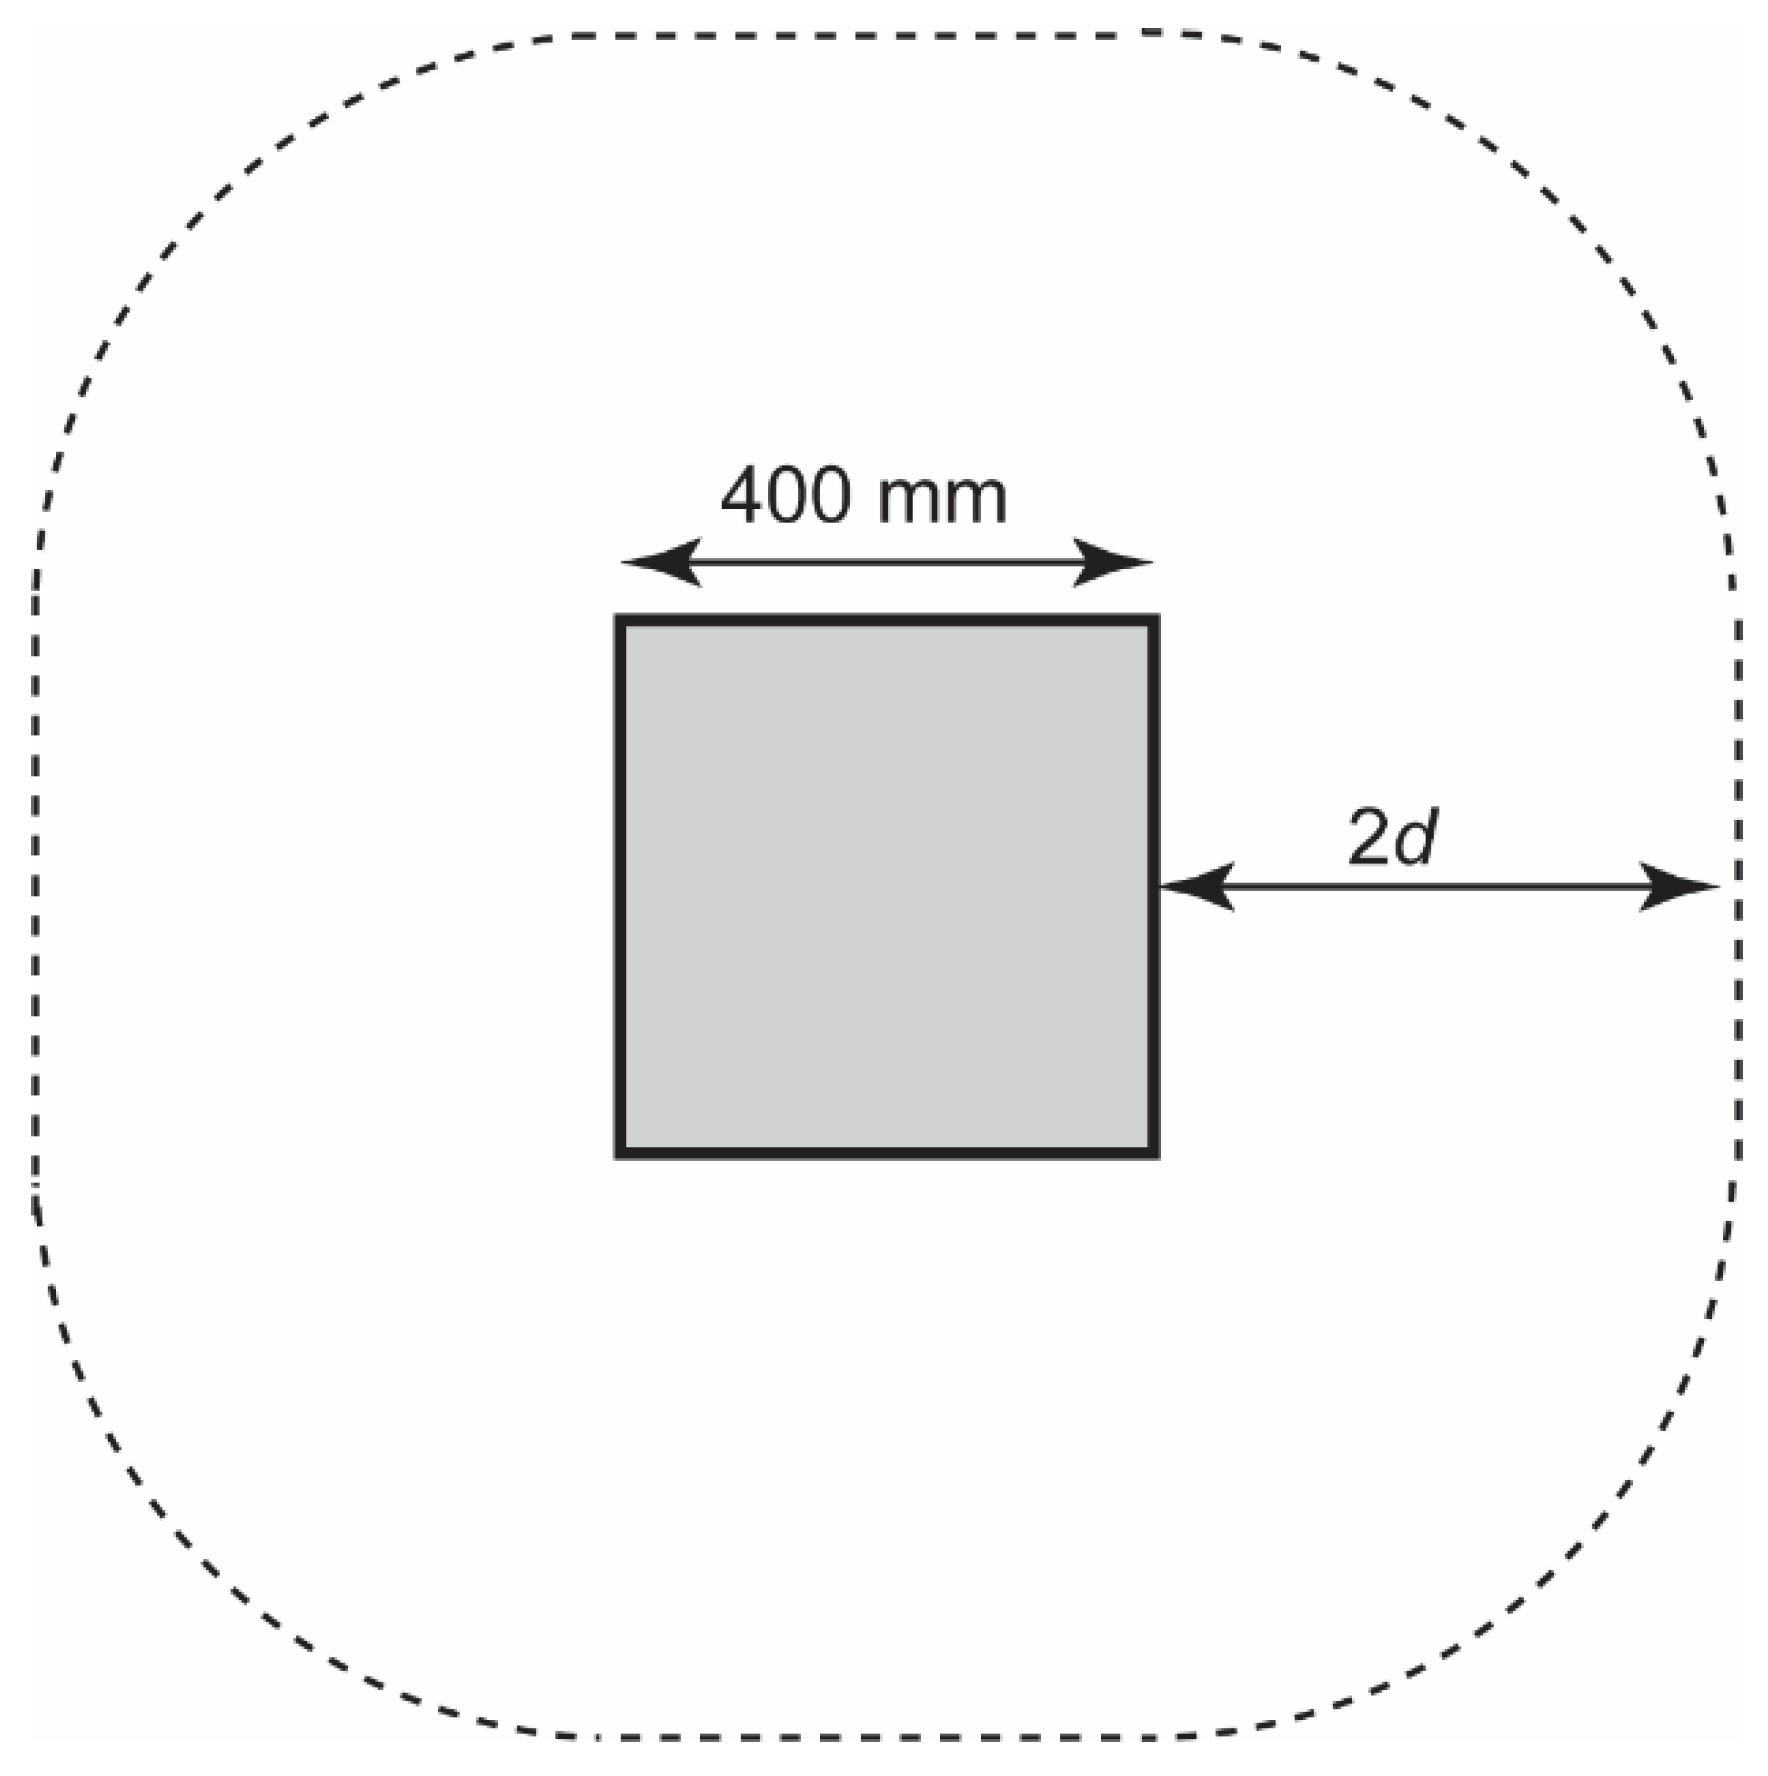
3.3. Assessment of the Case Study Bridge for Punching

First, the capacity of the thin slab for punching was evaluated based on the experimental results. The shear capacity according to NEN-EN 1992-1-1:2005 [3] was calculated:
v R d , c = C R d , c k ( 100 ρ a v g f c k ) 1 / 3 + k 1 σ c p v min + k 1 σ c p
With
k = 1 + 200   mm d 2
And
ρ a v g = ρ l × ρ t
σ c p = σ c x + σ c y 2
The recommended value for k1 = 0.1, for CRd,c = 0.18/γc with γc = 1.5, and for vmin:
v min = 0.035 k 3 / 2 f c k
Using the properties in Table 1, we found that k = 2 and the punching shear stress capacity of the case study bridge equals:
v R d , c = 0.18 1.5 × 2 × ( 100 × 0.001388 × 53.3   MPa ) 1 / 3 + 0.1 × 1.25   MPa = 0.572   MPa
To find the maximum punching force, we calculated the punching perimeter around the 400 mm wheel print as sketched in Figure 8:
u = 4 × 400   mm + 2 π × 2 × 162   mm = 3636   mm
For the 230 mm × 300 mm wheel print, the punching perimeter length became:
u = 2 × ( 230   mm + 300   mm ) + 2 π × 2 × 162   mm = 3096   mm
The maximum punching force for these two wheel prints then became:
V R d , c = 0.572   MPa × 3636   mm × 162   mm = 336.8   kN
V R d , c = 0.572   MPa × 3096   mm × 162   mm = 286.8   kN
The load that the deck has to resist is a combination of the concentrated live load and the distributed live load. The axle load of 300 kN results in a wheel load of 150 kN. The distributed lane load was 1.15 × 9 kN/m2 = 10.35 kN/m2. The contributions of the self-weight and asphalt were 25 kN/m3 × 200 mm = 5 kN/m2 and 23 kN/m3 × 120 mm = 2.8 kN/m2, respectively. The area over which these loads were considered was the area within the punching perimeter, Au = (400 mm)2 + 4 × 162 mm × 400 mm + π(162 mm/2)2 = 439,812 mm2 = 0.4398 m2. The corresponding loads for the distributed lane load, self-weight, and asphalt then became 4.55 kN, 2.2 kN, and 1.23 kN, respectively, when the Eurocode wheel print was considered. For the smaller wheel print, the area within the punching perimeter became Au = 0.2613 m2, resulting in loads of 2.7 kN, 1.3 kN, and 0.7 kN, respectively, for the distributed lane load, the self-weight, and the asphalt.
The load combination for the assessment of existing bridges in the Netherlands depends on the required safety level, as prescribed by NEN 8700:2011 [42] and the RBK (Richtlijnen Beoordeling Kunstwerken = Guidelines for the Assessment of Existing Bridges) [32]. The highest level was the “design” level (associated reliability index β = 4.3), which gave the following load combination: U = 1.25DL + 1.25DW + 1.50LL, with DL being the dead load, DW the superimposed dead load, and LL the live load. The resulting factored concentrated load for evaluation then became 236 kN, for the 400 mm × 400 mm wheel print, and 232 kN, for the 230 mm × 300 mm wheel print.
The assessment was carried out based on the Unity Check, where the Unity Check is the ratio of design demand to design capacity. In this case, for punching, the Unity Check was the ratio of the factored concentrated load acting on the wheel print to the design punching shear force capacity. To fulfil the code requirements, the Unity Check has to be smaller than 1. Table 4 gives an overview of the resulting Unity Checks for the different wheel prints that were studied. We observed that assessment of the deck using the Eurocode shows that it already fulfils the code’s requirements. In the introduction, we stated that there was discussion about the punching capacity of the decks in the existing slab-between-girder bridges. The reason why this assessment showed that the deck met the code requirements was the higher punching capacity established based on the results of the drilled cores.
In a next step of the assessment, the maximum loads obtained in the static tests were applied to the assessment of the Van Brienenoord Bridge. When assessing the bridge based on the results of the experiments, we could replace the design capacity according to the Eurocode VRd,c, using the capacity obtained in the tests. To translate the capacity obtained in the test to a representative design capacity of the case study bridge, we had to consider the following (see Annex D of NEN-EN 1990:2002 [43]):
  • The laboratory setup was a 1:2 scale of the case study bridge, resulting in a factor 22;
  • Considering scaling laws, a scale factor of 1.2 [13] had to be included in the capacity;
  • The partial factor derived from the experiments γT had to be included.
First, we derived the partial factor from the experiments γT. To calculate this factor, we compared the punching capacity obtained in the static experiments with the average punching stress capacity vR,c according to NEN-EN 1992-1-1:2005 [3]. The expression for vR,c was given in the background report of Eurocode 2 [44] as follows:
v R , c = 0.18 × k × ( 100 × ρ a v g × f c m ) 1 / 3 + 0.08 σ c p
To find the punching shear capacity VR,c, the stress vR,c was then multiplied with u × d, where u was determined as shown in Figure 8, for the considered wheel print. Table 5 combines the experimental results Vexp and the predicted capacities VR,c, as well as the ratio of the tested to predicted capacity Vexp/VR,c. The average value of Vexp/VR,c was 2.61, with a standard deviation of 0.296 and a coefficient of variation of 11%. This information led to the derivation of γT as determined in Annex C of NEN-EN 1990:2002 [43]:
γ T = μ B R d
With
B R d = μ ( 1 α × β × C O V ) = 2.61 ( 1 0.8 × 4.3 × 0.11 ) = 1.622
where α = 0.8 is the factor for considering the experimental results, and β is the target reliability index. The value for γT then becomes:
γ T = μ B R d = 2.61 1.622 = 1.61
As for the influence of the difference in scale between the test setup in the laboratory and the case study bridge, the experimental result Vexp could be scaled to the capacity of the bridge VBB as follows:
V B B = V e x p × 2 2 1.2
where the factor 22 corrects for the 1:2 scale, and 1.2 is the scaling factor. The design capacity based on the test results is then:
V B B , d = V B B γ T
Table 6 shows the results for the VBB according to Equation (20) and VBB,d according to Equation (21), as well as the demand VEd that corresponds to the wheel print in the experiment under consideration (see Table 4). The average value of VBB,d/VEd = 3.06, which meant that the margin of safety was 3.23, or that the Unity Check was the inverse, UC = 0.33. When comparing this value based on the experiments to the values in Table 4, we observed the beneficial effect of compressive membrane action on the capacity of the thin, transversely prestressed concrete slabs.

3.4. Assessment of Case Study Bridge for Fatigue

The results of the experiments and the developed Wöhler curve could be interpreted for the assessment of fatigue. Given the geometry of the deck (see Figure 1), only two wheels (one of each axle) out of the four wheels of the tandem could act together on the deck. The clear span was 2.1 m whilst the width of the design tandem was 2.4 m in total, and 2.0 m center-to-center. For the interpretation of the test results, this meant that the outcome of the tests with a double wheel print (Wöhler curve in Figure 7b) should be evaluated for the case study bridge over 250 million cycles, and that the outcome of the tests with a single wheel print (Wöhler curve in Figure 7b) should be evaluated for the case study bridge over 2 × 250 million cycles = 500 million cycles.
To use the Wöhler curves derived in the experiments for the assessment of the Van Brienenoord Bridge for fatigue, we scaled the fatigue load model to the 1:2 size of the test setup. Note that this approach differed from the assessment for punching, where we scaled up the capacity from the laboratory setup to the capacity of the case study bridge. Here, we used the opposite approach to avoid having to change the Wöhler curve. The concentrated load of the fatigue load model was 105 kN. Scaling this load down to the 1:2 scale model, we used a factor 22 = 4, so that the concentrated load became 26.25 kN. The distributed lane load of the fatigue load model was 3.105 kN/m2. For the 1:2 scale model, the distributed lane load became 0.776 kN/m2.
In the 1:2 scale model, only the concentrated loads were used, so the load that represented the concentrated load, as well as the distributed lane load, should be determined. To determine the region over which the distributed lane load should be considered, the cracking patterns in the experiments were studied. The cracking pattern extended over 1.2 m for the experiments with a single wheel load, and over 2 m for the experiments with a double wheel load. To find the equivalent point load, we first determined the bending moment caused by the distributed load, considering that the slab spanned over 1.8 m:
M d i s t , 1 w h e e l = 1 8 ( 0.776   kN m 2 × 1.2   m ) ( 1.8   m ) 2 = 0.38   kNm
M d i s t , 2 w h e e l = 1 8 ( 0.776   kN m 2 × 2   m ) ( 1.8   m ) 2 = 0.63   kNm
The equivalent concentrated load was then:
F e q = 4 M d i s t l s p a n
which resulted in Feq = 0.83 kN for a single wheel load, and Feq = 1.40 kN for a double wheel load. Then, the total load was F = 27.08 kN for a single wheel load and F = 27.65 kN for a double wheel load.
The punching shear capacity of setup 2 is given in Table 5 for FAT1S1 or cast 1 of the concrete as 124.4 kN, and for FAT7S1 or cast 2 as 127.4 kN based on the Eurocode punching provisions. Recall that the design value of the enhancement factor was BRd = 1.622. As such, the design capacity of the punching resistance with the punching perimeter around one wheel load, including the enhancing effect of compressive membrane action became 1.622 × 124.4 kN = 201.8 kN, for the most critical case (lowest capacity VRd,c as a result of the lowest concrete compressive strength). To determine the capacity for punching with the case of a double wheel print, one could expect a double capacity. However, the results in Table 2 show that the capacity in the FAT8S2 was 1.64 times the capacity in FAT7S1. This ratio was used to determine the punching shear capacity. The capacity was now 1.64 × 201.8 kN = 331.0 kN.
The load ratio could now be determined. For a single wheel load, the load ratio was 27.08 kN/201.8 kN = 0.134, and for a double wheel load, the load ratio was 2 × 27.65 kN/331.0 kN = 0.167.
For the evaluation for one wheel load, Equation (3) was used with N = 500 million cycles. The resulting ratio was Schar = 0.348. For two wheel loads, using Equation (5) with N = 250 million cycles gave Schar = 0.447. The outcome of the assessment was that the margin of safety for one wheel print was 0.348/0.134 = 2.60, or that inversely, the UC = 0.39. For the case with two wheel prints, the margin of safety was 0.447/0.167 = 2.68 or inversely UC = 0.37. Thus, the results for one and two wheel prints were very similar. The conclusion of the assessment was that based on the experimental results, we found that the case study bridge met the code requirements for fatigue.

4. Discussion

In the previous two paragraphs, we calculated the Unity Checks for static punching (UC = 0.31), for fatigue punching of one wheel load after 500 million cycles of the single load (UC = 0.391), and for fatigue punching of two wheel loads after 250 million cycles of the axle (UC = 0.37). Comparing these Unity Checks leads to the conclusion that the most critical case is punching fatigue for a single wheel load. However, the difference between the punching fatigue Unity Check for one and two wheel loads was negligible. In addition, the Unity Checks were small, and significantly smaller than the limiting value of 1.0. This analysis shows the beneficial effect of considering compressive membrane action.
All resulting Unity Checks were smaller than the limiting value of 1.0. This result means that the code requirements for static and fatigue punching were met for the case study bridge. This outcome directly shows the benefit of testing a scaled version of the Van Brienenoord Bridge in the laboratory.
In addition to the conclusion that the Van Brienenoord Bridge met the code requirements for static and fatigue punching, we need to recall that this case study bridge was selected since it had the most critical geometry (largest span to depth ratio for the slab) of the existing slab-between-girder bridges in the Netherlands. As such, the conclusion becomes that all slab-between-girder bridges in the Netherlands, which form a well-defined subset of bridges in the Dutch bridge stock, fulfil the Eurocode requirements. Drawing this conclusion is valid, since these bridges were all built in the same time period, with the same materials, and using the same execution techniques—and are thus all very similar, with only small variations in the geometry and material properties.
However, a side note that we should place with the conclusion that all slab-between-girder bridges in the Netherlands meet the requirements for static and fatigue punching, is that this conclusion is only valid for bridges without material degradation or other forms of damage. To ensure this premise, routine inspections remain necessary. Inspections are an important tool within the bridge management toolbox. If during an inspection indications of material degradation or damage are found, the bridge requires further analysis, and it should be evaluated to check that the conclusion that was based on an undamaged structure is still valid.
For this research, the outcome was twofold: (1) the small resulting Unity Checks based on the experimental results, and (2) the fact that with this approach, the existing slab-between-girder bridges have been shown to fulfil the code requirements. This result also shows that constructing the 1:2 scale setups in the laboratory has been beneficial in the assessment of existing slab-between-girder bridges. Whilst building a 1:2 scale bridge in the laboratory may be considered expensive and time-consuming, testing such a setup gives unique insights on the overall structural behavior of a structural system. Testing at the component level cannot provide such insights. Therefore, the cost-benefit analysis of these experiments is in favor of testing a structural system. Taking this approach is not common, but it may be become an interesting approach for ministries or departments of transportation when they are confronted with a problem for an entire category of bridges.

5. Conclusions

A number of existing slab-between-girder bridges in the Netherlands do not fulfil the requirements of the newly introduced Eurocodes when these bridges are independently evaluated for punching (both static and for cycles of loading). The Eurocode model for determining the punching shear capacity is an empirical model, derived from the results of (mostly concentric) slab-column connection tests [44]. The structural behavior of the thin slabs in slab-between-girder bridges is different from that of slab–column connections. In particular, the development of compressive membrane action increases the capacity significantly.
To study the structural behavior of slab-between-girder bridges, we selected as a case study the Van Brienenoord Bridge because it has the most critical slab geometry (largest span-to-depth ratio for the slabs) of this subset of bridges in the Dutch bridge stock. Based on the geometry of the case study bridge, we built two setups in the laboratory at a 1:2 scale and carried out static and dynamic tests.
The outcome of the static tests could be used for assessing the static punching strength of the Van Brienenoord Bridge. Using the method given in the Eurocode for design by testing, a factor for converting mean values in the design values of 1.53 was derived. Using this approach, the resulting Unity Check for punching shear of the Van Brienenoord Bridge became 0.31.
The outcome of the fatigue tests could be used to derive the Wöhler curve for thin slabs in slab-between-girder bridges. Analyzing the fatigue live load model, we selected two critical loading cases for the fatigue assessment: the case with a single wheel load, and the case with two wheel loads (one of each axle). For both cases, we obtained the results of fatigue tests, and thus a Wöhler curve. The assessment was then carried out based on a service life of 100 years, which led to 500 million cycles for the single wheel load, and 250 million cycles for the double wheel load. Considering the factor to convert the mean values to design values of 1.622 as derived from the static tests, we compared the applied load ratio to the load ratio resulting from the characteristic (5% lower bound) Wöhler curve. Comparing these values gives a Unity Check of 0.39, for the case with a single wheel print, and of 0.37, for the case with a double wheel print.
Evaluating the results of the Unity Checks, we could identify the most critical case, which was (by a small margin) the case of fatigue punching under a single wheel load. However, the resulting Unity Checks were much smaller than the limiting value of 1.0. As such, the conclusion is that the Van Brienenoord Bridge meets the Eurocode requirements for static punching and fatigue. Since the case study bridge was selected based on the most critical geometry, we could say that by extension, all other slab-between-girder bridges in the Netherlands meet the Eurocode requirements for static and fatigue punching. However, this final conclusion is only valid for bridges without deterioration and material degradation. Routine inspections remain an important bridge management tool to identify bridges that require further study.

Author Contributions

Conceptualization, C.v.d.V. and H.S.; methodology, C.v.d.V., R.K., and E.O.L.L.; validation, E.O.L.L.; formal analysis, R.K. and E.O.L.L.; investigation, R.K. and C.v.d.V.; resources, H.S.; data curation, E.O.L.L. and R.K.; writing—original draft preparation, E.O.L.L.; writing—review and editing, R.K., C.v.d.V., and H.S.; visualization, R.K. and E.O.L.L.; supervision, C.v.d.V. and H.S.; project administration, C.v.d.V. and H.S.; funding acquisition, C.v.d.V.

Funding

This research was funded by Rijkswaterstaat, Ministry of Infrastructure and the Environment. The APC was funded by the Delft University of Technology.

Acknowledgments

The authors wish to express their gratitude and sincere appreciation to the Dutch Ministry of Infrastructure and the Environment (Rijkswaterstaat) for financing this research work. We are deeply indebted to our colleague Albert Bosman for his work in the laboratory and the meticulous reporting of the first series of experiments. We would also like to thank our former colleagues Sana Amir and Patrick van Hemert for their contributions to the beginning of the experimental work.

Conflicts of Interest

The authors declare no conflict of interest. The funders had no role in the design of the study; in the collection and analyses of data. The funders were involved with the practical interpretation of the data, writing of the manuscript, and the decision to publish the results.

List of Notations

bwidth
cconcrete cover
daverage effective depth
dleffective depth to the longitudinal reinforcement
dteffective depth to the transverse reinforcement
fck,cubecharacteristic cube concrete compressive strength
fcm,cubeaverage cube concrete compressive strength
fckcharacteristic cylinder concrete compressive strength
fcmaverage cylinder concrete compressive strength
hheight
ksize effect factor
k1factor on effect of axial stresses
llength
lspanspan length
qikdistributed lane load
upunching perimeter length
vminlower bound of shear capacity
vR,cmean capacity for punching shear
vRd,cdesign capacity for punching shear
As,llongitudinal reinforcement area
Asparea of prestressing steel
As,ttransverse reinforcement area
Auarea within punching perimeter
BRddesign capacity derived from statistical results of experiments
COVcoefficient of variation
CRd,cconstant in punching capacity equation
DLdead load
DWsuperimposed dead load
Fapplied load
Feqequivalent load
Fminlower limit of the load as used in the fatigue tests
LLlive load
Mdist,1wheelbending moment caused by distributed lane load for influence area of one wheel load
Mdist,2wheelbending moment caused by distributed lane load for influence area of two wheel loads
Nnumber of cycles
Pmaxload at failure
Qikaxle load of design tandem
Sload ratio
Scharcharacteristic value of load ratio (5% lower bound Wöhler curve)
Uload combination
UCUnity Check
VBBaverage capacity of deck of Van Brienenoord Bridge based on experiments
VBB,ddesign capacity of deck of Van Brienenoord Bridge based on experiments
VR,cmean value of the punching shear capacity
VRd,cdesign value of the punching shear capacity
VEddesign value of punching shear demand
Vexpexperimental punching capacity
αfactor that considered effect of experiments
αqifactor on distributed lane loads
αQifactor on design tandem
βreliability index
γTpartial factor derived from experiments
μmean value of experimental results
ρavgaverage reinforcement ratio
ρllongitudinal reinforcement ratio
ρttransverse reinforcement ratio
σcpaverage axial stress
σcxlongitudinal axial stress
σcytransverse axial stress

References

  1. CEN. Eurocode 1: Actions on Structures—Part 2: Traffic Loads on Bridges; Nen-en 1991-2:2003; Comité Européen de Normalisation: Brussels, Belgium, 2003; p. 168. [Google Scholar]
  2. Code Committee 351001. NEN 6720 Technical Foundations for Building Codes, Concrete Provisions Tgb 1990—Structural Requirements and Calculation Methods (VBC 1995); Civil Engineering Center for Research and Regulation, Dutch Normalization Institute: Delft, The Netherlands, 1995; p. 245. (In Dutch) [Google Scholar]
  3. CEN. Eurocode 2: Design of Concrete Structures—Part 1-1 General Rules and Rules for Buildings; NEN-EN 1992-1-1:2005; Comité Européen de Normalisation: Brussels, Belgium, 2005; p. 229. [Google Scholar]
  4. Lantsoght, E.O.L.; van der Veen, C.; de Boer, A.; Walraven, J.C. Recommendations for the shear assessment of reinforced concrete slab bridges from experiments. Struct. Eng. Int. 2013, 23, 418–426. [Google Scholar] [CrossRef]
  5. Amir, S.; Van der Veen, C.; Walraven, J.C.; de Boer, A. Experiments on punching shear behavior of prestressed concrete bridge decks. ACI Struct. J. 2016, 113, 627–636. [Google Scholar] [CrossRef]
  6. Teworte, F.; Herbrand, M.; Hegger, J. Structural assessment of concrete bridges in germany—Shear resistance under static and fatigue loading. Struct. Eng. Int. 2015, 25, 266–274. [Google Scholar] [CrossRef]
  7. Bagge, N.; Nilimaa, J.; Puurula, A.; Täljsten, B.; Blanksvärd, T.; Sas, G.; Elfgren, L.; Carolin, A. Full-scale tests to failure compared to assessments—Three concrete bridges. In High Tech Concrete: Where Technology and Engineering Meet; Springer: Cham, Switzerland, 2018. [Google Scholar]
  8. Brühwiler, E.; Vogel, T.; Lang, T.; Luechinger, P. Swiss standards for existing structures. Struct. Eng. Int. 2012, 22, 275–280. [Google Scholar] [CrossRef]
  9. Kong, J.S.; Frangopol, D.M. Probabilistic optimization of aging structures considering maintenance and failure costs. J. Struct. Eng. ASCE 2005, 131, 600–616. [Google Scholar] [CrossRef]
  10. Frangopol, D.M.; Sabatino, S.; Dong, Y. Bridge life-cycle performance and cost: Analysis, prediction, optimization and decision making. In Maintenance, Monitoring, Safety, Risk and Resilience of Bridges and Bridge Networks; Bittencourt, T.N., Frangopol, D.M., Beck, A., Eds.; CRC Press: Foz do Iguacu, Brazil, 2016; pp. 2–20. [Google Scholar]
  11. Vergoossen, R.; Naaktgeboren, M.; Hart, M.; De Boer, A.; Van Vugt, E. Quick scan on shear in existing slab type viaducts. In Proceedings of the International IABSE Conference, Assessment, Upgrading and Refurbishment of Infrastructures, Rotterdam, The Netherlands, 6–8 May 2013; p. 8. [Google Scholar]
  12. Lantsoght, E.O.L.; van der Veen, C.; de Boer, A.; Walraven, J. Using eurocodes and aashto for assessing shear in slab bridges. Proc. Inst. Civ. Eng. Bridge Eng. 2016, 169, 285–297. [Google Scholar] [CrossRef]
  13. Amir, S. Compressive Membrane Action in Prestressed Concrete Deck Slabs. Ph.D. Thesis, Delft University of Technology, Delft, The Netherlands, 2014. [Google Scholar]
  14. Collings, D.; Sagaseta, J. A review of arching and compressive membrane action in concrete bridges. Inst. Civ. Eng. Bridge Eng. 2015, 169, 271–284. [Google Scholar] [CrossRef]
  15. Eyre, J.R. Direct assessment of safe strengths of rc slabs under membrane action. J. Struct. Eng. ASCE 1997, 123, 1331–1338. [Google Scholar] [CrossRef]
  16. Highways Agency. Corrections within Design Manual for Roads and Bridges, Use of Compressive Membrane Action in Bridge Decks; Highways Agency: London, UK, 2007; pp. 35–51.
  17. Kirkpatrick, J.; Rankin, G.I.B.; Long, A.E. The influence of compressive membrane action on the serviceability of beam and slab bridge decks. Struct. Eng. 1986, 64B, 6–9. [Google Scholar]
  18. Kuang, J.S.; Morley, C.T. A plasticity model for punching shear of laterally restrained slabs with compressive membrane action. Int. J. Mech. Sci. 1993, 35, 371–385. [Google Scholar] [CrossRef]
  19. Tong, P.Y.; Batchelor, B.V. Compressive membrane enhancement in two-way bridge slabs. SP 30-12 1972, 30, 271–286. [Google Scholar]
  20. Hewitt, B.E.; de Batchelor, B.V. Punching shear strenght of restrained slabs. J. Struct. Div. 1975, 101, 1837–1853. [Google Scholar]
  21. Lantsoght, E.O.L.; Van der Veen, C.; Koekkoek, R.T.; Sliedrecht, H. Capacity of prestressed concrete bridge decks under fatigue loading. In Proceedings of the FIB Symposium, Cracow, Poland, 27–29 May 2019. [Google Scholar]
  22. Bennett, E.W.; Muir, S.E.S.J. Some fatigue tests of high-strength concrete in axial compression. Mag. Concr. Res. 1967, 19, 113–117. [Google Scholar] [CrossRef]
  23. Lantsoght, E.O.L.; van der Veen, C.; de Boer, A. Proposal for the fatigue strength of concrete under cycles of compression. Constr. Build. Mater. 2016, 107, 138–156. [Google Scholar] [CrossRef]
  24. Isojeh, B.; El-Zeghayar, M.; Vecchio, F.J. Fatigue resistance of steel fiber-reinforced concrete deep beams. ACI Struct. J. 2017, 114, 1215–1226. [Google Scholar] [CrossRef]
  25. Teng, S.; Ma, W.; Tan, K.H.; Kong, F.K. Fatigue tests of reinforced concrete deep beams. Struct. Eng. 1998, 76, 347–352. [Google Scholar]
  26. Teworte, F.; Hegger, J. Shear fatigue of prestressed concrete beams. In Proceedings of the IABSE 2011, London, UK, 23 September 2011; p. 8. [Google Scholar]
  27. Muller, J.F.; Dux, P.F. Fatigue of prestressed concrete beams with inclined strands. J. Struct. Eng. 1994, 120, 1122–1139. [Google Scholar] [CrossRef]
  28. Yuan, M.; Yan, D.; Zhong, H.; Liu, Y. Experimental investigation of high-cycle fatigue behavior for prestressed concrete box-girders. Constr. Build. Mater. 2017, 157, 424–437. [Google Scholar] [CrossRef]
  29. Fujiyama, C.; Gebreyouhannes, E.; Maekawa, K. Present achievement and future possibility of fatigue life simulation technology for rc bridge deck slabs. Soc. Soc. Manag. Syst. Internet J. 2008, 4. [Google Scholar]
  30. Harajli, M.H.; Naaman, A.E. Static and fatigue tests on partially prestressed beams. J. Struct. Eng. 1985, 111, 1602–1618. [Google Scholar] [CrossRef]
  31. Xin, Q.; Dou, Y.; Chen, W. Load spectrum and fatigue life computer analysis of prestressed concrete bridges. Int. J. Secur. Appl. 2015, 9, 247–266. [Google Scholar] [CrossRef]
  32. Rijkswaterstaat. Guidelines Assessment Bridges—Assessment of Structural Safety of an Existing Bridge at Reconstruction, Usage and Disapproval; RTD 1006:2013 1.1; Rijkswaterstaat: Utrecht, The Netherlands, 2013; p. 117. (In Dutch) [Google Scholar]
  33. Van der Veen, C.; Bosman, A. Vermoeiingssterkte Voorgespannen Tussenstort; Stevin Report nr. 25.5-14-06; Delft University of Technology: Delft, The Netherlands, 2014; p. 65. [Google Scholar]
  34. Lantsoght, E.O.L.; Van der Veen, C.; Koekkoek, R.T.; Sliedrecht, H. Fatigue testing of transversely prestressed concrete decks. ACI Struct. J. 2019, in press. [Google Scholar] [CrossRef]
  35. Koekkoek, R.T.; van der Veen, C.; de Boer, A. Fatigue Tests on Post-Tensioned Bridge Decks; Springer International Publishing: Cham, Switzerland, 2018; pp. 912–920. [Google Scholar]
  36. Koekkoek, R.T.; van der Veen, C. Measurement Report Fatigue Tests on Slabs Cast in-between Prestressed Concrete Beams; Stevin Report 25.5-17-14; Delft University of Technology: Delft, the Netherlands, 2017; p. 196. [Google Scholar]
  37. Lantsoght, E.O.L.; Van der Veen, C.; Koekkoek, R.T.; Sliedrecht, H. Punching capacity of prestressed concrete bridge decks under fatigue. ACI Struct. J. 2019, in press. [Google Scholar] [CrossRef]
  38. Castillo, E.; Fernandez-Canteli, A. A Unified Statistical Methodology for Modeling Fatigue Damage; Springer: Dordrecht, The Netherlands, 2009; p. 189. [Google Scholar]
  39. Hanif, A.; Usman, M.; Lu, Z.; Cheng, Y.; Li, Z. Flexural fatigue behavior of thin laminated cementitious composites incorporating cenosphere fillers. Mater. Des. 2018, 140, 267–277. [Google Scholar] [CrossRef]
  40. Hanif, A.; Kim, Y.; Park, C. Numerical validation of two-parameter weibull model for assessing failure fatigue lives of laminated cementitious composites—Comparative assessment of modeling approaches. Materials 2018, 12, 110. [Google Scholar] [CrossRef] [PubMed]
  41. Lu, C.; Dong, B.; Pan, J.; Shan, Q.; Hanif, A.; Yin, W. An investigation on the behavior of a new connection for precast structures under reverse cyclic loading. Eng. Struct. 2018, 169, 131–140. [Google Scholar] [CrossRef]
  42. Code Committee 351001. Assessement of Structural Safety of an Existing Structure at Repair or Unfit for Use—Basic Requirements; NEN 8700:2011; Civil Center for the Execution of Research and Standard, Dutch Normalisation Institute: Delft, The Netherlands, 2011; p. 56. (In Dutch) [Google Scholar]
  43. CEN. Eurocode—Basis of Structural Design; NEN-EN 1990:2002; Comité Européen de Normalisation: Brussels, Belgium, 2002; p. 103. [Google Scholar]
  44. Walraven, J.C. Background Document for EC-2, Chapter 6.4 Punching Shear; Delft University of Technology: Delft, The Netherlands, 2002; pp. 1–16. [Google Scholar]
Figure 1. Van Brienenoord Bridge: (a) sketch of the elevation of the entire bridge structure, showing the approach slabs, as well as the steel arch; (b) cross-section of the slab-between-girder approach bridge. Dimensions in cm.
Applsci 09 02312 g001
Figure 2. Live load model 1 from NEN-EN 1991-2:2003 [1]: (a) elevation; (b) top view. Edited from Reference [12], and reprinted with permission.
Applsci 09 02312 g002
Figure 3. Dimensions of first 1:2 scale model: (a) top view; (b) cross-section view. Figure adapted from Reference [34]. Reprinted with permission. This figure was originally published in Vol. 116 of the ACI Structural Journal.
Applsci 09 02312 g003
Figure 4. Overview of the second 1:2 scale setup: (a) top view; (b) cross-section view. Figure adapted from Reference [37]. Reprinted with permission. This figure was originally published in Vol. 116 of the ACI Structural Journal.
Applsci 09 02312 g004
Figure 5. Overview of the test setup, showing setup 1 with the new middle deck.
Applsci 09 02312 g005
Figure 6. Relation between the number of cycles N and the applied load ratio F/Pmax in all the fatigue experiments, adapted from Reference [37]. Reprinted with permission. This figure was originally published in Vol. 116 of the ACI Structural Journal.
Applsci 09 02312 g006
Figure 7. Relation between the number of cycles N and applied load level F/Pmax for (a) a single wheel load; and (b) a double wheel load, from Reference [37]. Reprinted with permission. This figure was originally published in Vol. 116 of the ACI Structural Journal.
Applsci 09 02312 g007
Figure 8. Punching perimeter around the wheel print.
Applsci 09 02312 g008
Table 1. Main properties of geometry and reinforcement of the decks of the Van Brienenoord Bridge.
DimensionValue
Thickness h200 mm
Concrete cover c30 mm
Longitudinal reinforcementϕ8 mm–250 mm
Effective depth longitudinal dl166 mm
Area of longitudinal reinforcement As,l201.1 mm2/m
Longitudinal reinforcement ratio ρl0.12%
Transverse reinforcementϕ8 mm–200 mm
Effective depth transverse dt158 mm
Area of transverse reinforcement As,t251.3 mm2/m
Transverse reinforcement ratio ρt0.16%
Average effective depth d162 mm
Average reinforcement ratio ρavg0.14%
Prestressing reinforcement462 mm2–800 mm
Area of prestressing steel Asp0.5775 mm2/mm
Table 2. Overview of the static tests used for assessment of the case study bridge.
Test NumberSize Load
(mm × mm)
Pmax
(kN)
Age
(days)
fcm,cube
(MPa)
BB1200 × 200348.79680.0
BB2200 × 200321.49979.7
BB7200 × 200345.912780.8
BB19200 × 200317.822379.9
FAT1S1150 × 115347.89482.2
FAT7S1150 × 115393.724088.8
FAT8S22 of 150 × 115646.124588.6
Table 3. Overview of the punching fatigue experiments.
Test
Number
SetupSize Load
(mm × mm)
WheelF/PmaxNAge
(days)
fcm,cube
(MPa)
BB171200 × 200S0.801314782.6
BB181200 × 200S0.85165682.6
BB231200 × 200S0.6024,80030179.9
BB241200 × 200S0.451,500,000307–32679.9
BB261, new150 × 115S0.481,405,33735–5970.5–76.7
BB281, new150 × 115S0.481,500,00068–9776.8–77.1
0.581,000,00097–11377.1–77.3
0.70714411377.3
BB291, new150 × 115S0.581,500,000117–13677.3–77.5
0.64264,840136–13977.5–77.6
BB301, new150 × 115D0.58100,000143–14477.6
0.501,400,000144–16277.6–77.8
0.58750,000162–17177.8–77.9
0.67500,000171–17777.9–78.0
0.7532,64317778.0
BB321, new150 × 115S0.7010,00018478.1
0.58272,548185–18778.1
FAT2D12150 × 115S0.69100,000102–14482.6–84.6
0.582,915,123
0.69100,000
0.75150,000
0.8120,094
FAT3D12150 × 115S0.69200,000149–16884.9–85.8
0.581,000,000
0.69100,000
0.75300,000
0.816114
FAT4D12150 × 115S0.581,000,000169–19085.8–86.8
0.69200,000
0.75100,000
0.8163,473
FAT5D12150 × 115S0.7110,000192–21791.6–89.6
0.511,000,000
0.61100,000
0.661,000,000
0.711424
FAT6D12150 × 115S0.7110,000219–23989.6–88.8
0.511,000,000
0.61100,000
0.71160,000
0.51410,000
0.7126,865
FAT9D22150 × 115D0.59500,000246–25588.5–88.2
0.65209,800
FAT10D22150 × 115D0.63100,000260–28490.2–91.3
0.561,000,000
0.63950,928
FAT11D22150 × 115D0.67100,000288–31591.5–92.8
0.601,000,000
0.671,100,000
0.751720
FAT12D12150 × 115S0.893031885.9
FAT13D12150 × 115S0.863831985.8
Table 4. Overview of the resulting Unity Checks according to the Eurocode.
Wheel PrintVEd (kN)VRd,c (kN)Unity Check
400 mm × 400 mm2363370.70
230 mm × 300 mm2322870.81
Table 5. Comparison between the mean predicted punching capacity and punching capacity in experiment.
Test NumberWheel Print
(mm × mm)
Vexp
(kN)
VR,c
(kN)
Vexp/VR,c
BB1200 × 200348.7141.92.458
BB2200 × 200321.4141.92.266
BB7200 × 200345.9141.92.438
BB19115 × 150317.8121.62.613
FAT1S1115 × 150347.8124.42.795
FAT7S1115 × 150393.7127.43.091
Table 6. Determination of the safety factor for the deck of Van Brienenoord Bridge.
Test NumberVexp
(kN)
VBB
(kN)
VBB,d
(kN)
VEd
(kN)
VBB,d/VEd
BB1348.71162.3721.9236.03.06
BB2321.41071.3665.4236.02.82
BB7345.91153.0716.1236.03.03
BB19317.81059.3658.0232.02.84
FAT1S1347.81159.3720.1232.03.10
FAT7S1393.71312.3815.1232.03.51

