1. Introduction
The food industry forms an important sector of the European economy [
1]. It is involved in processes related to the increase in gross domestic product as well as satisfying domestic demand. It also contributes to the creation of new jobs and plays an important role in the international trade exchange. Consequently, we can state that the role and relevance of the food industry are huge. However, the production potential of the food industry and its capabilities are influenced by the potential held in the natural resources and technical measures that are accessible in a given country. These factors, directly or indirectly, affect the production of food products. However, when the importance of the food industry in the national economy and individual countries of the European Union is investigated, the impact of agriculture on the natural environment should be particularly taken into account. Measures aimed at reducing the negative impact of human activity on the environment are increasingly being taken into account in production [
1,
2]. In accordance with the idea of sustainable development, the rational use of natural resources will meet the needs of the present and future generations. In addition, the measures applied to limit the generation of large amounts of waste or process wastewater can, consequently, contribute to a smaller financial burden for enterprises associated with their disposal [
2]. In recent years, the Polish food sector has undergone tremendous changes, both in terms of technology and measures linked to environmental protection. Thanks to the constant technical, engineering, and innovative development, Poland has become one of the leading food producers in Europe. One of the factories belonging to the group of European leaders, in terms of the variety of products on offer, is provided by the yeast factory analyzed in this paper [
3,
4]. The yeast industry consumes significant amounts of water for the production of yeast and, consequently, huge amounts of process wastewater (technological wastewater) are produced, which need to be later utilized. Process wastewater from the yeast industry mainly originates from decanting and wort thickening. This wastewater is of plant origin and due to the high content of nitrogen, potassium, and organic substances, it can be (and often is) deposited on agricultural fields (AF) to play the role of a fertilizer. Chemical analysis of the level of humus in soils, in which process wastewater from the yeast plant is deposited, does not demonstrate an increase in the accumulation of heavy metals. The values of concentrations of trace elements in soils irrigated with yeast wastes are much lower than the levels that are permitted in soils and plants. The parameters of natural geochemical values in soils are, thus, not exceeded [
5]. Research has also been carried out into the treatment of yeast wastewater by application of nano-filtration, electro-coagulation, or in the use of technological yeast wastes for application in the direct generation of electricity using microbial fuel cells [
6,
7,
8,
9,
10,
11,
12]. The deposition of process wastewater derived from the yeast industry on agricultural fields (AF) seems to represent the most rational solution [
5,
13,
14]. Cultivation on AF fertilized with yeast technological wastewater is characterized by a considerable efficiency. In addition, such wastewater contains organic substances that have a positive effect on the fertilized soils and contributes to the improvement of soil quality in the vicinity of the plant [
15]. However, it is possible to irrigate AF using only limited amounts of process wastewater [
15,
16]. The main reason that the volume of wastewater directed to AF needs to be limited is associated with the concentration of nitrogen in this wastewater [
15,
17]. For this reason, wastewater is often pre-treated in an evaporator station (ES), in order to decrease the nitrogen concentration in wastewater that is applied to AF. Theoretically, when a larger amount of wastewater is routed to process in an ES, the possibility of using larger amounts of process wastewater in AF is feasible, which, in turn, can lead to an increase in the yeast output [
18]. Previous studies [
18,
19] have shown the necessity of a detailed analysis of the wastewater treatment system in yeast factories. The analyzed factory includes a three-stage wastewater treatment system, comprised of an agricultural field (AF), an evaporator station (ES), and a biological wastewater treatment plant (WWTP). The analysis of the three-stage wastewater treatment system (AF–ES–WWTP) in a yeast factory will provide the development of a solution leading to an increase in production, without the plant exerting additional pressure on the natural environment. A detailed analysis of technological wastewater streams will determine the level in which the production of yeasts (and fertilizers forming a by-product) can be increased in the ES. The use of the ES is essential, in order to reduce the concentration of nitrogen in process wastewater and the possibility of increasing the amount of their deposition on AF, in particular in the case of large-scale production.
As a result of irrigation, when applying process wastewater derived from yeast production, large amounts of total nitrogen are introduced into the soil, mainly in organic form. Nitrogen transformations occurring in the soil primarily includes decomposition processes involving the mineralization of organic nitrogen, nitrification, and de-nitrification, consequently leading to the formation of gaseous nitrogen molecules. Secondly, there are synthetic processes leading to the formation of organic compounds [
20,
21]. This process involves mineral nitrogen uptake by plants and an immobilization process involving the combination of mineral nitrogen into the biomass of soil micro-organisms and then into humus compounds [
20,
22].
The process wastewater from yeast production forms a completely safe substance, in terms of sanitary characteristics. In addition, the concentrations of heavy metals are at permissible levels by the law. Therefore, this wastewater can be employed directly for crop and vegetable fertilization. In particular, plants with a high demand for nitrogen and potassium, such as beets, rapeseed, or corn, can provide a preferred use. If there is no need for the production of fodder crops in a specific area, long-term irrigation with process wastewater derived from yeast production offers a suitable source of water to be applied in industrial plants and cereals [
23,
24]. Therefore, irrigation applying process wastewater from yeast production to agricultural fields provides the most rational method of its treatment. However, irrigation by application of process wastewater is limited by the regulations guiding the amount of substances introduced into soils and waters [
25,
26].
This analysis of wastewater streams is based on data obtained from the Lesaffre yeast factory (Wołczyn, Poland). Due to the high quality of the final products and agricultural use of process wastewater generated in the factory, Lesaffre Poland follows the guidelines of sustainable development in its environmental protection program. The factory taken for the analysis is the largest yeast production factory in Europe, and thus offers a representative object for the present analysis. The purpose of this paper involves the determination of the theoretical and feasible value of production growth, based on variation in the amount of technological wastewater designed for application in ES.
2. Analysis of the Potential for the Increase in Yeast Production and Results
The research presented in this paper involves the analysis of the influence of the direction of additional wastewater into the ES on an increase in yeast production. The analysis reported in this paper involves the concentration of total nitrogen in wastewater streams (Si), as it is the main parameter applied to determine the amount of wastewater that can be applied in AF. In addition, this analysis accounts for the use of the AF–ES–WWTP system. The increase in yeast and fertilizer production was achieved by assuming a constant area of AF. Nitrogen is a basic parameter in limiting the amount of wastewater directed to AF. Moreover, the analysis includes also the AF–ES–WWTP.
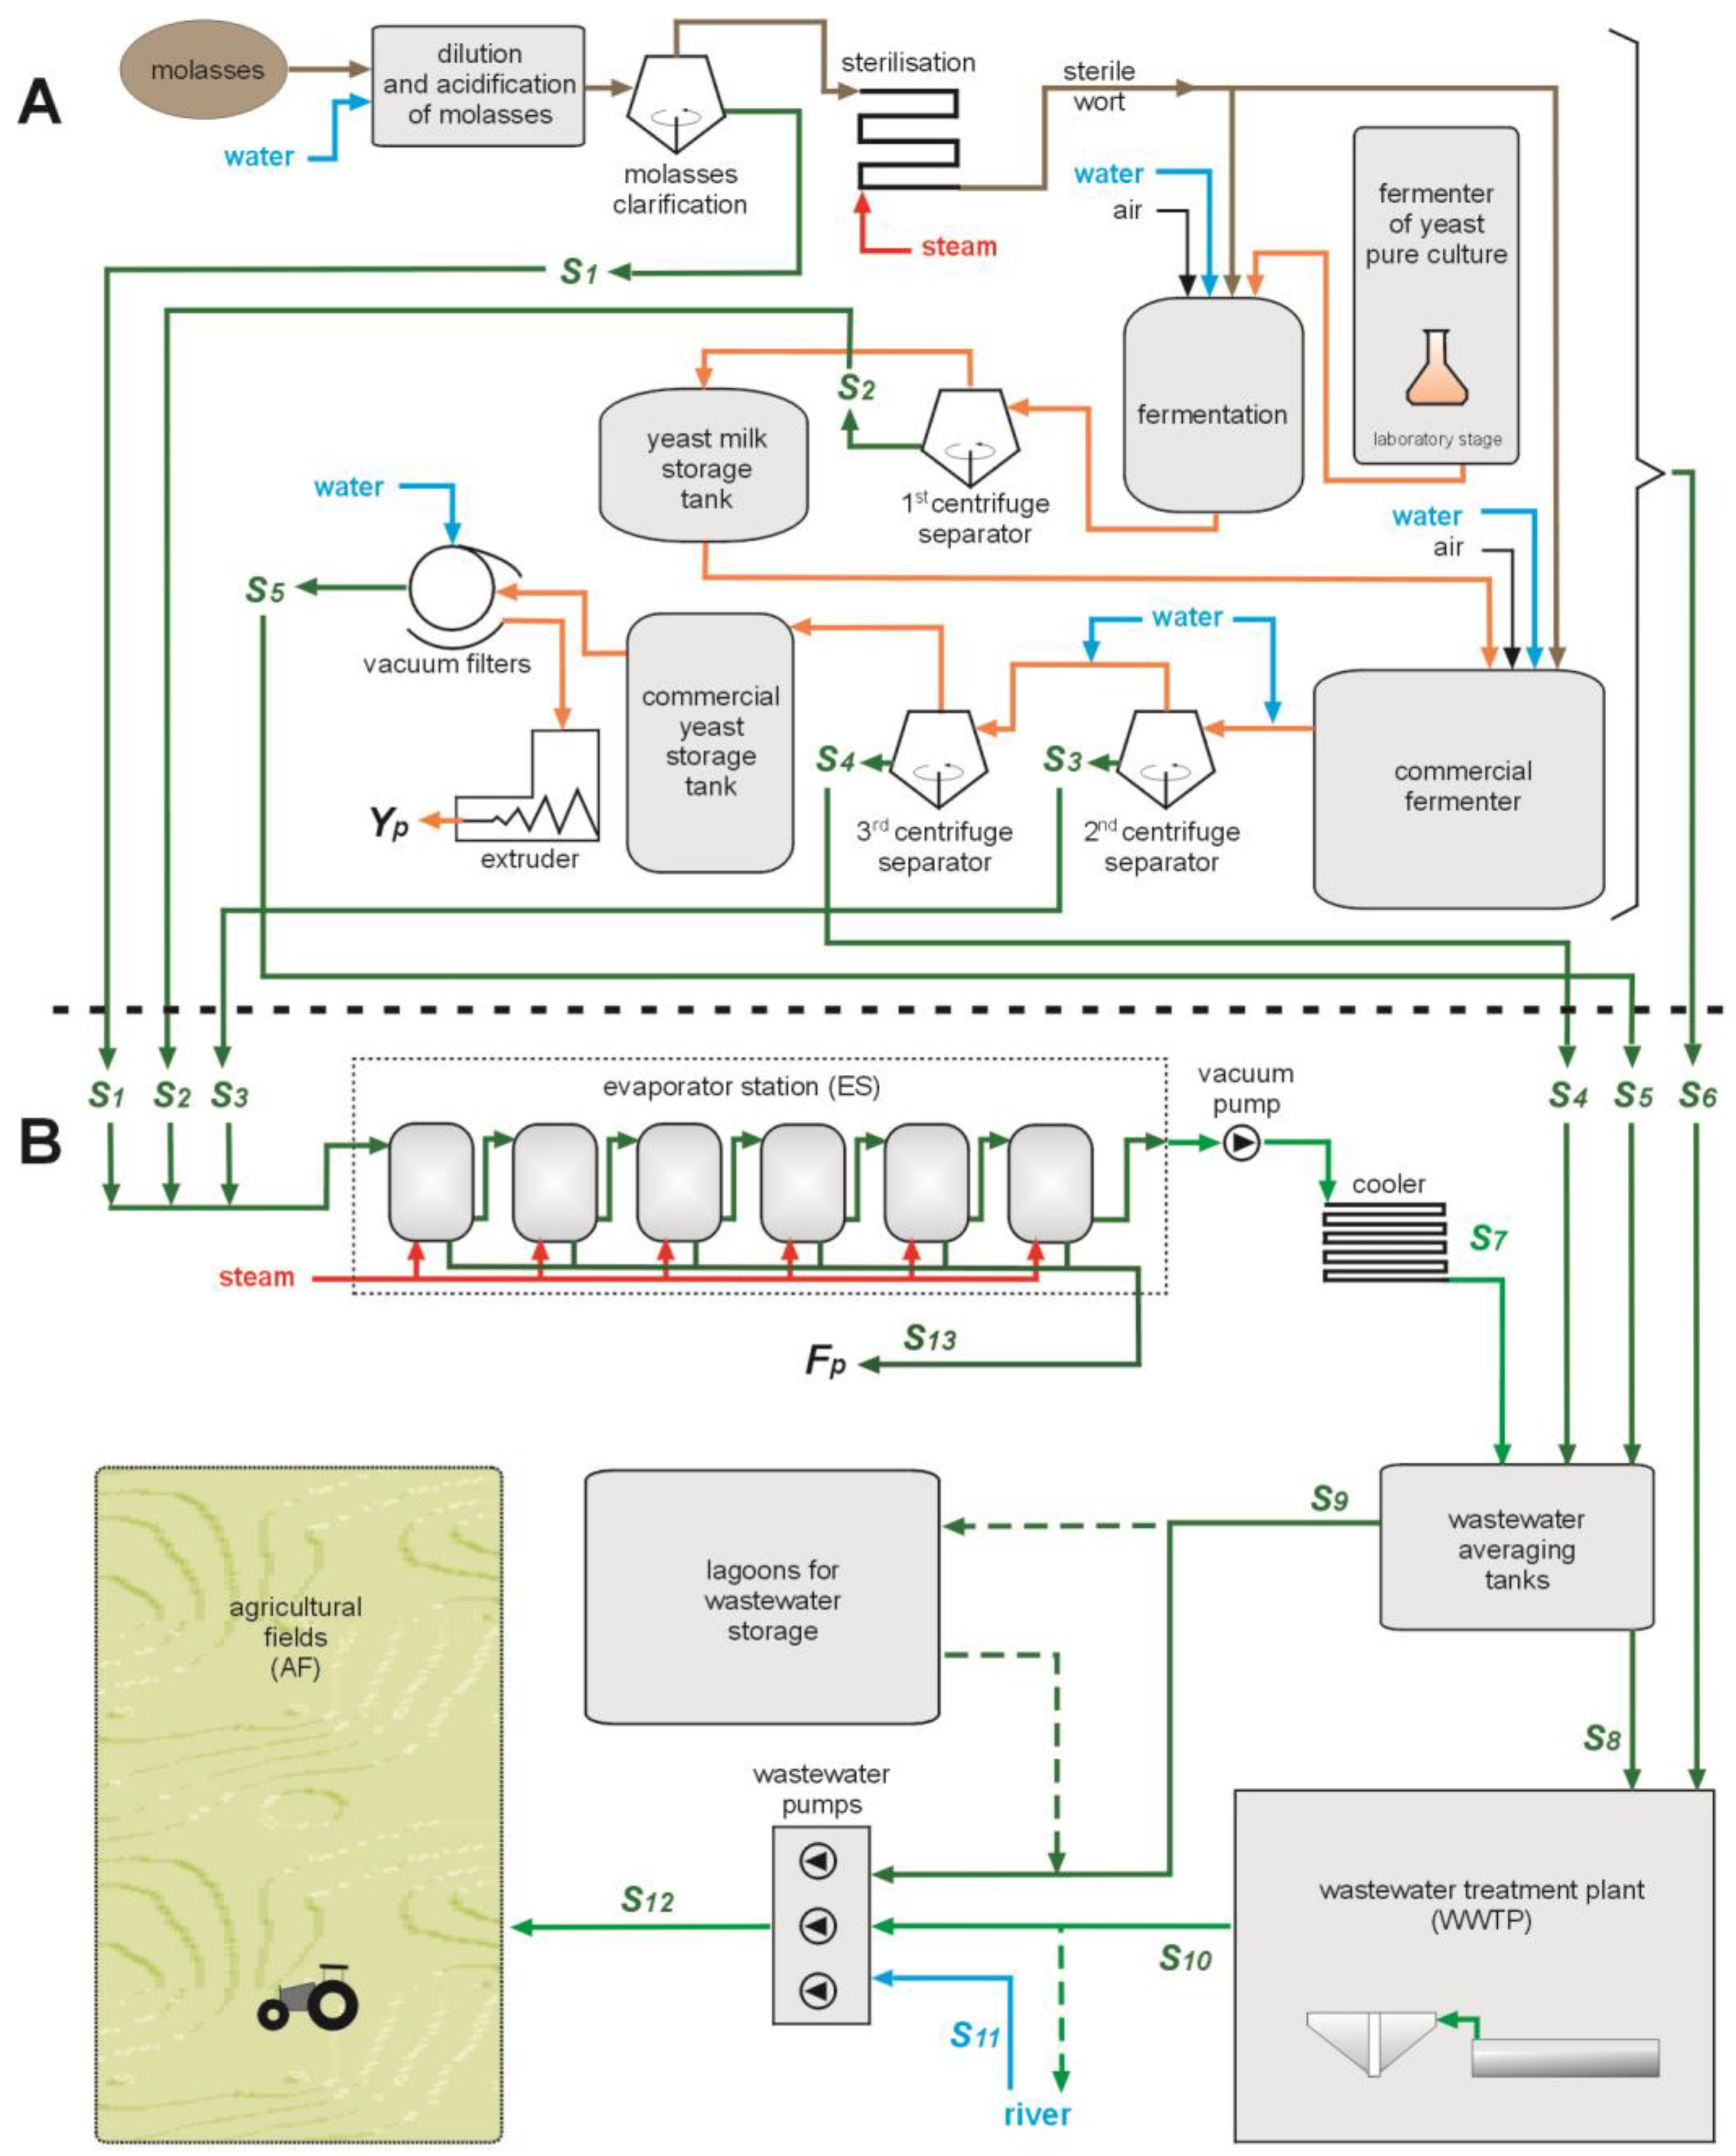
Figure 1 shows the scheme of the yeast production process and the AF–ES–WWTP system.
Figure 1A shows the sources of process wastewater in the yeast factory, and
Figure 1B shows the paths of the wastewater streams. The
S6 stream of process wastewater (
Figure 1A) is directed directly to the WWTP (
Figure 1B). This stream is not directed to the AF, because it is a domestic wastewater resulting from the washing of the devices. This stream of the wastewater includes detergents, oils, domestic pollutants, chemicals, heavy metals, metal, and rubber filings, among other waste products. However, after treatment of this wastewater (as clean wastewater), it can be directed to the wastewater pumps, in order to dilute the process wastewater stream
S9 directed to the AF. The concentration of nitrogen (
C1) in the
S1 stream is very high, but the
S1 stream has low volume (see
Table 1). The concentration of the nitrogen (
C8) in the
S8 stream is high, but the
S8 stream is negligible. This stream is needed only for microbes for the operation of the WWTP (
Figure 1B). Thus, these streams (
S1 and
S8) do not have a large effect on the final nitrogen concentration (of the
S9 stream).
Process wastewater (
S2 and
S3) from first and second centrifuges is characterized by the highest concentrations of pollutants. Although the wastewater from clarification of molasses (
S1) is characterized by even higher pollutant concentrations, the volume of this wastewater is very small. The volume of the process wastewater and amount of nitrogen in process wastewater are presented in
Table 1.
Si, stream of wastewater [m3/year];
S1, stream of process wastewater after molasses clarification;
S2, stream of process wastewater from the first centrifuge separator;
S3, stream of process wastewater from the second centrifuge separator;
S4, stream of process wastewater from the third centrifuge separator;
S5, stream of process wastewater from the vacuum filters;
S6, stream of domestic wastewater and after cleaning of the process devices;
S7, stream of pre-treated process wastewater after the evaporator station (ES);
S8, little stream of process wastewater directed to the wastewater treatment plant (WWTP);
S9, stream of process wastewater directed to the agricultural fields (AF) from equalized wastewater;
S10, stream of cleaned wastewater directed to the AF;
S11, stream of water from the river;
S12, the S9 stream of process wastewater (directed to AF) diluted by S10 or S11 stream;
S13, stream of pollutants from the ES (Fp fertilizer).
The stream
S9 [m
3/yr] of process wastewater (
Figure 1B) directed to the AF can be described as Equation (1)
The
S9 stream (
Figure 1B) is averaged in the tanks of wastewater equalization. The nitrogen concentration (the analysis is based on nitrogen concentration) in the
S9 stream can be described by Equation (1a):
where
Ci is the concentration of nitrogen in the stream
Si [kg/m
3].
The stream (
S8) that is routed to WWTP is very small; however, it is needed for the adequate performance of micro-organisms in the WWTP. For this reason, it was neglected in the computations. Hence, the equation in 1a assumes the form
The concentration of pollutants in the
S9 stream can be described as
assuming that (taking into account that the
S9 stream is omitted)
The stream S12 is the stream S9 diluted by the S10 or S11 stream. Therefore, the amount of nitrogen in the S12 stream (directed to the AF) is equal to the amount of nitrogen in the S9 stream.
The amount of nitrogen (deposited into the AF) is limited by the Regulation of the Minister of Environment of 16 November 2014 (on the conditions to be met when introducing wastewater into waters or into the ground, and on substances particularly harmful to the aquatic environment) and by the Directive 2010/75/EU of 24 November 2010 on the industrial emissions (integrated pollution prevention and control) [
25,
26]. The analyzed yeast factory meets all Polish and EU standards for the amount of nitrogen deposited into the AF. Due to the high nitrogen pollution of the soils and the waters, an increase in yeast production is possible only if all the standards are met [
24,
25,
26].
However, within these regulations, it is possible to control this parameter according to, for example, the kinds of plants grown on the AF. The
DWW dose (of the process wastewater) that can be utilized on the one hectare of AF (depending on the
CN nitrogen concentration) can be determined from Equation (6) [
15,
16]
where
DWW is the maximum dose of the process wastewater which can be directed to the AF [m3/ha⋅yr];
pN is the total nitrogen demand for the plants which are cultivated on the AF [kg/ha⋅yr];
kdN is the total nitrogen demand factor (if the AF are fertilized by only the process wastewater, fN = 1);
CN is the total nitrogen concentration in the process wastewater directed to the AF [kg/m3];
kuN is the total nitrogen utilization factor (depending on the irrigation system); and
EN is the nitrogen fertilizer equivalent (for process wastewater from yeast production, EN = 1).
The volume of nitrogen,
mNAF, which can be deposited on the AF, can be defined as
where
mNAF is the amount of nitrogen which can be deposited into the AF [kg/ha⋅yr], and
C9 is the concentration of nitrogen in stream S9 [kg/m3].
The yeast production volume,
Yp, is limited by the amount of nitrogen [Mg/yr]
where
AAF is the area of the AF [ha], and mNpY is the amount of nitrogen in the process wastewater stream (directed to the AF) per 1 Mg of yeast production [kg/Mg].
Thus, the area of the AF
AAF [ha] can be described as
The nitrogen demand of plants is relative to the type of agricultural plants produced in the AF.
The maximum amount of the process wastewater
DWWr that is routed to AF can be expressed by the relation
where
ai is the share of the individual plant crops i in the AF; DWWi is the maximum dose of process wastewater for plants that are cultivated on the AF [m3/ha⋅yr]; and n is the number of crops,
The volume of process wastewater
Vww that is applied annually to the AF can be determined on the basis of Equation (12)
When we take into account Equations (7) and (12), the volume of yeast production
Yp (Equation (8)) can be expressed in the form
For the specific surface area of the agricultural land (in the investigated case, with regard to the agricultural land irrigated by the analyzed plant), the values of the parameters
pN,
kdN, kuN,
EN, and
AAF assume constant values. Hence, the value
Dwwr is also constant. For this reason, it is possible to apply an indicator
WN [kg/year] to determine the amount of total nitrogen that is applied to the agricultural fields of the analyzed yeast plant. This parameter can be expressed in the following form:
Therefore, Equation (12) can be described as
Using the indicator
WN allows us to write Equation (12) as
It should be noted that the parameter mNpY is determined only by the technology of yeast production. This parameter is specific for each specific yeast factory. However, directing a larger amount of process wastewater to the ES will result in a lowering of the nitrogen concentration C9 in the wastewater stream S9 (directed to the AF). Therefore, lowering the concentration C9 in the stream S9 will result in decrease in the value of the mNpY parameter. Thus, the value of Yp (Equation (16)) will be higher.
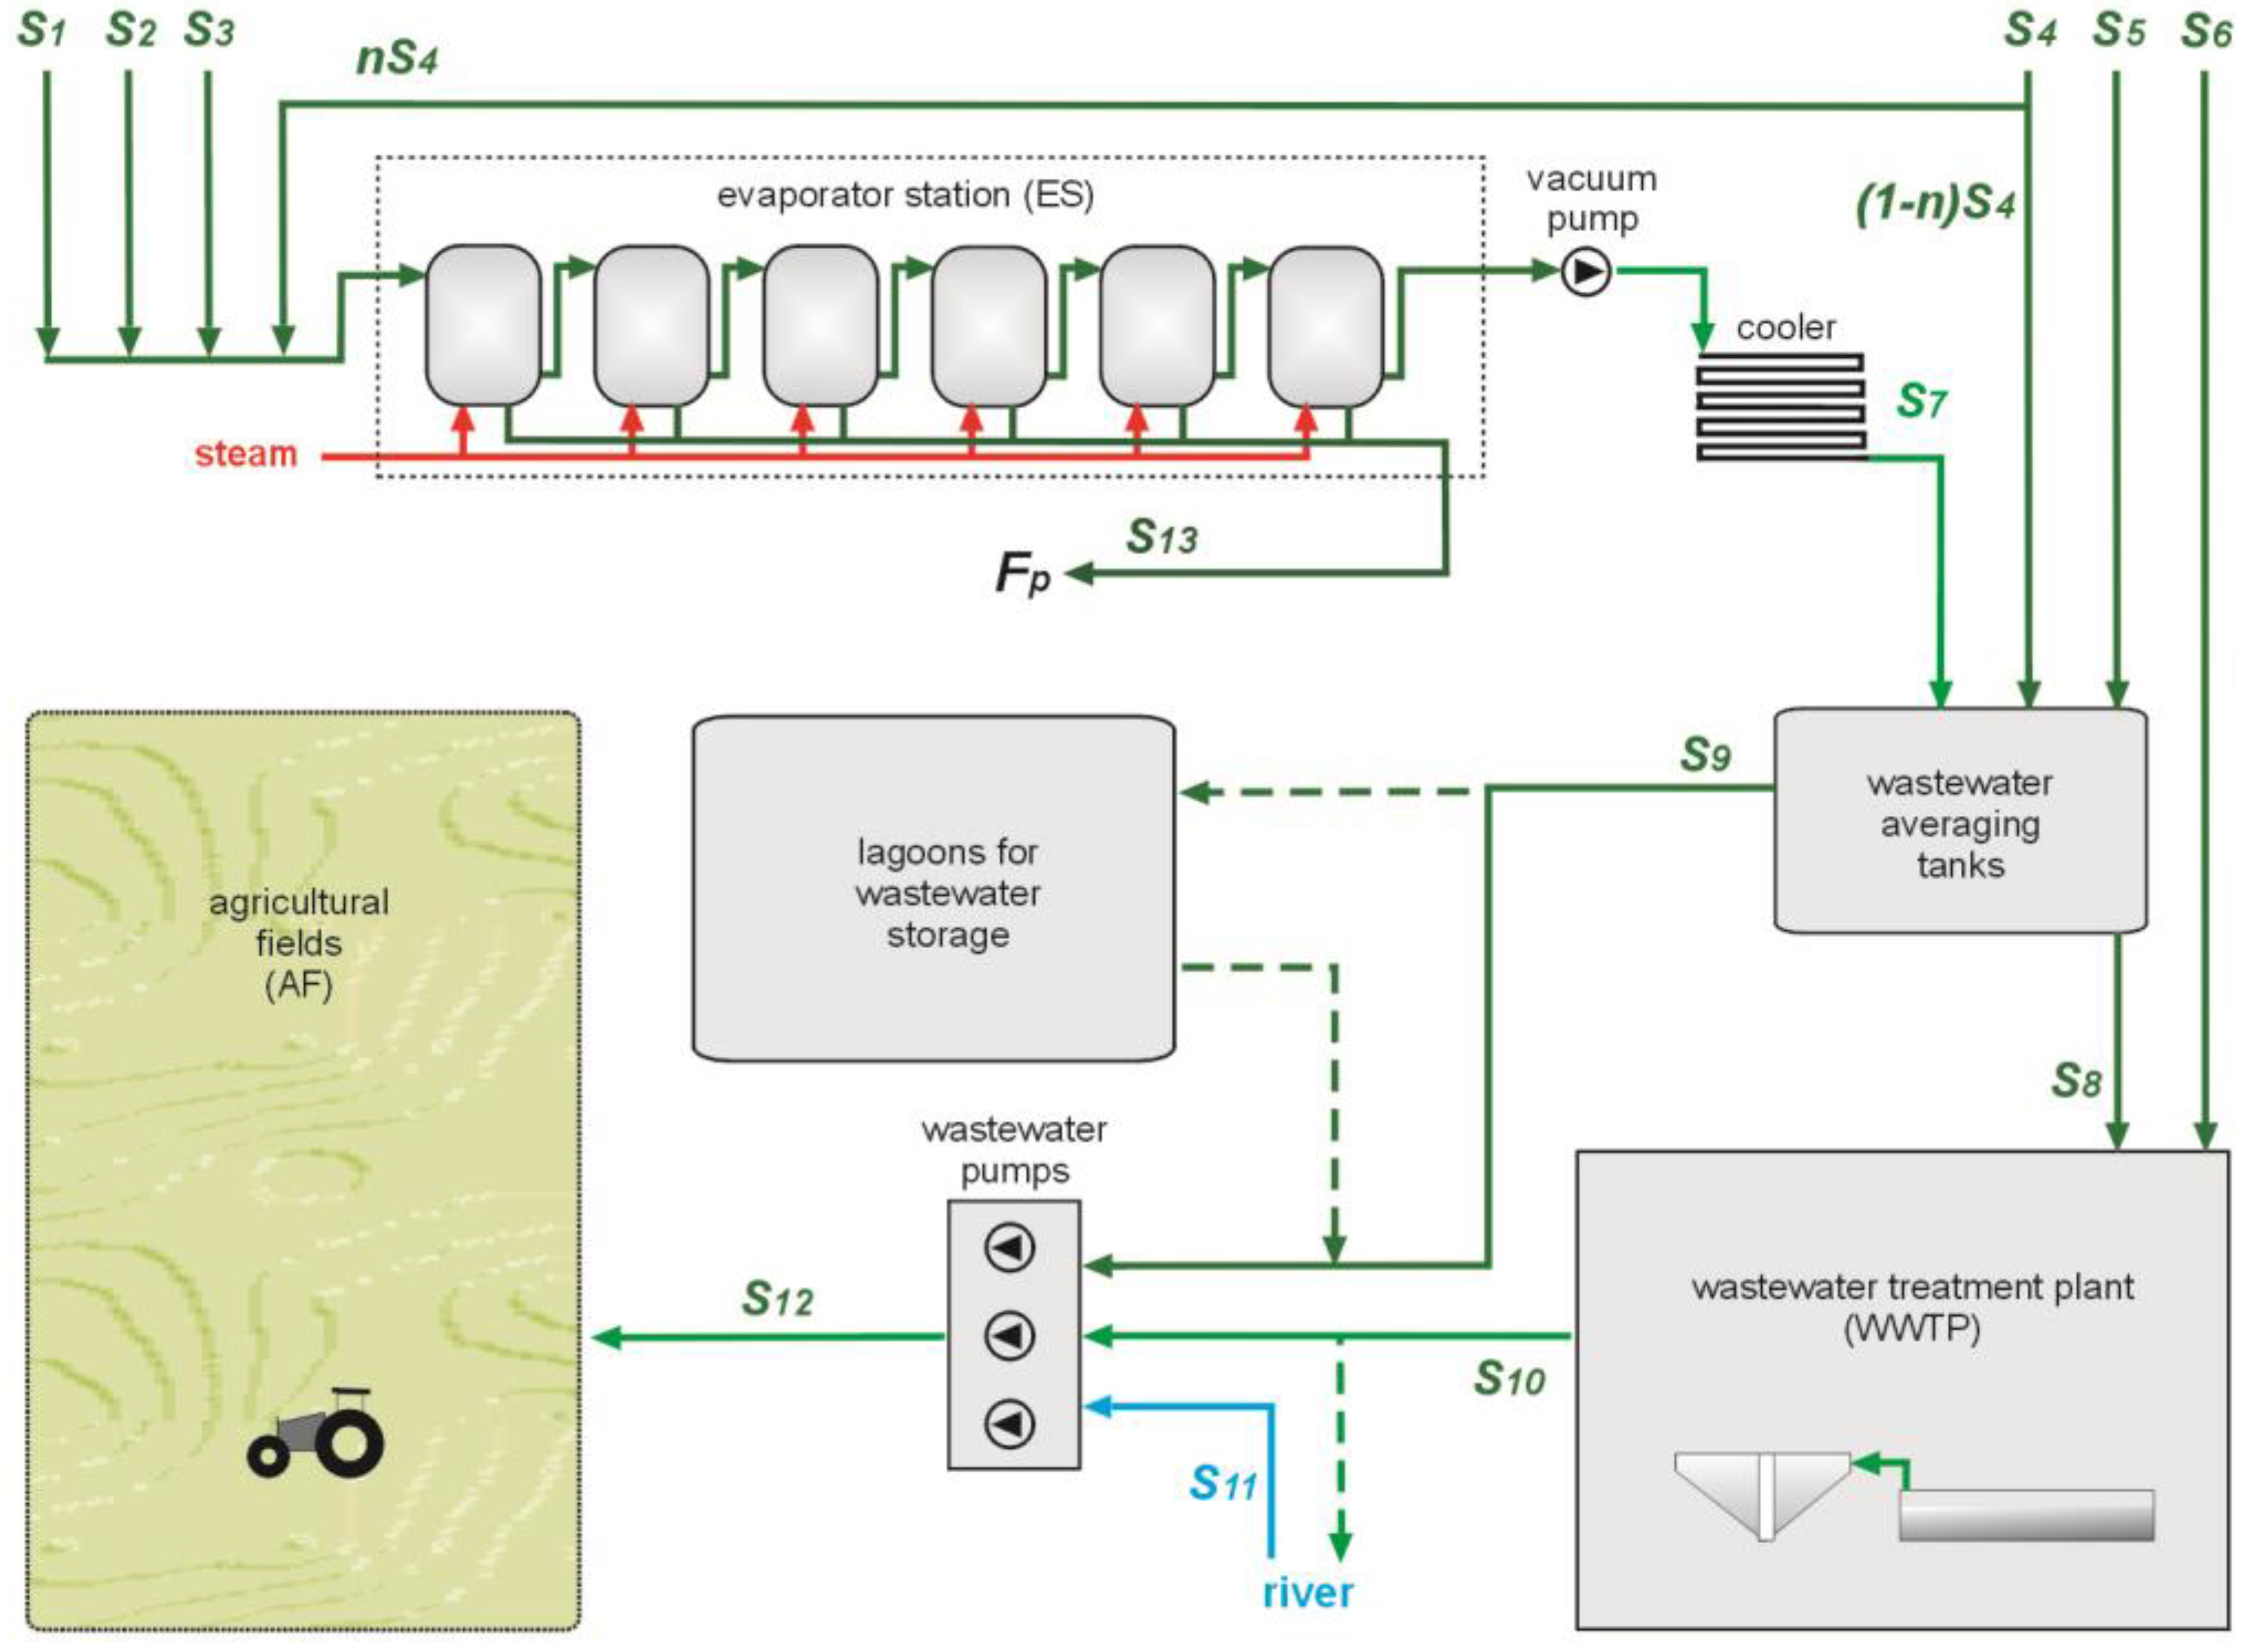
Currently, only the process wastewater coming out coming out from the three separators (streams S1, S2, and S3) is sent to the ES. Nevertheless, directing a certain part of stream S4 to the ES will enable a further reduction of the nitrogen (in reality, this affects all pollutants, but this analysis is based on the nitrogen concentration in the wastewater streams directed to the AF) concentration and, in consequence, increases both the maximum volume of the process wastes distributed in the AF (per year) and the yeast production.
Figure 2 shows the AF–ES–WWTP system with the paths of the wastewater streams and an additional
nS4 stream, directed to the ES.
The streams
S1 and
S8 are negligibly small. Thus, they do not affect the final concentration of nitrogen in the stream, expressed as
S9. Therefore, these streams can be disregarded in the calculations. Thus, the part of stream
S4 of wastewater directed to the ES (
Figure 2) can be described as
where
nS4 is the part of the S4 wastewater stream directed to the ES, (1 − n)S4 is the part of the S4 process wastewater which joins the S9 stream (directed to the AF), and n ∈ (0, 1).
The
S9 stream of process wastewater [m
3/yr] (
Figure 2), which is directed to the AF, can be described (based on Equations (5) and (17)) as
The nitrogen concentration in the
S9 stream (after a part
n of the
S4 stream is directed to the ES) is described (based on Equations (3) and (18)) by
Taking into account Equations (4) and (19) (and omitting the
S1 stream), the
C9 nitrogen concentration, after directing the
n part of the
S4 stream to the ES, can be described as
The first part of this paper involved the determination of the theoretical increase in yeast production, on the basis of an assumption regarding complete nitrogen neutralization taking place in ES. This means that concentration expressed as
C7 is equal to 0. Thus, Equation (20) can be written in the form
The mass of nitrogen
mNAF, which is directed annually to the agricultural fields (AF), can be described as
It is possible to calculate the amount of nitrogen in the process wastewater stream (directed to the AF) per 1 Mg of the yeast production during the actual yeast production:
Taking into account Equations (22) and (23), we can calculate the total amount of nitrogen in the process wastewater stream (
mNpYplus) per 1 Mg of yeast production, during yeast production, after directing the
nS4 stream to the ES:
where
mNpYplus is the total amount of nitrogen in the process wastewater stream (directed to the AF) per 1 Mg of yeast production, after directing the nS4 stream to the ES [kg/Mg]; and Ypplus is the yeast production volume, after directing the nS4 stream to the ES [Mg/yr].
Based on Equations (16) and (22)–(24), it can be assumed that
Taking into account Equations (23) and (24), the ratio of production after directing the
nS4 stream to the ES to the current production, can be described as
The increase in yeast production (
ηYp) after directing the
nS4 stream to the ES can be described as
In addition, along with an increase in yeast production (
ηYp) after the stream
nS4 is routed to ES, at the same time, an additional volume of pollutants (mainly nitrogen, but also potassium or organic substances) is derived as the organic fertilizer
Fp (
Figure 1B and
Figure 2—
S13). The increase in the amount of fertilizer
ηFp is relative to the additional volume
nS4 of the process wastewater that is routed to the ES, and is directly proportional to the increase in yeast production
ηYp.
The
Fp organic fertilizer obtained in the ES has a dark brown color and a liquid-honey consistency. This fertilizer meets all standards for substances entering the soil [
27,
28]. Moreover, this product is readily used by the local farmers as an organic fertilizer and as an animal feed additive [
28,
29]. This fertilizer is introduced into the soil mainly during plowing.
The increase in production of both Yp and Fp was analyzed, assuming a constant surface area of the AF, as well as constant crops. In the yeast factory adopted in this analysis, the area of AF is equal to 1800 ha. Industrial and cereal crops (in the ratio of 3:2) are cultivated in these AF.
On this basis, the possible increase in yeast and fertilizer production could be estimated on the basis of the relation in (29).
The three-stage wastewater treatment system implemented in the plant leads to a complete neutralization of the pollutants contained in the process wastewater. However, a single-stage wastewater treatment system (e.g., just the ES) is not capable of completely eliminating the existing concentration of pollutants. In the conditions of the actual production process (derived on the basis of data from the factory), it is necessary to take into account the actual ratio of nitrogen neutralization at the ES. Taking into account the data summarized in
Table 2 and
Table 3, the calculations offer a curve representing the increase in production for the actual production facility (i.e., in the analyzed yeast factory).
This study assumed that:
- -
Nitrogen concentration is reduced to 0% at the ES (theoretical calculation);
- -
Nitrogen concentration is reduced by 52% at the ES (for real parameter of ES,
Table 2); and
- -
The nitrogen demands for the industrial and cereal plants grown in the AF (
Table 3) is accounted for in the Equations (6) and (14).
Figure 3 presents the curve representing the increase in the yeast output
ηYp fertilizer production
ηFp as a function of
n (the ratio of the flux
S4 that is routed into the ES).
As we can see from the top curve (
Figure 3, black dotted line), when the entire volume of the wastewater
S4 (n = 1) is used as an input to the ES, we note an increase in the yeast and fertilizer output by just over 60% (
ηYp = 0.6057). This provides a considerable increase; however, this is only theoretical, since a complete neutralization of total nitrogen is assumed. Taking into account the efficiency of the existing evaporator station (
Table 1,
Table 2 and
Table 3), the actual achievable increase in production in the analyzed plant (
Figure 3, red line) was determined to be just over 10% (
ηYp = 0.1027).


