Article

Measurement and Analysis of the Stepwise Curved Surface of Diffractive Optical Elements by a Constant Speed Confocal Probe

State Key Laboratory of Precision Measuring Technology & Instruments, Centre of MicroNano Manufacturing Technology, Tianjin University, Tianjin 300011, China
*
Author to whom correspondence should be addressed.
Appl. Sci. 2019, 9(11), 2229; https://doi.org/10.3390/app9112229
Submission received: 13 April 2019 / Revised: 17 May 2019 / Accepted: 28 May 2019 / Published: 30 May 2019
(This article belongs to the Section Optics and Lasers)

Abstract

:
Diffractive optical elements (DOEs) play an important role in improving imaging quality and reducing system volume. The measurement of DOE surface topography is of great significance to the evaluation of DOE quality and the optimization of its manufacturing process. However, there are still some difficulties in measuring the large curvature and the large sag of curve-based DOEs. In this paper, considering the geometrical feature information and measurement problems of curve-based DOEs, a measurement method based on a confocal measurement principle for DOE measurement is proposed. The proposed measurement data processing method is verified by a high-precision motion axis system and the stability of an ultra-precision lathe. The results show that the proposed measurement method can reconstruct and accurately evaluate the three-dimensional surface topography of DOEs.

1. Introduction

Diffractive optical elements (DOEs) are new optical elements based on the principle of light diffraction. The early form of DOEs was binary optical elements, which are usually used for laser shaping. For a specific wavelength of incident laser, the microstructure of the DOE surface is designed, and the energy and phase of laser are adjusted to achieve the desired output spot pattern. After years of development, this system is now very mature and has become popular in industrial applications [1]. The Fresnel lens is a typical DOE element, and is usually a rotational symmetric element composed of a series of concentric rings. By designing a “step” at a specific phase mutation point, the diffraction efficiency of the optical system can be improved. The DOEs can be considered as being created by removing slabs of material that do not contribute to the bending of the light rays to a focal point. The surface profile of the DOEs, which is responsible for the optical power of the element, is preserved, but the volume and weight of the DOEs are reduced and the optical system specifications are improved, which is a common means to achieve miniaturization of optical systems. Planar substrate DOEs are usually used to build the optical path, but the quality of the system will be lost, whilst aspherical-based DOEs are often used to correct spherical aberrations in special cases [2,3]. Especially in an infrared optical system, due to the limitations of the optional infrared material, the diversification of the surface design can not only correct the chromatic aberrations and improve the system performance, but also increase the design freedom. The optical system structure of a curve-based DOE is more simplified and has important potential applications in the fields of optical imaging systems, optical surface inspection, spectral analysis, and bionics [4]. All diffractive optics are in the geometry—the edges of the phase transitions and the heights of the profiles. Materials enter only in determining the step height of the profile and as part of any classic optical design that incorporates a diffractive surface. Therefore, the generation, control, and measurement of the surface profiles are the keys to the design and fabrication of diffractive optics [5].
Dimensional measurements of diffractive optic structures are used both during and after the fabrication of the element. Typical measurements include lateral feature sizes, locations of the transition points across the field of the DOE, grating depths, verticality of grating side walls, rounding of edges, surface roughness, and other geometrical factors. Although the performance of the DOE can usually be inferred from the measured geometry, metrological measurements are normally used to troubleshoot and quantify problems in the fabrication process. Due to the discontinuity of the DOE surface, there are some sudden changes in the phase and depth of the surface structure, which lead to difficulties in the detection of the machining quality of the workpiece. The traditional testing equipment is mainly for continuous surfaces, so the detection of DOEs has always been difficult, which restricts precision machining. Current research shows that the measurement of DOEs remains in feature measurement, which is not capable of acquiring the specific data of the surface topography. Mechanical contact measurement is mature and widely used in surface topography measurement. The accuracy of continuous surface topography measurements can reach the nanometer level. The use of a profilometer to measure DOEs is limited by the size of the diamond probe [6,7] and the atomic force probe [8,9]. The profilometer can detect the position of the DOE’s teeth, but there is noise in the signal, and there is also generally measuring pressure in the profilometer, which can cause damage to the workpiece. Phase-shifting interferometry has nanometer-level detection accuracy and is commonly used for non-contact measurement of DOE surface topography. A white light interferometer (WLI) is often used to measure the surface topography of the injected DOE and analyze the quality of the DOE injection molding process. From the measurement profile in the literature, since the principle of interferometry is limited by the numerical aperture of the objective lens, the measurement range is small, and the measurable depth is small. Therefore, it is difficult to measure the tooth of the DOE surface by using white light vertical interferometry [10]. Although the surface roughness and tooth height of a DOE can be obtained by measuring with a WLI, the complete and accurate tooth pitch cannot be obtained because of the limitations of the measuring field of view. Therefore, the method of multi-aperture stitching is used to measure the local structural feature information of a DOE, but there is a certain error in measurement data splicing and the efficiency is low [11]. The confocal microscopic measurement method has the ability to perform axial chromatography, which can measure the 3D morphology of the measured sample combined with transverse scanning. Chromatic confocal measurement is a representative confocal microscopy technique with nanoscale measurement resolution and measurement accuracy, which can be directly evaluated by spectral signal to obtain the position height information of the point along the optical axis on the surface of the workpiece [12,13]. Nanovea, in the United States, realizes an accurate measurement of the surface topography of the DOE based on the ST400 3D non-contact surface profilometer, developed by a confocal probe, which allows the height and spacing information of the diffraction structure to be determined. However, this system is more suitable for small planar substrate DOE topography measurement. Due to the limitations of system freedom, it is difficult to measure a curve-based DOE on a structure of a larger size. Most of the systems adopt the point-by-point scanning mode, whose measurement efficiency is slow. Moreover, the measurement accuracy depends on the positioning accuracy of the scanning points [14].
In summary, because of the special structure of DOEs, there are some shortcomings in the current measurement methods, and there is a lack of high-precision measurements and evaluation of the geometric characteristics of the DOE machined surface. Motivated by this, a new measurement and evaluation strategy of DOEs is studied in this paper. We propose a novel and fast non-contact measurement method to improve the measurement speed. It is not necessary to locate each sampling point during the measurement process, and this method can realize high-precision measurements and an evaluation of the complete surface topography of DOEs on arbitrary substrates. The data processing algorithm developed by us is original. In this method, the three-dimensional morphology of DOEs is reconstructed, which is realized by registration and coordinate transformation with optimization. The confocal measurement probe is coupled with high precision and a multi-degree-of-freedom (DOF) motion mechanism to realize the measurement of the DOE feature size information at a constant contour scanning speed. The measurement method is non-point positioning, and it is not necessary to obtain system coordinates in real time, which avoids the problem of the system not being positioned with high precision. This method can also be applied well to in situ measurements because it reduces the drawbacks of real-time location acquisition in measurement. By means of the stability of the motion of each axle system of the ultra-precision machine tool, the confocal probe is integrated into the ultra-precision machine, and the feasibility of the scheme is verified by experiments. The measurement accuracy and uncertainty of the system are discussed, and an experiment is carried out to verify the feasibility of the method.

2. Methodology Setup

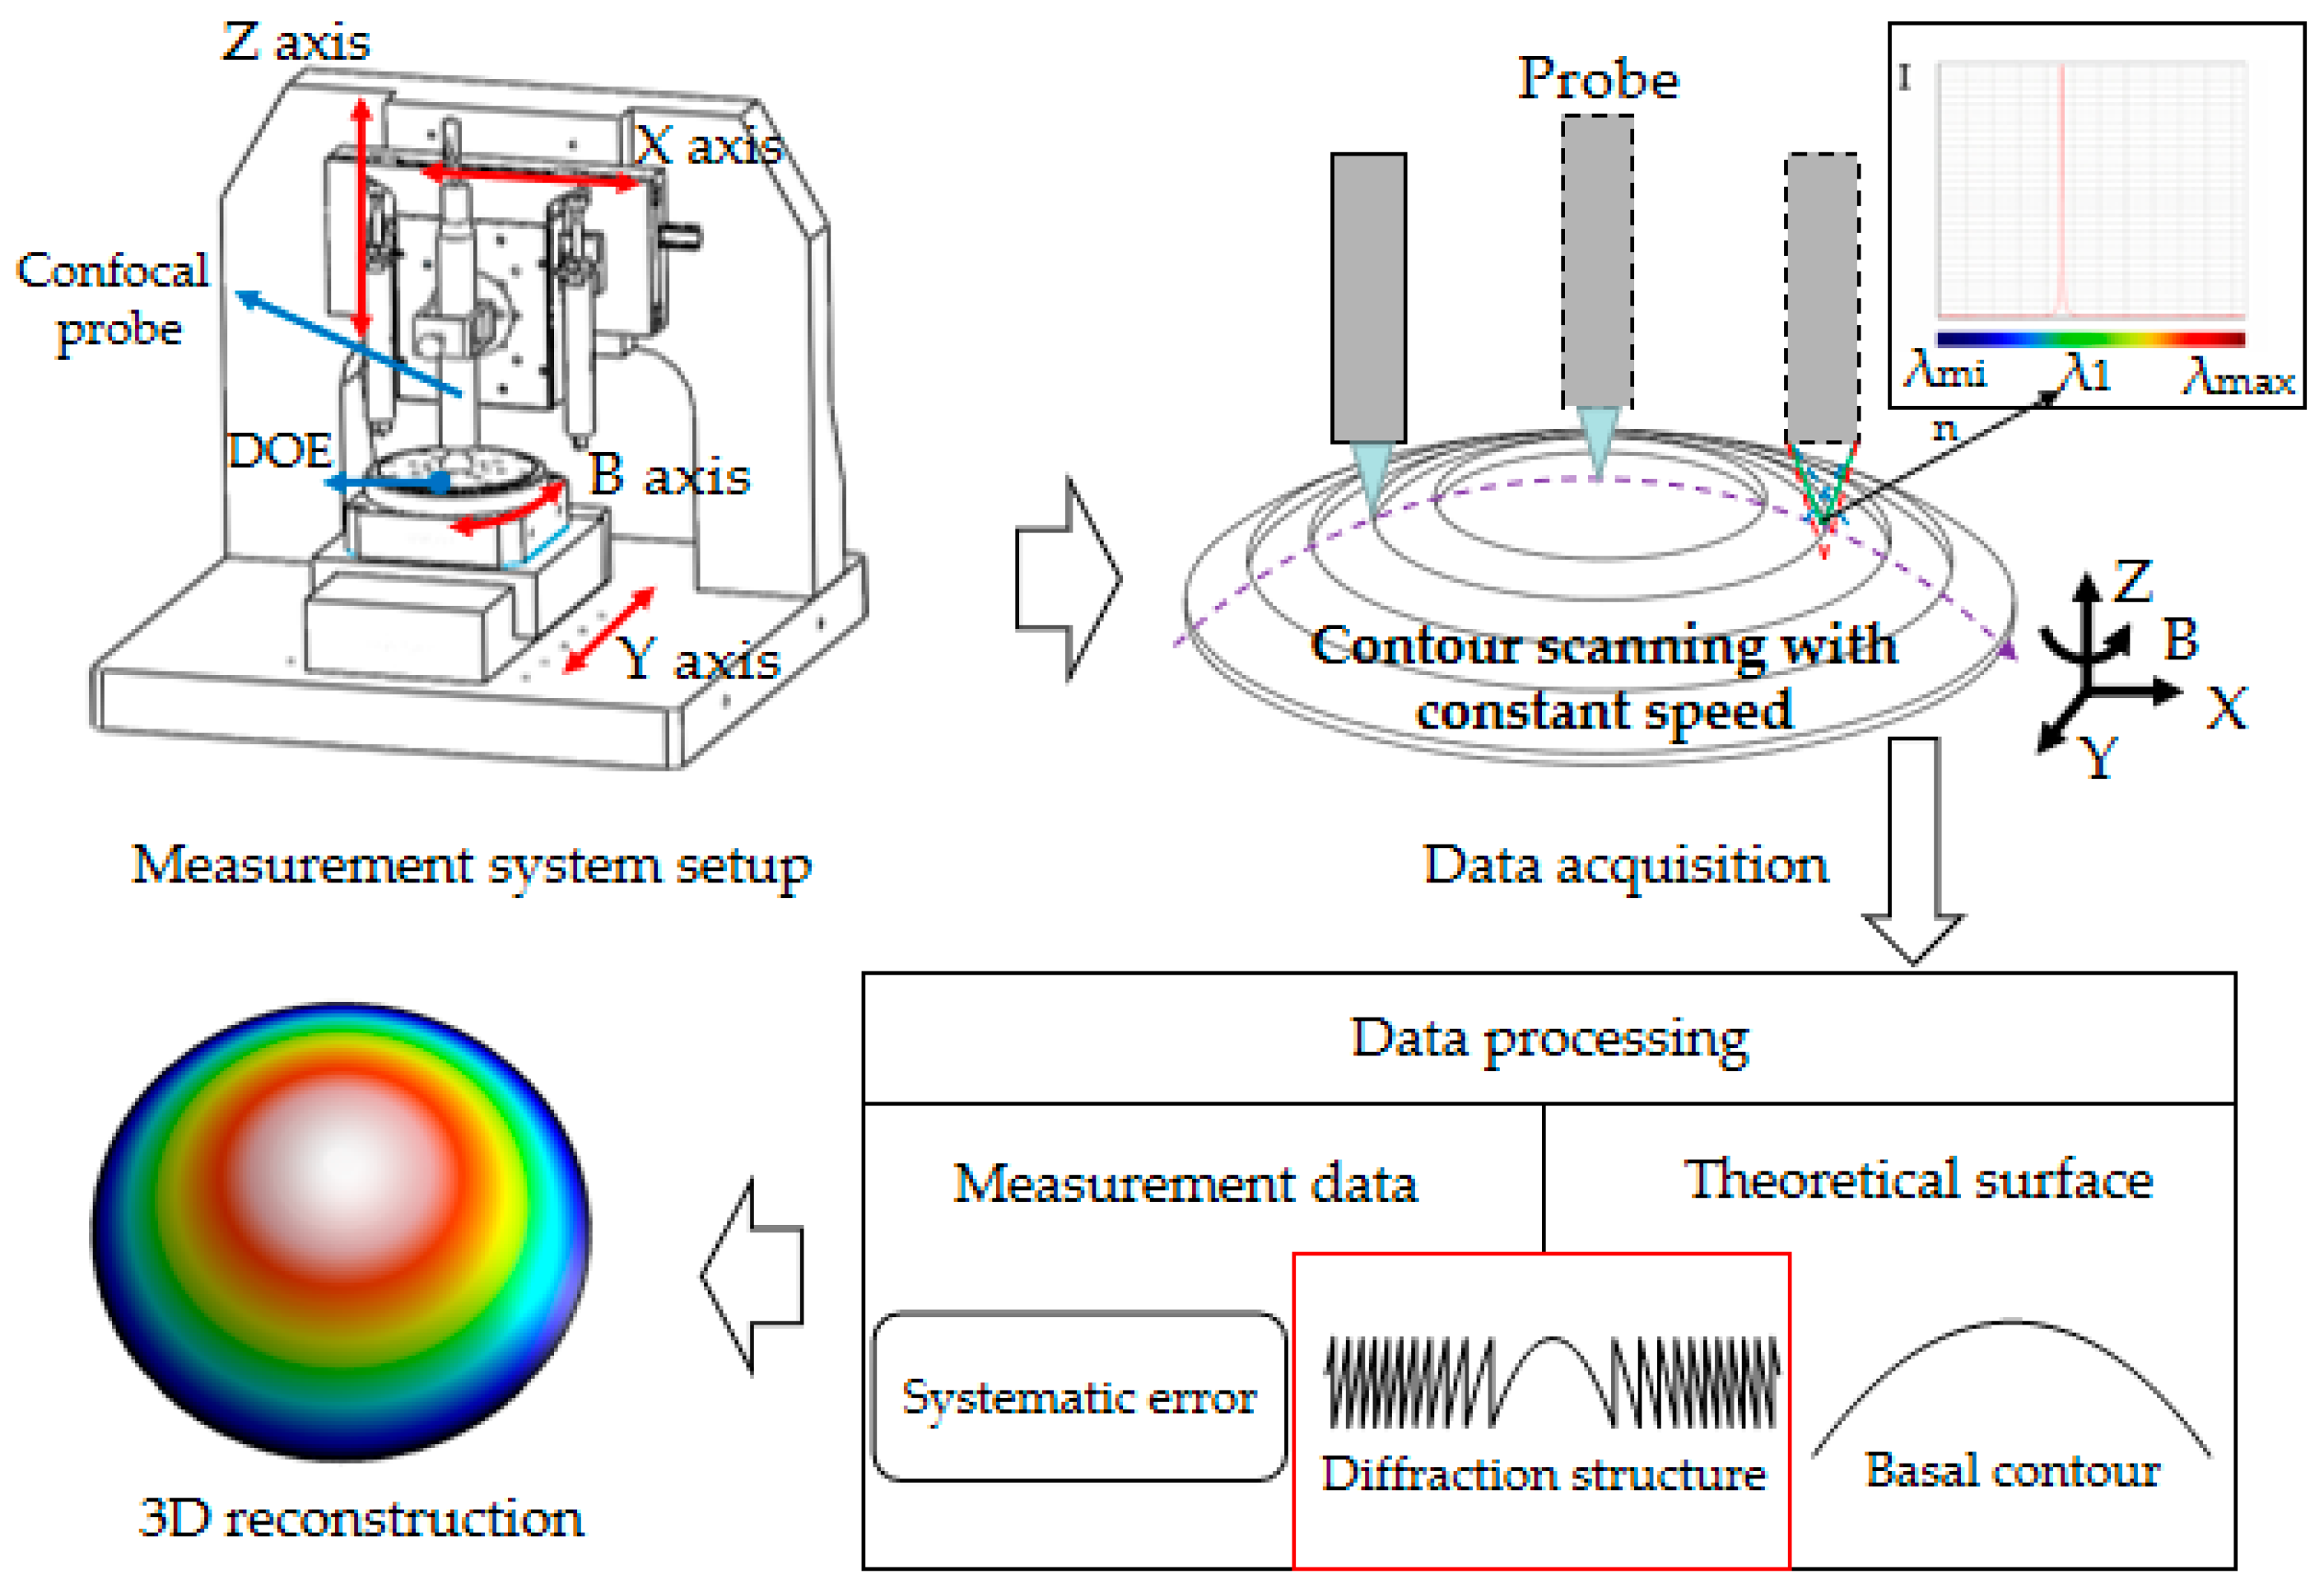
Confocal measurement has the characteristics of high reliability, accuracy and repeatability, high resolution, and a large inclination measurement range. The confocal probe usually records light of different wavelengths, focusing on the workpiece surface in its measuring range, and calculates the Z value of the workpiece’s contour through the conversion curve between the wavelength and displacement. For the DOE’s rotationally symmetrical surface features, the center contour of the surface is often used for characterization in engineering. In this paper, the confocal measurement principle was used to acquire the central contour information of the DOE surface, and the confocal probe was integrated on a multi-axis system platform to realize the three-dimensional contour scanning of the whole DOE. DOEs are generally typical composite workpieces whose designated shape comprises two parts, a substrate and a diffractive structure. The measurement process is shown in Figure 1. A curve-based DOE was taken as an example. The confocal probe was integrated on a high-precision multi-axis system platform. A multi-DOF motion device was used to drive the probe relative to the workpiece to be measured, with a constant contour scanning speed. Scanning the measured DOE along the path of the base contour, the measured data obtained by the probe is theoretically the diffraction structure of the DOE. This scanning measurement method effectively avoids the problem of the insufficient measuring range of the probe and does not require real-time tracking of measuring position points. However, due to the inevitable error in the system measurement process, the measurement data obtained by the probe also contain systematic errors.

2.1. Measurement Method

In our measurement method, the center vertex of the DOE’s substrate was scanned and measured along the diameter direction. In this way, the measuring path could go through all step structures, and the rotationally symmetrical workpiece could be measured multiple times by rotating the path to realize the characterization and evaluation of the whole DOE surface. The measurement system platform needed to provide at least four degrees of freedom for the relative motion between the probe and the workpiece, the linear motion in the three-axis directions of the X-axis, the Y-axis, and the Z-axis, and the rotational motion degree of freedom in the Z-axis direction. All motion freedoms needed to ensure high motion accuracy.
The measurement system ensured that the optical axis of the confocal probe was perpendicular to the horizontal plane that the measured workpiece was fixed on it, and that the probe kept a fixed height relative to the measured workpiece in its measurable range. In this method, the probe was independently responsible for collecting the measured contour data points at a fixed frequency, and the motion system was independently responsible for driving the probe along the DOE substrate contour at a constant speed. In this paper, a special method for data processing was proposed. The complete 3D surface reconstruction of a DOE can be realized by matching and coordinate transformation, and then the geometric characteristic of the measured DOE surface can be extracted by analysis. This method effectively avoided the disadvantage that the scanning point must be accurately positioned in the system coordinate one by one in real time, without acquiring the system coordinates in real time, reducing the dependence on the positioning coordinate points in the process. This ensured high-precision measurements, while improving measurement efficiency. There were some issues that should be taken into account in this method. The tilt of the measured workpiece resulted in the overall tilt of the measured data, and the measurement path may not cross the central vertex of the surface base, which resulted in a deviation in the DOE feature information. Using the data processing measurement method proposed in this paper could solve the main problems in the measurement method, and achieve high-precision and high-efficiency measurements, getting precise measurement results of the main characteristic of the curve-based DOE, like tooth pitch and tooth height.

2.2. Measurement Data Processing

The confocal probe measurement data usually need to be combined with the probe motion position coordinates to construct a 3D point cloud. For this reason, a common method is to integrate the confocal probe on the displacement motion platform; the probe triggers the stages to jointly record the 3D measurement data in real time, thereby realizing the reconstruction of the surface. Therefore, the higher the positioning accuracy of the stages, the more accurate the reconstructed measured 3D surface. However, the measurement method of external trigger synchronous acquisition makes the measurement system inefficient, and means there are higher requirements for a high-precision displacement motion platform, which can be expensive. Alternatively, the synchronization of time can be achieved by software programming, but due to the disturbance in data transmission, it is difficult to ensure the synchronous action of the confocal probe and the displacement platform from the software.
Based on the measurement method described in Section 2, a data processing algorithm that does not need to record the (x, y) coordinates of each measurement in real time was proposed. The algorithm flow is shown in Figure 2. Firstly, the DOE design model was unfolded to obtain the reference profile of the diffraction structure, and the original measured data were pre-processed by filtering. Secondly, the measurement data were iteratively matched with the diffraction structure model data to ensure that the measurement data crossed the central vertex of the base and the matching accuracy was optimal. Finally, the measured data were reconstructed by DOE.
The algorithm only needed to record the position coordinates of the starting point and the end point of the measurement path, and could obtain the geometrical information of the surface contour of the measured DOE, and realize the complete 3D surface reconstruction and 2D contour information extraction of the DOE.
During the measurement procedure, the confocal probe collected measurement data at a constant speed and sampling frequency along the centerline of the DOE’s base contour, so the obtained measurement data contained height information “unfolded” along the design basis of the workpiece to be measured. In other words, the curved base was extended into a plane. Therefore, in order to obtain the correct measurement data to evaluate the tooth height and pitch of a DOE, the measurement data should be “restored” back to the design model with the actual coordinate information, but there will be some inevitable problem when the measured piece is fixed. Tilting and misalignment resulted in a certain slope of the measured data, and the mapping relationship between the measured data and the design model was complicated. It was difficult to restore the measured data directly to the design model, and the measurement error brought about by direct reduction was often very large. Considering the above problems, this paper chose to unfold the design model of DOEs along the centerline of the substrate, and obtained the matching relationship between the measured data and the design model data by matching the measured data with the unfolded model data, and then obtained the measured data containing the actual dimension information.
The principle for unfolding the centerline of the model base was to unfold all the design data points into a straight line. The base equation was F(r, y), and we set the position coordinates of two adjacent points on the DOE’s base to be a(r1, y1) and b(r2, y2). The set coordinates of the points corresponding to the two points on the design surface were A(r1, Y1) and B(r2, Y2). If the interval between the two points is Δl after the base expansion, the interval length can be expressed as:
Δ l = L F ( r , y ) d s ,
where L is the DOE’s base curve, F(r, y), between points a and b. In the data processing, the integral operation of the curve was approximated to the linear distance calculation of two points; then Equation (1) can be approximated as:
Δ l = L F ( r , y ) d s ( y 2 y 1 ) 2 + ( r 2 r 1 ) 2 .
Then, the coordinates of the two points on the unfolded surface could be expressed as A(r1, Y1) and B(r1 + Δl, Y2), and the diffraction structure on the base could be obtained by processing the model data points in turn, as shown in Figure 3. The unexpanded profile of the original DOE designed model is shown in Figure 3a, and Figure 3b shows the reference diffraction structure obtained by unfolded the base.
There were similar geometric features in the model data and the measured data after the model base was unfolded, but they were located in two different Cartesian coordinate systems. For the purposes of evaluating the measured data, it was necessary to perform data registration to unify the two coordinate systems of two datasets.
Before the data registration, the two datasets required a two-step solution. The first step was to remove the gross errors from the measured data using a median filter, because gross errors would seriously affect the accuracy of data registration. The size of the window was determined by the actual measured data and noise characteristics, because median filtering with large window sizes tends to eliminate a large amount of high frequency information in the measured data. Therefore, in order to ensure the integrity of the data information, and to filter out all the gross errors in the measured data, a small window size should be selected. Figure 4a is the raw measured data, and the data noise was reduced by median filtering, with a window size of 11, as shown in Figure 4b. Comparing these two datasets, it is clear that the median filter successfully removed the gross error data. The second step was moving the centroids of the measured data after filtering and the unfolded model data to the same position, providing initial position parameters using in data registration. Before the matching process, the centers of gravity of the two data sets were coincident as the preprocessing of the algorithm to improve the accuracy of the algorithm.
To realize the data registration, the Sparse iterative closest point (ICP) algorithm was used to match the design model data with the measured data. The basic idea was to find the nearest point in the geometric relationship in the two sets of data to form a matching point pair, and then to find the matrix parameters of rotation and translation of the rigid body transformation that make the geometric distance between all point pairs shortest, based on the least squares method. Then continuous iterative optimization until the distance correlation parameter between two pairs of datasets was less than a certain threshold. The Sparse ICP algorithm has been improved on the basis of traditional ICP. It can be described as follows:
a r g m i n Y i = 1 n y i R x i T 2 p + I Y ( y i ) a r g m i n R , T i = 1 n y i R x i T 2 p + I S O ( k ) ( R )
where R is a rotation matrix, T is a translation vector, x is the coordinates of point on the X surface, and y is the coordinates of point on the Y surface. R is restricted to the special orthogonal group SO(k) by the indicator function IA (b) that evaluates to 0 if bA and to otherwise. And y is restricted to the surface Y using the same indicator function IA (b). Unlike traditional ICP, this method used the P-order norm for optimization, and the order p in sparse ICP is set to 0 ≤ p ≤ 1, where p is suggested to be set to 0.4 according to this article [15].
For verifying the actual effect of using the sparse ICP algorithm in this situation, we registered a set of DOE measured data after preprocessing to the 2D DOE design model. The registration result of the ICP algorithm is shown in Figure 5. The red line represents the unfolded design model data, and the blue line represents the matched measured data. Here we used the root mean square (RMS) value of the distances between the registration pairs. The RMS value of the result was 56.58 nm, which proves the effect of the algorithm is good. Then, we did another experiment to test the effect of the algorithm when it is used to register the same set of measured data with a 3D design model of the same DOE. We registered the set of measured data to the 3D DOE design model. Figure 6 illustrates the registration results on the 3D design surface. The RMS value of this result was 68.72 nm, which is acceptable registration accuracy. These two tests can prove that the sparse ICP algorithm is suitable for analyzing the measured data of DOEs.
Based on the results of data matching, the error of the alignment between the optical axis of the probe and the DOE central vertex of the curved base was determined. The iterative optimization method was used to find the best alignment data, and data processing was performed to verify the accuracy of the measurement optical axis alignment, and to ensure the surface contour measurement accuracy after three-dimensional reconstruction. The data processing method effectively solved the problem that the inclination of the measured data and the measurement path did not cross the vertex of the center of the base.
After ICP algorithm processing, the mapping relationship between measurement data and design model could be obtained, and then the measured data could be “restored” back to the design model base. The piecewise linear interpolation method was used for the restoration. The unfolded model base and the unexpanded model base data were used as known data, and the processed measurement data were calculated as a value that needed to be interpolated. Finally, the matched measurement data should be restored to the design model to obtain the complete three-dimensional shape of a curved-base DOE.

3. Measuring Process and Results

3.1. Measuring the Experimental Conditions

The DOE used in the experiment is shown in Figure 7, the base equation was Equation (4), and the designated parameters are listed in Table 1. The diameter was 22 mm, with a structure of 10 stepped teeth. The average tooth height was 1.3912 μm, the step angle was about 12.4°, and the base profile curvature was up to 31°. According to the geometric characteristics of the curve-based DOE to be measured, the confocal probe was selected with a numerical aperture of 0.99, the maximum object/degree was ±42.5°, the measurement range was 130 μm, the axial resolution was 8 nm, and the accuracy was 35 nm, which can meet the scanning measurement of each step structure and complete base contour.
F ( r ) = c r 2 1 + 1 ( 1 + k ) c 2 r 2 + a 4 r 4 + a 6 r 6 + a 8 r 8 + a 10 r 10 r 2 = x 2 + y 2 c = 1 / R 0
In the equation, c is the base curvature at the vertex, k is a conic constant, r is the radial coordinate measured perpendicularly from the optical axis, and ai are the high-order aspheric terms.
Before measuring the DOE, the accuracy of the confocal probe should be verified. Herein, a standard step of 10 μm (nominal 9.976 μm) was repeatedly measured, and the measurement results are shown in Figure 8. The average measurement accuracy of the probe shown was 34.2 nm, according to the results listed in Table 2, indicating that the probe had good measurement accuracy and satisfied the measurement requirements of the DOE.

3.2. Measuring the System Construction

A five-axis precision motion system has high precision motion shafting and stability and is widely used in ultra-precision measurement fields. The experiment carried out the measurements on an ultra-precision machine tool with a confocal probe and the measured DOE to verify the measurement method proposed in the paper. An ultra-precision single-point diamond machine tool was used as a multi-axis system platform. With the help of the stability of the ultra-precision machine tool, the systematic errors in the measured data were minimized, to ensure the measurement accuracy of the diffraction structure. Figure 9 shows a DOE measurement system built based on the Moore (Swanzey, NH, USA) Nanotech 350 ultra-precision single point diamond lathe. The confocal probe was driven by the machine tool to measure the curve-based DOE, and to realize the three-dimensional topography measurement of the complete DOE with a constant contour scanning speed (0.5 mm/min). The system consisted of an aerostatic spindle and a vacuum chuck, three orthogonal hydrostatic guides (X-axis, Y-axis, and Z-axis), a precision platform y-axis parallel to the Y-axis and fixed on the B-axis, and a rotating A-axis mounted on the y-axis; the confocal probe was fixed on the A-axis, and the curved-base DOE was fixed on the vacuum chuck. The optical axis of the probe was aligned with the Z direction through the A-axis and B-axis adjustment, and the height of the probe was adjusted by the Y- and the y-axes.
As mentioned in Section 2, the optical axis of the probe needed to be calibrated before the measurements. The data recorded by the confocal probe were a point cloud consisting of tens of thousands of points with height information. That is to say, each point had only z-value coordinates, which needed to match the workpiece or the probe movement (x, y) coordinates to form 3D data. As shown in Figure 10, the red line indicates that the probe scan path is a truncated line passing through the diameter of the base vertex, and the gray line indicates that the probe scan path is a truncated line at a position 10° away from the base vertex. The data obtained after the probe scan were the measured data with structural information flattened along the base arc length.
The data point cloud of two measurements was normalized to the same coordinate system, it was found that there was a certain deviation in the scanning measured data of the probe without crossing the base vertex. This was because the probe measured data were not the maximum arc length across the vertex. When the coordinate transformation was restored to the actual size, the pitch became shorter and the feature information of the curve-based DOE could not be correctly evaluated. Therefore, correcting the relative position of the probe to the measured DOE and making the probe measurement path go through the center vertex of the curved base were important steps in the measurement scheme.
In the experiment, the standard ball was used to complete the alignment of the probe with the measured DOE center, as shown in Figure 11. After the standard sphere was corrected by an inductance meter, the system first controlled the probe to move along the X-axis (horizontal direction) and record the height measured data on a line. The data could be obtained by fitting a maximum value. The X-coordinate of the extreme value was the X-coordinate of the center of the standard sphere. Then, at the X-coordinate, the system controlled the probe to move along the Y-axis (vertical direction) and record the height measured data on another line. Data fitting could obtain another extreme value, and the extreme Y-coordinate value was the Y-coordinate of the center of the standard sphere. The position of two intersections was the vertex of the standard sphere, marking the position of the probe shaft at this time. The standard ball was replaced by the DOE of the measured surface base, and the workpiece alignment was also performed by the inductor. The adjustment center coaxiality accuracy of the rotating workpiece on the air-floating rotary table was within 500 nm, which could ensure the center alignment accuracy of the DOE after installation and realize the calibration of the optical axis of the probe and the vertex of the workpiece.
A standard ball with a radius of 12.7 mm was adsorbed on the vacuum chuck for adjusting the axis of rotation of the spindle, the optical axis of the probe, and the Z direction of the center vertex of the standard ball, which were coaxial. The standard sphere had a high enough geometric accuracy and was also used to verify the measurement accuracy of the probe. In order to keep the measurement stable during the alignment process, the speed of the machine tool was set to 0.1 mm/s and the sampling frequency was set to 1000 points per second. The fitting results of the two sets of data are shown in Figure 12a,b. Fitting results show that the position error of data center point was small, and the alignment accuracy coudl be better than 1 μm after adjustment.
The machining accuracy of DOE was on the order of micrometers. In order to achieve a complete and accurate measurement of the workpiece, it was also necessary to calibrate the systematic error of the measurement system. After the alignment of the optical axis of the probe with the vertex of the standard sphere, the probe measured the standard ball at a constant scanning speed along the standard ball profile to verify the measurement accuracy of the probe. Because the standard sphere profile was measured, the height directly measured by the probe was the measurement error of the system, so as to evaluate the measurement accuracy of the measurement system. The error data obtained after processing are shown in Figure 12c, and obvious gross errors have been eliminated. After removing them, the error was controlled within 100 nm, and the PV (Maximum peak-to-valley value of surface topography) value is 0.117 μm, which showed that the measurement accuracy of the measurement system was guaranteed.
The DOEs were replaced by the standard sphere, and then the measurement experiment of the curve-based DOE was carried out. The workpiece alignment was completed by the inductance meter of the machine tool. We adjusted the center coaxial accuracy of the measured DOE and the spindle to less than 500 nm, which would ensure the center alignment accuracy of the DOE adsorbed by the spindle. The planned measurement path was scanned at a constant speed along the DOE substrate contour through the DOE vertex coordinate O point, at an equal angle of 5°. The probe acquisition frequency was 400 Hz, the scanning speed was 0.5 mm/s along the contour, and three sets of measured data were recorded. According to the data processing method introduced in Section 3, the probe did not need to read the machine axis coordinate from the machine control system in real time, it only needed to record the position coordinates of the start and end points of the measured motion path. After the measurement was completed, the data processing of one set of the measured data and the three-dimensional reconstruction of the DOE surface were carried out based on the proposed data processing algorithm. The two remaining sets of measured data were used as validation to verify the feasibility, accuracy, and repeatability of the proposed data processing algorithm. The measurement method and the corresponding data processing algorithm made the movement of the probe and the machine tool independent of each other and avoided the possibility of damaging the control accuracy of the machine tool by connecting the probe hardware with the machine tool. Compared with the single-point real-time corresponding measurement method, this measurement method greatly improved the measurement efficiency.

3.3. Results and Discussion

The three sets of data of the rotation measurement were registered on the DOE surface by the registration algorithm to confirm that the measurement position was accurate. Table 3 recorded the deviation of the measurement path after registration that was not aligned with the center of the measured workpiece. The optical axis of the probe was aligned with the center of the DOE vertex by means of multiple registration iteration optimization. The data indicate that the experiment can ensure the high calibration accuracy of the optical axis of the probe, and the second set of measured data is better positioned. The second set of measured data registration results was judged by the RMS value between the registration pairs, and the value was 54.36 nm. This indicates the correctness of the registration results between the measured data and the design surface, and further confirms the validity of the data processing method proposed in this paper.
The experimental measured data were restored to the design model, and then a two-dimensional contour was extracted to obtain the tooth height and pitch of the DOE. Figure 13 records the difference between the measured and designed values of the tooth height and pitch of the diffraction structure in three groups of measurement results. The results show that the measurement method can effectively realize the complete measurement of the feature information of the curve-based DOE. The average pitch error was 0.5 μm, and the average tooth height error was 0.0084 μm. The experiment found that the relative error of the second set of data was smaller, indicating that the higher the calibration accuracy of the optical axis of the probe, the higher the accuracy of the DOE feature measurement. Therefore, the second set of data was used to reconstruct the three-dimensional shape of the curve-based DOE, and then the curved base was subtracted to obtain the DOE feature information. The final processing results of the measured data are shown in Figure 14.
The experimental verification shows that the DOE measurement method proposed in this paper is feasible, and the DOE is measured at a constant contour scanning speed based on the principle of confocal measurement. The non-point positioning measurement form eliminates the need to acquire system coordinates in real time and reduces the dependence on the positioning coordinate points in the measurement process. It can realize high-precision and fast measurements of the complete curve-based DOE feature. This method is also applicable to the measurement of DOE feature information of an arbitrary base.

4. Conclusions

In this paper, the measurement of curve-based DOEs based on a confocal measurement principle was proposed. The data processing method was used to reconstruct the 3D surface topography of a DOE and achieved high precision and complete detection and evaluation of the DOE surface metrology. The in situ measurement of a curve-based DOE had good effects. The main conclusions can be drawn as follows:
(1)
The non-contact measurement and evaluation method based on a confocal probe coupled with a high-precision multi-axis motion system can realize the measurement of DOEs on an arbitrary base at a constant contour scanning speed.
(2)
The data processing of a DOE effectively reduces the dependence on the location coordinates in the measurement process. The mapping relationship between the measured data and the original design model is obtained by matching the measured point cloud data with the unfolded design model data. The experimental results show that the average error of a DOE is 0.5 μm and the average error of tooth height is 0.0084 μm.
(3)
The proposed method provides a reference for surface topography measurement by a multi-axis motion measuring system. The non-traditional point positioning acquisition ensures the efficiency and accuracy of the measurements.

Author Contributions

L.Z. proposed the method, carried out the experiments, and organized the paper. Y.D. built the mathematical model and delivered the experimental data. Z.L. developed the model and improved the presentation of the work. X.Z. and F.F. put forward the idea and designed the experiments. All authors discussed the results and contributed to writing the paper.

Funding

This research was funded by the National Key Research and Development Program of China (Grant No. 2017YFA0701200), the Science Challenge Program (Grant No. TZ2018006-0203-01), the National Natural Science Foundation of China (Grant No. 61635008), and the China Postdoctoral Science Foundation (Grant No. 2018M641645).

Acknowledgments

The authors express their sincere thanks to Weiyuan Sun for assisting in the operation of ultra-precision machine tools during the experiment.

Conflicts of Interest

The authors declare no conflict of interest.

References

  1. Račiukaitis, G.; Stankevičius, E.; Gečys, P.; Gedvilas, M.; Bischoff, C.; Jäger, E.; Völklein, F. Laser Processing by Using Diffractive Optical Laser Beam Shaping Technique. J. Laser Micro/Nanoeng. 2011, 6. [Google Scholar] [CrossRef]
  2. Bokor, N.; Davidson, N. Curved diffractive optical elements: Design and applications. Prog. Opt. 2005, 48, 107–148. [Google Scholar] [CrossRef]
  3. Semmler, M.; Kniesburges, S.; Parchent, J.; Jakubaß, B.; Zimmermann, M.; Bohr, C.; Döllinger, M. Endoscopic laser-based 3D imaging for functional voice diagnostics. Appl. Sci. 2017, 7, 600. [Google Scholar] [CrossRef]
  4. Zhang, Y.; Wang, Z.; Zhang, F.; Qin, H.; Li, J.; Mai, Y. Processing and error compensation of diffractive optical element. In Proceedings of the 7th International Symposium on Advanced Optical Manufacturing and Testing Technologies(AOMATT): Large Mirrors and Telescopes, Harbin, China, 26–29 April 2014; Volume 9280, p. 92800G. [Google Scholar] [CrossRef]
  5. O’Shea, D.C.; Suleski, T.J.; Kathman, A.D.; Prather, D.W. Diffractive Optics: Design, Fabrication, and Test; Spie Press: Bellingham, WA, USA, 2004; pp. 179–197. [Google Scholar]
  6. Wang, C.; Chan, Y.C.; Lam, Y.L. Fabrication of diffractive optical elements with arbitrary surface-relief profile by direct laser writing. Opt. Eng. 2002, 41, 1240–1246. [Google Scholar] [CrossRef]
  7. Zhang, X.; Huang, R.; Liu, K.; Kumar, A.S.; Shan, X. Rotating-tool diamond turning of Fresnel lenses on a roller mold for manufacturing of functional optical film. Precis. Eng. 2018, 51, 445–457. [Google Scholar] [CrossRef]
  8. Brusberg, L.; Neitz, M.; Schröder, H.; Fricke-Begemann, T.; Ihlemann, J. Fabrication of Fresnel micro lens array in borosilicate glass by F2-laser ablation for glass interposer application. In Proceedings of the Optical Interconnects XIV, San Francisco, CA, USA, 1–6 February 2014; Volume 8991, p. 89910H. [Google Scholar] [CrossRef]
  9. Zhou, Q.; Li, X.; Geng, M.; Hu, H.; Ni, K.; Zhong, L.; Wang, X. Economic fabrication of a novel hybrid planar Grating/Fresnel lens for miniature spectrometers. Opt. Express 2018, 26, 6079–6089. [Google Scholar] [CrossRef] [PubMed]
  10. Roeder, M.; Schilling, P.; Hera, D.; Guenther, T.; Zimmermann, A. Influences on the fabrication of diffractive optical elements by injection compression molding. J. Mater. Process. Technol. 2018, 2, 5. [Google Scholar] [CrossRef]
  11. He, P.; Wang, F.; Li, L.; Georgiadis, K.; Dambon, O.; Klocke, F.; Yi, A.Y. Development of a low cost high precision fabrication process for glass hybrid aspherical diffractive lenses. J. Opt. 2011, 13, 085703. [Google Scholar] [CrossRef]
  12. Zou, X.; Zhao, X.; Li, G.; Li, Z.; Sun, T. Non-contact on-machine measurement using a chromatic confocal probe for an ultra-precision turning machine. Int. J. Adv. Manuf. Technol. 2017, 90, 2163–2172. [Google Scholar] [CrossRef]
  13. Chun, B.S.; Kim, K.; Gweon, D. Three-dimensional surface profile measurement using a beam scanning chromatic confocal microscope. Rev. Sci. Instrum. 2009, 80, 073706. [Google Scholar] [CrossRef] [PubMed] [Green Version]
  14. Li, D.; Mell, B. Fresnel Lens Dimension Measurement Using 3D Profilometry. Today’s Standard for Tomorrow’s Materials. Available online: https://nanovea.com/fresnel-lens-dimension-measurement-using-3d-profilometry/ (accessed on 4 March 2019).
  15. Bouaziz, S.; Tagliasacchi, A.; Pauly, M. Sparse iterative closest point. In Proceedings of the Eleventh Eurographics/ACMSIGGRAPH Symposium on Geometry Processing, Girona, Spain, 6–10 May 2013; pp. 113–123. [Google Scholar] [CrossRef]
Figure 1. A schematic diagram for the measurement of a curved substrate diffractive optical elements (DOE).
Applsci 09 02229 g001
Figure 2. Flowchart for processing chromatic confocal probe measured data by the proposed algorithm.
Applsci 09 02229 g002
Figure 3. Expanding the design model along the centerline of the base: (a) unexpanded surface and (b) unfolded surface.
Applsci 09 02229 g003
Figure 4. Measured data filtering. (a) Before filtering; (b) after filtering.
Applsci 09 02229 g004
Figure 5. Illustration of the data matching process. (a) Pre-processed before registration; (b) after registration.
Applsci 09 02229 g005
Figure 6. The effect of the measured data matching the 3D design model.
Applsci 09 02229 g006
Figure 7. Feature size of a DOE.
Applsci 09 02229 g007
Figure 8. Accuracy verification of probe.
Applsci 09 02229 g008
Figure 9. The experimental setup for measuring the curved substrate DOE.
Applsci 09 02229 g009
Figure 10. Error analysis of the measurement path.
Applsci 09 02229 g010
Figure 11. Method of locating the center position of a calibration sphere.
Applsci 09 02229 g011
Figure 12. Pre-debugging of the experimental system. (a) Data fitting results of X direction measurement; (b) data fitting results of Y direction measurement; (c) analysis of the measurement error to verify the measurement accuracy of the system.
Applsci 09 02229 g012
Figure 13. Error of (a) DOE pitch measurement; (b) tooth height measurement.
Applsci 09 02229 g013
Figure 14. Measured data processing results.
Applsci 09 02229 g014
Table 1. The nominal tooth profile information of a DOE.
Tooth NumberPitch (mm)Tooth Height (μm)
1 1.2901.390
2 0.9931.390
3 0.8471.389
4 0.7601.390
5 0.7041.391
6 0.6711.390
7 0.6561.390
8 0.6591.391
9 0.6901.393
10 0.7601.398
Table 2. The results of an accuracy verification of the probe.
TimesHeight (μm)Error (nm)
110.0065+30.5
210.0073+31.3
310.0168+40.8
Table 3. Center point alignment error.
Serial NumberDeviation in the X Direction (nm)Deviation in the Y Direction (nm)
188.3372.0757 × 10−8
274.3171.2442 × 10−8
385.5126.7515 × 10−7

