1. Introduction
Thermal poling, a technique to induce second-order nonlinear effects and linear electro-optic effects in the center-symmetric fused silica fiber [
1], allows the realization of all-fiber electro-optic modulators, all-fiber optical-to-frequency converters [
2], switching [
3] and polarization-entangled photon pair generation [
4]. Poling temperature and poling voltage are important influence factors of second-order nonlinearity induced in the fiber core [
5]. Besides, the poling duration also affects the value of the
[
6].
Double anodes were addressed by Margulis et al. [
7], who demonstrated that it is possible to avoid electrical breakdown and improve the stability and strength of
induced by thermal poling. To further understand the physical process based on the double anodes model and optimize its poling parameters, Camara studied the microscopic mechanism of ion movement in thermally poled double-hole fibers using COMSOL Multiphysics finite element analysis [
8]. The impact of poling parameters (voltage, temperature, initial ionic concentrations, etc.) on the induced
is also analyzed. Recently, a new type of thermal poling technology, electrostatic induction, developed by De Lucia et al., lifts a number of restrictions on the use of complex microstructured optical fibers (MOF) for poling, as it is no longer necessary to individually contact internal electrodes [
9].
In this paper, a new type of double-hole fiber is designed, and the thermal poling process of this new double-hole fiber and circular double-hole fiber is analyzed by using COMSOL Multiphysics platform. This model is based on a previously proposed two-dimensional charge dynamics model [
10]. In this model, Na
+ ions which are initially uniformly distributed in the fiber and hydrogen-related species (H
3O
+) which are injected from electrodes are mainly considered. Different from the circular double-hole electrode structure, the new double-hole electrode structure proposed in this paper is a rectangle with a single rounded edge, and its single rounded edge causes a larger concentration of ions migrating toward the core. Based on this, a simulation model is established to calculate and analyze the migration process of ions inside the fiber and time evolution of the internal electric field on the core. The results show that the
of the new double-hole poled fiber is higher than that of the circular double-hole fiber at a temperature of 285 °C and a voltage of 5 kV.
2. Principle and Model
The poling principle of the model is summarized below. At the beginning of poling, in the high temperature and high voltage condition, sodium (Na
+) of high mobility is first activated. Driven by the external electric field, sodium (Na
+) migrates from the anode to the cathode and the outer surface of the fiber. At this time, cation-depleted region is formed on the outer surface of the anode. As thermal poling proceeds, the water molecules in the air at the surface of the anode ionize into H
3O
+ under the effect of the external electric field, and then accumulate into the fiber. H
3O
+ of lower mobility also begins to migrate toward the cathode and the outer surface of the fiber, gradually neutralizing the negatively charged holes [
11] left by the migration of Na
+. This promotes the process of the depletion region covering the core. When the depletion region covers the fiber core center, the internal electric field reaches a maximum. The maximum electric field is recorded after the bias is switched off and temperature is lowered to room temperature [
12]. The optical fiber is initially neutral and maintains this neutrality all along the poling process [
13].
The model is based on the COMSOL finite element method of the transport of diluted species problem, assuming that low concentration ions (~1 ppm) move in the presence of diffusion and drift due to an electric field [
8]. Both migration and diffusion are taken into account, which can be derived by coupling the local equation of continuity to Poisson’s equation [
14]:
where the index i represents different ionic species,
is ionic concentration,
is the diffusivity,
is the charge,
is the ionic mobility,
is Faraday’s constant,
is the electric potential during poling, and
is the production or consumption rate.
,
is the Boltzmann constant,
is the temperature. The first term in the local equation of continuity explains the transient of the ionic, and the second term explains the drift and diffusion of the charge. The Poisson’s equation shows that the charge distribution determines the electric field distribution. Combined with the equation
, the evolution of second-order nonlinearity of optical fiber by thermal poling can be obtained [
15].
The material type used in the simulation for the fibers is silica glass with a refractive index of 1.468. The two models use three modules: electrostatics, transport of diluted species and general form boundary partial differential equation. The electrostatics module mainly sets the electric potential and the space charge density of the fiber, wherein the space charge density changes with the concentration of Na
+ and H
3O
+. The transport of diluted species module mainly sets the concentration, diffusion coefficient and mobility of Na
+ and H
3O
+ in the fiber. The general form boundary PDE module sets the concentration of H
3O
+ at the holes boundary
[
13]. The poling conditions of the two models are the same: assuming that the holes are filled with metal electrodes [
16], the poling temperature is 285 °C, the outer surface of the fiber is set to zero potential, and the potential of the two electrodes are uniformly 5 KV. Typical initial carrier concentrations c(ions) assumed in the simulations are: c(Na
+) = 1 ppm uniformly distributed in the fiber at t = 0 s; c(H
3O
+) = up to 1 ppm injectable from the holes, initially zero in the entire fiber, supplied at a rate that is either constant, linearly dependent on the field at the electrode edge, or decaying exponentially as the ion supply is exhausted [
8]. Ions exit the outer surface and do not return [
17]. The mobility values in the simulations at 285 °C are
for sodium (
) and
/1000 for H
3O
+. These values differ relatively little from those reported by An et al. [
18], correcting for the temperature.
The 3D transparent schematic of the new double-hole fiber is shown in
Figure 1, where the red part represents the fiber core. Geometry parameters of the new double-hole fiber (F1) and the circular double-hole fiber (F2) are shown in
Table 1. The curvature of the single rounded edge in the fiber F1 is 0.087.
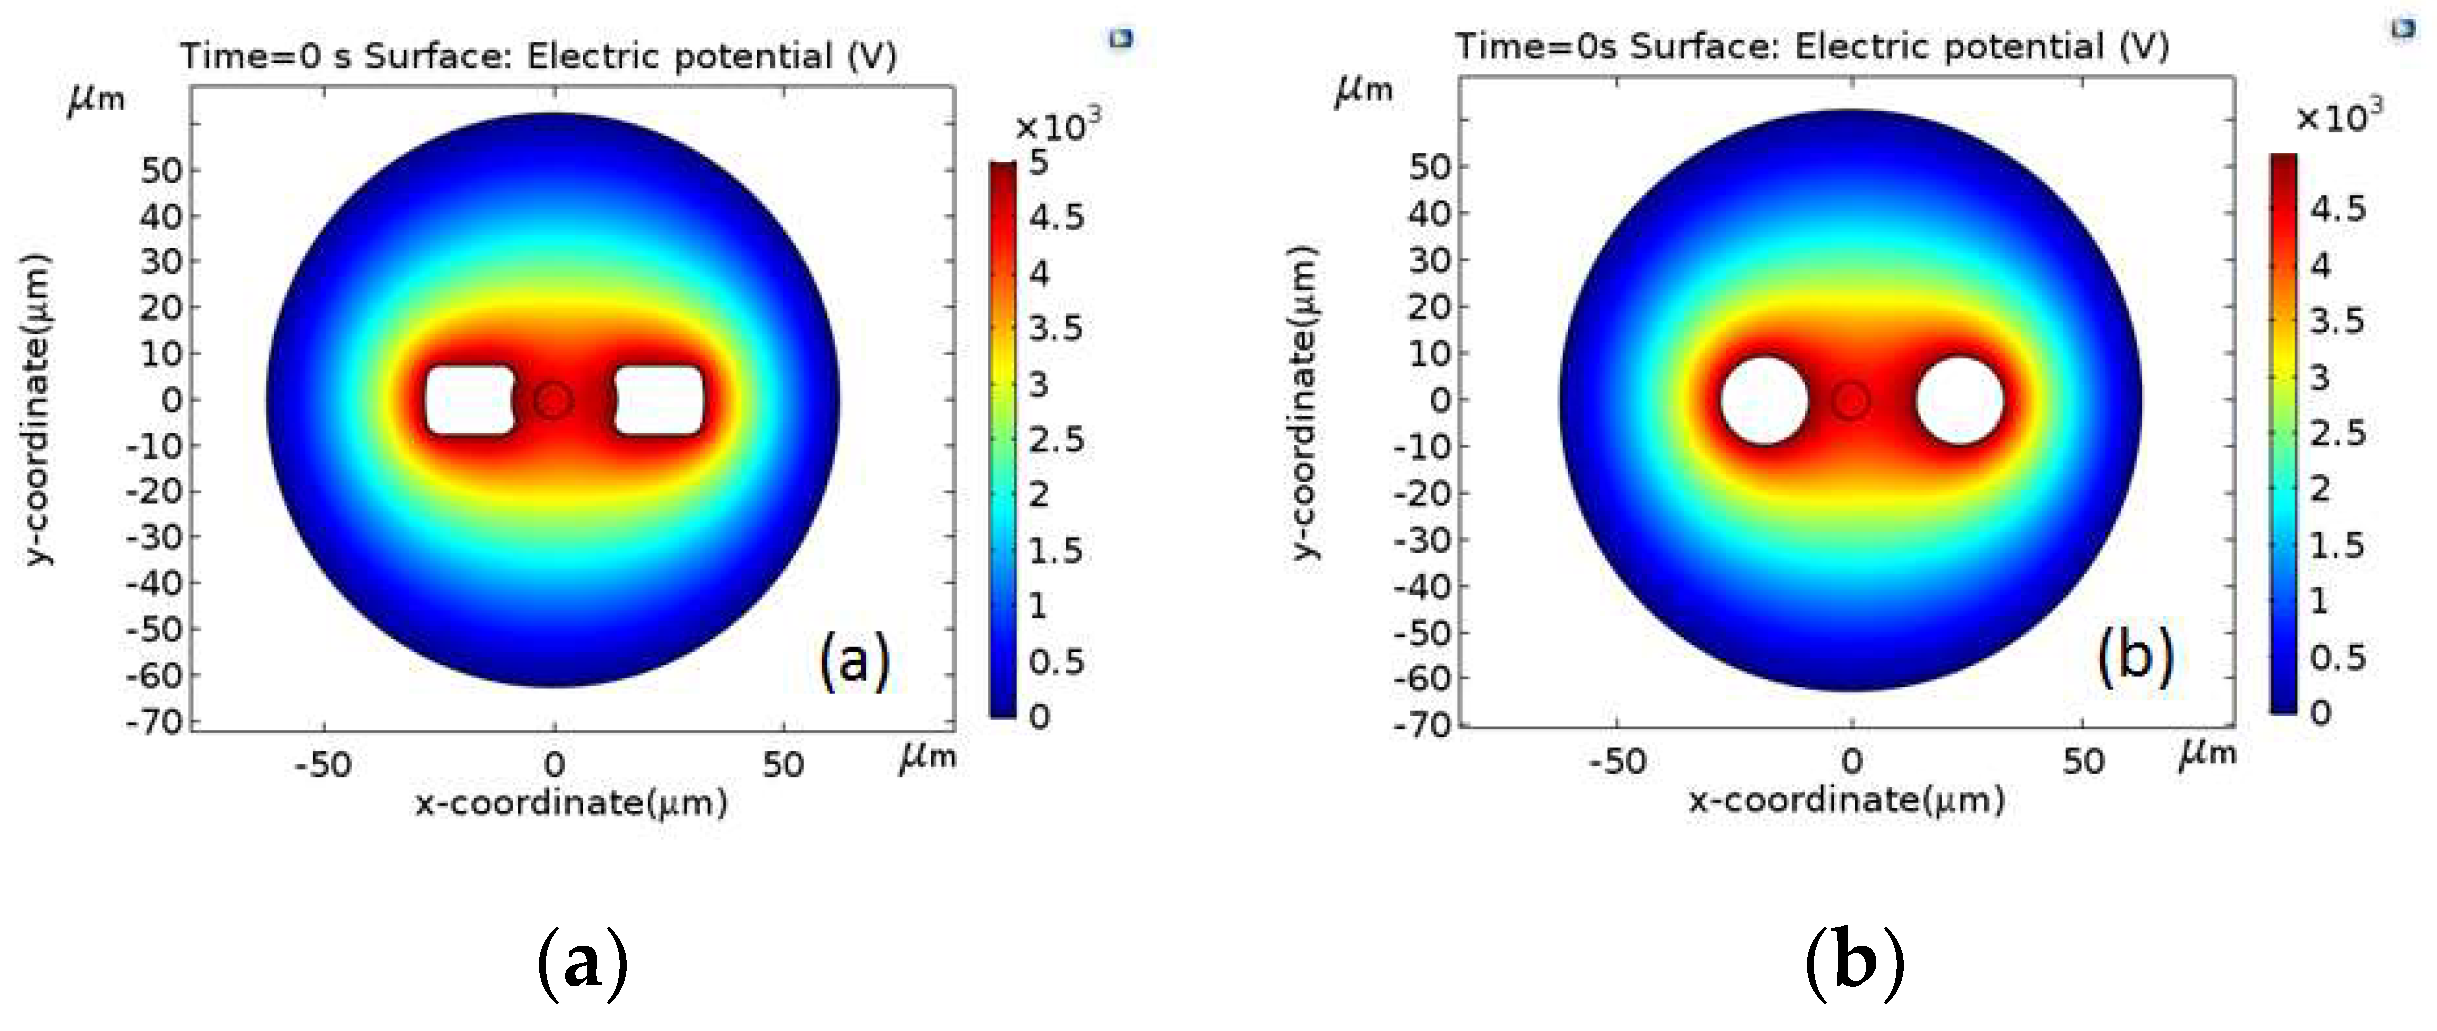
Figure 2 shows the initial (t = 0 s) electric potential distribution in the two models. The electric potential distribution between the electrodes of the fiber F1 is different from the electric potential distribution between the electrodes of the fiber F2 because the curvatures of the holes of the two fiber types are different. The value of the electric field (
) at the core center of the fiber F1 is slightly higher than the value of the electric field (
) at the core center of the fiber F2.
3. Results
When the poling conditions are the same, and the circumference and the area size of the circular electrode and the rectangular electrode are almost the same, only changing the shape of electrode affects the thermal poling effect. It can be studied from the ion dynamics on the cross section of the fiber, the internal electric field at different positions of the core and the second-order nonlinearity of the core.
3.1. Ion Dynamics
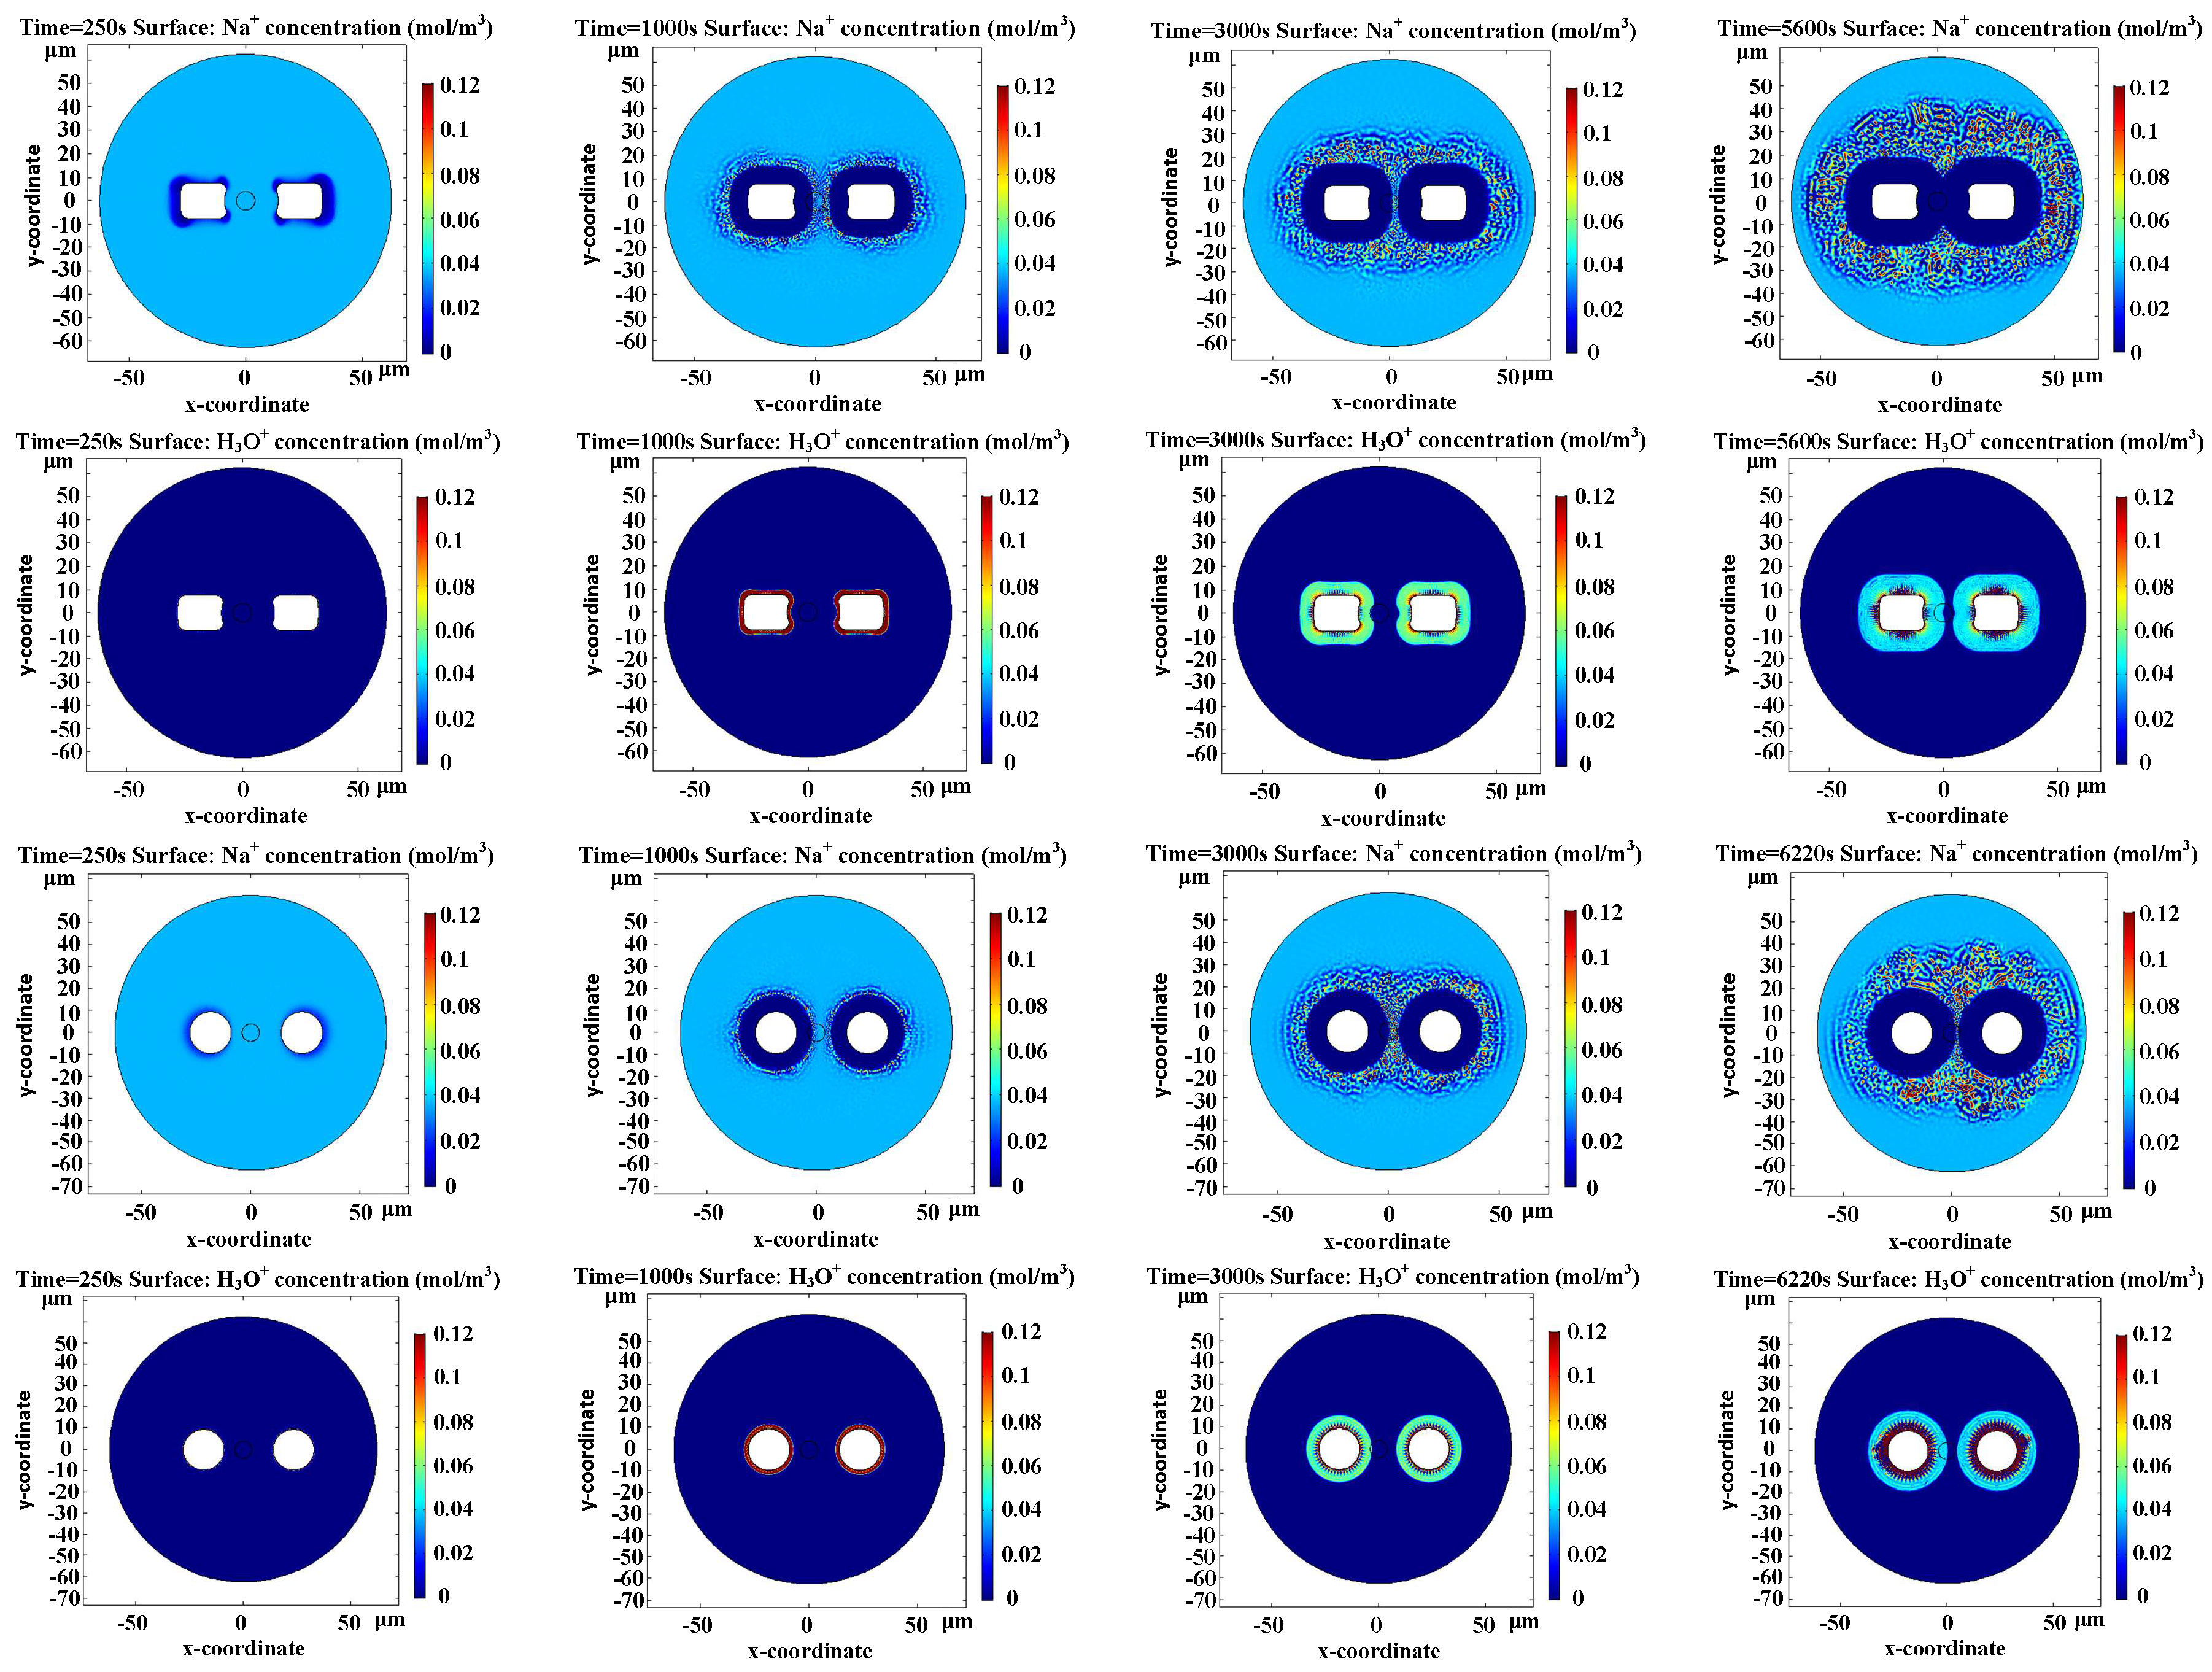
The ion dynamics in the fibers F1, F2 are shown in
Figure 3. In the two models, the initial concentration of Na
+ uniformly distributed in the fiber is 1 ppm, and the initial concentration of H
3O
+ in the fiber is 0. At 250 s, Na
+ near the anodes in the fibers F1, F2 begins to migrate (dark blue indicates concentration zero). At 1000 s, Na
+ in the fibers F1, F2 has migrated to the core center. However, the cation-depleted region occupies the core area in F2 is less than F1. At this time, H
3O
+ is ionized from the air into the fiber and accumulates at the edge of the hole (the concentration of H
3O
+ in the deep red region is highest). At 3000 s, in the fiber F1, Na
+ have crossed the core center, and the negatively cation-depleted region left by Na
+ migration covers the core center. H
3O
+ migrates to the edge of the core under the driving of the external electric field, neutralizing the cation-depleted region near the edge of the core. However, the negatively cation-depleted region does not cover the fiber F2 core center. At 5600 s, the H
3O
+ has reached the core center, and the second-order nonlinearity layer covers the fiber F1 core center. At this point, Na
+ has diffused to the outer surface of the fiber. The second-order nonlinearity layer almost completely covers the fiber F2 core at 6220 s.
3.2. The Internal Electric Field
During the thermal poling process, the time evolution of the internal electric field for the fibers F1 and F2 are show in
Figure 4. Among them, the data points of the black line, the red line, and the green line are 2 μm, 1 μm, and 0 μm from the left side of the core center respectively. In the fiber F1 core center, the internal electric field increases with time after poling of 1500 s, and reaches a maximum value of
at 5420 s. However, in the fiber F2 core center, the internal electric field increases with time after the poling of 2500 s and reaches a maximum value of
at 5870 s.
In the fiber F1, at 1 μm from the left side of the core center, the internal electric field reaches a maximum value of at 4700 s. At 2 μm from the left side of the core center, the internal electric field reaches a maximum value of at 4000 s. The farther from the left side of the core center, that is, the closer to the left anode, the earlier the migrated Na+ and H3O+ reach here. Therefore, the farther away from the left side of the core center, the shorter the time corresponding to the internal electric field peak. Thus, the closer to the core center, the longer width of the second-order nonlinearity layer formed, resulting in a smaller internal electric field peak.
3.3. The Second-Order Nonlinearity
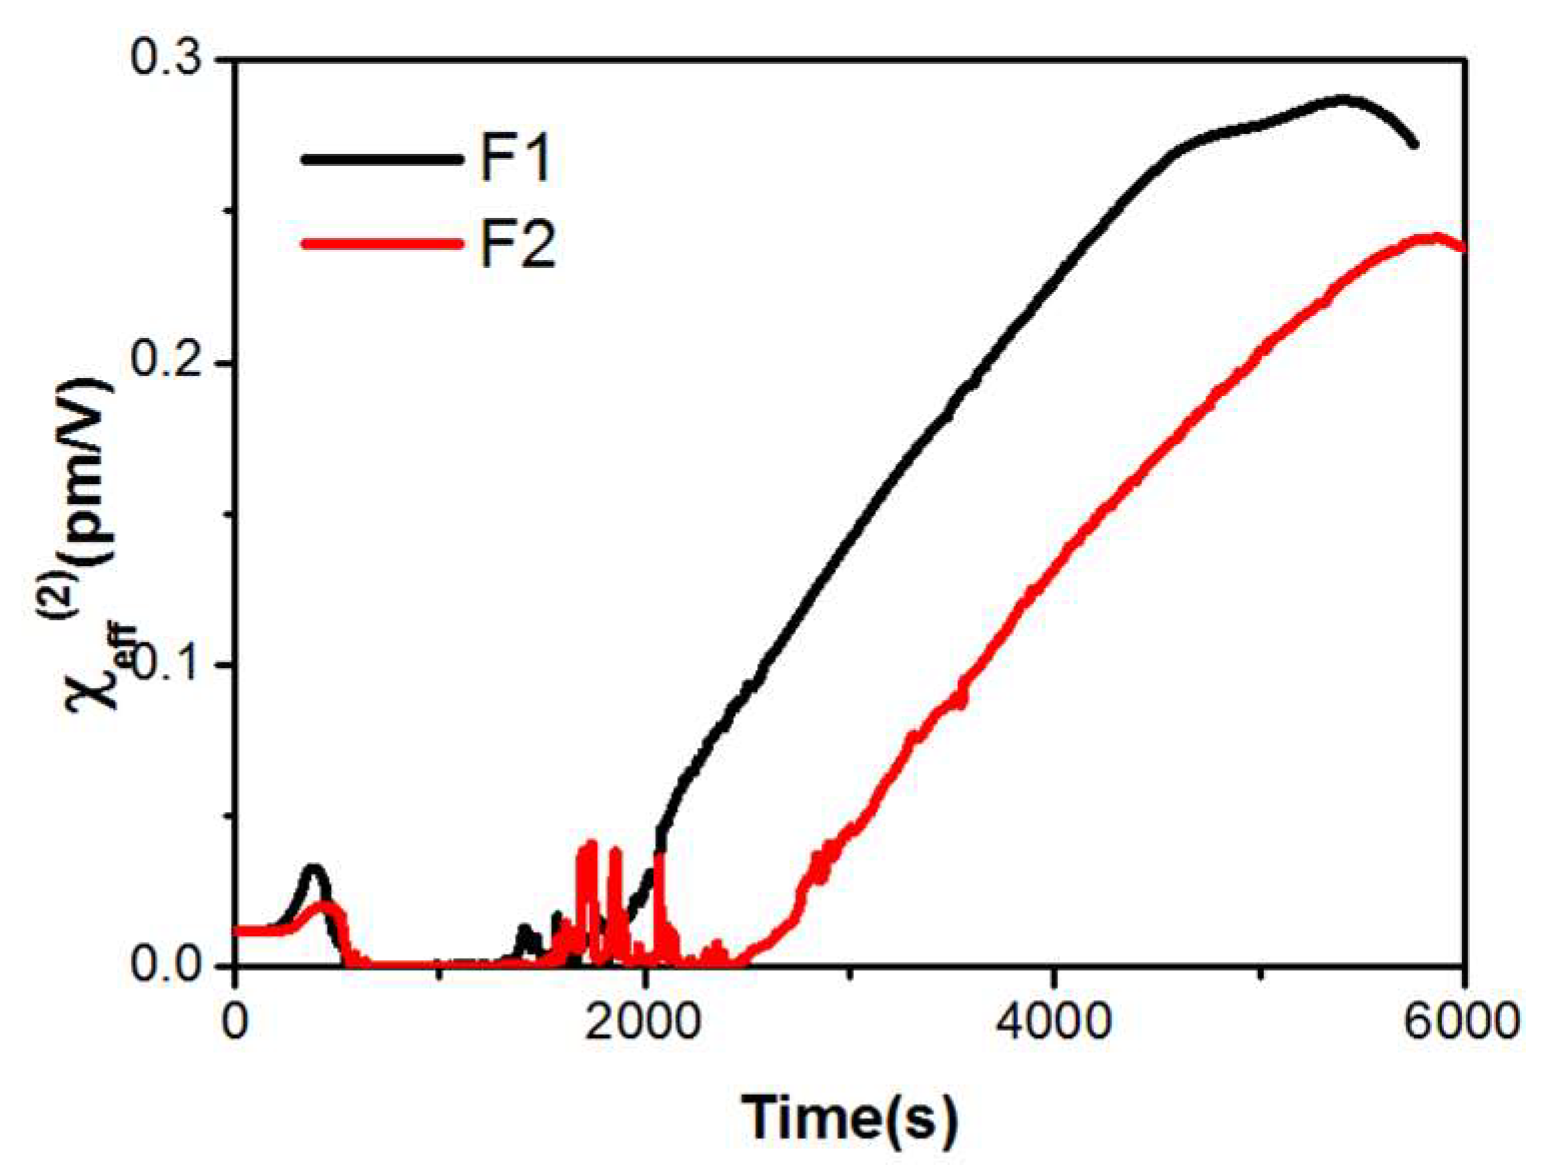
In the process of thermal poling, the internal electric field induced by thermal poling in the core center increases first and then decreases with the poling time. When the internal electric field reaches a maximum, the second-order nonlinearity layer covers the core center.
Figure 4 shows that the internal electric field in the fiber F1 (green) core center reaches a maximum about 450 s earlier than that in the fiber F2 (green) core center. And the maximum of the internal electric field induced in the fiber F1 is
higher than that in the fiber F2. The induced second-order nonlinear coefficient here is measured through the
where the value of
is assumed to be invariant and equal to
[
19]. The maximum of the
in the center of the fiber F1 (black) is 0.05 pm/V larger than that in the center of the fiber F2 (red) is show in
Figure 5.
On the entire core, the
of the fiber F1 after poling of 5420 s is totally higher than that of the fiber F2 after poling of 5870 s, as shown in
Figure 6a. At 5420 s, the
at the center of the fiber F1 core reaches a maximum, and the 2D map of the effective second-order nonlinear coefficient distribution on the entire core at this time is shown in
Figure 6b. The left half of the core is yellow, wherein the brightest color near the center of the core indicates that the effective second-order nonlinear coefficient is the highest. However, the right half of the core is blue, mainly because the second-order nonlinearity layer does not cover this part.
In the early research on the thermal poling of double-hole optical fiber, the maximum of the
induced was 0.2 pm/V [
20]. Our simulation results show that changing the structure of the holes affects the thermal poling while keeping other conditions consistent. It can be considered that under the condition of poling voltage of 5 kV and poling temperature of 285 °C, the
induced in the fiber F1 core center is about 1/5 higher than that in the fiber F2 core center. The reason for this is that the edge of the hole near the core in the fiber F1 is generally closer to the core than F2, and its single rounded edge causes ions to aggregate and have a higher concentration.


