Article

Ultra-Low Interfacial Tension Foam System for Enhanced Oil Recovery

1
Beijing Key Laboratory for Greenhouse Gas Storage and CO2-EOR, The Unconventional Petroleum Research Institute, China University of Petroleum (Beijing), Beijing 102249, China
2
State Key Laboratory of Heavy Oil Processing, College of New Energy and Materials, Beijing Key Laboratory of Biogas Upgrading Utilization, China University of Petroleum (Beijing), Beijing 102249, China
*
Authors to whom correspondence should be addressed.
These authors contributed equally to this work.
Appl. Sci. 2019, 9(10), 2155; https://doi.org/10.3390/app9102155
Submission received: 23 April 2019 / Revised: 21 May 2019 / Accepted: 23 May 2019 / Published: 27 May 2019
(This article belongs to the Section Chemical and Molecular Sciences)

Abstract

:
The liquid phase of foam systems plays a major role in improving the fluidity of oil, by reducing oil viscosity and stripping oil from rock surfaces during foam-flooding processes. Improving the oil displacement capacity of the foam’s liquid phase could lead to significant improvement in foam-flooding effects. Oil-liquid interfacial tension (IFT) is an important indicator of the oil displacement capacity of a liquid. In this study, several surfactants were used as foaming agents, and polymers were used as foam stabilizers. Foaming was induced using a Waring blender stirring method. Foam with an oil-liquid IFT of less than 10–3 mN/m was prepared after a series of adjustments to the liquid composition. This study verified the possibility of a foam system with both an ultra-low oil-liquid IFT and high foaming properties. Our results provide insight into a means of optimizing foam fluids for enhanced oil recovery.

1. Introduction

Compared to conventional liquids, foam fluid has several unique properties, such as, a high apparent viscosity, a high system energy, and a blocking effect. Foam fluid has been utilized in oil recovery as a tertiary oil recovery technology [1,2]. Foam flooding has been well studied for several decades and has been used in oil recovery worldwide [3]. The properties of foam fluids related to oil recovery can be modified to better adapt to the geological conditions; this is usually accomplished by changing the composition, preparation method, and/or preparation conditions of the foam system [4,5]. Most improvements have focused on improving the stability, salt resistance, temperature resistance and oil resistance of the foam [6,7]. Bubbles in the foam fluid can lose their shape over the course of the flooding process, as the foam system is in a state of foaming-flowing-defoaming dynamic equilibrium in the porous media encountered. Thus, all components of the foam system (the liquid, gas, and bubbles) play an important role in the flooding process [8,9].
Studies have shown that the interfacial tension (IFT) of the displacement phase strongly influences flooding effects [10,11]. A low IFT system refers to a system with an IFT between 10−2 and 1 mN/m; in ultra-low IFT systems, the IFT is below 10−2 mN/m. A low IFT system is better able to strip crude oil from rock surfaces by improving the fluidity of the crude oil [12,13]. Therefore, reducing the IFT of the displacement phase is an effective method to improve the flooding effect [14]. In addition, stability is an important indicator of the foam’s performance [15,16]; an ideal foam system maintains high stability while adjustments are made to its IFT.
In this study, several surfactants [hexadecyl trimethyl ammonium bromide (CTAB), sodium oleate (SO), sodium dodecyl sulfate (SDS) and dodecyl hydroxypropyl phosphate betaine (DHPB)] and polymers [anion- polyacrylamide (APAM) and xanthan gum (XC)] were selected as additives, and dehydrated crude oil and simulated formation water representing that from the Dagang Oilfield were also used in this study. A foam system with an ultralow IFT liquid phase was generated by changing the chemical composition of the foam and the stirring method. To further investigate the foam’s stability, a 1000 mL measuring cylinder was used to test the foaming capacity. This study systematically investigated the effect of surfactants on the stability and oil-liquid IFT of the foam, to gain insight into the means to improve foam flooding applications for enhanced oil recovery (EOR).

2. Materials and Methods

2.1. Liquid

The liquid used in this study simulated the mineral composition of true water in the Dagang Oilfield, which consists of deionized water and inorganic salts. The formation water was of the NaCl-KCl type; its ion composition is shown in Table 1. The inorganic salts used in this study are shown in Table 2.

2.2. Additives

Based on previous research [17,18,19], ten surfactants and four polymers were selected as foaming agents and stabilizers, respectively. Details of the additives are listed in Table 3, the molecular structure of the surfactants are shown in Figure 1. All chemicals were produced by Macklin (Shanghai Macklin Biochemical, Ltd., Shanghai, China). The critical micelle concentration (CMC) of each surfactant was tested using a conductivity method. The viscosity of each polymer was obtained using a viscometer.

2.3. Foaming Process

Samples were composed of simulated formation water that contained a surfactant and a polymer. To fully disperse the additives and mix the two phases (gas and liquid), a Waring blender [20] (model 8010s, Waring Commercial, Connecticut, United States) was used. The gas (air) and liquid (solutions of surfactants (and polymers)) were stirred in the blender at 7000 revolutions (rev)/min for 3 min at 25 °C and 1 atm. Next, the foam was transferred into a measuring cylinder (1000 mL) to evaluate its foaming properties.
The stirring method applied to generate foams with minor modifications consisted of three steps: (i) preparing the surfactant-polymer solution; (ii) stirring the solution in the blender at a 7000 rev/min rotating speed for 3 min in a closed environment, air was used as gas phase; and (iii) moving the foam to the measuring cylinder.

2.4. Foaming Capacity and Foam Stability

The foaming volumes and residual-liquid volumes were measured by using scale markings of the Waring blender container. The half-life period was measured using the 1000 mL cylinder and a stopwatch at 25 °C and 1 atm. The foam composite index (FCI) [21,22] was used as an indicator of the foam’s comprehensive performance (foaming capacity and foam stability), according to the following equation:
FCI = 3 4 V 0 · t 1 2
where: V0 is the foaming volume (mL units) and t 1 / 2 is the foam half-life in minutes.
Table 4 shows the parameters that characterize foaming capacity and foam stability.

2.5. Oil-Liquid IFT of Liquid Phase

Dehydrated crude oil from the Dagang Oilfield was selected as the research model. A rotary drop interface tension meter (SDT-500D, Harke, Beijing, China) was used to test the IFT between crude oil and the liquid. Sample measurements were performed three times, and the results were averaged.

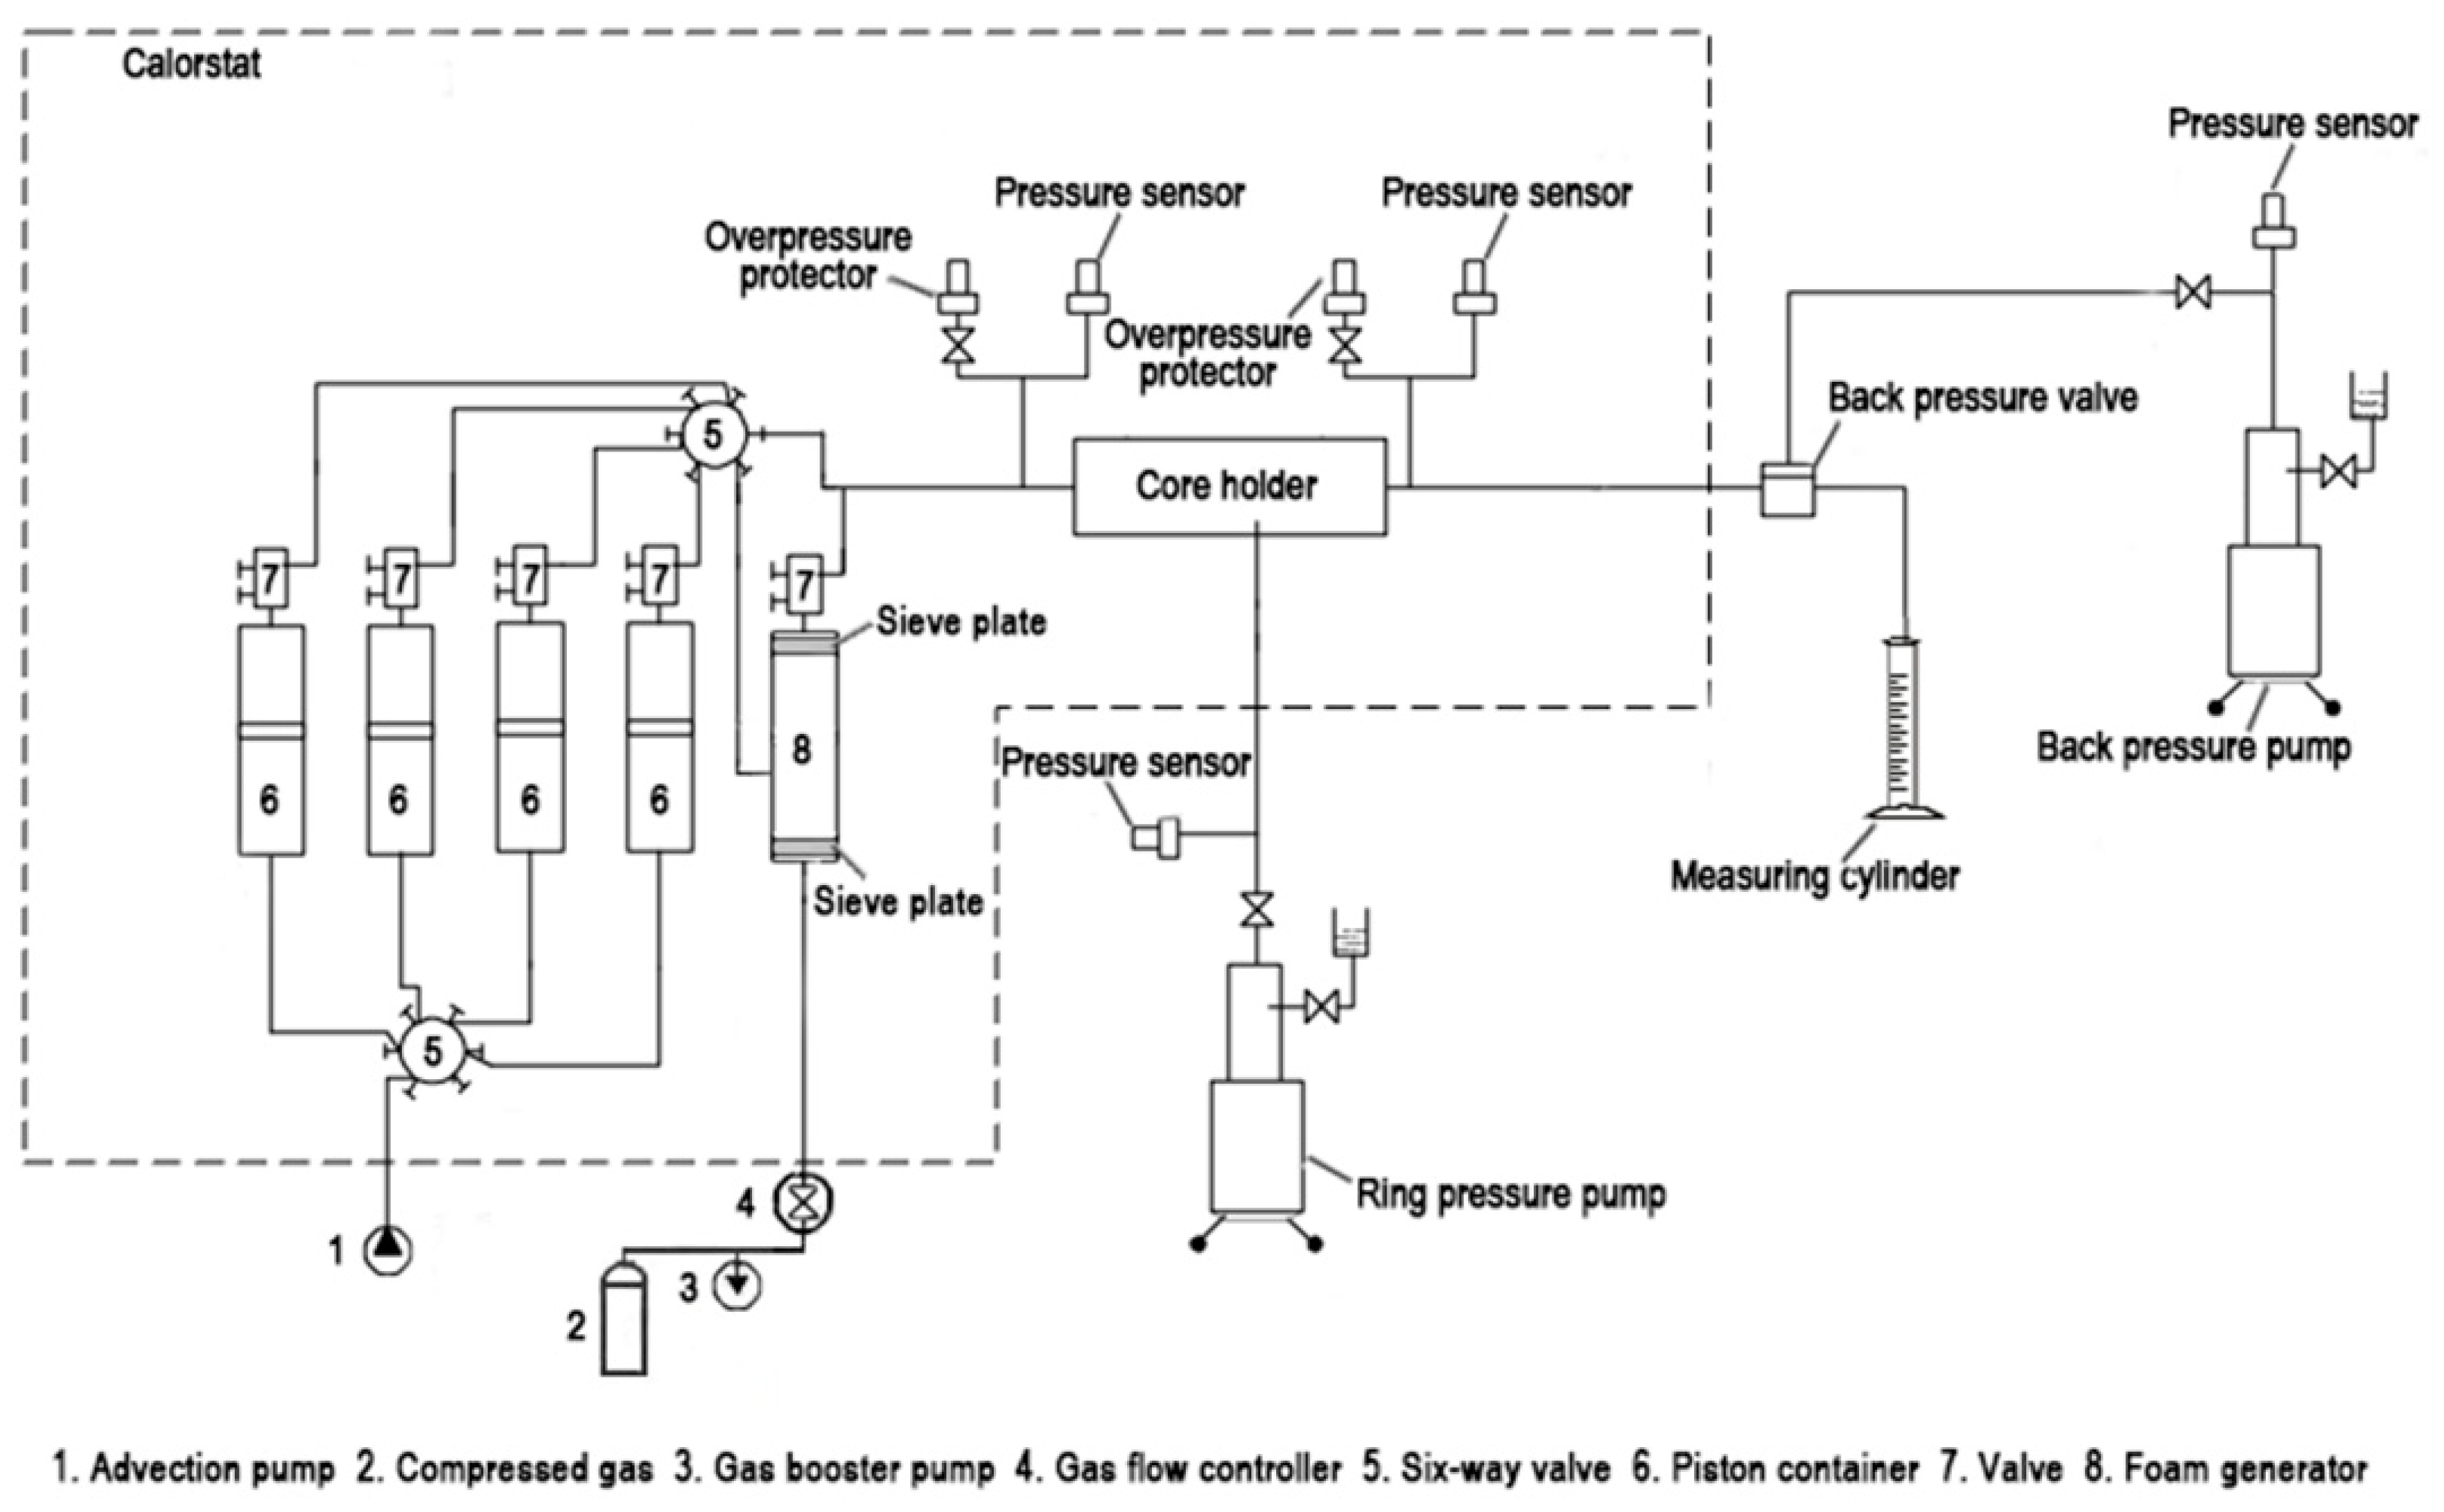
2.6. Core-Flooding Experiment

Macroscopic flow characteristics of foam fluid in porous media and the EOR effect of the optimized foam system were investigated by a core-flooding experiment. The parameters of the artificial cores are shown in Table 5, the grouping of the core-flooding experiment is listed in Table 6, the experimental flow chart is shown in Figure 2.
The core was cylindrical, and the size were 6 cm (length) × 2.5 cm (diameter), the volume was 29.45 cm3. Numbers 1–3 were the high permeability group (≈110 mD), numbers 4–6 were the low permeability group (≈1 mD).
Two commonly used chemical flooding methods (i.e., normal foam flooding and alkali-surfactant-polymer (ASP) flooding) were selected as the control groups. All chemical flooding processes were conducted after water flooding (water flooding was suspended when the water content of produced fluid was more than 98%).
A foam generator was used in this section for the foaming process. The foam generator had a set of sieve plates (three layers, 200 mesh, 2 mm spacing) at both the inlet and outlet. N2 was used as the gas phase of the foam systems. The temperature was maintained by calorstat at 85 °C, the pressure in the core holder was controlled by back pressure pump at 20 MPa.
The macroscopic flow characteristics were investigated by the differential pressures at both ends of the core during injection process. The EOR effect was measured by the recovery efficiency of chemical flooding (after water flooding).

3. Results and Discussion

3.1. Foaming Properties and Oil-Liquid IFT of Surfactants

To evaluate the foaming ability, foam stability, and IFT of a single surfactant foaming system, solutions of each surfactant (100 mL) of various concentrations (0.05, 0.1, and 0.15 g/L) were stirred at 7000 rev/min for 3 min to generate foam. The resulting foam properties and oil-liquid IFT reduction capabilities are listed in Table 7.
Among the anionic surfactants, SO showed weak foaming properties due to poor solubility. The cationic surfactant CTAB possessed strong foaming capacity but weak foam stability. SDS and AES showed both strong foaming capacity and good foam stabilization effects. Amphoteric surfactants (THPB, DHPB and 3-SDB) exhibited good foaming properties and a high FCI. As the hydrophobicity of the hydrophobic group increased, the surfactant molecules distributed themselves closer to the gas-liquid interface. Compared with other surfactants, THPB, DHPB, and CTAB exhibited stronger hydrophobicity due to their longer alkyl chain, resulting in better foaming capacity. The foam stability was dependent on the liquid viscosity and the compactness of surfactants’ arrangement on the interfaces. Thus, the same surfactant exhibited better foam stability at high concentration.
Similar to the foaming properties, the oil-liquid IFT of the surfactant solution was mainly influenced by the strength of the hydrophilic chain. A stronger hydrophobic chain led to stronger bonding between surfactant molecules and water molecules, improving the ability of the surfactant to reduce the IFT. Therefore, solutions of the surfactants with stronger hydrophilic chains, including SO, CTAB and THPB, had a lower oil-liquid IFT.

3.2. Foaming Properties and Oil-Liquid IFT of Binary Surfactants

Corrosion and blockage can be caused by chemical reactions between cationic surfactants and the formation. Nonionic surfactants often have weak solubility. Therefore, anionic and amphoteric surfactants were used for compounding in this study. Based on the results shown in Table 7, THPB, DHPB, AOS, AES and SDS were selected for compounding. The compounding scheme and test results are shown in Table 8. The total concentration of each surfactant was 0.3 g/L.
The compound of DHPB and SDS (mass ratio: 1.5:1 to 1:1.5) had both an ultra-low oil-liquid IFT and high foaming properties (Table 8). A strong electrostatic attraction existed between the positive charge of the hydrophilic group of DHPB and the negative charge of the hydrophilic group of SDS [23]. This attraction impacted on the diffusion behavior of surfactant molecules at the interfaces and made foam generation easier. Meanwhile, electrostatic attraction facilitated the formation of a tight adsorption membrane at the interface, which led to higher foam stability and lower oil-liquid IFT.
According to the results shown in Table 8, the compounding of surfactants with the same carbon number showed a better synergistic effect. Because the carbon number of the surfactant molecule could affect the diffusion rate of the surfactant, the diffusion of surfactant molecules with the same carbon number may be more balanced, and the arrangement of the surfactant molecules on the interfaces more even. This ensures the adsorption of two surfactants on the interfaces and leads to two surfactants with similar diffusion rates. Thus, local IFT imbalance was minimized.

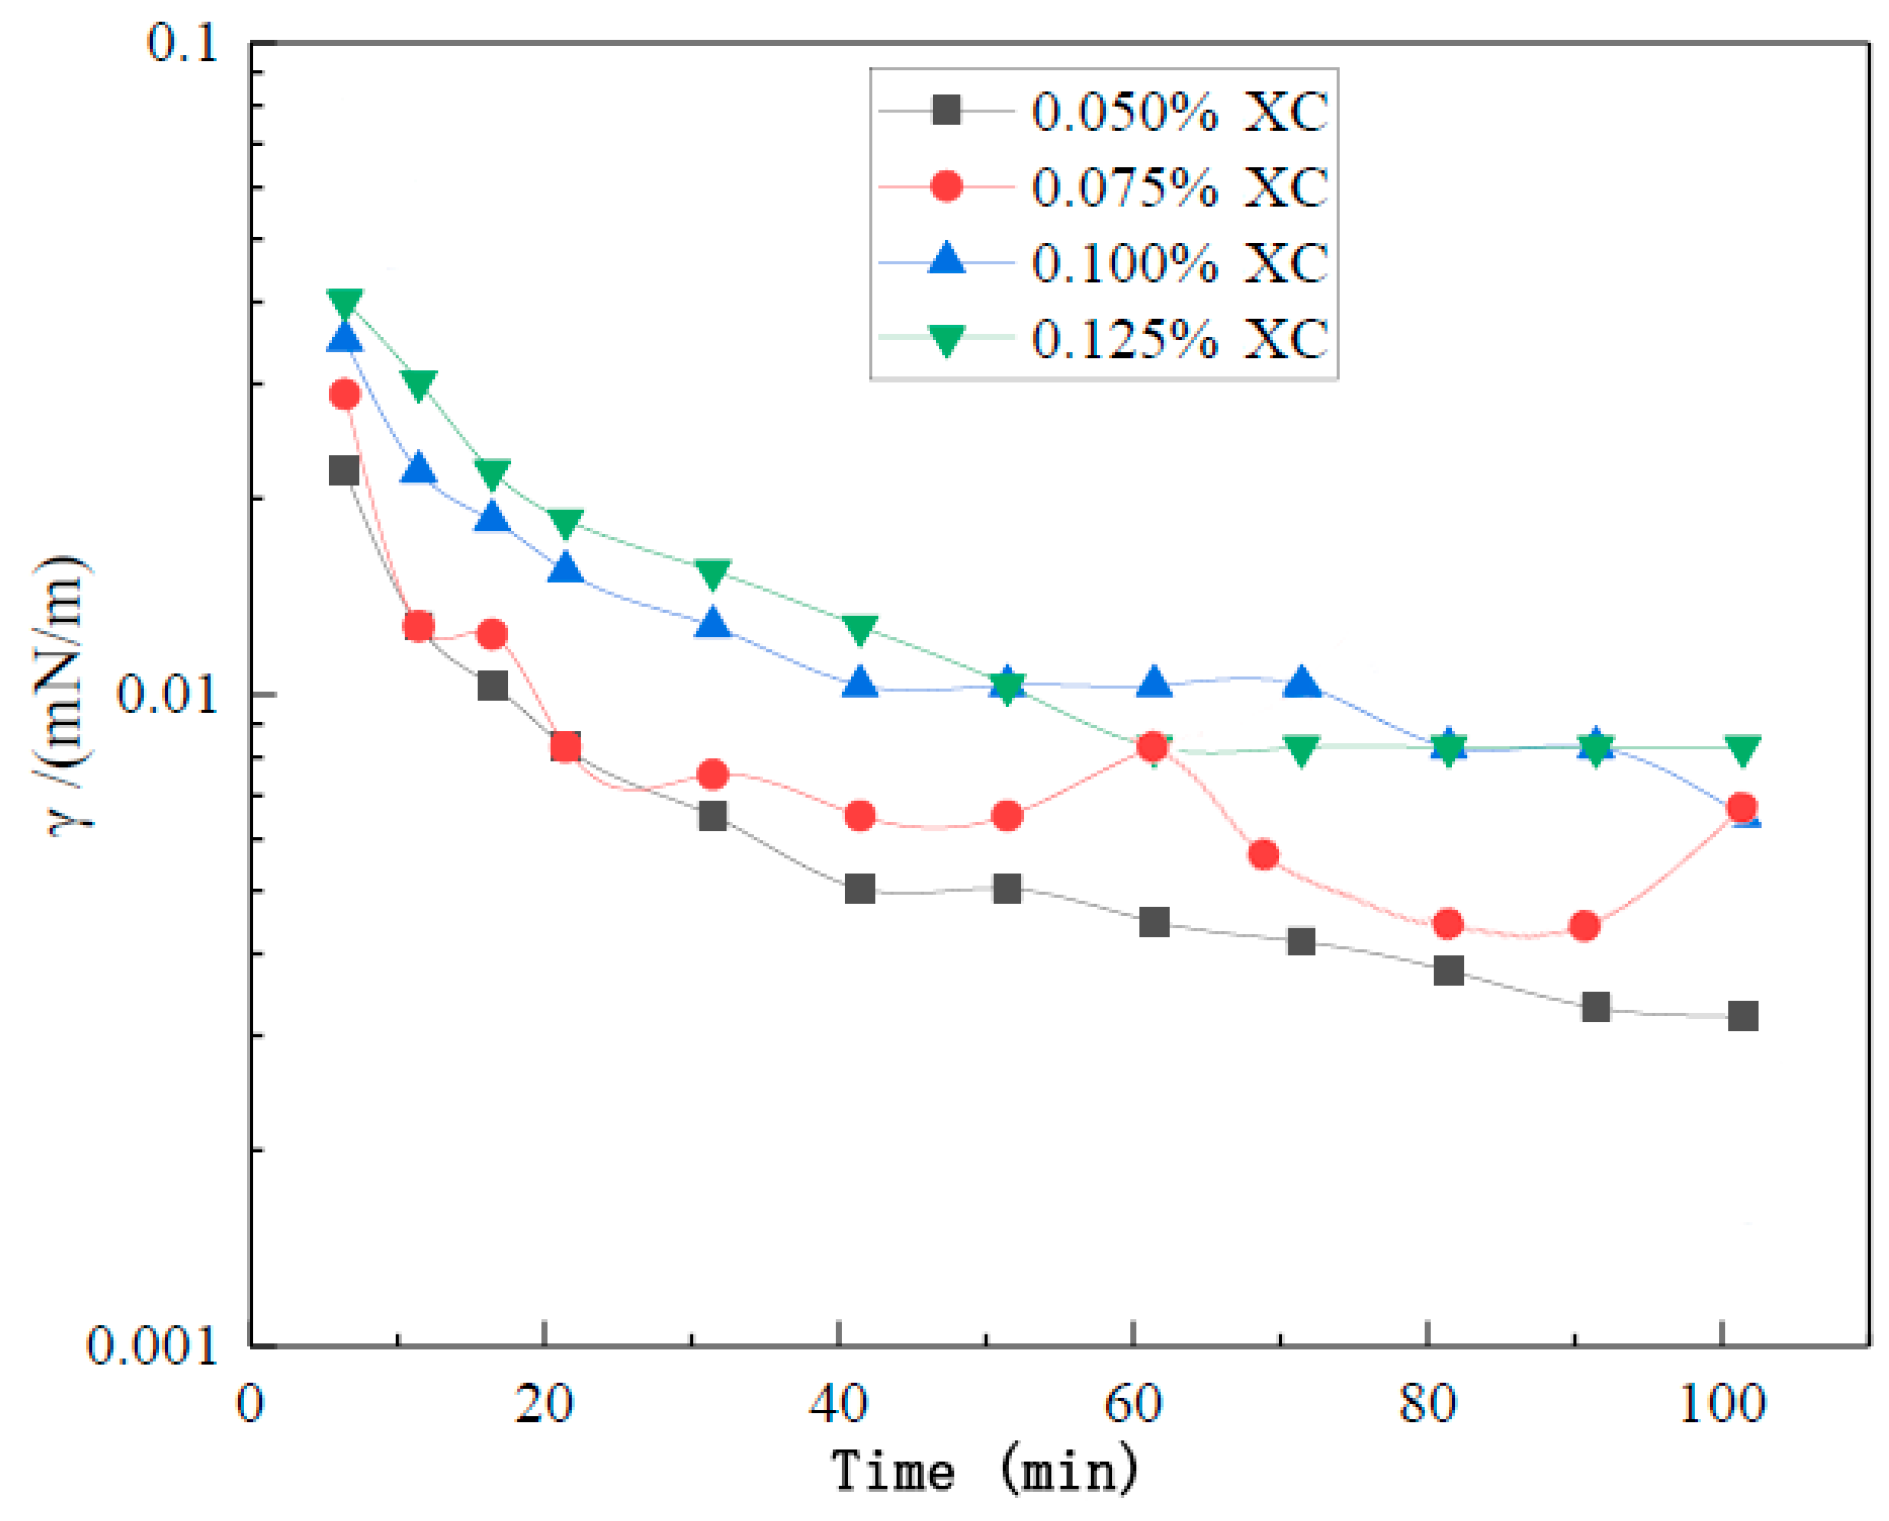
3.3. Foam Stabilizer Selection

Foam stabilizers (i.e., polymers) improve the stability of foam mainly by increasing the viscosity of the foam system’s liquid phase [24,25]. Therefore, the concentration of the polymer solution may be an important indicator of its ability to stabilize the foam system. The viscosity-temperature curve (shear rate: 0.1 s−1) and viscosity-shear rate curve (temperature at 45 °C) were obtained using a rheometer (Haake Mars III, Thermo Fisher Scientific, Waltham, MA, USA) to evaluate the effect of the stabilizers. The results are shown in Figure 3.
The viscosity of XC at 0.1 g/L was higher than that of the other samples, given its shear rate of 0.03 s−1, as shown in Figure 3a. Figure 3b shows that the viscosity of XC is higher than that of the other polymers over the temperature range of 20 °C to 90 °C. Common polymers are mostly linear structures, whereas XC has a double helix structure.
This double helix structure induces greater intermolecular entanglement and interaction between XC molecules; thus, the XC molecules maintain their structure better under external influences. In the presence of inorganic salts, XC molecules swell, which increases their viscosity. This feature ensures that XC performs better at high temperatures and under high salinity conditions.

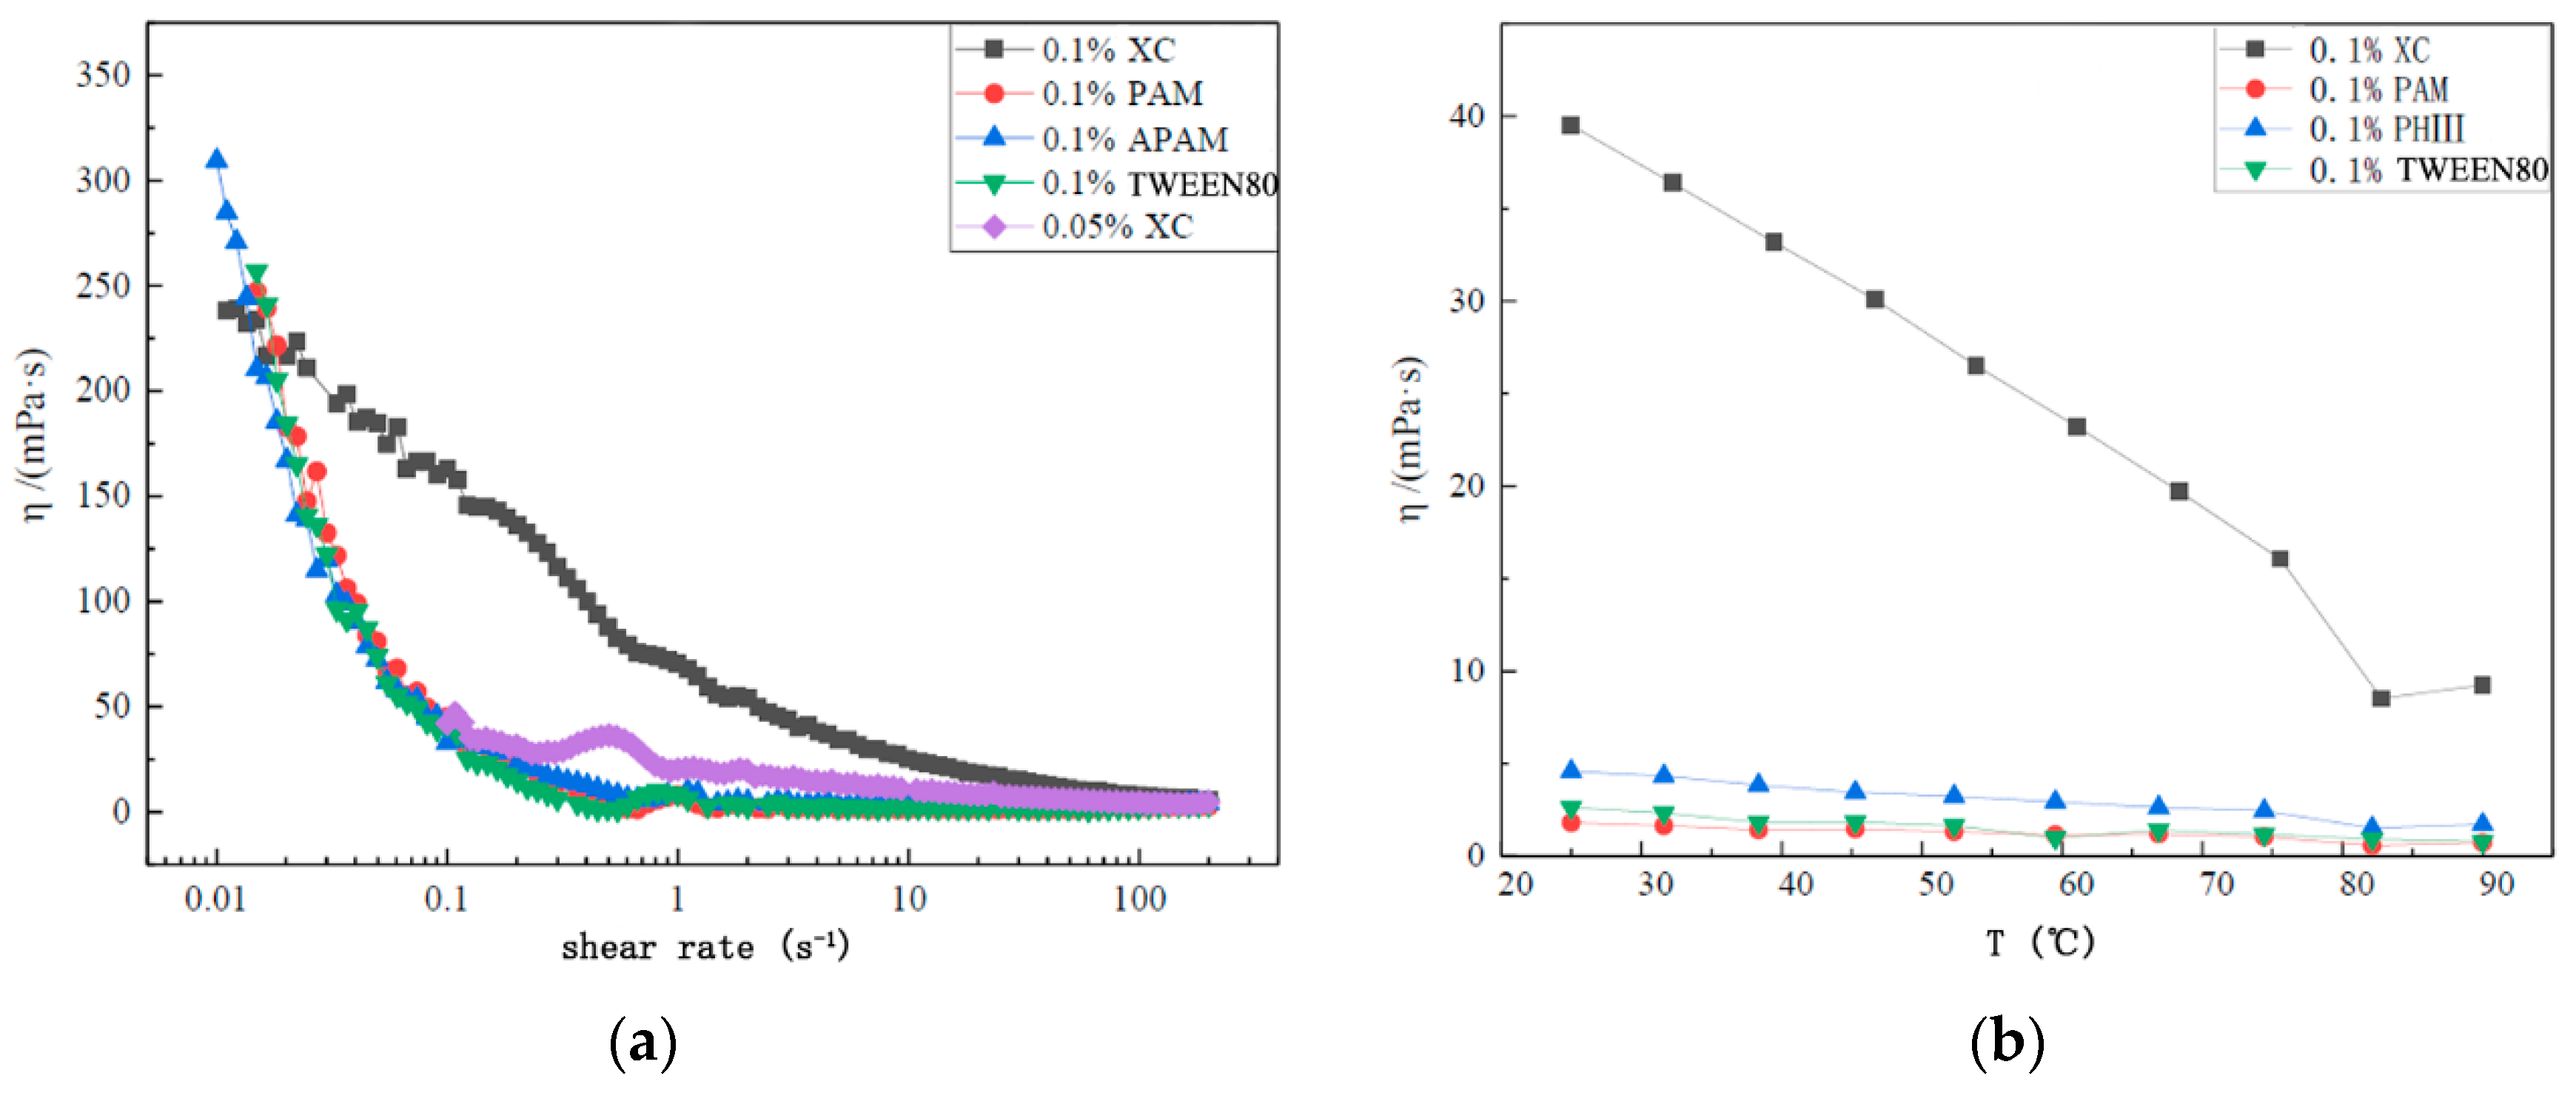
3.4. Optimization of Foam System Performance

The surfactants (SDS at 0.18 g/L and DHPB at 0.12 g/L) were compounded with XC polymer, and the impact of the polymer’s concentration on the oil-liquid IFT and foaming properties was investigated. Figure 4 shows the influence of the XC concentration on the oil-liquid IFT.
The oil-liquid IFT increased with the XC concentration over time, as shown in Figure 4. Additionally, the adsorption rate of surfactant molecules from the liquid phase to the oil-liquid interface decreased as the XC concentration increased. However, the rate of the surfactant molecules’ desorption from the oil-liquid interface to the oil phase did not change significantly, which eventually led to a decrease in the surfactant molecule concentration at the oil-liquid interface when the adsorption equilibrium was reached.
With an increasing XC concentration, the foaming volume and the foam half-life of the system decreased slightly, but the drainage half-life of the foam increased significantly (Table 9). The foam viscosity increased with the XC concentration; thus, more energy was needed for the foaming process. However, the external energy obtained by the system stayed the same due to the same foaming method and stirring time, leading to a reduction in the foam volume. Meanwhile, the diffusion resistance of surfactant molecules increased with the liquid’s viscosity. This resulted in localized thinning of the liquid film, a delay in the liquid film’s self-repair, and a decline in the foam half-life. As the viscosity of the liquid increased, the liquid film’s drainage rate and the gas diffusion rate decreased, which led to an increase in the drainage half-life.
Temperature could affect the stability of foam system by affecting viscosity, molecular motion, intermolecular force and molecular structure. According to the results in Table 9, the system with higher XC’s concentration performed better foaming properties and foam stability at high temperature, and the system with lower XC’s concentration had better performance at low temperature. This was mainly caused by the viscosity change [26], the viscosity of the system with high XC’s concentration was too high at low temperature, but it could maintain a certain viscosity at high temperature. Therefore, it was concluded that the most suitable concentration of XC was 0.075 g/L based on the experimental results.

3.5. Macroscopic Flow Characteristics and EOR Effect

Figure 5 shows the differential pressure varied with the injection volume, and, the results of core-flooding experiment were shown in Table 10 (E0 is the EOR rate of water flooding and Ec is the EOR rate of chemical flooding).
The foam flooding showed an obvious blocking effect, while the ASP flooding had almost no blocking effect. Meanwhile, the target foam system showed better blocking effect in both high permeability group (numbers 1–3) and low permeability group (numbers 4–6) than normal foam system. This results indicated that the Jamin Effect caused by the target foam system is more stable and effective than normal foam system. Which means, the target system could be more stable than normal foam system in porous media at high temperatures [27,28].
In high permeability group (numbers 1–3), the EOR rate of target foam flooding was nearly equivalent to ASP flooding, but significantly better than normal foam flooding. Commonly, blocking effect has a weak impact on the EOR rate in high permeability conditions [29], therefore, normal foam system performed a weak EOR effect. However, as the liquid phase had high EOR capacity (having ultra-low oil-liquid IFT), the target foam system showed better EOR rate than other two controlling group. In the low permeability group (numbers 4–6), the EOR effect of both foam flooding increased, but the ASP flooding’s EOR effect declined sharply. In low permeability conditions, liquid with low viscosity could escape along the high permeability channels, thus, blocking effect could improve the EOR rate effectively [30,31].

4. Conclusions and Proposals

4.1. Conclusions

This study focused on strengthening the effect of a foam’s liquid phase during the oil flooding process, in an attempt to prepare a foam system for EOR with high foaming properties and an ultra-low oil-liquid IFT. Several surfactants and polymers were evaluated. The foam composition was optimized by adjusting the surfactant and polymer concentrations and combinations, with the goal of achieving a foam system with an ultra-low oil-liquid IFT and a high foaming capacity. The main conclusions are summarized below.
  • The foam system should have both a high foaming capacity and a low oil-liquid IFT obtained by using different surfactant and polymer structures and adjusting the composition of chemical additives.
  • The compounding of DHPB and SDS (mass ratio at 1:1.5) exhibited the best foaming properties (FCI: 117,600 mL·min) and the lowest oil-liquid IFT (0.0076 mN/m). The compounding of surfactants with the same carbon number showed better results.
  • Increasing polymer concentration lowered the oil-liquid IFT reduction rate, and led to an increase in the oil-liquid IFT. The viscosity of the liquid phase depends on the polymer concentration, which expected to affect the diffusion of surfactants and gas.
  • Ultra-low IFT foam system could function as both surfactant-polymer system and foam system in flooding process, which means it mainly functions in oil-liquid IFT reduction in high permeability conditions and blocks the high permeability channels in low permeability conditions. This feature meant the ultra-low IFT foam system could be more applicable in the EOR process.

4.2. Proposals

There have been few studies on the synergistic mechanisms of different surfactants. Investigations in this area are expected to provide a theoretical basis for subsequent research. Additionally, continued study of the effectiveness in EOR and migration in porous media of ultra-low IFT foam systems may provide new ideas for oil flooding and multiphase flow in porous media.

Author Contributions

Q.L. and S.L. performed the experiments, analyzed the data and wrote the paper; B.P. designed the experiments; D.L. and B.P. conducted the work and revised the paper.

Funding

This research was funded by the National Natural Science Foundation of China (Grant No. 51604288), the Science Foundation of China University of Petroleum, Beijing (Grant No. 2462018BJB002), and the Beijing Municipal Natural Science Foundation (Grant No. 2184119).

Acknowledgments

Qi Liu and Shuangxing Liu contributed equally to this work. The English in this document has been polished by at least two professional editors, both native speakers of English (Please direct any questions regarding this certificate or the English in the certified paper to: [email protected]).

Conflicts of Interest

The authors declare no conflict of interest.

References

  1. Ahmed, S.; Elraies, K.A.; Tan, I.M.; Hashmet, M.R. Experimental investigation of associative polymer performance for CO2, foam enhanced oil recovery. J. Pet. Sci. Eng. 2017, 157, 971–979. [Google Scholar] [CrossRef]
  2. Talebian, S.H.; Masoudi, R.; Tan, I.M.; Zitha, P.L.J. Foam assisted CO2-EOR: A review of concept, challenges, and future prospects. J. Pet. Sci. Eng. 2014, 120, 202–215. [Google Scholar] [CrossRef]
  3. Awan, A.R.; Teigland, R.; Kleppe, J. A Survey of North Sea Enhanced-Oil-Recovery Projects Initiated During the Years 1975 to 2005. SPE Reserv. Eval. Eng. 2008, 11, 497–512. [Google Scholar] [CrossRef]
  4. Jones, S.A.; Van Der Bent, V.; Farajzadeh, R.; Rossen, W.R.; Vincent-Bonnieu, S. Surfactant screening for foam EOR: Correlation between bulk and core-flood experiments. Colloids Surf. A Physicochem. Eng. Asp. 2016, 500, 166–176. [Google Scholar] [CrossRef]
  5. Guo, H.; Faber, M.J.; Buijse, M.A.; Zitha, P.L. A Novel Alkaline-Surfactant-Foam EOR Process. In Proceedings of the SPE Enhanced Oil Recovery Conference, Kuala Lumpur, Malaysia, 19–21 July 2011. [Google Scholar]
  6. Ocampo, A.; Restrepo, A.; Cifuentes, H.; Hester, J.; Orozco, N.; Gil, C.; Castro, E.; Lopera, S.; Gonzalez, C. Successful Foam EOR Pilot in a Mature Volatile Oil Reservoir Under Miscible Gas Injection. J. Pet. Technol. 2013, 65, 117–119. [Google Scholar]
  7. Druetta, P.; Raffa, P.; Picchioni, F. Plenty of Room at the Bottom: Nanotechnology as Solution to an Old Issue in Enhanced Oil Recovery. Appl. Sci. 2018, 8, 2596. [Google Scholar] [CrossRef]
  8. Talebian, S.H.; Masoudi, R.; Tan, I.M.; Zitha, P.L. Foam assisted CO2-EOR; Concepts, Challenges and Applications. In Proceedings of the SPE Enhanced Oil Recovery Conference, Kuala Lumpur, Malaysia, 2–4 July 2013. [Google Scholar]
  9. Ahmed, S.; Elraies, K.A.; Tan, I.M.; Mumtaz, M. A Review on CO2 Foam for Mobility Control: Enhanced Oil Recovery. In ICIPEG 2016; Springer: Singapore, 2017. [Google Scholar]
  10. Srisuriyachai, F.; Pancharoen, M.; Laochamroonvoraponse, R.; Vathanapanich, Y. Reduction of Surfactant Adsorption: A Study of Dynamic Surfactant Adsorption/Desorption in Shaly-sandstone Reservoir. In Proceedings of the IOR 2019—20th European Symposium on Improved Oil Recovery, Pau, France, 8–11 May 2019. [Google Scholar]
  11. Gu, Q.; Liu, H.; Zhang, Y. Lattice Boltzmann Simulation of Immiscible Two-Phase Displacement in Two-Dimensional Berea Sandstone. Appl. Sci. 2018, 8, 1497. [Google Scholar] [CrossRef]
  12. Ologundudu, T.; Odiyo, J.; Ekosse, G.I. Fluoride Sorption Efficiency of Vermiculite Functionalised with Cationic Surfactant: Isotherm and Kinetics. Appl. Sci. 2016, 6, 277. [Google Scholar] [CrossRef]
  13. Sahner, R.A.; Trivedi, K.; Puliafito, A. Generalized Correlations for Predicting Solubility, Swelling and Viscosity Behavior of CO2-Crude Oil Systems. J. Petrol. Technol. 1965, 17, 102–106. [Google Scholar]
  14. Kang, P.S.; Lim, J.S.; Huh, C. Artificial Neural Network Model to Estimate the Viscosity of Polymer Solutions for Enhanced Oil Recovery. Appl. Sci. 2016, 6, 188. [Google Scholar] [CrossRef]
  15. Yang, Y.; Gupta, M.C.; Dudley, K.L.; Lawrence, R.W. Conductive Carbon Nanofiber–Polymer Foam Structures. Adv. Mater. 2010, 17, 1999–2003. [Google Scholar] [CrossRef]
  16. Holland, P.M.; Rubingh, D.N. Nonideal Multlcomponent Mixed Mlcelle Model. J. Phys. Chem. 1983, 87, 1984–1990. [Google Scholar] [CrossRef]
  17. Hsu, Y.Y.; Gresser, J.D.; Trantolo, D.J.; Lyons, C.M.; Gangadharam, P.R.; Wise, D.L. Effect of polymer foam morphology and density on kinetics of in vitro controlled release of isoniazid from compressed foam matrices. J. Biomed. Mater. Res. Part A 1997, 35, 107–116. [Google Scholar] [CrossRef]
  18. Farajzadeh, R.; Andrianov, A.; Zitha, P.L.J. Investigation of Immiscible and Miscible Foam for Enhancing Oil Recovery. Ind. Eng. Chem. Res. 2010, 49, 1910–1919. [Google Scholar] [CrossRef]
  19. Tsujii, K.; Okahashi, K.; Takeuchi, T. Addition-compound formation between anionic and zwitter-ionic surfactants in water. J. Phys. Chem. 1982, 86, 1437–1441. [Google Scholar] [CrossRef]
  20. Suh, K.W.; Krueger, D.C.; Zehner, B.E. Method for the Preparation of Styrene Polymer Foam. U.S. Patent NO. 4,438,224, 1986. [Google Scholar]
  21. Zhou, S. Advances in Energy Science and Equipment Engineering II. Eur. J. Nutr. 2015, 45, 187–195. [Google Scholar]
  22. Tang, S.; Tian, L.; Lu, J.; Wang, Z.; Xie, Y.; Yang, X.; Lei, X. A Novel Low Tension Foam Flooding for Improving Post-Chemical-Flood in Shuanghe Oilfield. In Proceedings of the SPE Improved Oil Recovery Symposium, Tulsa, OK, USA, 12–16 April 2014; Society of Petroleum Engineers: Richardson, TX, USA, 2014. [Google Scholar]
  23. Rosen, M.J.; Hua, X.Y. Surface concentrations and molecular interactions in binary mixtures of surfactants. J. Colloid Interface Sci. 1982, 86, 164–172. [Google Scholar] [CrossRef]
  24. Xiangchun, Z.; Junhui, Z.; Zhixue, S. Performance evaluation and study of flooding control of foam gel in SZ36-1 oilfield. Petrochem. Ind. Appl. 2012, 41, 57–59. [Google Scholar]
  25. Willett, J.L.; Shogren, R.L. Processing and properties of extruded starch/polymer foams. Polymer 2002, 43, 5935–5947. [Google Scholar] [CrossRef]
  26. Osterloh, W.T.; Jante, M.J. Effects of Gas and Liquid Velocity on Steady-State Foam Flow at High Temperature. In Proceedings of the SPE/DOE Enhanced Oil Recovery Symposium, Tulsa, OK, USA, 22–24 April 1992; p. 24179. [Google Scholar]
  27. Martín, M.; García, J.M.; Montes, F.J.; Galán, M.A. On the effect of the orifice configuration on the coalescence of growing bubbles. Chem. Eng. Process. Process Intensif. 2008, 47, 1799–1809. [Google Scholar] [CrossRef]
  28. Kamp, A.M.; Chesters, A.K.; Colin, C.; Fabre, J. Bubble coalescence in turbulent flows: A mechanistic model for turbulence-induced coalescence applied to microgravity bubbly pipe flow. Int. J. Multiph. Flow 2001, 27, 1363–1396. [Google Scholar] [CrossRef]
  29. Liu, P.; Zhang, X.; Wu, Y.; Li, X. Enhanced oil recovery by air-foam flooding system in tight oil reservoirs: Study on the profile-controlling mechanisms. J. Pet. Sci. Eng. 2017, 150, 208–221. [Google Scholar] [CrossRef]
  30. Chen, B.; Reynolds, A.C. Ensemble-based optimization of the water-alternating-gas-injection process. SPE J. 2016, 2, 11–20. [Google Scholar] [CrossRef]
  31. Yu, J.; Mo, D.; Liu, N.; Lee, R. The application of nanoparticle-stabilized CO2 foam for oil recovery. In Proceedings of the SPE International Symposium on Oilfield Chemistry, The Woodlands, TX, USA, 8–10 April 2013. [Google Scholar]
Figure 1. Molecular structure of the surfactants.
Applsci 09 02155 g001
Figure 2. Flow chart of core-flooding experiment.
Applsci 09 02155 g002
Figure 3. (a) Viscosity versus shear rate and (b) viscosity versus temperature.
Applsci 09 02155 g003
Figure 4. Influence of the xanthan gum (XC) concentration on oil-liquid interfacial tension.
Applsci 09 02155 g004
Figure 5. Differential pressure varied with the injection volume.
Applsci 09 02155 g005
Table 1. Ion composition of the Dagang Oilfield.
IonNa++K+Ca2+Mg2+HCO3SO42−ClCO32−Salinity
concentration (mg/L)445935611696653929894379862
Table 2. Inorganic salts used in this study (AR, refers to Analytical Reagent).
Inorganic SaltPurityManufacturer
NaClARMacklin
KClARMacklin
CaCl2·2H2OARMacklin
MgCl2·6H2OARMacklin
Na2CO3ARMacklin
Na2SO4ARMacklin
NaHCO3ARMacklin
Table 3. Chemicals used in this study.
ChemicalPurityTypeCritical Micelle Concentration
(CMC) at 25 °C
Tetradecyl hydroxypropyl phosphate betaine (THPB)40%Amphoteric1200 mg/L
Dodecyl hydroxypropyl phosphate betaine (DHPB)45%Amphoteric1360 mg/L
3-sulfopropyltetradecyl dimethyl betaine (3-SDB)98%Amphoteric1000 mg/L
Cetyltrimethylammonium bromide (CTAB)99%Cationic343 mg/L
Fatty amine polyoxyethylene ether (AC, C14)99%Nonionic97 mg/L
α-Sodium olefin sulfonate (AOS, C12)92%Anionic1932 mg/L
Sodium sulfate (SO)96%Anionic365 mg/L
Sodium lauryl sulfate (AES)70%Anionic2177 mg/L
Sodium dodecyl sulfate (SDS)96%Anionic2307 mg/L
sodium dodecyl benzene sulfonate (SDBS)99%Anionic418 mg/L
ChemicalPurityTypeViscosity at 45 °C, 1 g/L
Anionic polyacrylamide
(APAM, 5 million molecular weight)
99%Polymer3331 mPa·s
Xanthan gum (XC)USPPolymer9472 mPa·s
Nonionic polyacrylamide
(PAM, 5 million molecular weight)
99%Polymer3922 mPa·s
Polysorbate 80 (Tween 80)40%Polymer493 mPa·s
Table 4. Parameters of foaming properties used in this study.
ParameterSymbolDefinitionUnit
Foaming volumeV0Volume of foam after foamingmL
Residual-liquid volumeVtVolume of liquid remaining after foamingmL
Foam half-lifet1/2Time required for the foam’s volume to be reduced by half of its initial volumemin
Drainage half-lifetDTime required for the foam to lose half of its liquids
Foam composite indexFCIFunction of foaming volume and foam half-lifemL·min
Table 5. Parameters of the artificial cores used in the core flooding experiment.
NumberWater Permeability (mD)Porosity (%)Pore Volume (mL)
110923.56.920
211123.26.832
311023.76.979
41.225.77.568
5125.97.627
6126.17.686
Table 6. Grouping of the core-flooding experiment.
NumberGroupCompoundingCore
1Normal foam system1.5 g/L SDS + 2 g/L PAMNO.1
2ASP1 g/L SDBS + 6 g/L Na2CO3 + 1 g/L PAMNO.2
3Target foam system1.2 g/L DHPB + 1.8 g/L SDS + 0.075 g/L XCNO.3
4Normal foam system1.5 g/L SDS + 2 g/L PAMNO.4
5ASP1 g/L SDBS + 6 g/L Na2CO3 + 1 g/L PAMNO.5
6Target foam system1.2 g/L DHPB + 1.8 g/L SDS + 0.075 g/L XCNO.6
Table 7. Foaming properties and oil-liquid interfacial tension (IFT) of individual surfactants.
SurfactantConcentration
(g/L)
V0
(mL)
Vt
(mL)
t1/2
(min)
tD
(s)
FCI
(mL·min)
IFT
(mN/m)
THPB0.052106515117523,782.50.4068
0.12653515818031,402.50.5533
0.15235401685429,6100.6883
DHPB0.05190501109215,6750.3245
0.12152512910320,8010.2834
0.152351513111523,0880.2214
3-SDB0.05155651105712,787.50.8971
0.1200501275219,0500.7324
0.15185501766724,4200.6021
CTAB0.0519045603585500.2914
0.124040572810,2600.2429
0.1518055603181000.3755
AN0.05140601203312,6000.8395
0.113065963093600.8524
0.1514550802387000.9455
AOS0.05255358313515,873.751.2123
0.1280209016018,9001.1084
0.15285157310415,603.751.3633
SO0.05No bubble0.0025
0.135951408436750.0016
0.1560806009027,0000.0038
AES0.05110609210075902.3112
0.1265257812915,502.52.2219
0.15260309013317,5502.3794
SDS0.0525025907716,8750.795
0.1260251087021,0600.792
0.1527520997320,4191.0666
SDBS0.051752518422362.50.7434
0.122020194331350.6241
0.1522020225236300.6432
Table 8. Foaming properties and oil-liquid IFT of compound systems.
Compound SystemMass RatioV0
(mL)
Vt
(mL)
t1/2
(min)
tD
(s)
FCI
(mL·min)
IFT
(mN/m)
THPB:AOS1.5:1245151227622,417.50.7145
1:1260151037120,0850.7982
1:1.527015927818,6300.9054
THPB:AES1.5:13601010114527,2700.0154
1:14501011416138,4750.0134
1:1.55305300192119,2500.0107
THPB:SDS1.5:131015767817,6700.0692
1:133015917822,522.50.0631
1:1.5370101028128,3050.0545
DHPB:AOS1.5:1953547433348.750.5789
1:11153046473967.50.6541
1:1.51453057476198.750.7763
DHPB:AES1.5:18045183610800.7316
1:19045183912150.7145
1:1.51154021371811.250.7682
DHPB:SDS1.5:1470523424082,4850.0089
1:1515524225693,472.50.0084
1:1.55605280334117,6000.0076
Table 9. Foaming properties varied with the XC concentration at different temperature.
Temperature
(°C)
Concentration of XC
(g/L)
V0
(mL)
Vt
(mL)
t1/2
(min)
tD
(s)
FCI
(mL·min)
250.055355278631111,547.5
0.0755105263672100,597.5
0.1460024271483,490
0.125435023374776,016.25
450.055405292609118,260
0.0755250281681110,643.75
0.1490026469897,020
0.125450024770483,362.5
650.054951523151985,758.75
0.0755051523454588,627.5
0.14551020957171,321.25
0.125435521357469,491.25
850.053952516829249,770
0.0754202518434157,960
0.14151518139256,336.25
0.1254051519040357,712.5
Table 10. Results of the core-flooding experiment.
NumberOil Saturation (%)E0 (%)Ec (%)
178.2360.618.33
279.1857.3010.67
379.2361.7811.32
469.2648.448.69
568.1845.296.59
666.7143.1111.95

