A Sparse Classification Based on a Linear Regression Method for Spectral Recognition
Abstract
Featured Application
Abstract
1. Introduction
2. Theory of the LRSC Algorithm
2.1. Recognition Based on Linear Regression
2.2. Sparse Solution of the Regression Coefficient
2.3. Recognition of the Prediction Samples
- (1)
- Input training spectral samples and training label and a predicted sample.
- (2)
- Calculate the regression coefficient β0 (sparse solution) of the predicted sample for the training samples.
- (3)
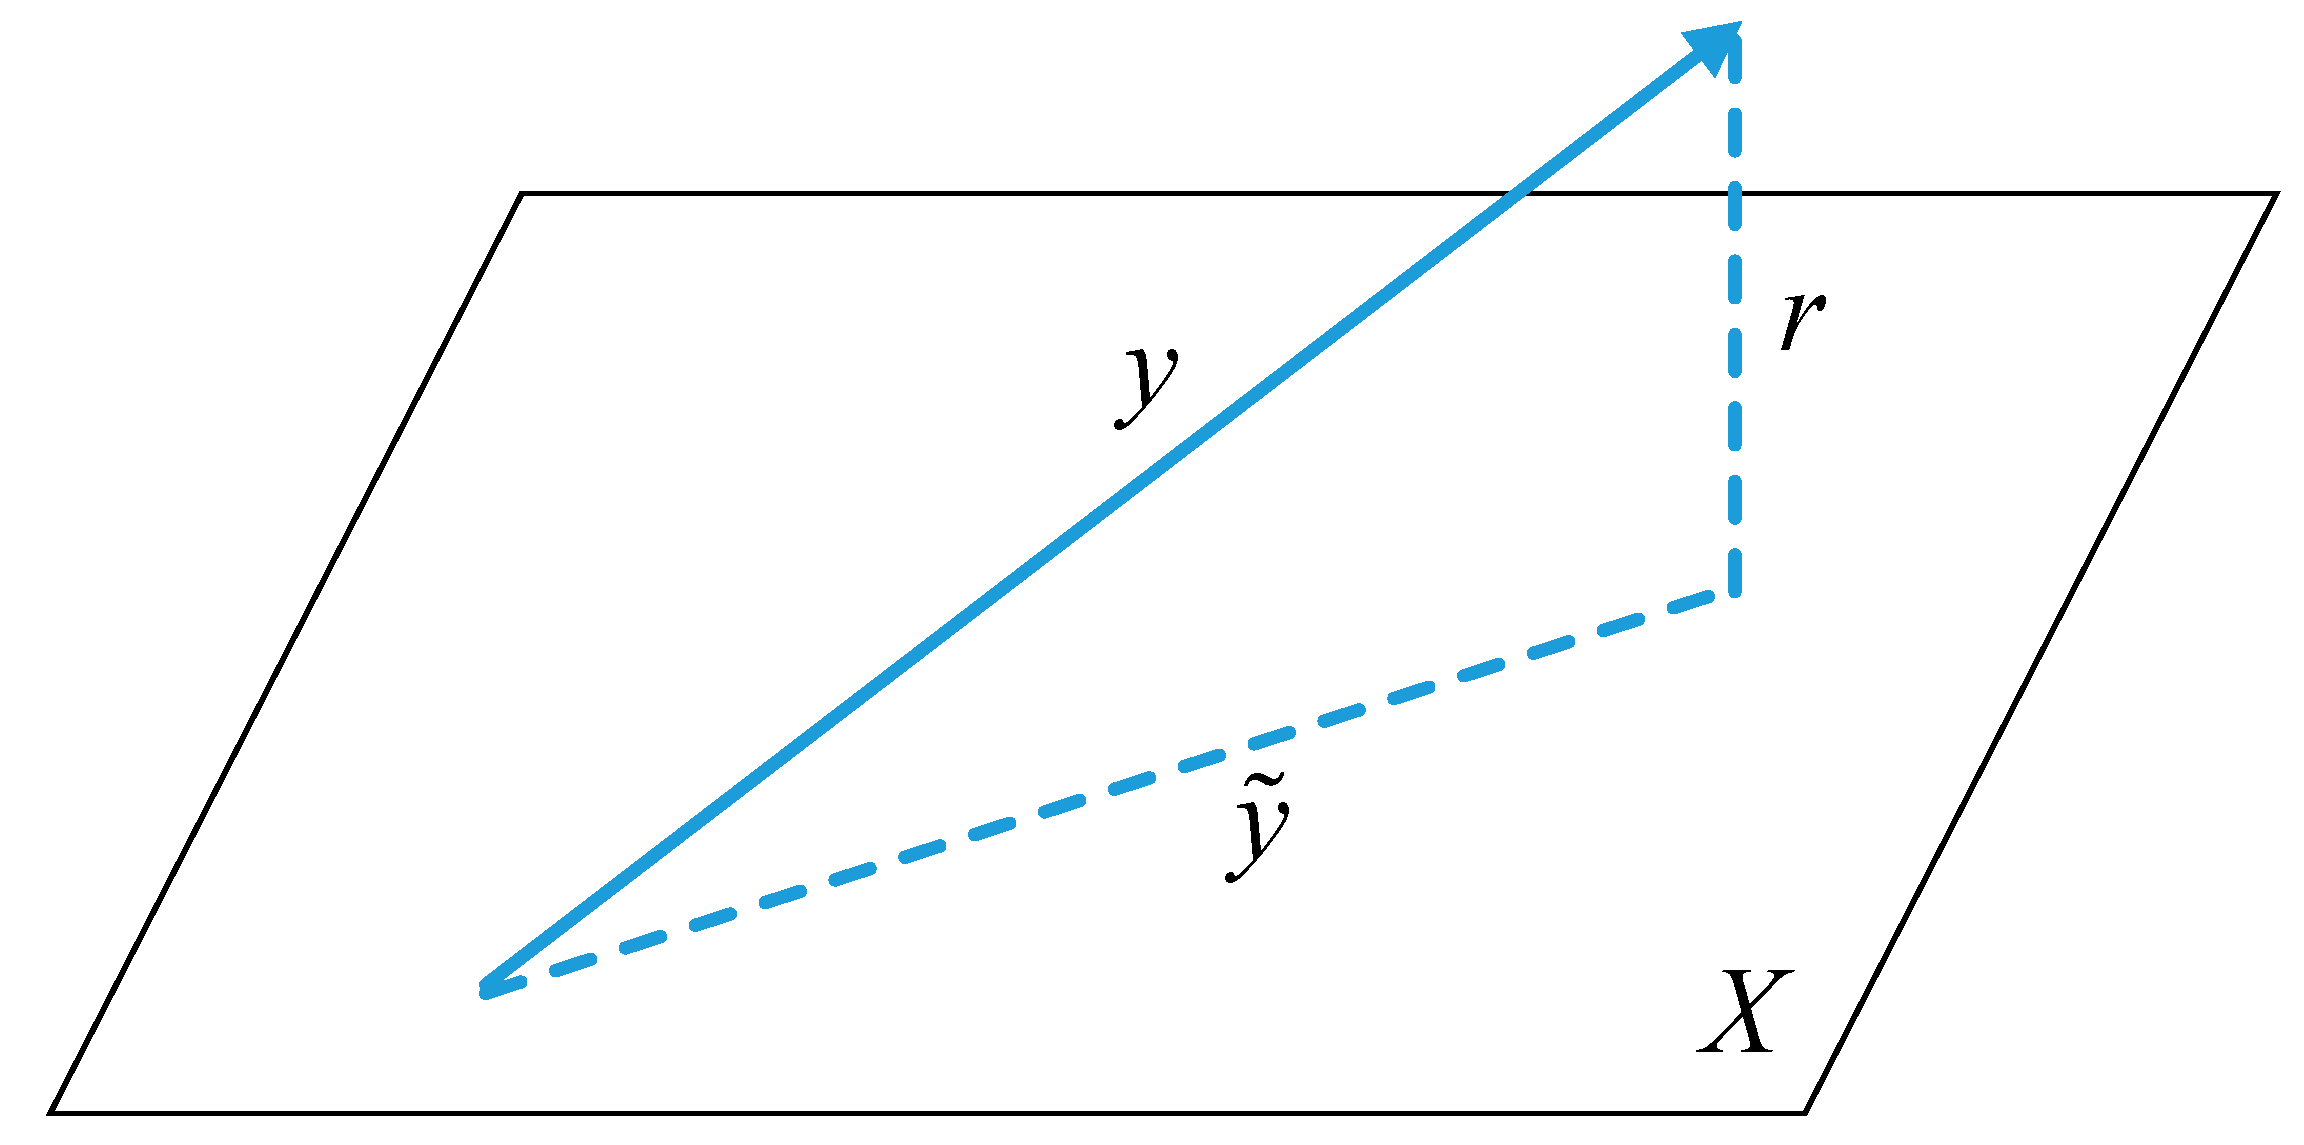
- Calculate estimated prediction sample based on each category of training data and regression coefficient β0.
- (4)
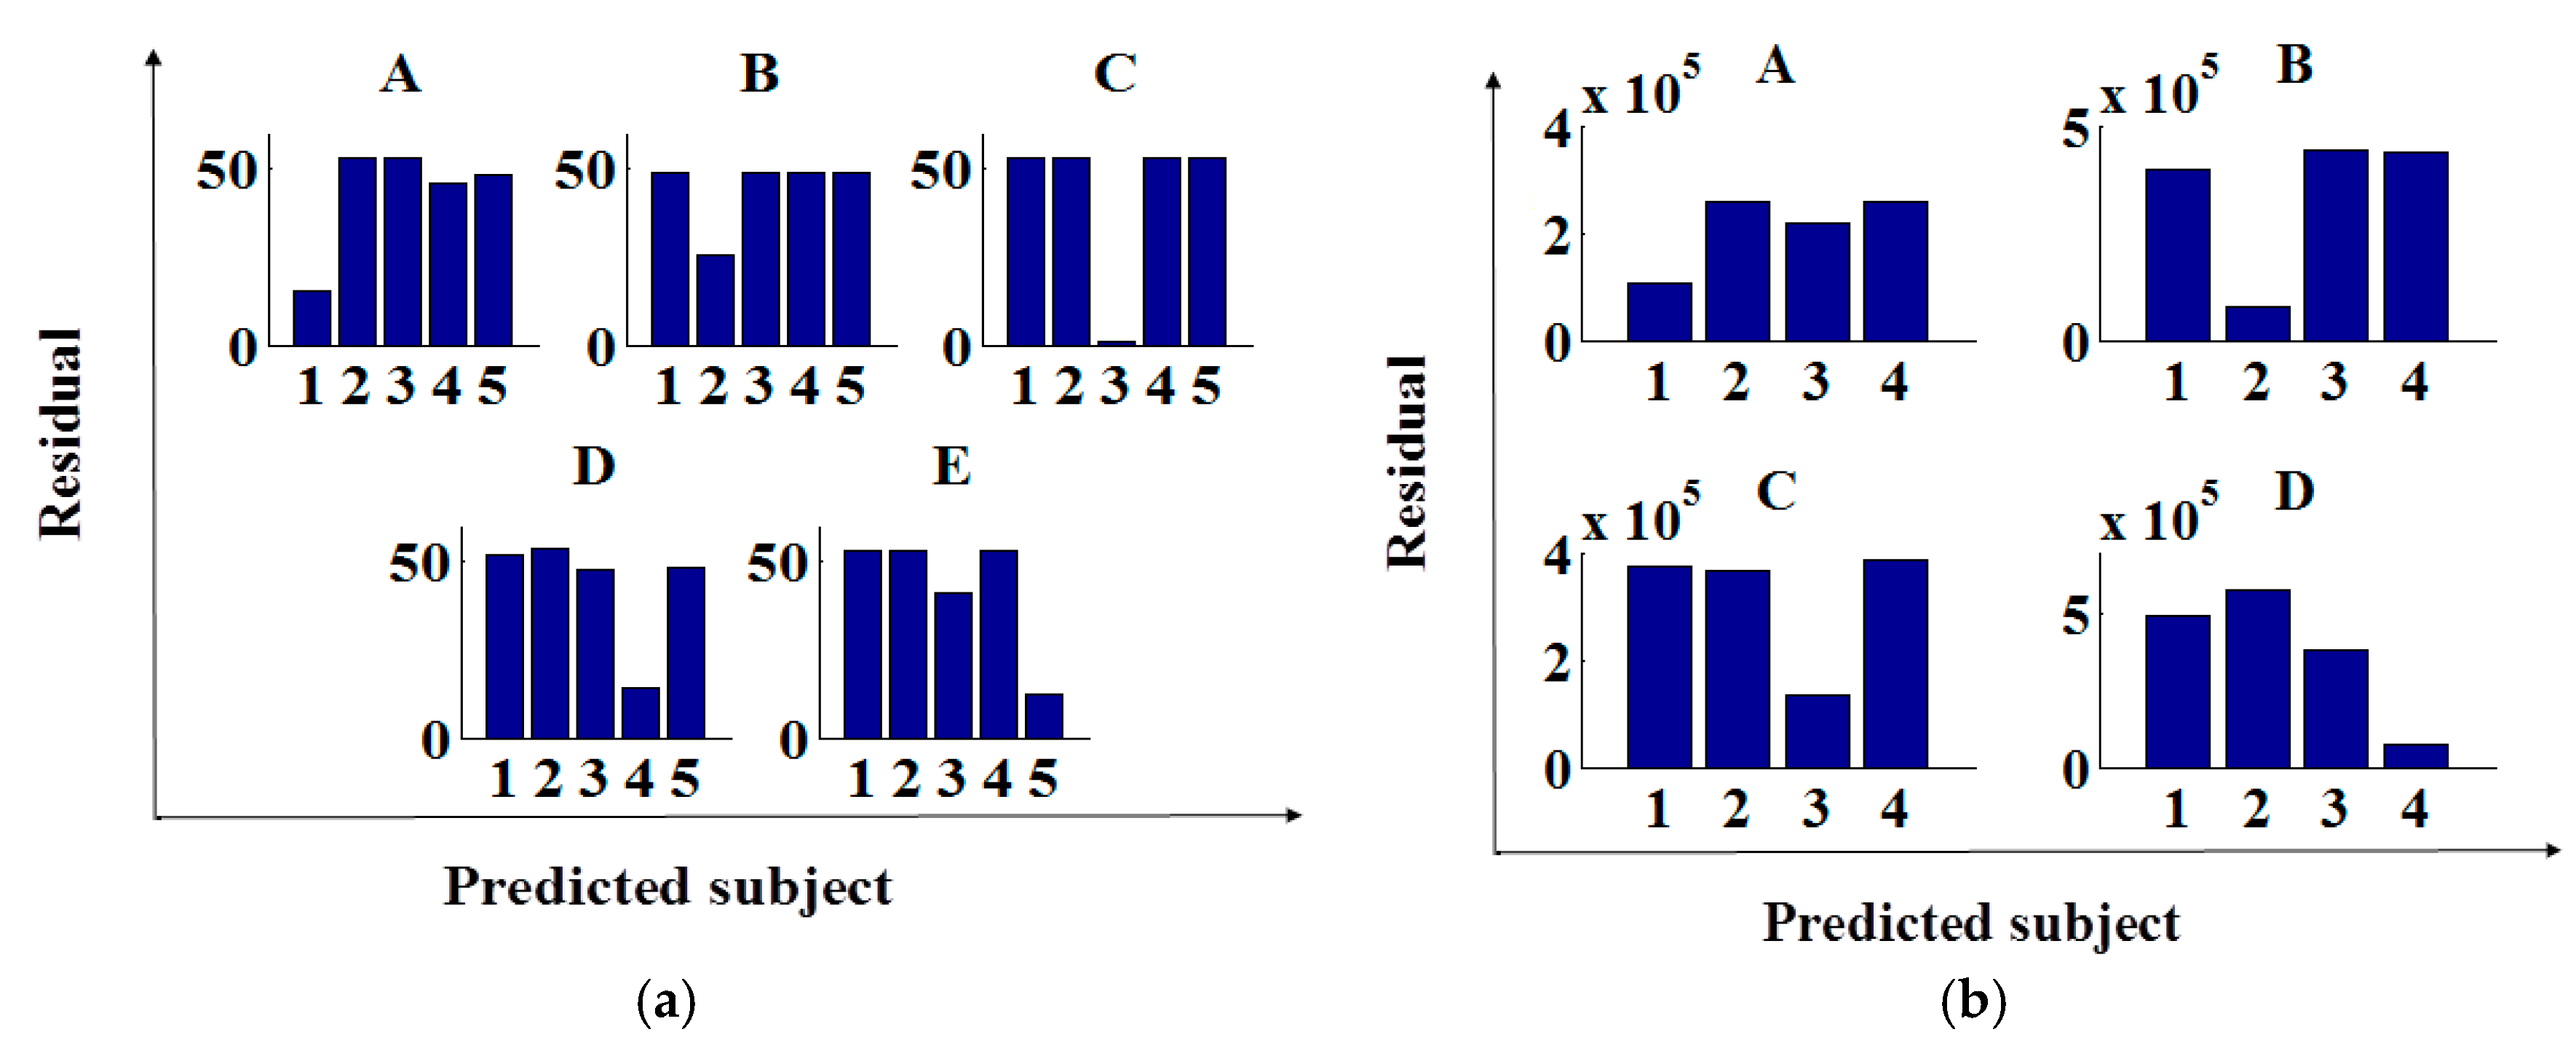
- Calculate the residuals of the estimated/predicted sample from each category ri.
- (5)
- Output the predicted label i.
3. Data and Software
3.1. Datasets
3.2. Software
3.3. Parameter Setting
4. Results and Discussion
4.1. Parameter Selection of the LRSC Algorithm
4.2. Recognition of Different Spectral Data
4.2.1. Infrared Spectral Data of Tegillarca Granosa Polluted by Heavy Metals
4.2.2. LIBS Data of Tegillarca granosa Polluted by Heavy Metals
4.3. Influences of Parameter Setting on Recognition Performance
5. Conclusions and Prospects
Author Contributions
Funding
Conflicts of Interest
References
- Himmelsbach, D.S.; Feii, B.; Mcclung, A.M.; Champagne, E.T. Protein and apparent amylose contents of milled rice by NIR-FT/Raman spectroscopy. Cereal Chem. 2001, 78, 488–492. [Google Scholar] [CrossRef]
- Rossel, R.A.V.; Walvoort, D.J.J.; Mcbratney, A.B.; Janik, L.J.; Skjemstad, J.O. Visible, near infrared, mid infrared or combined diffuse reflectance spectroscopy for simultaneous assessment of various soil properties. Geoderma 2006, 131, 59–75. [Google Scholar] [CrossRef]
- Zhao, H.; Zhang, S.; Wang, Z.; Miao, H.; Du, Z.; Jiang, J. Frequency-domain inverse Monte Carlo simulation for the diagnosis of the early cervical cancer based on NIR diffuse measurement. Biomed. Opt. 2008, 38, 1800–1805. [Google Scholar]
- Xiang, S.; Nie, F.; Zhang, C. Learning a Mahalanobis distance metric for data clustering and classification. Pattern Recognit. 2008, 41, 3600–3612. [Google Scholar] [CrossRef]
- Diniz, P.H.G.D.; Gomes, A.A.; Pistonesi, M.F. BSF Band, MCUD Araújo, Simultaneous Classification of Teas According to Their Varieties and Geographical Origins by Using NIR Spectroscopy and SPA-LDA. Food Anal. Methods 2014, 7, 1712–1718. [Google Scholar]
- Bro, R.; Smilde, A.K. Principal component analysis. Anal. Methods 2014, 6, 2812–2831. [Google Scholar] [CrossRef]
- Ballabio, D.; Consonni, V. Classification tools in chemistry. Part 1: Linear models. PLS-DA. Anal. Methods 2013, 5, 3790–3798. [Google Scholar] [CrossRef]
- Cortes, C.; Vapnik, V. Support-vector networks. Mach. Learn. 1995, 20, 273–297. [Google Scholar] [CrossRef]
- Leardi, R. Application of genetic algorithm–PLS for feature selection in spectral data sets. J. Chemom. 2010, 14, 643–655. [Google Scholar] [CrossRef]
- Wei, W.; Du, Q.; Younan, N.H. Particle swarm optimization based spectral transformation for radioactive material detection and classification. In Proceedings of the IEEE International Conference on Computational Intelligence for Measurement Systems and Applications, Taranto, Italy, 6–8 September 2010; pp. 1–6. [Google Scholar]
- Bastien, P.; Bertrand, F.; Meyer, N.; Maumy-Bertrand, M. Deviance residuals-based sparse PLS and sparse kernel PLS regression for censored data. Bioinformatics 2015, 31, 397–404. [Google Scholar] [CrossRef]
- Sakudo, A.; Yoshimura, E.; Tsenkova, R.; Ikuta, K.; Onodera, T. Native state of metals in non-digested tissues by partial least squares regression analysis of visible and near-infrared spectra. J. Toxicol. Sci. 2007, 32, 135–141. [Google Scholar] [CrossRef] [PubMed][Green Version]
- Wright, J.; Yang, A.Y.; Sastry, S.S.; Sastry, S.S.; Ma, Y. Robust Face Recognition via Sparse Representation. IEEE Trans. Pattern Anal. Mach. Intell. 2009, 31, 210–227. [Google Scholar] [CrossRef] [PubMed]
- Amaldi, E.; Kann, V. On the approximability of minimizing nonzero variables or unsatisfied relations in linear systems. Theor. Comput. Sci. 1998, 209, 237–260. [Google Scholar] [CrossRef]
- Donoho, D.L. For Most Large Underdetermined Systems of Linear Equations the Minimal L1-norm Solution is also the Sparsest Solution. Commun. Pure Appl. Math. 2006, 59, 797–829. [Google Scholar] [CrossRef]
- Tibshirani, R. Regression shrinkage and selection via the lasso. J. R. Stat. Soc. 2011, 73, 267–288. [Google Scholar] [CrossRef]
- Tropp, J.A.; Wright, S.J. Computational Methods for Sparse Solution of Linear Inverse Problems. Proc. IEEE 2009, 98, 948–958. [Google Scholar] [CrossRef]
- Asif, M.S. Primal Dual Pursuit: A Homotopy Based Algorithm for the Dantzig Selector; Georgia Institute of Technology: Atlanta, GA, USA, 2008. [Google Scholar]
- Chen, S.S.; Donoho, D.L.; Saunders, M.A. Atomic Decomposition by Basis Pursuit. Siam Rev. 2001, 43, 129–159. [Google Scholar] [CrossRef]
- Chen, X.; Liu, K.; Cai, J.; Zhu, D.; Chen, H. Identification of heavy metal-contaminated Tegillarca granosa using infrared spectroscopy. Anal. Methods 2015, 7, 2172–2181. [Google Scholar] [CrossRef]
- Dyar, M.D.; Giguere, S.; Carey, C.J.; Boucher, T. Comparison of baseline removal methods for laser-induced breakdown spectroscopy of geological samples. Spectrochim. Acta Part B At. Spectrosc. 2016, 126, 53–64. [Google Scholar] [CrossRef]
- Yi, C.; Lv, Y.; Xiao, H.; Ke, K.; Yu, X. A novel baseline correction method using convex optimization framework in laser-induced breakdown spectroscopy quantitative analysis. Spectrochim. Acta Part B At. Spectrosc. 2017, 138, 72–80. [Google Scholar] [CrossRef]
- Ji, G.; Ye, P.; Shi, Y.; Yuan, L.; Chen, X. Laser-Induced Breakdown Spectroscopy for Rapid Discrimination of Heavy-Metal-Contaminated Seafood Tegillarca granosa. Sensors 2017, 17, 2655. [Google Scholar] [CrossRef] [PubMed]
- L1 Homotopy: A MATLAB Toolbox for Homotopy Algorithms in L1 Norm Minimization Problems. Available online: http://www.ee.ucr.edu/~sasif/homotopy/index.html (accessed on 13 December 2018).
- LIBSVM—A Library for Support Vector Machines. Available online: http://www.csie.ntu.edu.tw/~cjlin/libsvm/ (accessed on 13 December 2018).
- Classification Toolbox (for MATLAB). Available online: http://michem.disat.unimib.it/chm/download/classificationinfo.htm (accessed on 13 December 2018).
- Index of /statistical_learning_course/Windows-Precompiled-RF_MexStandalone-v0.02-. Available online: http://cda.psych.uiuc.edu/statistical_learning_course/Windows-Precompiled-RF_MexStandalone-v0.02-/ (accessed on 13 December 2018).
- Kennard, R.W.; Stone, L.A. Computer Aided Design of Experiments. Technometrics 1969, 11, 137–148. [Google Scholar] [CrossRef]
- Golub, G.H.; Loan, C.F.V. Matrix Computation, 4th ed.; The John Hopkins University Press: Baltimore, MD, USA, 2014. [Google Scholar]
- Yan, S.K.; Yang, H.H.; Hu, B.-C.; Ren, C.-C.; Liu, Z.-B. Variable Selection Method of NIR Spectroscopy Based on Least Angle Regression and GA-PLS. Spectrosc. Spectr. Anal. 2017. [Google Scholar] [CrossRef]
- Pal, S.; Vipsita, S.; Patra, P.K. Evolutionary approach for approximation of artificial neural network. In Proceedings of the IEEE International Advance Computing Conference, Patiala, India, 19–20 February 2010; pp. 172–176. [Google Scholar]

| Method | IR | LIBS |
|---|---|---|
| LRSC | 0.98 ± 0.02 | 0.81 ± 0.05 |
| SIMCA | 0.88 ± 0.06 | 0.08 ± 0.06 |
| SVM | 0.80 ± 0.05 | 0.25 ± 0.00 |
| ANN | 0.68 ± 0.08 | 0.25 ± 0.00 |
| RF | 0.65 ± 0.09 | 0.52 ± 0.07 |
| PLSDA | 0.97 ± 0.01 | 0.46 ± 0.09 |
© 2019 by the authors. Licensee MDPI, Basel, Switzerland. This article is an open access article distributed under the terms and conditions of the Creative Commons Attribution (CC BY) license (http://creativecommons.org/licenses/by/4.0/).
Share and Cite
Ye, P.; Ji, G.; Yuan, L.-M.; Li, L.; Chen, X.; Karimidehcheshmeh, F.; Chen, X.; Huang, G. A Sparse Classification Based on a Linear Regression Method for Spectral Recognition. Appl. Sci. 2019, 9, 2053. https://doi.org/10.3390/app9102053
Ye P, Ji G, Yuan L-M, Li L, Chen X, Karimidehcheshmeh F, Chen X, Huang G. A Sparse Classification Based on a Linear Regression Method for Spectral Recognition. Applied Sciences. 2019; 9(10):2053. https://doi.org/10.3390/app9102053
Chicago/Turabian StyleYe, Pengchao, Guoli Ji, Lei-Ming Yuan, Limin Li, Xiaojing Chen, Fatemeh Karimidehcheshmeh, Xi Chen, and Guangzao Huang. 2019. "A Sparse Classification Based on a Linear Regression Method for Spectral Recognition" Applied Sciences 9, no. 10: 2053. https://doi.org/10.3390/app9102053
APA StyleYe, P., Ji, G., Yuan, L.-M., Li, L., Chen, X., Karimidehcheshmeh, F., Chen, X., & Huang, G. (2019). A Sparse Classification Based on a Linear Regression Method for Spectral Recognition. Applied Sciences, 9(10), 2053. https://doi.org/10.3390/app9102053


