Article

PARNet: A Joint Loss Function and Dynamic Weights Network for Pedestrian Semantic Attributes Recognition of Smart Surveillance Image

1
College of Information Science and Engineering, Northeastern University, Shenyang 110819, China
2
School of Land Science and Technology, China University of Geosciences, Beijing 100083, China
3
Neusoft group co. LTD., Intelligent application division, Intelligent technology research center, Shenyang 110179, China
4
The State Key Laboratory of Remote Sensing Science, Beijing Normal University, Beijing 100875, China
*
Author to whom correspondence should be addressed.
Appl. Sci. 2019, 9(10), 2027; https://doi.org/10.3390/app9102027
Submission received: 17 April 2019 / Revised: 13 May 2019 / Accepted: 14 May 2019 / Published: 16 May 2019

Abstract

:
The capability for recognizing pedestrian semantic attributes, such as gender, clothes color and other semantic attributes is of practical significance in bank smart surveillance, intelligent transportation and so on. In order to recognize the key multi attributes of pedestrians in indoor and outdoor scenes, this paper proposes a deep network with dynamic weights and joint loss function for pedestrian key attribute recognition. First, a new multi-label and multi-attribute pedestrian dataset, which is named NEU-dataset, is built. Second, we propose a new deep model based on DeepMAR model. The new network develops a loss function, which joins the sigmoid function and the softmax loss to solve the multi-label and multi-attribute problem. Furthermore, the dynamic weight in the loss function is adopted to solve the unbalanced samples problem. The experiment results show that the new attribute recognition method has good generalization performance.

1. Introduction

In recent years, video surveillance has been widely used in various fields, which brings convenience and protection to many aspects of human life. However, at the same time, the massive video surveillance flow has troubled the rapid search for effective information, and processing these data requires a large amount of manpower and material resources. While for image or video analysis, the recognition of semantic information is a key step in the intelligent processing and analysis of big data. Pedestrians are an important target in images or video, as we know that the pedestrian attributes are the semantic information of pedestrian. The recognition of pedestrians’ semantic attributes has important application value in many fields. As an important target of video surveillance, the effective recognition of pedestrians and their semantic attributes can not only improve the working efficiency of video surveillance for the staff, but also play an important role in video retrieval [1], pedestrian behavior analysis, identity recognition, scene analysis, and pedestrian re-identification [2]. In addition, pedestrian semantic attribute recognition has also been widely used in intelligent transportation, banking, safe city, public safety and so on [3,4].
At present, there is no complete definition of pedestrian attributes (semantic information) in the surveillance scene. For the study of pedestrian’s semantic attribute recognition, gender, appearance, action, etc. are usually to be identified as semantic attributes [2,3,4]. In recent years, many researchers have proposed a number of effective methods for the recognition of basic pedestrian semantic attributes in videos acquired by a camera sensor. These methods are mainly divided into three kinds of methods: pedestrian parts-based method, the whole pedestrian-based method and the global and local fusion method [4]. The pedestrian parts-based method first detects the position of the pedestrian’s head, upper body, lower body, feet, hat, bag and other sub-components and appendages, and then attributes can be identified according to the parts that have been detected. The whole pedestrian-based method is used for semantic analysis of the whole pedestrian image, the whole outline of the sub-components and attachments is segmented, and then the segmented outline is identified. The global and local fusion method is used to combine the characteristics of local information with the global characteristics to identify the attributes. These three approaches not only can adopt the machine learning method but also can use the deep learning methods.
The pedestrian attribute recognition using the machine learning method mainly aims at the pedestrian region features extraction, and then the classifier can be used to identify the attributes. For example, Layne et al. [5,6] used pedestal features and Support Vector Machines (SVM) to identify pedestrian attributes. Deng et al. [4] adopted the cross-kernel support vector machine model and Markov Random Field (MRF) for pedestrian attributes recognition. Those methods can detect all the pedestrians and appendages, and extract the traditional features (such as grayscale, texture, SIFT, HOG, LBP, etc.), or directly extract the pedestrian characteristics. Then the classifier is used for classification. Therefore, those methods rely on the design and extraction of efficient feature descriptors. In particular, the pedestrian appearance characteristics of the actual scene can change dramatically under different camera conditions, such as changes in viewing angle, illumination changes, scale scaling, occlusion objects, and attitude changes, which affect the expression ability of the feature descriptors. This will result in decreased search accuracy.
In recent years, deep learning has also been widely used in pedestrian semantic attributes recognition. The common method based on the whole pedestrian image is making the pedestrian region as a whole to identify the pedestrian attributes by the deep network such as CNN and RNN. For example, Wang et al. [2] proposed a JRL model based on RNN network to study the correlation of attributes in a pedestrian image. That is, the correlation of attributes prediction sequences. The JRL model is used to dig the attribute context information and relationship between each attribute to improve the recognition accuracy. Patrick et al. proposed the Attribute Convolutional Net (ACN) network, which through the joint training the whole CNN model to learn different attributes [7]. Tian et al. proposed a TA-CNN network that uses a variety of databases to learn many types of attributes [8]. The model combines pedestrian attributes with scene attributes and pedestrian detection for the whole pedestrian image. Li et al. [9] proposed DeepMAR network model (A Deep learning-based Multi-attribute joint recognition model), which uses the prior knowledge in the objective function to identify the attributes. This kind of method usually crops out pedestrian samples, and inputs the samples into the CNN classifier and outputs the multiple pedestrian attribute labels. In addition, there are other pedestrian attributes recognition methods based on parts of information by CNN networks. For example, Georgia Gkioxari et al. [10] used CNN network for human body parts detection, and then the human attributes and motion classified by CNN. Yu et al. [11] designed a weakly supervised pedestrian attributes location network based on GoogleNet, and the attributes labels are predicted by the detection results of mid-level attributes-related features instead of directly predicting the whole human sample. In addition, Li et al. used parts that detect by poselet to integrate with the whole pedestrian, and used human-centric and scene-centric context information, and the deep features are extracted to identify pedestrian attributes [12]. However, this contextual information cannot always be used in monitoring scenarios.
In the above research, the recognition of pedestrian attributes in the monitoring scene has some problems. For example, the quality of the image acquired in the dataset is poor, the change of appearance and the attributes may be in different spatial positions, fewer training samples are marked, the attributes usually do not have the same distribution, and there is an imbalance of samples problem [13,14,15]. These problems affect the network model training and the accuracy of the pedestrian attributes recognition model. Therefore, we present a new pedestrian attributes recognition algorithm for important attributes in video surveillance as shown in Figure 1. This method improves the loss function to reduce the impact of sample imbalance and to achieve multi-attribute and multi-label pedestrian attributes recognition.
The main contributions of this paper are as follows:
(1) Construct a new pedestrian attributes dataset with multi-attribute and multi-label as the same attribute. The built dataset not only has indoor images, but also has more outdoor scenes with pedestrian images. The dataset is much richer and it includes a binary-class label and multiple-class label.
(2) Combine multi-tasking learning and multi-label learning. This is different from other existing methods which express and identify the pedestrian attributes in a binary classification way. The proposed method includes both the binary classification problem of the same attribute and the multiple classification problem of the same attribute. Here, we propose a loss function based on the combination of Sigmoid and Softmax loss, which solves the multi-label in the same attribute problem and multi-attribute identification problem at the same time.
(3) Aiming at the problem of imbalanced samples in data samples, a dynamic weight in the loss function method has been proposed, which can adaptively adjust the weight proportion of the positive and negative in the data samples.

2. Methodology

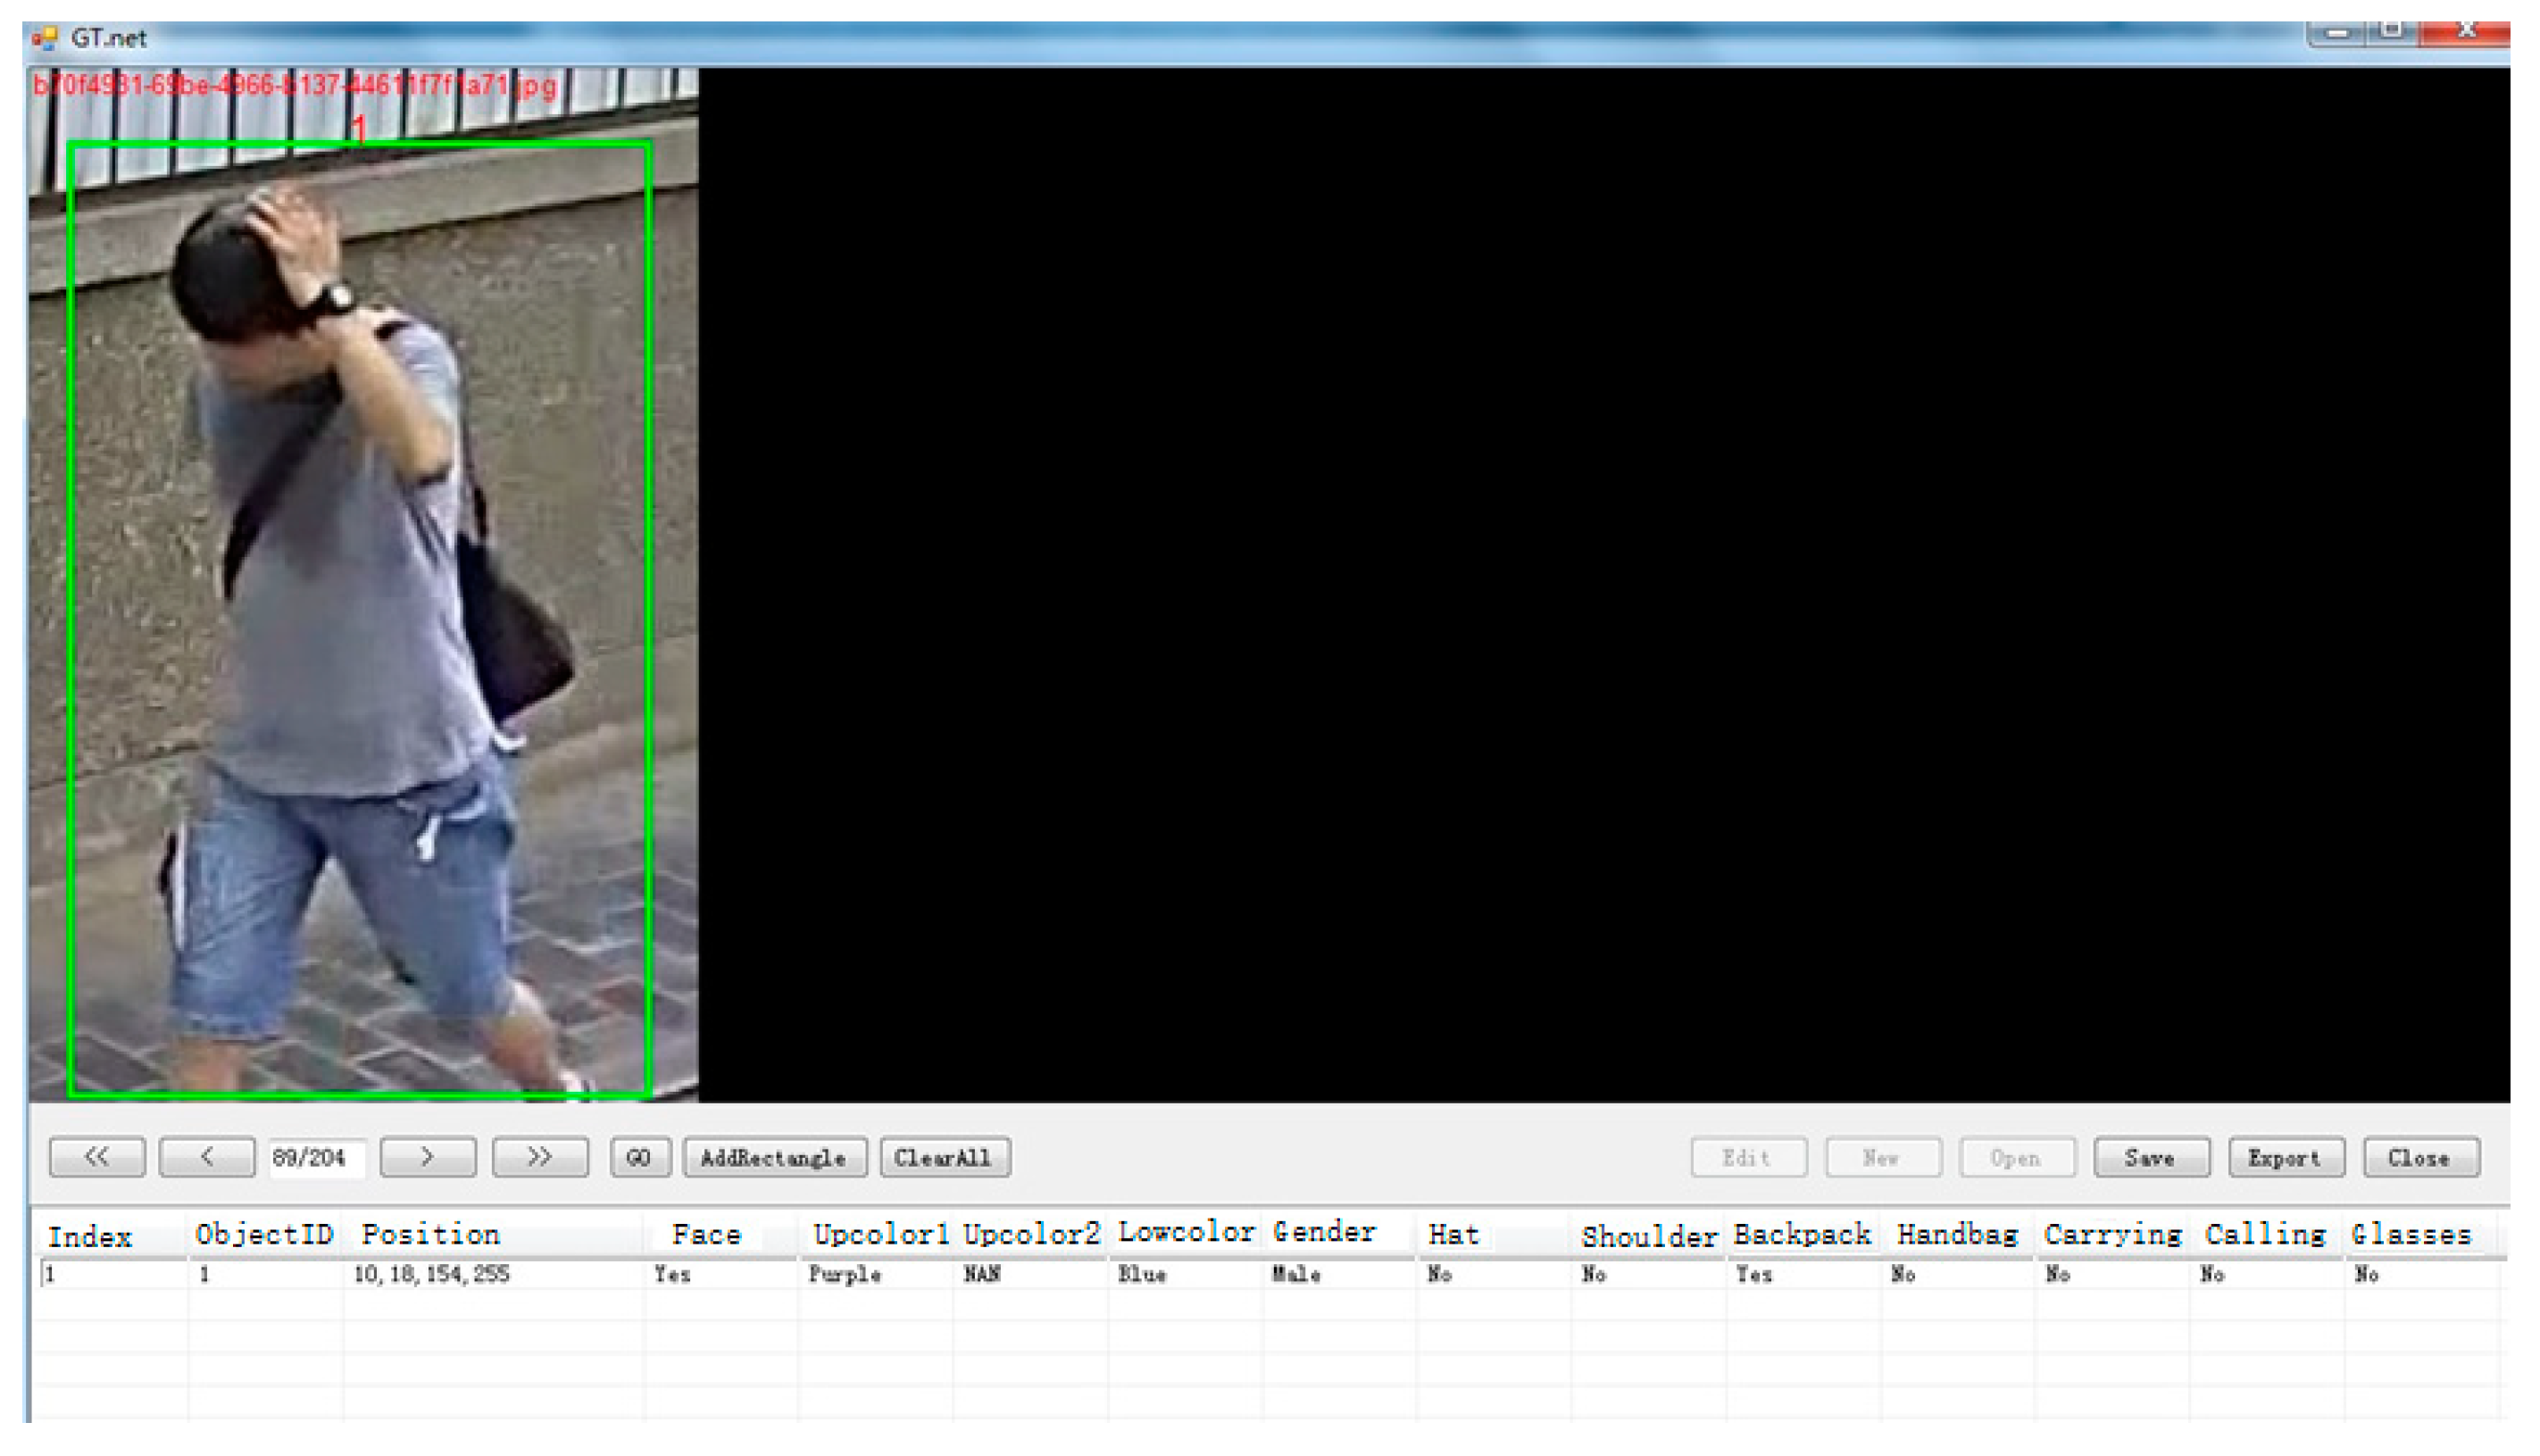
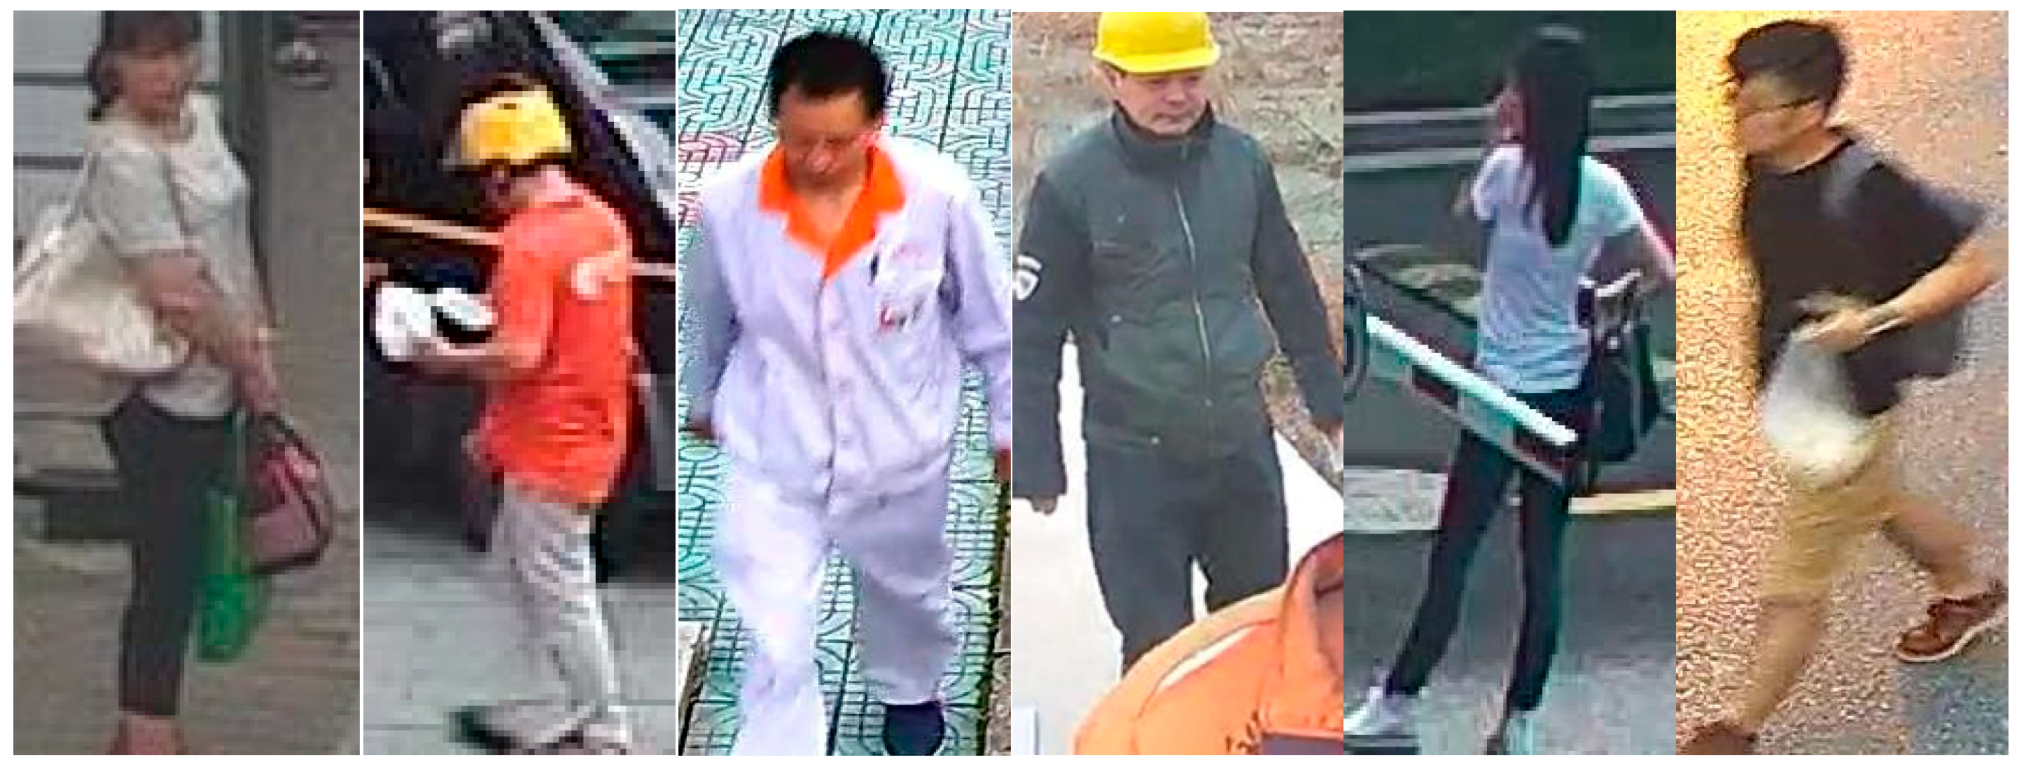
2.1. Pedestrian Attributes Dataset Construction

Common pedestrian attributes recognition datasets include PRID (400 images) [16], GRID (500 images) [17], APiS dataset (3661 images) [18], VIPeR dataset (1264 images) [19] (annotated by Layne et al. [6]), PETA dataset (19,000 images), RAP dataset (41,585 images) and so on. Among them, PRID, GRID and APiS datasets are outdoor scenes; the PETA dataset is indoor and outdoor mixed scenes, including 8705 persons, containing 10 datasets such as the VIPeR dataset and 3DpeS and so on. RAP dataset is a dataset of indoor scenes, which is the largest pedestrian attributes dataset, containing 72 attributes, different perspectives, different lighting, and different body parts information. Several pedestrian samples are shown in Figure 1; the several corresponding pedestrian attributes are presented in Table 1. Each pedestrian attribute represents pedestrian semantic information. In order to meet the application scenarios in complex scenes, the dataset needs both indoor and outdoor scenes. While the labels of the existing datasets are different, we cannot directly merge existing pedestrian attribute datasets of indoor and outdoor. Besides, the labels of existing datasets only have two values, that is, the datasets are used for binary classification. However, a multi-classification problem is more challenging and practical. Moreover, the image number of the PETA dataset is not large enough. Thus, we add a large number of samples which are selected from Internet and video surveillance images based on the RAP dataset. In these selected images, the spatial positions of different pedestrians are different, and the resolutions of pedestrian images are different. Then we select the high degree of attention eleven attributes labels (each label corresponds to a semantic attribute), and a new dataset with more information is created for pedestrian attribute recognition.
In this paper, we use the ground truth creation tool interface shown in Figure 2 to make the labels. Firstly, we input a sample of pedestrian images, and crop out the pedestrian part. Then, we mark each attribute of the pedestrian part separately. The attributes, the value of each attribute label, and the number of samples of each attribute in the dataset are shown in Table 2. Different from the attribute labels shown in Table 1, the dataset labels made in this paper contain multi-label and multi-attribute pedestrian attributes. For example, 11 kinds of color are included in the tops and underwear color attributes, and the label value from 0 to 10 represents a different color, respectively. In order to describe the attributes of a coat better, the coat attribute is divided into Upcolor 1 and Upcolor 2 in our dataset. For those color attributes, the positive or negative samples are not represented, and the default number of samples in each color is similar.
In this paper, we name our dataset as NEU-dataset. The dataset contains a total of 25, 893 pedestrian images, these images have large variation in background, illumination and viewpoints, and the dataset contains a total of 11 attributes, of which three of them have more than two labels.

2.2. Proposed Method

In the more common networks, each attribute is usually considered as independent. In fact, there is a certain correlation between every attribute. As shown in Figure 1 and Table 1, it is obvious that there are several related attributes in an image, such as gender, the color of the clothes, and the type of backpack. In order to solve the problem of the relevance of each attribute in the same image, Ref. [9] proposed a DeepMAR network model, which learns all the attributes in the same image at the same time and makes full use of the correlation between each attribute. Different from the method of attribute classification for each attribute, we improve on the DeepMAR network model and propose a multi-attribute and multi-label network model. The pedestrian attributes recognition network model is shown in Figure 3.
The attributes recognition network is shown in Figure 3. The proposed network model includes convolutional layers, max pooling layers, norm layers, a fully connected layer, and the ReLU activation function. For the input image of the network, the features of the image can be extracted by ConvNet. The ConvNet is mainly composed of convolution and pooling operation, e.g., Alexnet [20], VGG-16 [21] and ResNet [22]. Then the feature maps extracted by ConvNet are connected using Fc7 (fully connected layer) to generate a high-demission feature vector. Next, low-demission feature vectors for two-class and multi-class classification can be generated by 1*1 convolution. In order to prevent over-fitting, the Dropout method is used in the fully connected layer. Finally, the two-class attributes and multi-class attributes can be predicted using the Sigmoid function and Softmax function, respectively. The loss of the Sigmoid function and Softmax function are joint for the network model training.
In the proposed network, we use the convolutional network model based on the VGG-16 model [21]; the ConvNet in Figure 3 is the VGG-16 model.
For the data that contains N pedestrian images, each image has K pedestrian attributes, and the maximum value of each single attribute label is L. Then a pedestrian image xi (i = 1, 2, … N) in the data, the corresponding label to the l-th attribute is yil (l = 1,2, … K), and the value of the label yil∈{0,1, …, L}.
In the whole network, m represents the index number of the layer. The output of xi at the m-th layer is as follows:
f ( m ) ( x i ) = h ( m ) = ( W ( m ) h ( m 1 ) + b ( m ) ) p ( m )
where W ( m ) and b ( m ) are the weight matrix and bias of the parameters in the m-th layer. And ( · ) is the activation function.

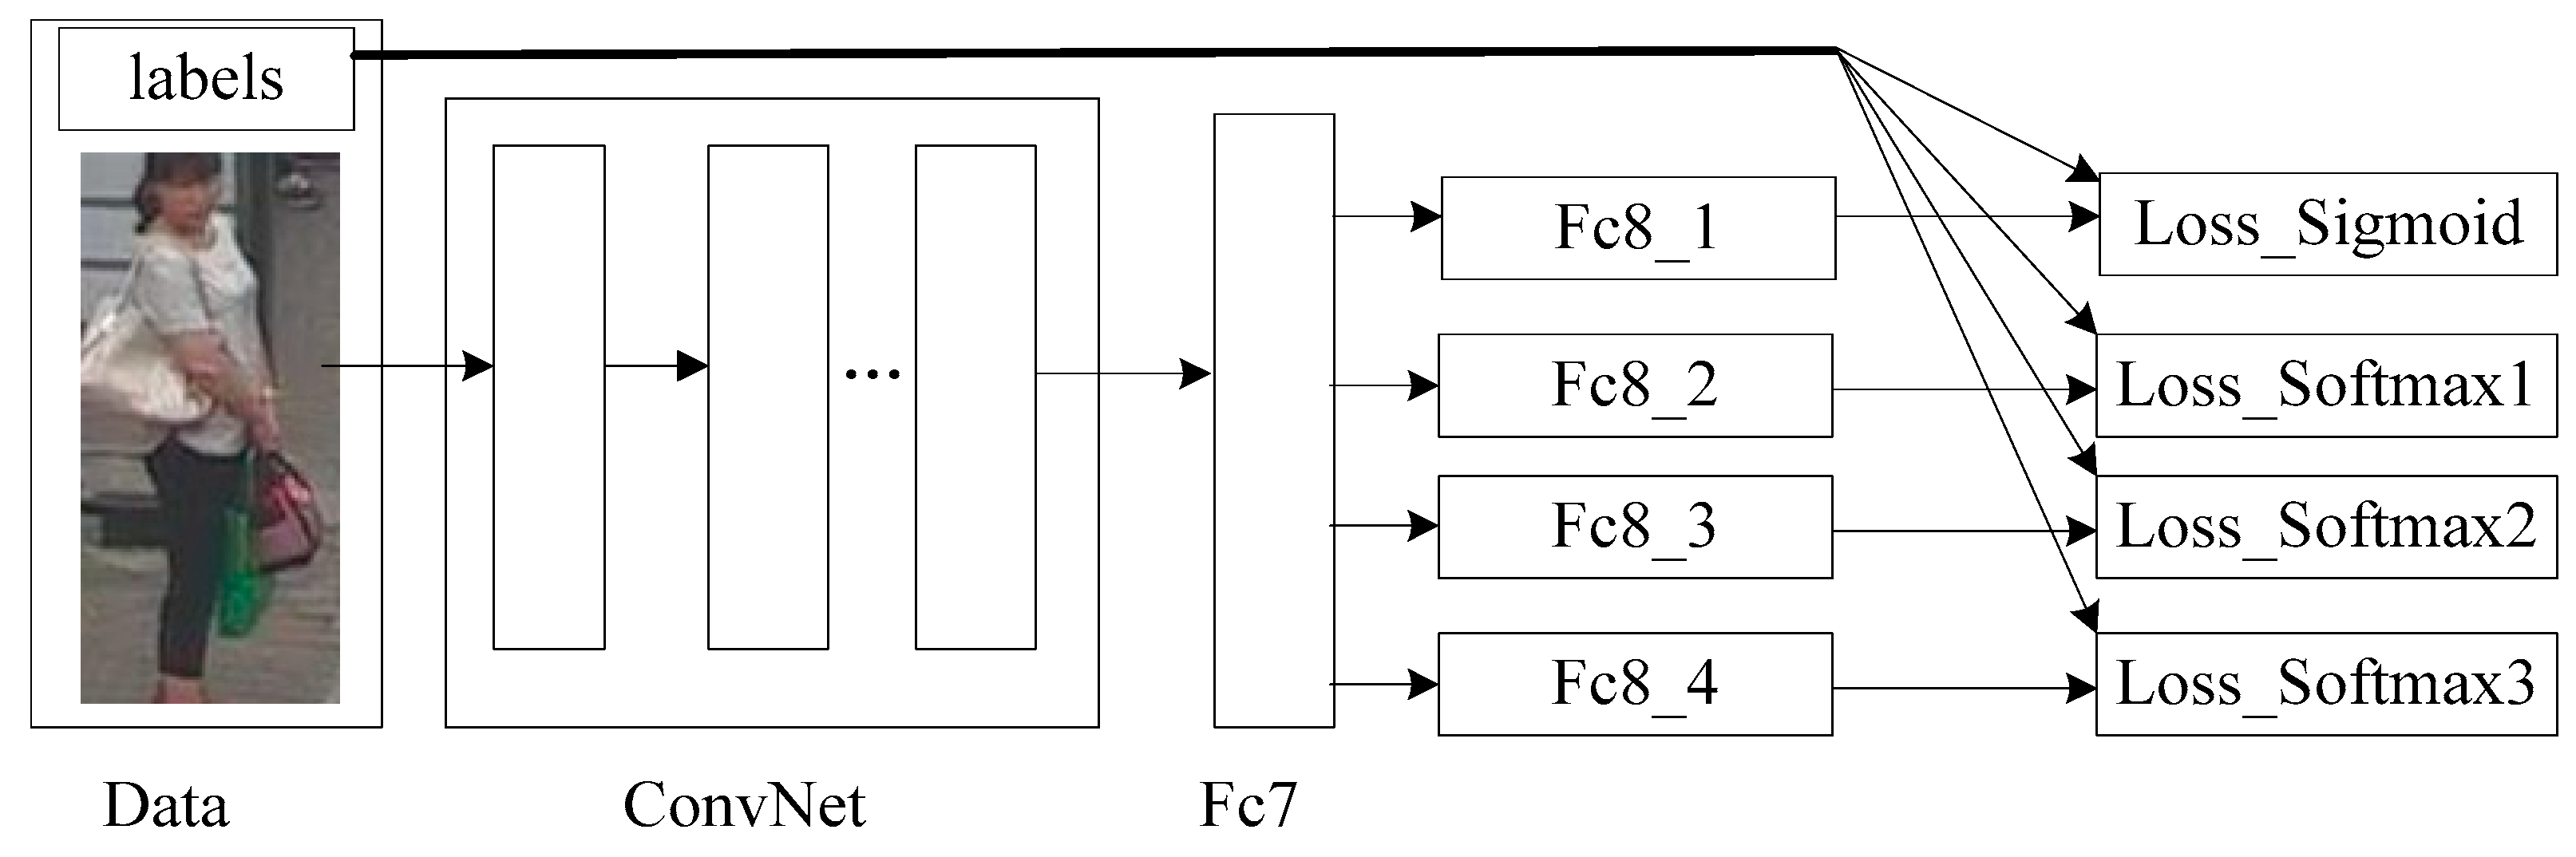
2.2.1. Joint Loss Function

In the DeepMAR network model, the loss function considers all the attributes at the same time, and the Sigmoid cross entropy loss is used. The function expression is:
L o s s 1 = 1 / N i = 1 N l = 1 K ( y i l l o g ( p i l ^ ) ) + ( 1 y i l ) log ( 1 p i l ^ ) )
p i l ^ = 1 / ( 1 + exp ( f ( m ) ( x i ) ) )
Among them, p i l ^ is the output probability value of the l-th attribute of sample xi.
Generally, the color attributes of clothes have many kinds of categories; if only two categories have been used, conflicts of clothes’ color attributes recognition will be caused. Because each attribute in our dataset has labeled not just two values of 0 and 1, some attributes have multi-label problems. However, Softmax loss can solve the multi-label problem well. Therefore, we improved the above loss function and proposed a cross entropy loss function which is combined with Sigmoid and Softmax. Loss function expression is:
L o s s m i x = L o s s 1 + L o s s 2
L o s s 2 = L + 1 y i l ln a i
a i = e z i k e z k ,       k = 0 , 1 , 2 , L
where k is the neuron corresponding to the input image label, and z i is the input of the neuron.

2.2.2. Dynamic Weights for Joint Loss Function

Due to the combined use of all the attributes of the same image, the dataset poses the problem of positive and negative sample imbalance as shown in Table 2. For example, the positive and negative samples of the Hat attribute and Calling attribute have more differences in quantity. The imbalance of positive and negative samples will skew the training results toward the one with the larger number of samples. That will have a huge impact on the recognition effect. In order to solve the problem of sample imbalance, for the whole samples, the model of DeepMAR statistics has been made, and the model weights the samples to balance the samples. In order to make algorithm weights suitable for different datasets, the positive and negative sample weights are set as dynamic parameters, and dynamic parameters are used to replace fixed parameters. Based on the formulas (2), (4) and the DeepMAR model, we improve the loss function and propose a dynamic sample weight method. In the forward transmission, the number of positive and negative samples that have only two categories in each batch. The predicted values of the samples are calculated according to formula (9). When j = b, that is, all the batch after the forward transfer, the positive sample ratio of the entire sample is calculated, then the positive sample ratio is put into the Gaussian function to obtain the sample weight. The improved Loss function expression is:
L o s s = 1 / N i = 1 N l = 1 K w l ( y i l l o g ( p i l ^ ) ) + ( 1 y i l ) log ( 1 p i l ^ ) ) + L o s s 2
w l = { e x p ( ( 1 p l ) / σ 2   ) y l = 1 e x p ( p l / σ 2   ) y l = 0
p l j = j ( i = 1 B 1 { y ( i + j · B ) l = 1 } ) / B                   j 1
p l = p l b , b = m a x { j }
where B is the number of samples in the j-th batch. In addition, plj is the positive sample of the l-th attribute in the j-th batch. 1 { y i l = 1 } indicates that we count 1 when the l-th attribute label value of the i-th sample is 1. In this paper, the weight is set to a Gaussian function, where σ is the adjustment parameter; in the experiment of this paper, σ = 0.01. In addition, we use the modified Loss function as the final Loss function.
By combining (5) and (7), the proposed network can be solved as the following optimization problem:
min f ( m ) L o s s = i = 1 N l = 1 K w l ( y i l l o g ( p i l ^ ) ) + ( 1 y i l ) log ( 1 p i l ^ ) ) N L + 1 y i l ln a i

2.2.3. Optimization

To optimize (11), we employ the stochastic sub-gradient descent method to obtain the parameters W ( m ) and b ( m ) . Then, they can be updated by using the gradient descent algorithm as follows until convergence:
W ( m ) = W ( m ) λ L o s s W ( m )
b ( m ) = b ( m ) λ L o s s b ( m )
where λ is the learning rate.
To optimize all the network parameters, Adam algorithm is selected in this paper to optimize the proposed network. Moreover, in order to normalize the local input regions, make the supervised learning algorithm fast, and increase network performance, we add LRN (Local Response Normalization) after each convolution layer in the network.

3. Results

In this section, the experiments on two datasets are implemented for attribute recognition. We briefly introduce the datasets, experimental environment, metrics, and results of the proposed method and comparison methods. The experimental results empirically validate the effectiveness of the proposed method.

3.1. Datasets

In order to verify the effectiveness of the proposed algorithm, we experiment on two datasets, i.e., the proposed NEU-dataset and RAP datasets. The NEU-dataset is mainly divided into three parts, that is, randomly selected 20,000 images in the dataset as the training samples, a selected 2707 images for verification, and the remaining 3086 images as the testing sample. In the RAP datasets, 75% of the total images are randomly selected as training samples and the rest of the images are test samples. In the data training and testing, we resize the image into 256 * 256 and then crop out its 227 * 227 region to put into the network.

3.2. Implementation

Our method is based on Caffe framework to experiment. The experimental environment is in the Windows 7 64bit operating system environment and the processor is Intel (TM) i5-4660 CPU @ 3.20 GHz, memory is 8 GB, GPU: NVIDIA GeForce GTX TITAN X.
To expedite the proposed method and obtain a better approximation of the network parameters, all network layers in the proposed algorithm are fine-tuned based on the VGG-16 Caffe model. It has been widely implemented on deep networks, which can shorten the learning time. The network is optimized by Adam algorithm. The initial learning rate used is 0.0001 and weight decay is 0.005 in this experiment. Besides, the dropout ratio is 0.5.

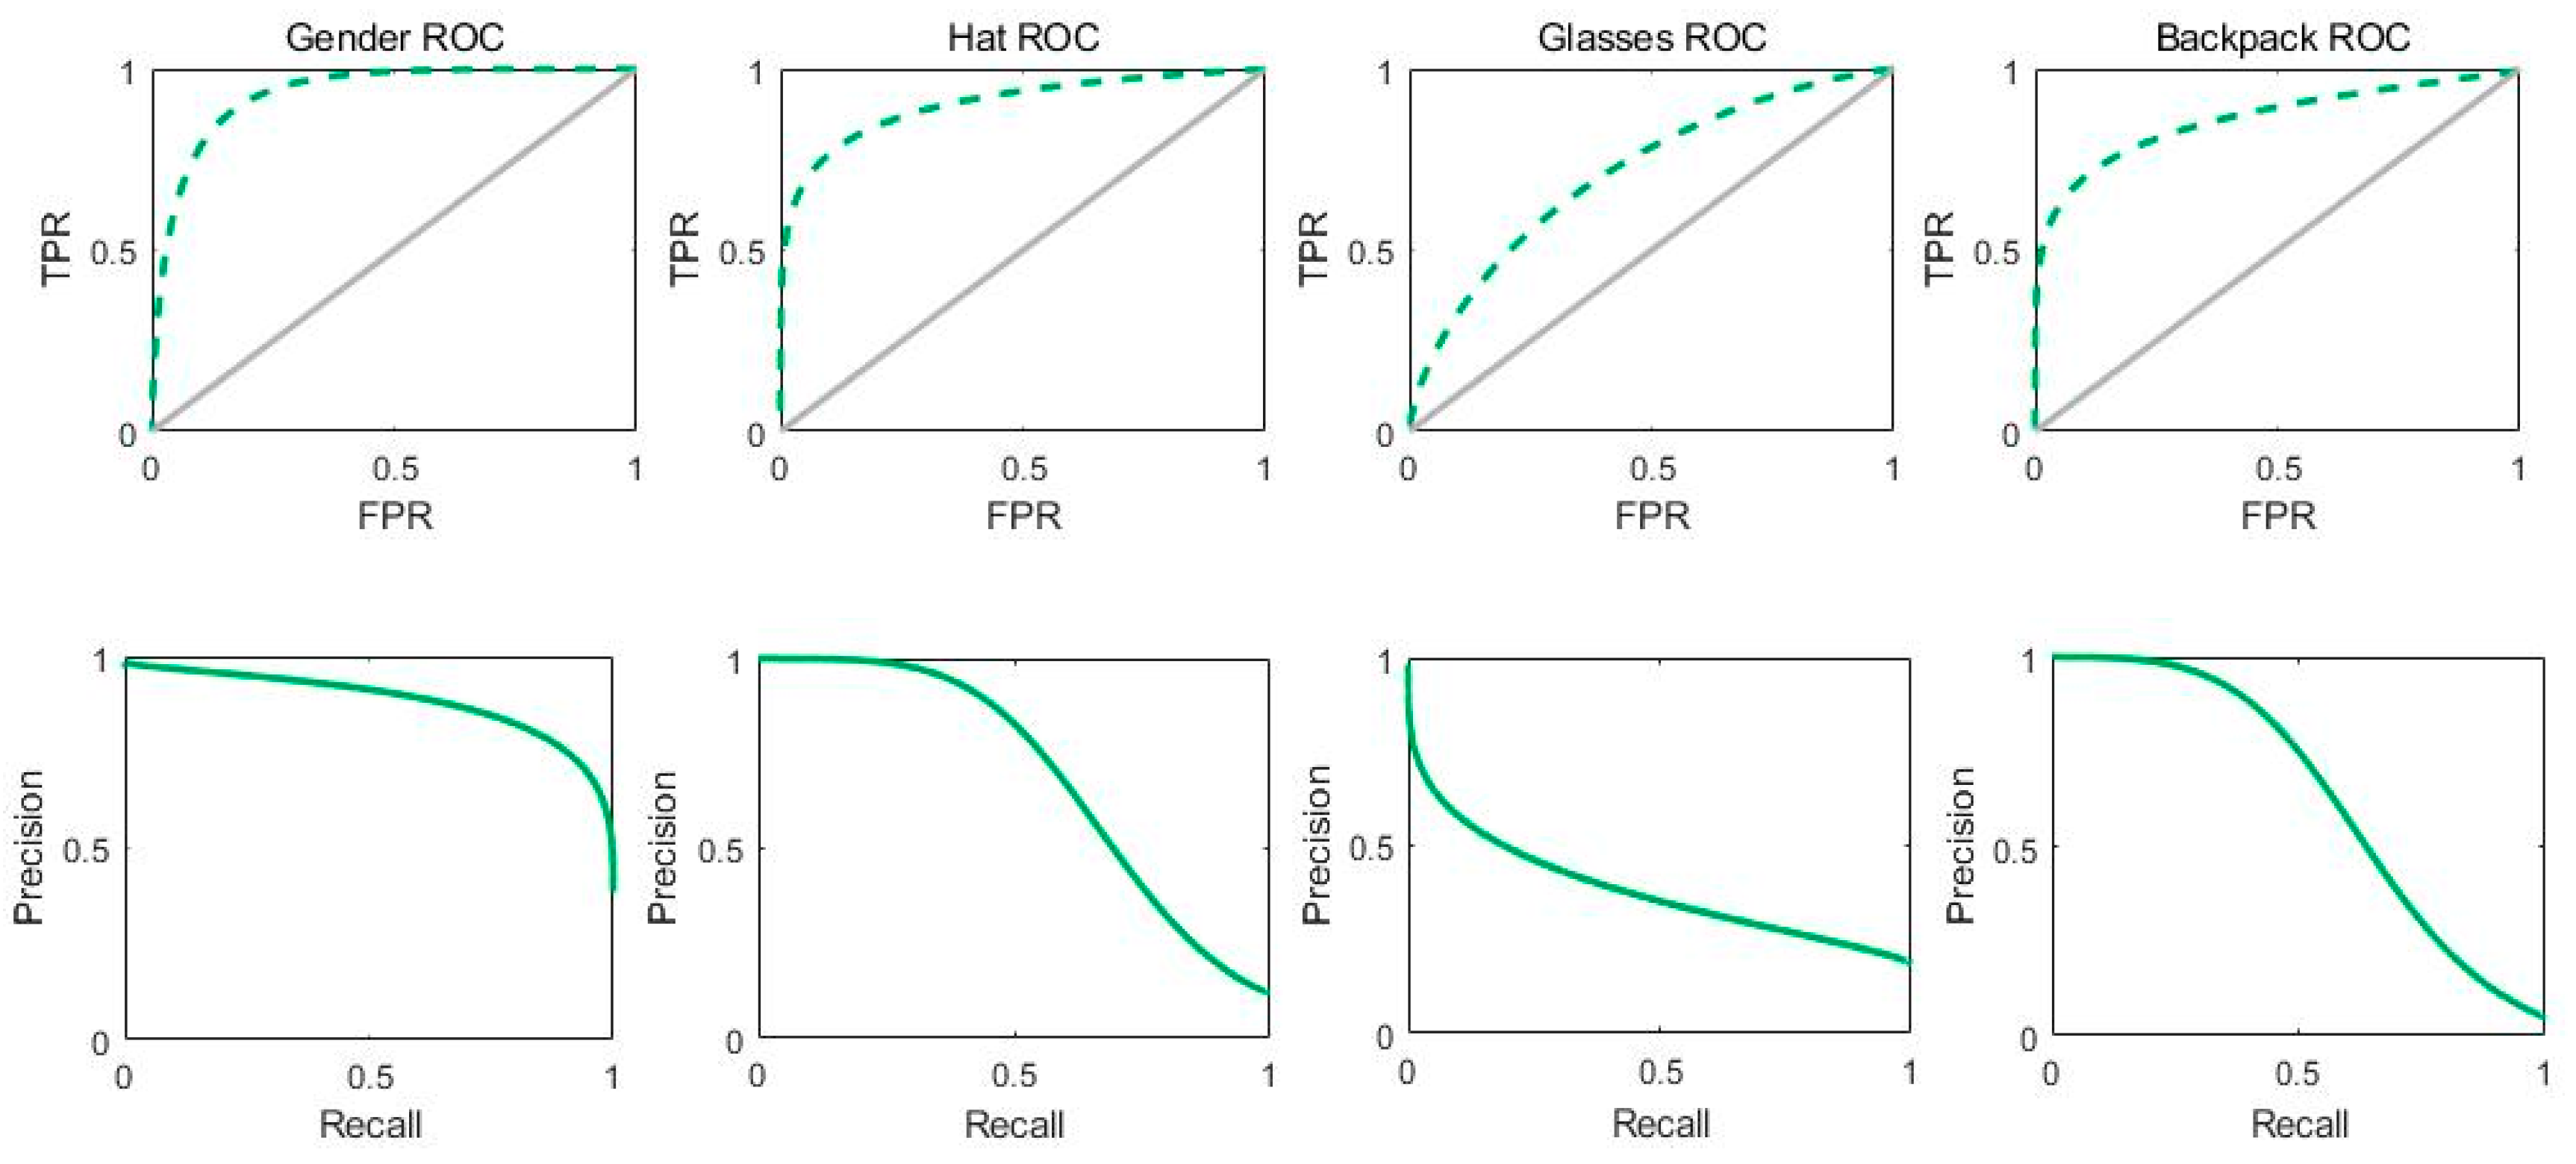
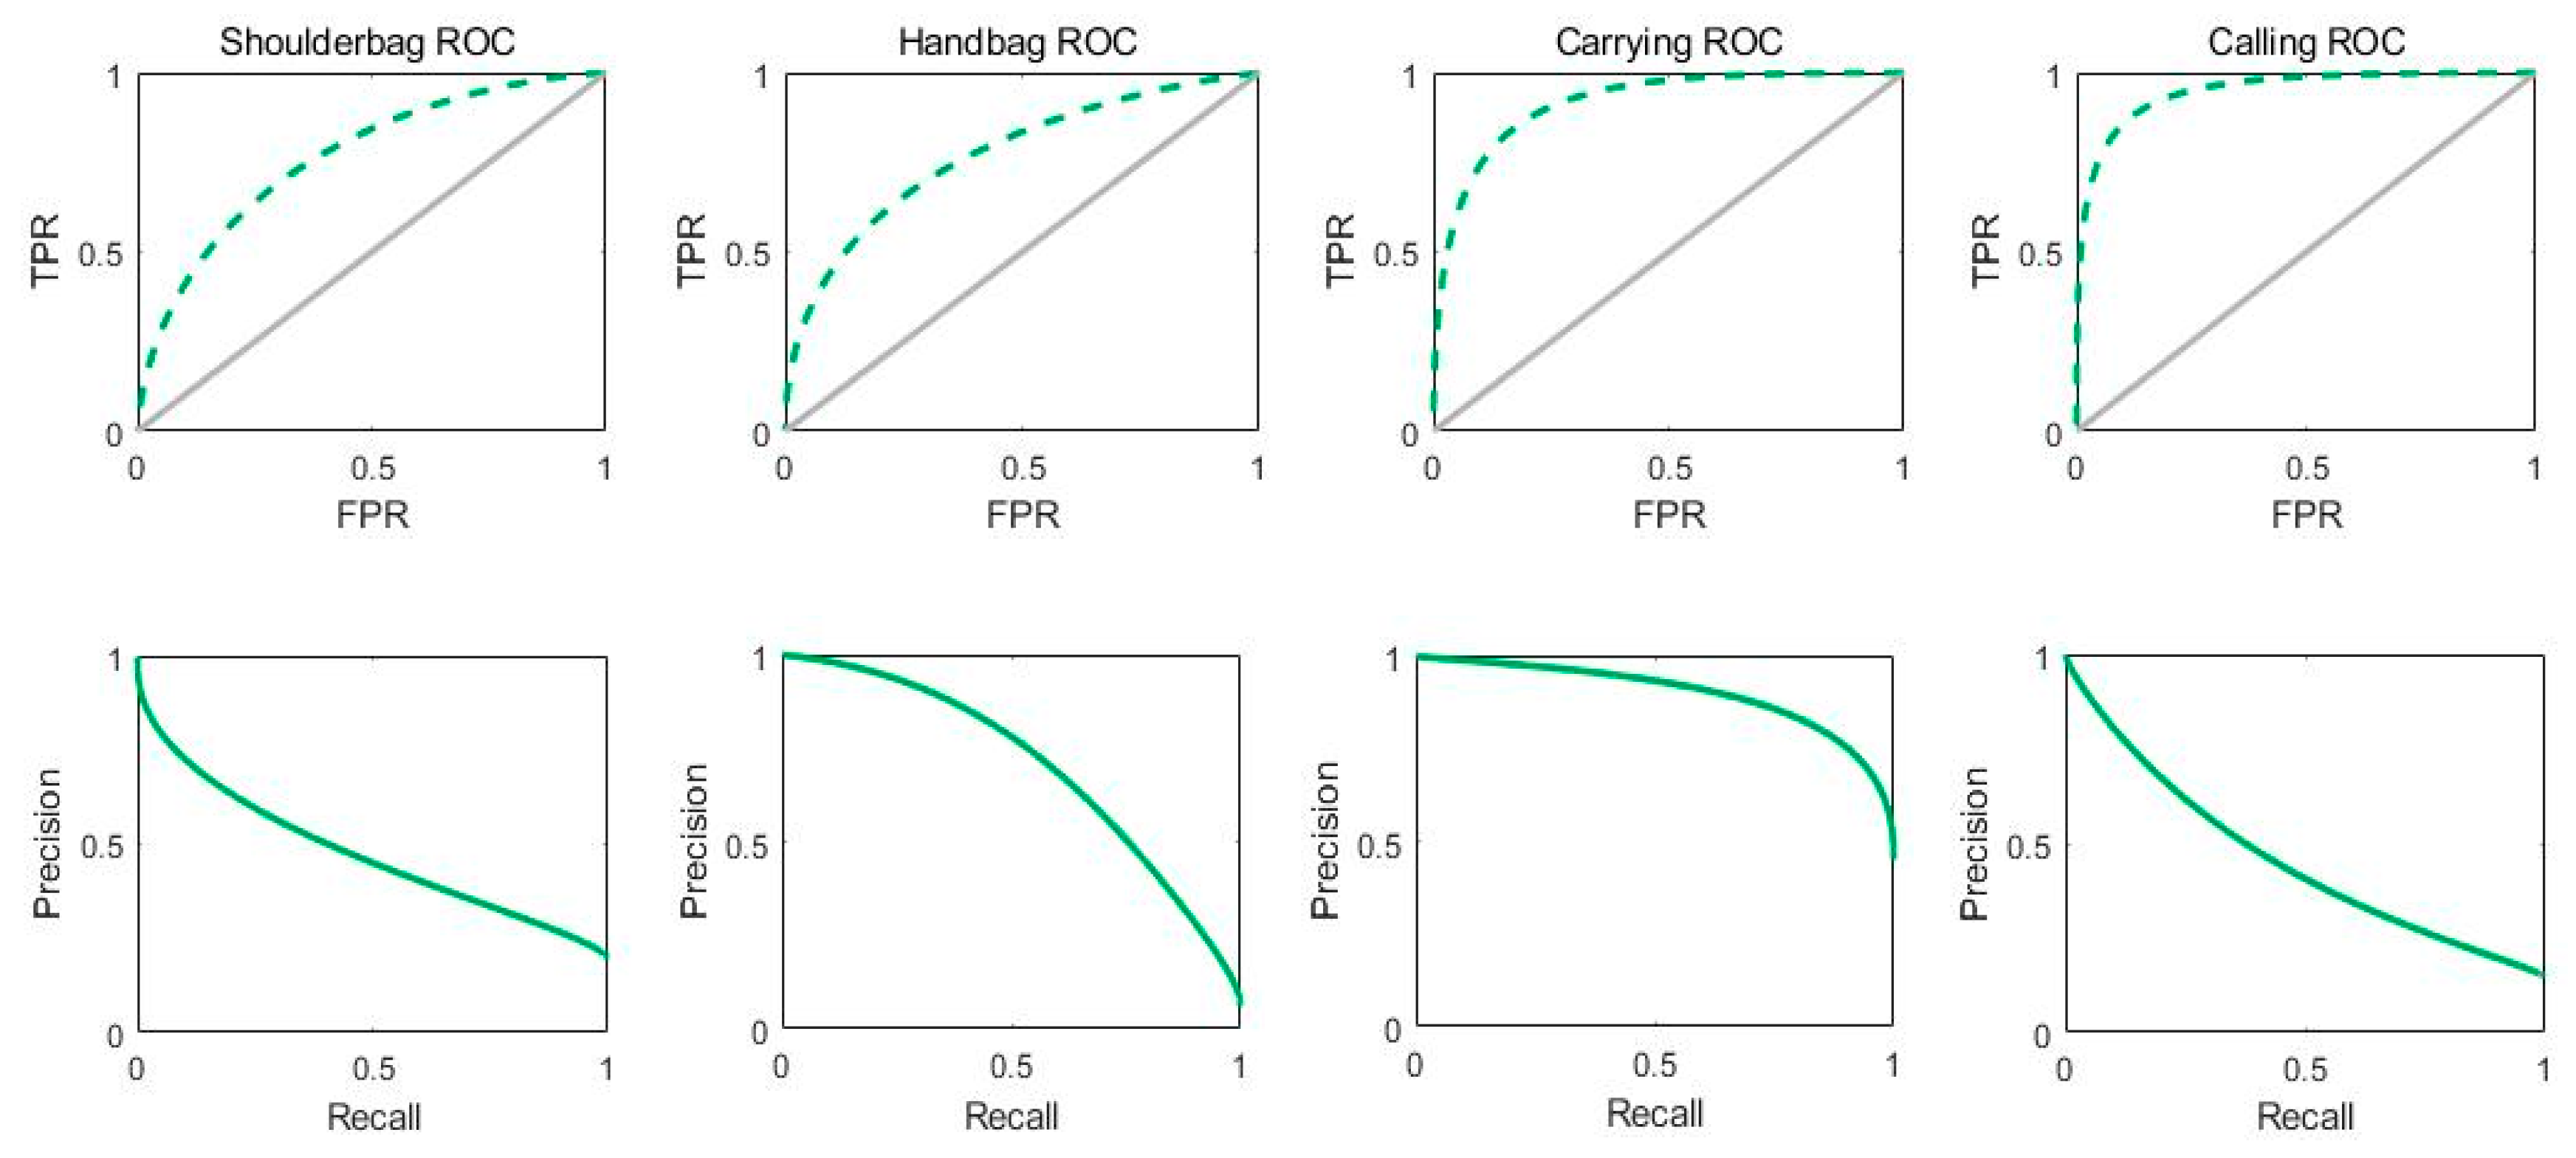
3.3. Evaluation Metrics

The NEU-dataset in our experiment is evaluated basically. It mainly includes Average accuracy, Positive sample recognition rate (PRR), Negative sample recognition rate (NRR) and so on for each attribute on the dataset. In addition, we use one label-based metric (mA) and four example-based metrics: Acc (Accuracy), Prec (Precision), Rec (Recall), and F1. These five indicators evaluate the algorithm of attribute recognition [4,23,24], and the calculation of these five indicators is as follows:
m A = 1 2 K i = 1 K ( | T P i | | P i | + | T N i | | N i | )
A c c = 1 N i = 1 N ( | Y i f ( x i ) | | Y i f ( x i ) | )
P r e c = 1 N i = 1 N ( | Y i f ( x i ) | | f ( x i ) | )
R e c = 1 N i = 1 N ( | Y i f ( x i ) | | Y i | )
F 1 = 2 · P r e c · R e c P r e c + R e c
where K is the number of attributes, | T P i | and | T N i | are the number of positive samples and number of negative samples correctly predicted respectively for the ith attribute. | P i | and | N i | are the number of positive samples and negative samples in the ith attribute of ground truth. N is the number of samples. Y i is the positive sample of the ith attribute in ground truth, and f ( x i ) is the positive sample label of the ith attribute in the predicted result.

3.4. PARNet Experimental Results on NEU-Dataset

The experimental results of the algorithm in the NEU-dataset are shown in Table 3. Due to the three attributes recognition of Upcolor 1, Upcolor 2 and Lowercolor as a multi-label problem, as a result, we only statistics the Acc of three attributes. Besides, ROC and PR curves of different attributes (except the above three attributes) in the NEU-dataset are provided in Figure 4. As shown in Table 3, compared with other attributes, the accuracy of the Hat attribute in our algorithm is relatively high, and the Calling attribute has higher PRR and Recall than other attributes. The Backpack attribute has higher NRR than other attributes and the Carrying attribute Prec and F1 are higher than other attributes. In addition, the color of the coat and the color of underwear are the multi-label situation, and the recognition rate is stated only for the correct recognition situation. The average recognition rate of the three color-related multi-label attributes is 75.54%, which is lower than the overall attribute recognition rate. Therefore, the recognition of multi-label attributes needs to be further improved.

3.5. Comparisons with Related Methods

Considering that there are some attributes with more than two categories for an attribute in the NEU-dataset, the existing algorithms are binary classifications for a certain attribute. Thus, the proposed method is not compared with other algorithms in the NEU-dataset. In order to compare this algorithm with the state-of-the-art algorithms, we used RAP datasets that are large and frequently applied to compare with other algorithms. In Ref. [23], the attribute was selected when the positive examples’ ratio in the dataset was higher than 0.01. To prove the performance of the proposed method, we compared the following methods to the benchmark of the RAP dataset.
SVM and features based methods: Considering each attribute independently, a linear SVM model is trained for each attribute through features ELF, FC6 and FC7, which are used in Reference [23], i.e., ELF-mm, FC7-mm and FC6-mm.
The ACN (Attribute Convolutional Net) [7] method uses the CNN model to learn different attributes and recognize multiple attributes simultaneously with a jointly-trained holistic method.
DeepMAR (Deep learning-based Multi-attribute joint recognition model) [9] method, whose object function for multi-attribute recognition is based on prior knowledge.
M-Net method and HP-Net method [25] method: M-Net is a plain CNN architecture, and the HP-Net method is a multi-attribute recognition with multi-directional attention modules and M-Net.
In this paper, eight attributes (the first eight listed in Table 2) are selected to compute the mA, Acc, Prec, Rec, and F1. In addition, we compare the proposed method with the benchmark of the RAP. The comparison results are shown in Table 4. As shown in Table 4, the proposed algorithm is obviously superior to other algorithms in the mA, Acc and Rec indexes, especially the mA of the proposed algorithm is obviously improved compared with other algorithms. Therefore, the proposed algorithm has certain performance compared with other methods. However, the Prec and F1 indexes of the proposed algorithm are not superior to other algorithms and there is still room for improvement.

4. Conclusions

In this paper, a new pedestrian semantic attributes dataset named NEU-dataset is built, and a new key pedestrian semantic attributes recognition algorithm based on the joint activation function and dynamic weight is proposed. The proposed method improves the DeepMAR method by setting a new loss function. Sigmoid and Softmax loss are combined to solve multi-label problems, and dynamic weight is applied into the loss function to solve the unbalanced samples. The experimental results have shown that our proposed method is effective in pedestrian semantic attributes recognition. In addition, our method has good performance in the NEU-dataset and RAP dataset in the mA, Acc and Rec indexes. In the future, new effective loss functions can be proposed to solve multi-attribute and multi-class problems. For these problems, the structure of the proposed network can also be applied and expanded.
However, for objects occupying very small regions in the image, e.g., the glasses and most regions of objects occluded in the image, e.g., Handbag, the proposed network can extract features of the entire image. The global features are not able to distinguish these attributes represented by a few regions. For these problems, the attention mechanism and multi-level feature extraction methods for fine-grained features and local significant information representation can be added to the network.

Author Contributions

Y.L. designed the methodology, wrote source code, and wrote the original draft. G.T. helped in data analysis, experimental analysis and result comparisons. X.L. helped in project and study design, source code writing, and result analysis. Y.W. helped in data analysis, study design, paper writing, and review & editing. B.Z., and Y.L. helped in data curation, and result analysis.

Funding

This research was funded by National Natural Science Foundation of China, grant number 41801241, and the National High Technology Research and Development Program of China (863 Program) (No. 2012AA041402). The APC was funded by Y.W. and G.T.

Acknowledgments

The authors would like to thank Shanshan Yin in Northeastern University for improving the English of this paper, and also thank Li D. et. al for providing the RAP dataset for academic research. Besides, the authors thank intelligent technology research center of Neusoft for the images capturing and processing.

Conflicts of Interest

The authors declare no conflict of interest. The people with whose images the authors have worked have freely provided these data for academic research use.

References

  1. Li, D.; Zhang, Z.; Chen, X.; Huang, K. A richly annotated pedestrian dataset for person retrieval in real surveillance scenarios. IEEE Trans. Image Process. 2018, 28, 1575–1590. [Google Scholar] [CrossRef] [PubMed]
  2. Wang, J.; Zhu, X.; Gong, S.; Li, W. Attribute recognition by joint recurrent learning of context and correlation. In Proceedings of the IEEE International Conference on Computer Vision, Venice, Italy, 22–29 October 2017. [Google Scholar]
  3. Li, X.; Li, L.; Flohr, F.; Wang, J.; Xiong, H.; Bernhard, M.; Pan, S.; Gavrila, D.M.; Li, K. A unified framework for concurrent pedestrian and cyclist detection. IEEE Trans. Intell. Transp. Syst. 2017, 18, 269–281. [Google Scholar] [CrossRef]
  4. Deng, Y.; Luo, P.; Loy, C.C.; Tang, X. Pedestrian attribute recognition at far distance. In Proceedings of the 22nd ACM International Conference on Multimedia, Orlando, FL, USA, 3–7 November 2014. [Google Scholar]
  5. Layne, R.; Hospedales, T.M.; Gong, S. Towards person identification and re-identification with attributes. In Proceedings of the Computer Vision—ECCV 2012. Workshops and Demonstrations, Florence, Italy, 7–13 October 2012. [Google Scholar]
  6. Layne, R.; Hospedales, T.M.; Gong, S.; Mary, Q. Person re-identification by attributes. In Proceedings of the British Machine Vision Conference, Surrey, UK, 3–7 September 2012. [Google Scholar]
  7. Sudowe, P.; Spitzer, H.; Leibe, B. Person attribute recognition with a jointly-trained holistic CNN model. In Proceedings of the IEEE International Conference on Computer Vision, Santiago, Chile, 7–13 December 2015; pp. 87–95. [Google Scholar]
  8. Tian, Y.; Luo, P.; Wang, X.; Tang, X. Pedestrian detection aided by deep learning semantic tasks. In Proceedings of the 2015 IEEE Conference on Computer Vision and Pattern Recognition (CVPR), Boston, MA, USA, 7–12 June 2015; pp. 5079–5087. [Google Scholar] [CrossRef]
  9. Li, D.; Chen, X.; Huang, K. Multi-attribute learning for pedestrian attribute recognition in surveillance scenarios. In Proceedings of the IAPR Asian Conference on Pattern Recognition (ACPR), Kuala Lumpur, Malaysia, 3–6 November 2015. [Google Scholar]
  10. Georgia, G.; Ross, G.; Jitendra, M. Actions and attributes from wholes and parts. In Proceedings of the International Conference of Computer Vision (ICCV), Santiago, Chile, 13–16 December 2015. [Google Scholar]
  11. Yu, K.; Leng, B.; Zhang, Z.; Li, D.; Huang, K. Weakly-supervised learning of mid-level features for pedestrian attribute recognition and localization. arXiv 2016, arXiv:1611.05603. [Google Scholar]
  12. Li, Y.; Huang, C.; Loy, C.C.; Tang, X. Human attribute recognition by deep hierarchical contexts. In Computer Vision—ECCV 2016; Springer International Publishing: Cham, Switzerland, 2016; pp. 684–700. [Google Scholar]
  13. Sarafianos, N.; Xu, X.; Kakadiaris, I.A. Deep imbalanced attribute classification using visual attention aggregation. arXiv 2018, arXiv:1807.03903. [Google Scholar]
  14. Li, D.; Chen, X.; Zhang, Z.; Huang, K. Pose guided deep model for pedestrian attribute recognition in surveillance scenarios. In Proceedings of the IEEE International Conference on Multimedia and Expo (ICME 2018), San Diego, CA, USA, 23–27 July 2018. [Google Scholar]
  15. Hong, R.; Cheng, W.H.; Yamasaki, T.; Wang, M.; Ngo, C.W. Advances in multimedia information processing—PCM 2018. In Lecture Notes in Computer Science, Proceedings of the 19th Pacific-Rim Conference on Multimedia, Hefei, China, 21–22 September 2018; Part II Pedestrian attributes recognition in surveillance scenarios with hierarchical multi-task CNN models; Springer: Cham, Switzerland, 2018; Chapter 70; Volume 11165, pp. 758–767. [Google Scholar] [CrossRef]
  16. Hirzer, M.; Beleznai, C.; Roth, P.M.; Bischof, H. Person re-identification by descriptive and discriminative classification. In Image Analysis; Springer: Cham, Switzerland, 2011; pp. 91–102. [Google Scholar]
  17. Liu, C.; Gong, S.; Loy, C.C.; Lin, X. Person re-identification: What features are important. In Proceedings of the Computer Vision—ECCV 2012. Workshops and Demonstrations, Florence, Italy, 7–13 October 2012. [Google Scholar]
  18. Zhu, J.; Liao, S.; Lei, Z.; Yi, D.; Li, S.Z. Pedestrian attribute classification in surveillance: Database and evaluation. In Proceedings of the IEEE International Conference on Computer Vision, Sydney, Australia, 1–8 December 2013. [Google Scholar]
  19. Gray, D.; Tao, H. Viewpoint invariant pedestrian recognition with an ensemble of localized features. In Proceedings of the European Conference on Computer Vision, Marseille, France, 12–18 October 2008. [Google Scholar]
  20. Krizhevsky, A.; Sutskever, I.; Hinton, G.E. Imagenet classification with deep convolutional neural networks. In Proceedings of the Neural Information Processing Systems Conference, Lake Tahoe, NV, USA, 3–6 December 2012. [Google Scholar]
  21. Simonyan, K.; Zisserman, A. Very deep convolutional networks for large-scale image recognition. arXiv 2014, arXiv:1409.1556. [Google Scholar]
  22. He, K.; Zhang, X.; Ren, S.; Sun, J. Deep residual learning for image recognition. In Proceedings of the IEEE Conference on Computer Vision and Pattern Recognition (CVPR), Las Vegas, NV, USA, 26 June–1 July 2016; pp. 770–778. [Google Scholar]
  23. Li, D.; Zhang, Z.; Chen, X.; Ling, H.; Huang, K. A richly annotated dataset for pedestrian attribute recognition. arXiv 2016, arXiv:1603.07054. [Google Scholar]
  24. Zhang, M.L.; Zhou, Z.H. A review on multi-label learning algorithms. IEEE Trans. Knowl. Data Eng. 2014, 26, 1819–1837. [Google Scholar] [CrossRef]
  25. Liu, X.; Zhao, H.; Tian, M.; Sheng, L.; Shao, J.; Yi, S.; Yan, J.; Wang, X. HydraPlus-net: Attentive deep features for pedestrian analysis. In Proceedings of the IEEE International Conference on Computer Vision, Venice, Italy, 22–29 October 2017; pp. 350–359. [Google Scholar]
Figure 1. Pedestrian property sample diagram.
Applsci 09 02027 g001
Figure 2. Ground truth production tools interface map.
Applsci 09 02027 g002
Figure 3. The proposed attributes recognition network model.
Applsci 09 02027 g003
Figure 4. Different attributes’ ROC and PR curves on NEU-dataset. The first and third rows are ROC curves, and the second and fourth rows are the corresponding PR curves.
Applsci 09 02027 g004aApplsci 09 02027 g004b
Table 1. Several examples of pedestrian attributes labels (The corresponding label of YES is 1 and the corresponding label of NO is 0).
NumberGenderHatUpcolor WhiteUpcolor BlackLowercolor WhiteLowercolor Black
10 (female)01001
21 (male)10010
31 (male)01010
41 (male)10101
50 (female)01001
61 (male)00100
Table 2. NEU-dataset attributes information statistics.
NumberAttributesLabel Value RangeThe Positive Samples NumbersThe Negative Samples Number
1Gender0-110,04815,845
2Hat0-1122124,672
3Glasses0-1455621,337
4Backpack0-1299522,898
5Shoulderbag0-1503020,863
6Handbag0-1348222,411
7Carrying Things0-111,29714,596
8Calling0-1146824,425
9Upcolor 10-10--
10Upcolor 20-10--
11Lowercolor 0-10--
Table 3. Attribute recognition results (%) on NEU-dataset.
AttributesAccPRRNRRmAPrecRecF1
Gender85.2590.4382.00-75.9590.4382.56
Hat90.7075.5191.46-30.6675.5143.62
Glasses72.8172.1672.94-35.5172.1647.60
Backpack89.5371.2391.93-53.6871.2361.23
Shoulderbag74.0479.6172.81-39.3179.6152.63
Handbag78.0270.8679.18-35.4770.8647.28
Carrying84.7787.7782.33-80.1287.7783.77
Calling88.3395.9587.88-31.9995.9647.98
Upcolor 169.95------
Upcolor 277.76------
Lowercolor78.90------
Average80.9278.2381.8175.2347.8480.4458.33
Table 4. Attribute recognition results (%) comparison on RAP dataset. The bold number is the max value on each row except the last row.
MethodsmAAccPrecRecF1
ELF-mm69.9429.2932.8471.1844.95
FC7-mm72.2831.7235.7571.1847.73
FC6-mm73.3233.3737.5773.2349.66
CAN69.6662.6180.1272.2675.98
DeepMAR73.7962.0274.9276.2175.56
M-Net74.4464.9977.8377.8977.86
HP-Net76.1265.3977.3378.7978.05
Our method89.9488.2752.1595.3365.12

