Article

Explanation of Osteoblastic Differentiation of Stem Cells by Photo Biomodulation Using the Resonant Recognition Model

1
AMALNA Consulting, Black Rock, Melbourne, VIC 3193, Australia
2
College of Science, Engineering and Health, RMIT University, Melbourne, VIC 3000, Australia
3
Tithon Biotech Inc., San Diego, CA 92127, USA
*
Author to whom correspondence should be addressed.
Appl. Sci. 2019, 9(10), 1979; https://doi.org/10.3390/app9101979
Submission received: 14 April 2019 / Revised: 28 April 2019 / Accepted: 9 May 2019 / Published: 15 May 2019
(This article belongs to the Special Issue Novel Methods for Investigating Biomolecular Interactions)

Abstract

:

Featured Application

The results of this research can be used in development of improved, cheaper and targeted techniques for differentiation of stem cells into specific tissues using the identified frequencies of electromagnetic radiation.

Abstract

Differentiation of stem cells into different tissues is a promising approach to treat a large number of diseases, as well as for tissue transplantation and repair. It has been shown that parathyroid hormone, similarly to stromal self-derived factor, and the radiation of specific electromagnetic frequencies of blue and green light, can encourage stem cell differentiation into osteoblasts. Here, we analysed parathyroid hormone, its receptor and stromal self-derived factor using the Resonant Recognition Model, which proposes that protein function is based on specific frequencies of electromagnetic radiation within ultra-violet, visible, infra-red and far infra-red light. The purpose of this research is to predict the characteristic frequencies related to parathyroid hormone activities, particularly differentiation of stem cells into osteoblasts. We have found that the most effective wavelength for stem cell differentiation would be 502 nm, which is between 420 nm and 540 nm, already experimentally proven to be effective in stimulating osteoblast differentiation. Thus, we propose that wavelength radiation of 502 nm will be even more efficient for differentiation of stem cells into osteoblasts.

1. Introduction

Proteins are the main biomolecules that perform and control most biological processes in all living cells, tissues and organisms. Proteins exhibit their biological functions through selective interactions with other molecules, which could also be proteins and/or DNA. So far, the rules governing protein ability to selectively interact with other biomolecules have not been completely understood. The protein functions are exhibited through protein interactions and mostly through interactions between proteins and their receptors, which are proteins or complexes of proteins that selectively drive specific biological pathways. Currently, the interactions between proteins and their receptors are investigated mostly using 3D matching between interacting proteins, which is not explicit enough to explain the specificity of these interactions. Experimentally, protein functions and protein/receptor interactions are investigated by a number of techniques, including X-ray, MRI, spectroscopy, etc. However, although all these techniques are very expensive and time consuming, they still are not providing a complete understanding of the selectivity of protein interactions. Thus, there is a need for a theoretical/computational approach based on molecular biophysics that can investigate the specificity of protein/receptor interactions with more accuracy than 3D matching. Here, we used parathyroid hormone as an example to present the ability of the Resonant Recognition Model (RRM), which is a computational model based on molecular biophysics and mathematics, to investigate the specificity of protein functions and protein/receptor recognitions and interactions. The RRM is based on findings that certain periodicities (frequencies) within the distribution of free electron energies along the protein macromolecule are critical for its biological function and protein ability for selective recognitions and interactions.
On the other hand, there is an emerging need to use tissue engineering based on living cells as an alternative to tissue or organ transplantation. There is particular interest to differentiate stem cells into osteoblasts for bone regeneration, bone healing and bone transplantation. Parathyroid hormone (PTH) is involved in the stimulation of bone remodelling and in the induction of differentiation of bone marrow mesenchymal stromal/stem cells by enhancing bone morphogenetic protein signalling [1].
The PTH is the principal regulator of calcium homeostasis in the human body and has been shown to influence and expand the bone marrow stem cell niche with both self-renewal and differentiation. As it has been shown that the population of pluripotent stem cells highly express parathyroid hormone type 1 receptors, it was postulated that parathyroid hormone has similar action as stromal cell-derived factor-1 (SDF-1α), which is crucial for the recruitment of stem cells to a number of diseased organs [2].
Moreover, it has been shown that PhotoBioModulation (PBM) of specific blue and green light wavelengths initiates osteoblastic differentiation of human adipose-derived stem cells [3]. The research described in reference [3] presents the effect of PBM on both proliferation and differentiation of osteogenic stem cells. The effects of four different wavelengths (420 nm, 540 nm, 660 nm and 810 nm) were measured and it has been shown that wavelengths of 420 nm and 540 nm were more efficient in stimulating osteoblast differentiation compared to wavelengths of 660 nm and 810 nm [3].
Here, we hypothesised that stimulation of osteoblast differentiation by specific blue and green light wavelengths is related to activation of proteins involved in osteoblast differentiation like PTH and SDF-1α. For this purpose, we have utilised the RRM model, which proposes that protein activation and function are based on specific wavelengths (frequencies) of electromagnetic radiation within ultra-violet, visible, infra-red and far infra-red light. Thus, by using the RRM, we have analysed the parathyroid hormone, its receptor and stromal self-derived factor with the aim to predict the characteristic wavelengths (frequencies) related to parathyroid hormone activities, particularly differentiation of stem cells into osteoblasts.

2. Methods and Materials

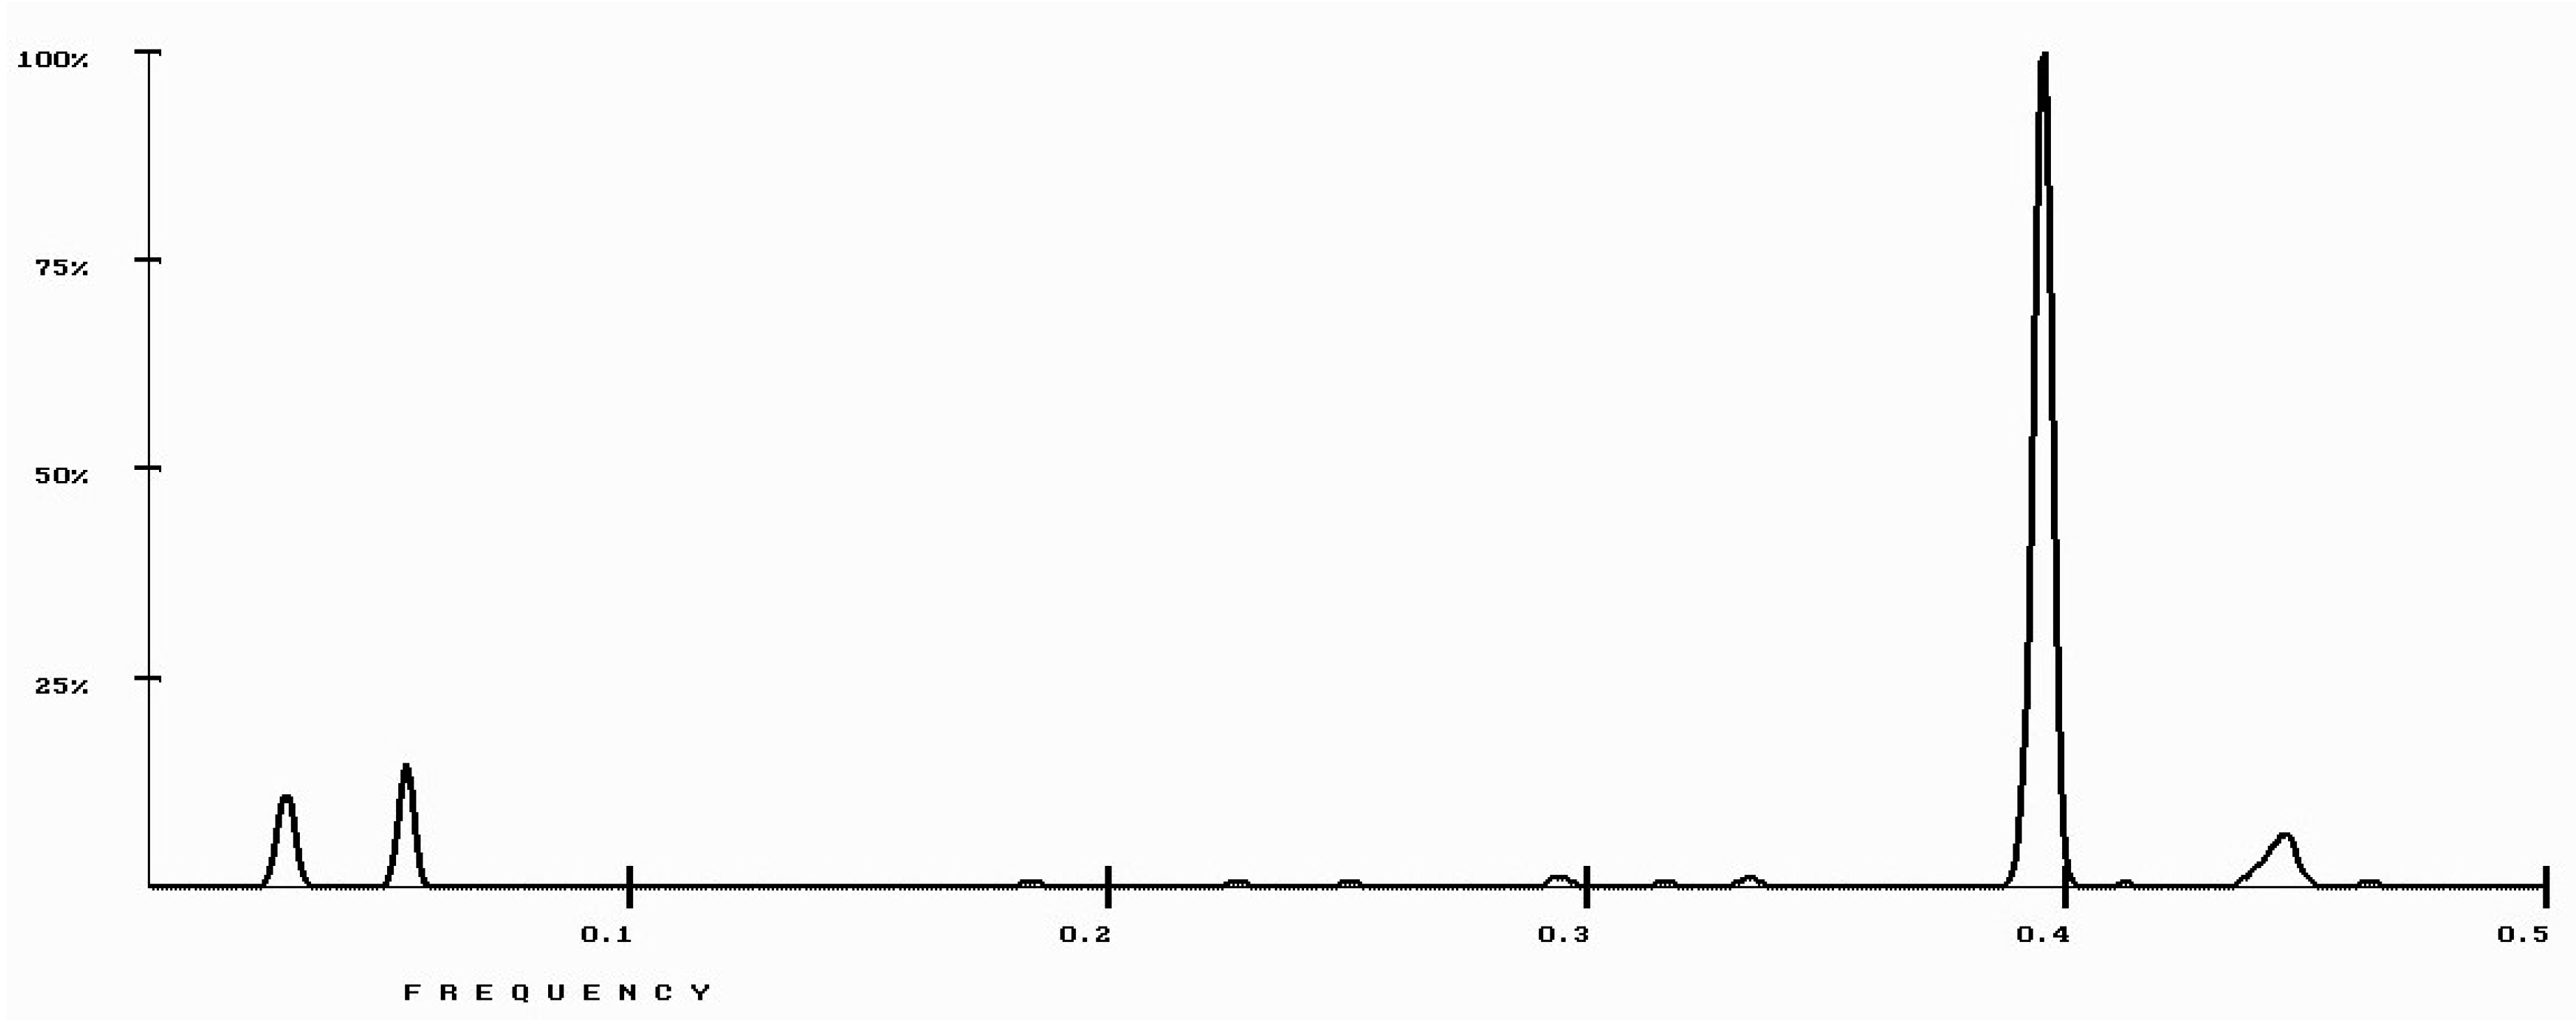
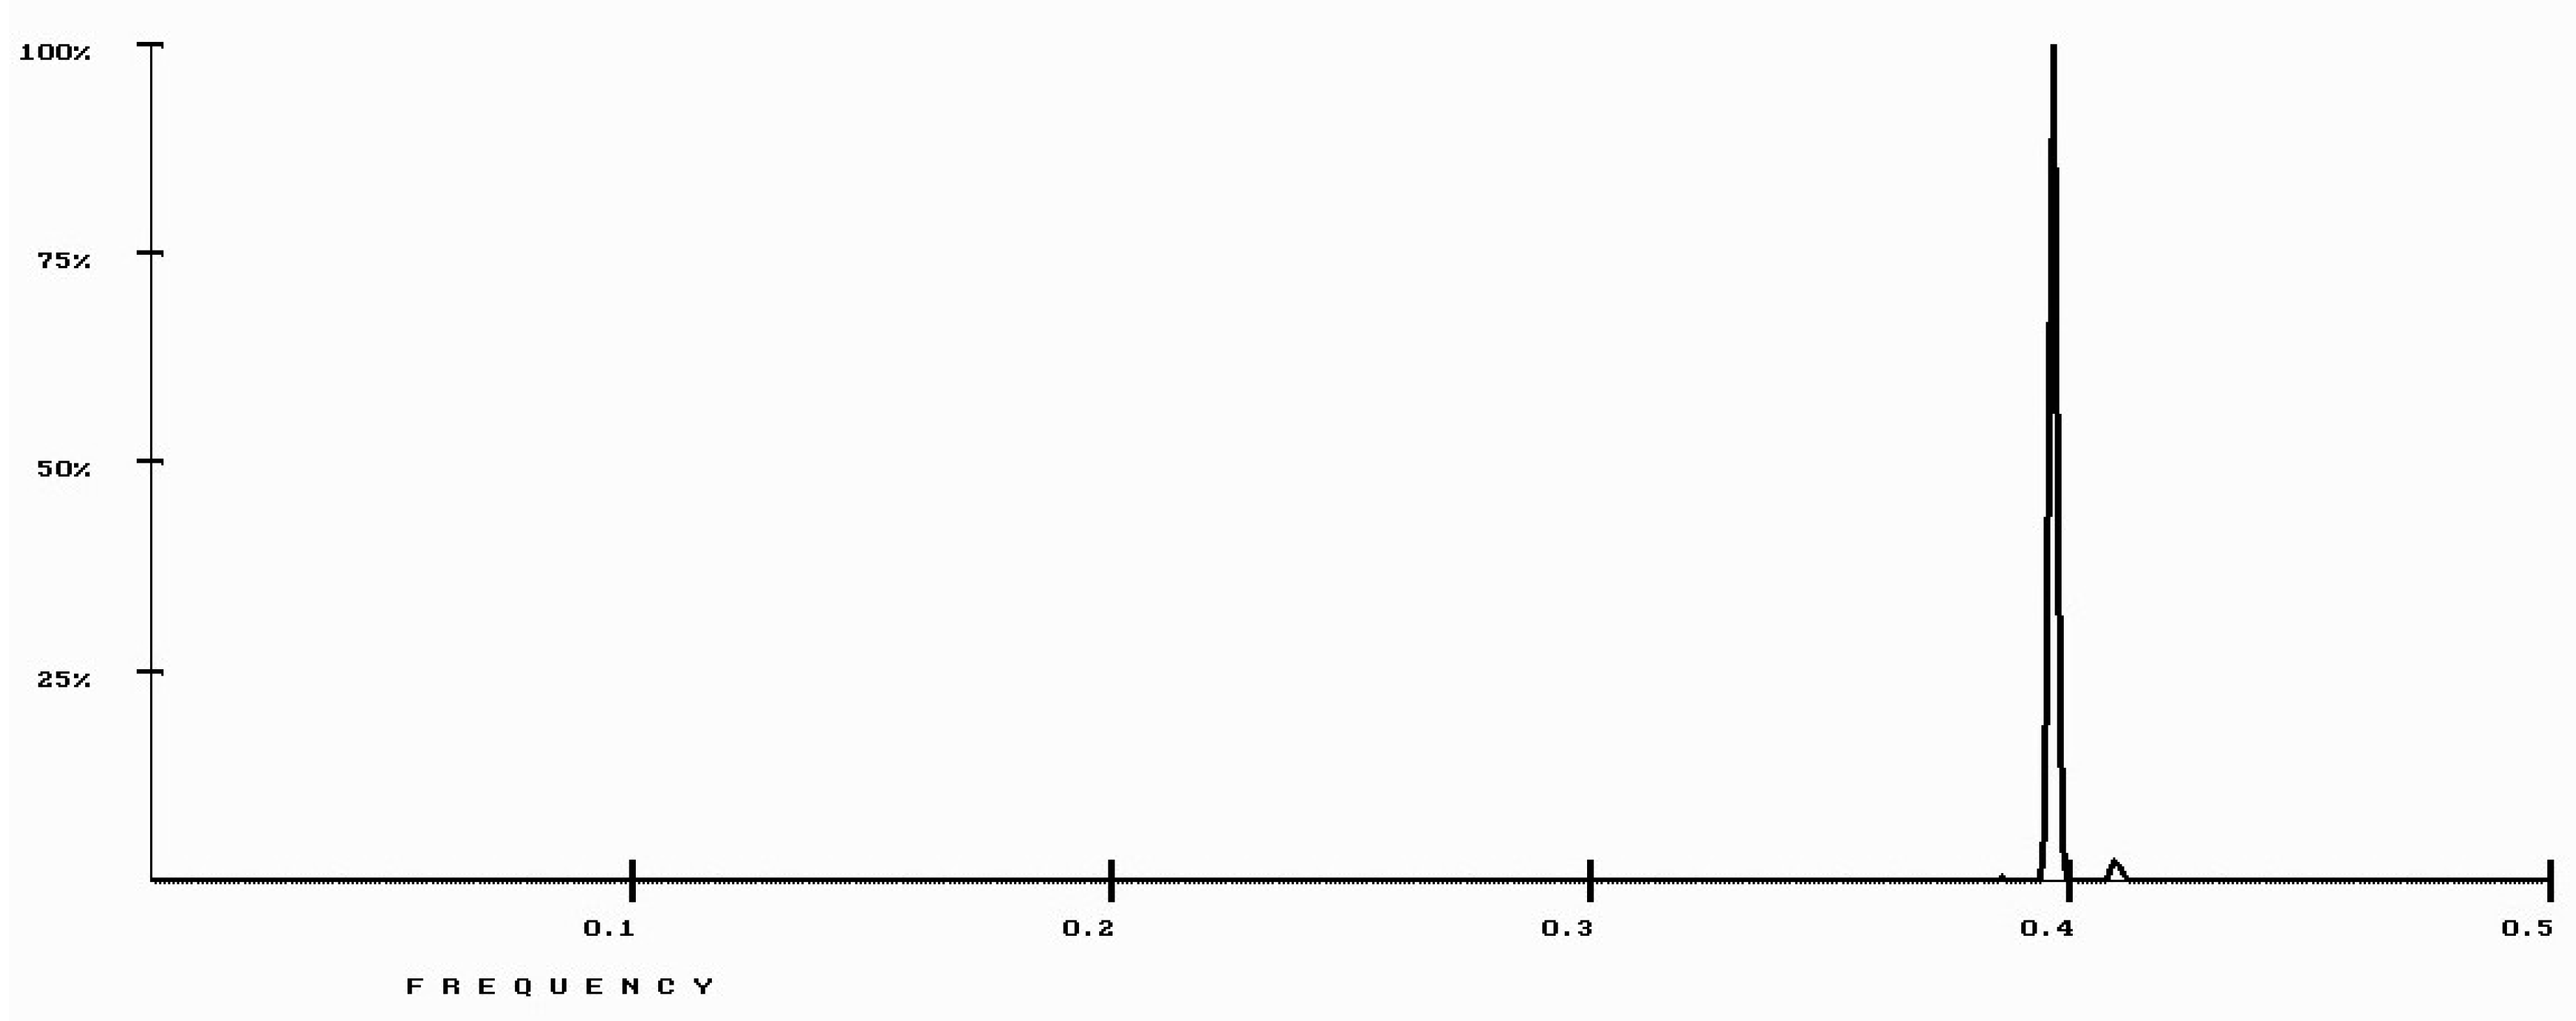
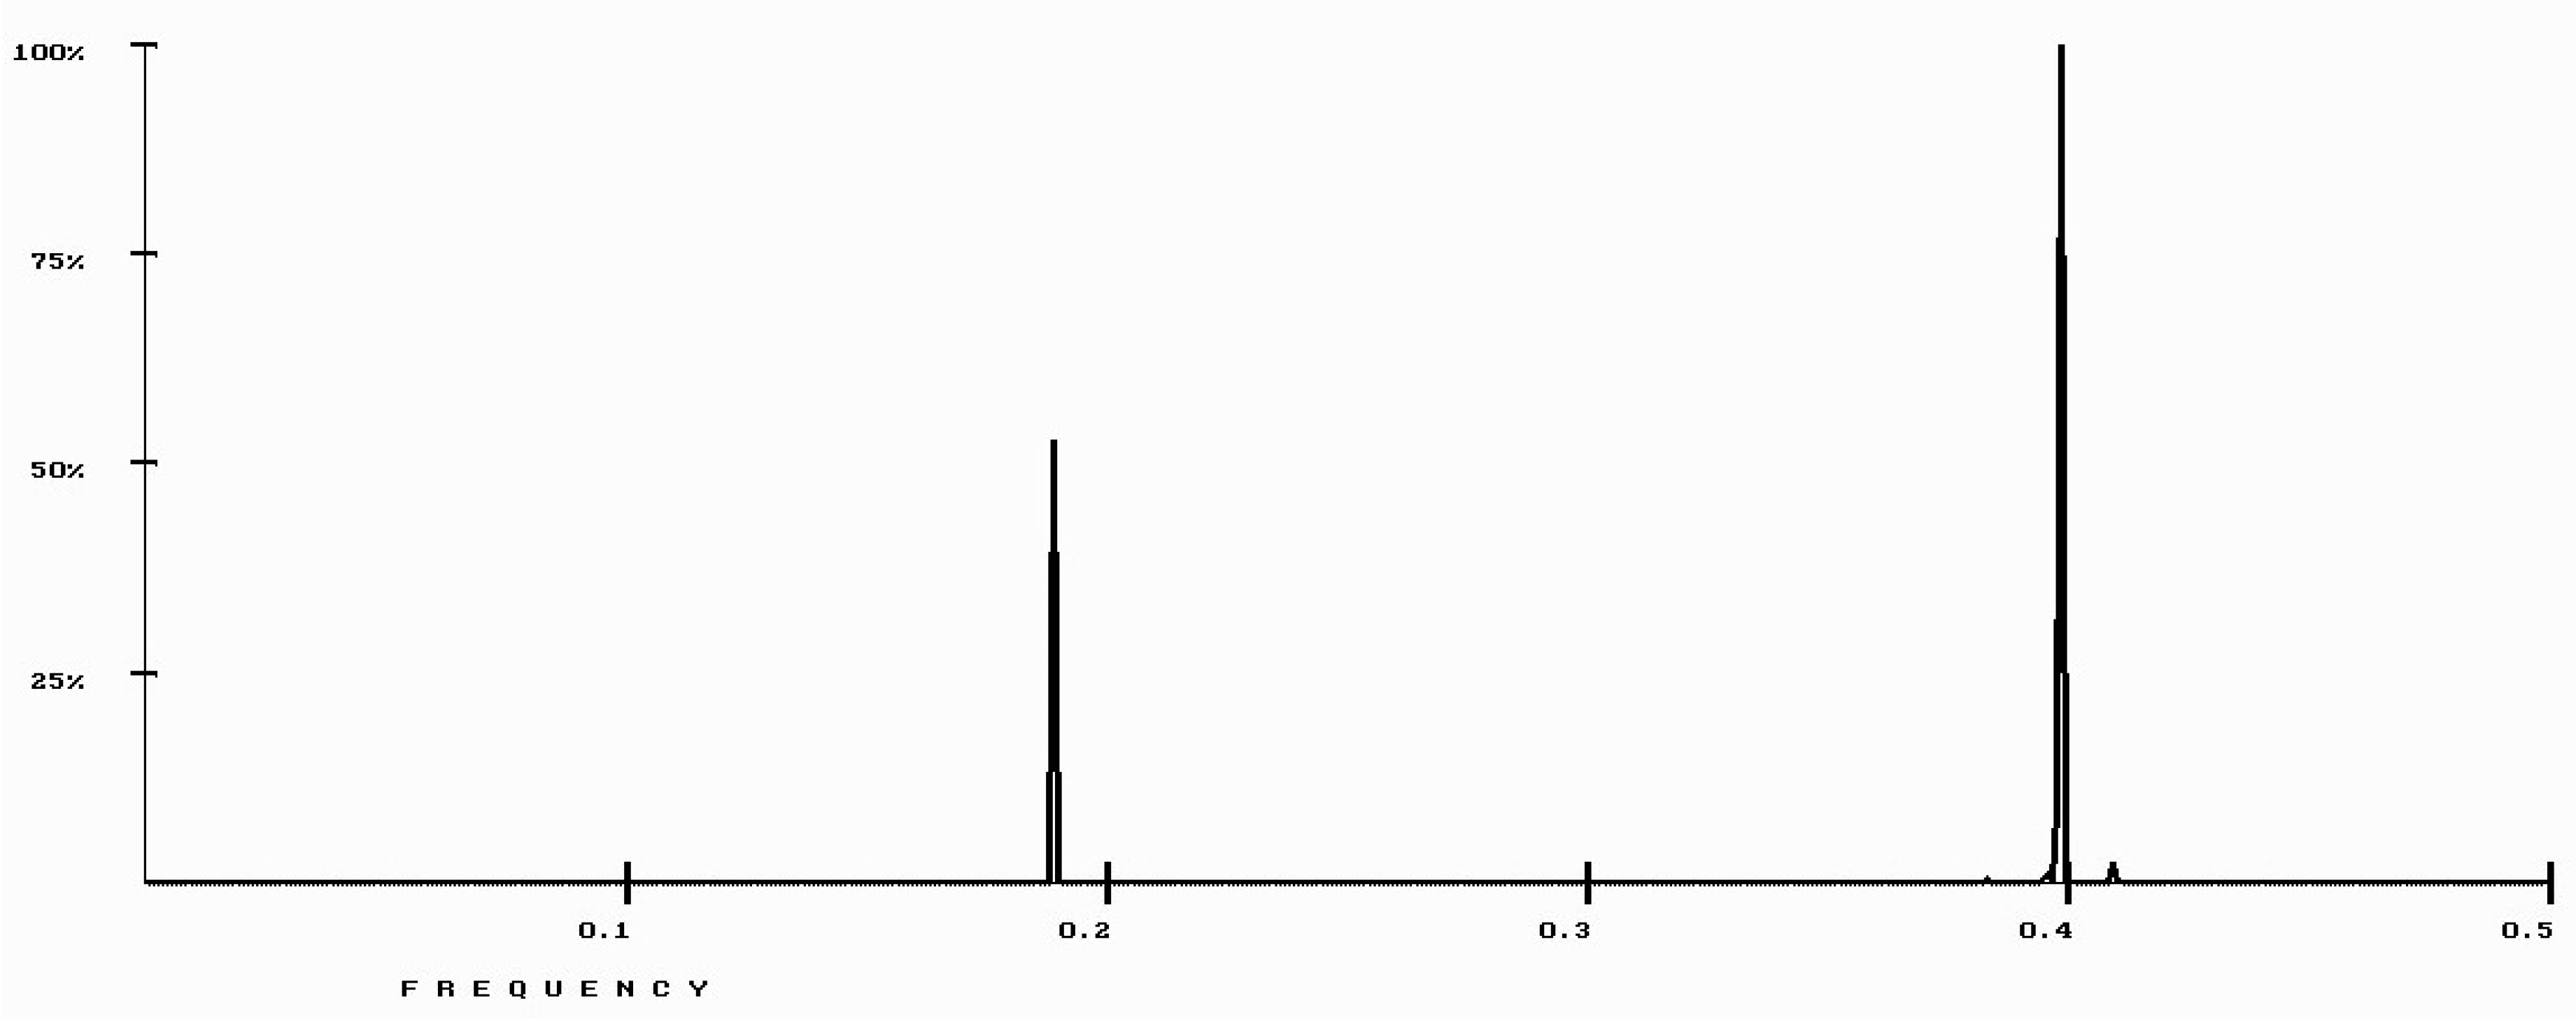
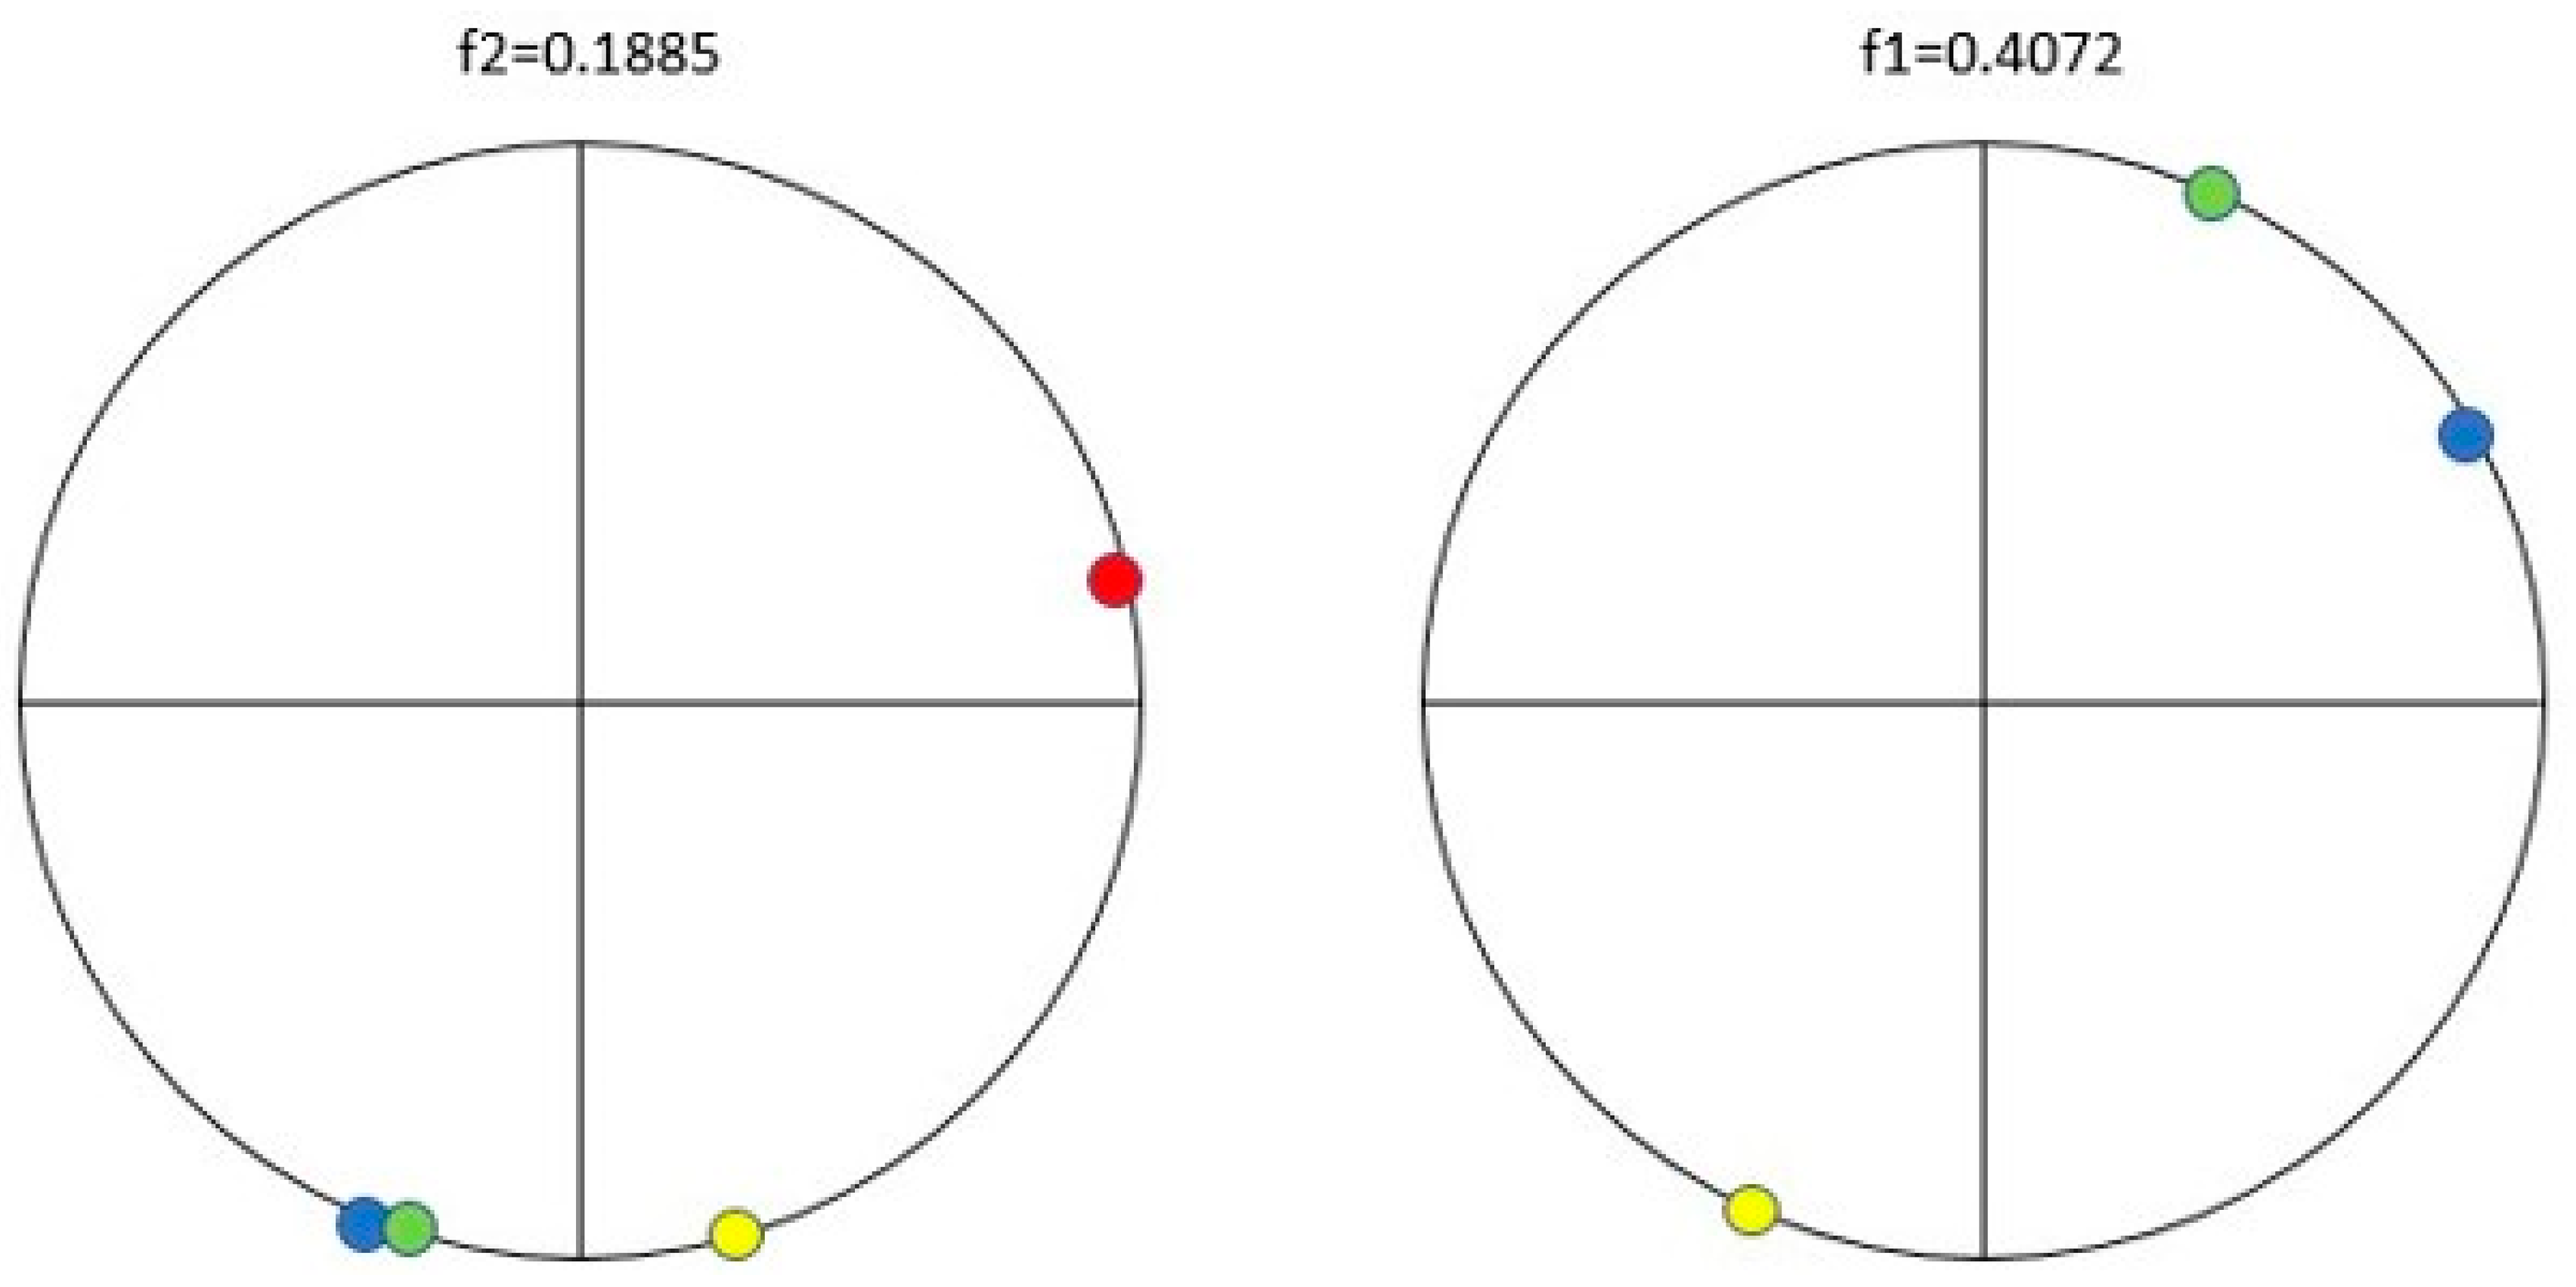
2.1. Resonant Recognition Model (RRM)

Here, we have used the RRM model to analyse PTH proteins, their receptors and stromal derived factor SDF-1α proteins to identify the characteristic wavelengths (frequencies) related to differentiation of stem cells into osteoblasts. These wavelengths (frequencies) have been compared with previously experimentally identified wavelengths of blue light radiation that can influence differentiation of stem cells into osteoblasts [3].
The RRM model has been previously presented in detail [4,5,6,7,8,9,10,11,12,13,14,15,16,17] and is here presented within the Supplementary File. In summary, the RRM model analyses the distribution of free electron energies along protein and DNA macromolecules. It has been previously established [4,5,6,9,10,11,12,13,14,15,16,17] that specific periodicities within this energy distribution [7,8] are related to a specific biological function of proteins and consequently to their specificity to interact with their targets, including other proteins, protein receptors and DNA. In the case of the interaction between the protein and the protein receptor, it has been established that phases at the specific interaction frequency (wavelength) should be opposite. This means that a phase difference at this characteristic frequency between interacting macromolecules should be close to π (3.14 rad). The physical meaning of these interaction frequencies (wavelengths) has been established once when the charge transfer through the protein backbone was investigated [4,5,6,9,10,11,12,13,14,15,16,17]. It was found that these wavelengths correspond directly to electromagnetic radiation wavelengths in the range between ultra-violet, visible, infra-red and far infra-red light. This finding has been experimentally proved in a number of examples [17,18,19,20].

2.2. Protein Sequences Analysed by RRM

The following protein sequences from the UniProt Database have been analysed using the RRM:
Nine parathyroid hormone proteins:
  • >sp|P01270|PTHY_HUMAN Parathyroid hormone OS = Homo sapiens GN = PTH PE = 1 SV = 1
  • >sp|P04089|PTHY_RAT Parathyroid hormone OS = Rattus norvegicus GN = Pth PE = 2 SV = 1
  • >sp|P01268|PTHY_BOVIN Parathyroid hormone OS = Bos taurus GN = PTH PE = 1 SV = 1
  • >sp|P52212|PTHY_CANLF Parathyroid hormone OS = Canis lupus familiaris GN = PTH PE = 3 SV = 1
  • >sp|Q27IM2|PTHY_HORSE Parathyroid hormone OS = Equus caballus GN = PTH PE = 3 SV = 1
  • >sp|Q9GL67|PTHY_FELCA Parathyroid hormone OS = Felis catus GN = PTH PE = 3 SV = 1
  • >sp|P15743|PTHY_CHICK Parathyroid hormone OS = Gallus gallus GN = PTH PE = 3 SV = 1
  • >sp|P01269|PTHY_PIG Parathyroid hormone OS = Sus scrofa GN = PTH PE = 1 SV = 1
  • >sp|Q9XT35|PTHY_MACFA Parathyroid hormone OS = Macaca fascicularis GN = PTH PE = 3 SV = 1
Seven parathyroid hormone receptor1 proteins:
  • >sp|Q03431|PTH1R_HUMAN Parathyroid hormone/parathyroid hormone-related peptide receptor OS = Homo sapiens GN = PTH1R PE = 1 SV = 1
  • >sp|P25961|PTH1R_RAT Parathyroid hormone/parathyroid hormone-related peptide receptor OS = Rattus norvegicus GN = Pth1r PE = 1 SV = 1
  • >sp|P41593|PTH1R_MOUSE Parathyroid hormone/parathyroid hormone-related peptide receptor OS = Mus musculus GN = Pth1r PE = 1 SV = 2
  • >sp|Q9TU31|PTH1R_CANLF Parathyroid hormone/parathyroid hormone-related peptide receptor OS = Canis lupus familiaris GN = PTH1R PE = 1 SV = 1
  • >sp|P50133|PTH1R_PIG Parathyroid hormone/parathyroid hormone-related peptide receptor OS = Sus scrofa GN = PTH1R PE = 1 SV = 1
  • >sp|Q1LZF7|PTH1R_BOVIN Parathyroid hormone/parathyroid hormone-related peptide receptor OS = Bos taurus GN = PTH1R PE = 2 SV = 1
  • >sp|Q5RAQ1|PTH1R_PONAB Parathyroid hormone/parathyroid hormone-related peptide receptor OS = Pongo abelii GN = PTH1R PE = 2 SV = 1
Five stromal cell-derived factor-1 proteins:
  • >sp|P48061|SDF1_HUMAN Stromal cell-derived factor 1 OS = Homo sapiens GN = CXCL12 PE = 1 SV = 1
  • >sp|P40224|SDF1_MOUSE Stromal cell-derived factor 1 OS = Mus musculus GN = Cxcl12 PE = 2 SV = 2
  • >sp|Q8UUJ9|SDF1_XENLA Stromal cell-derived factor 1 OS = Xenopus laevis GN = cxcl12 PE = 2 SV = 1
  • >sp|O62657|SDF1_FELCA Stromal cell-derived factor 1 OS = Felis catus GN = CXCL12 PE = 3 SV = 1
  • >sp|Q5EBF6|SDF1_XENTR Stromal cell-derived factor 1 OS = Xenopus tropicalis GN = cxcl12 PE = 3 SV = 1
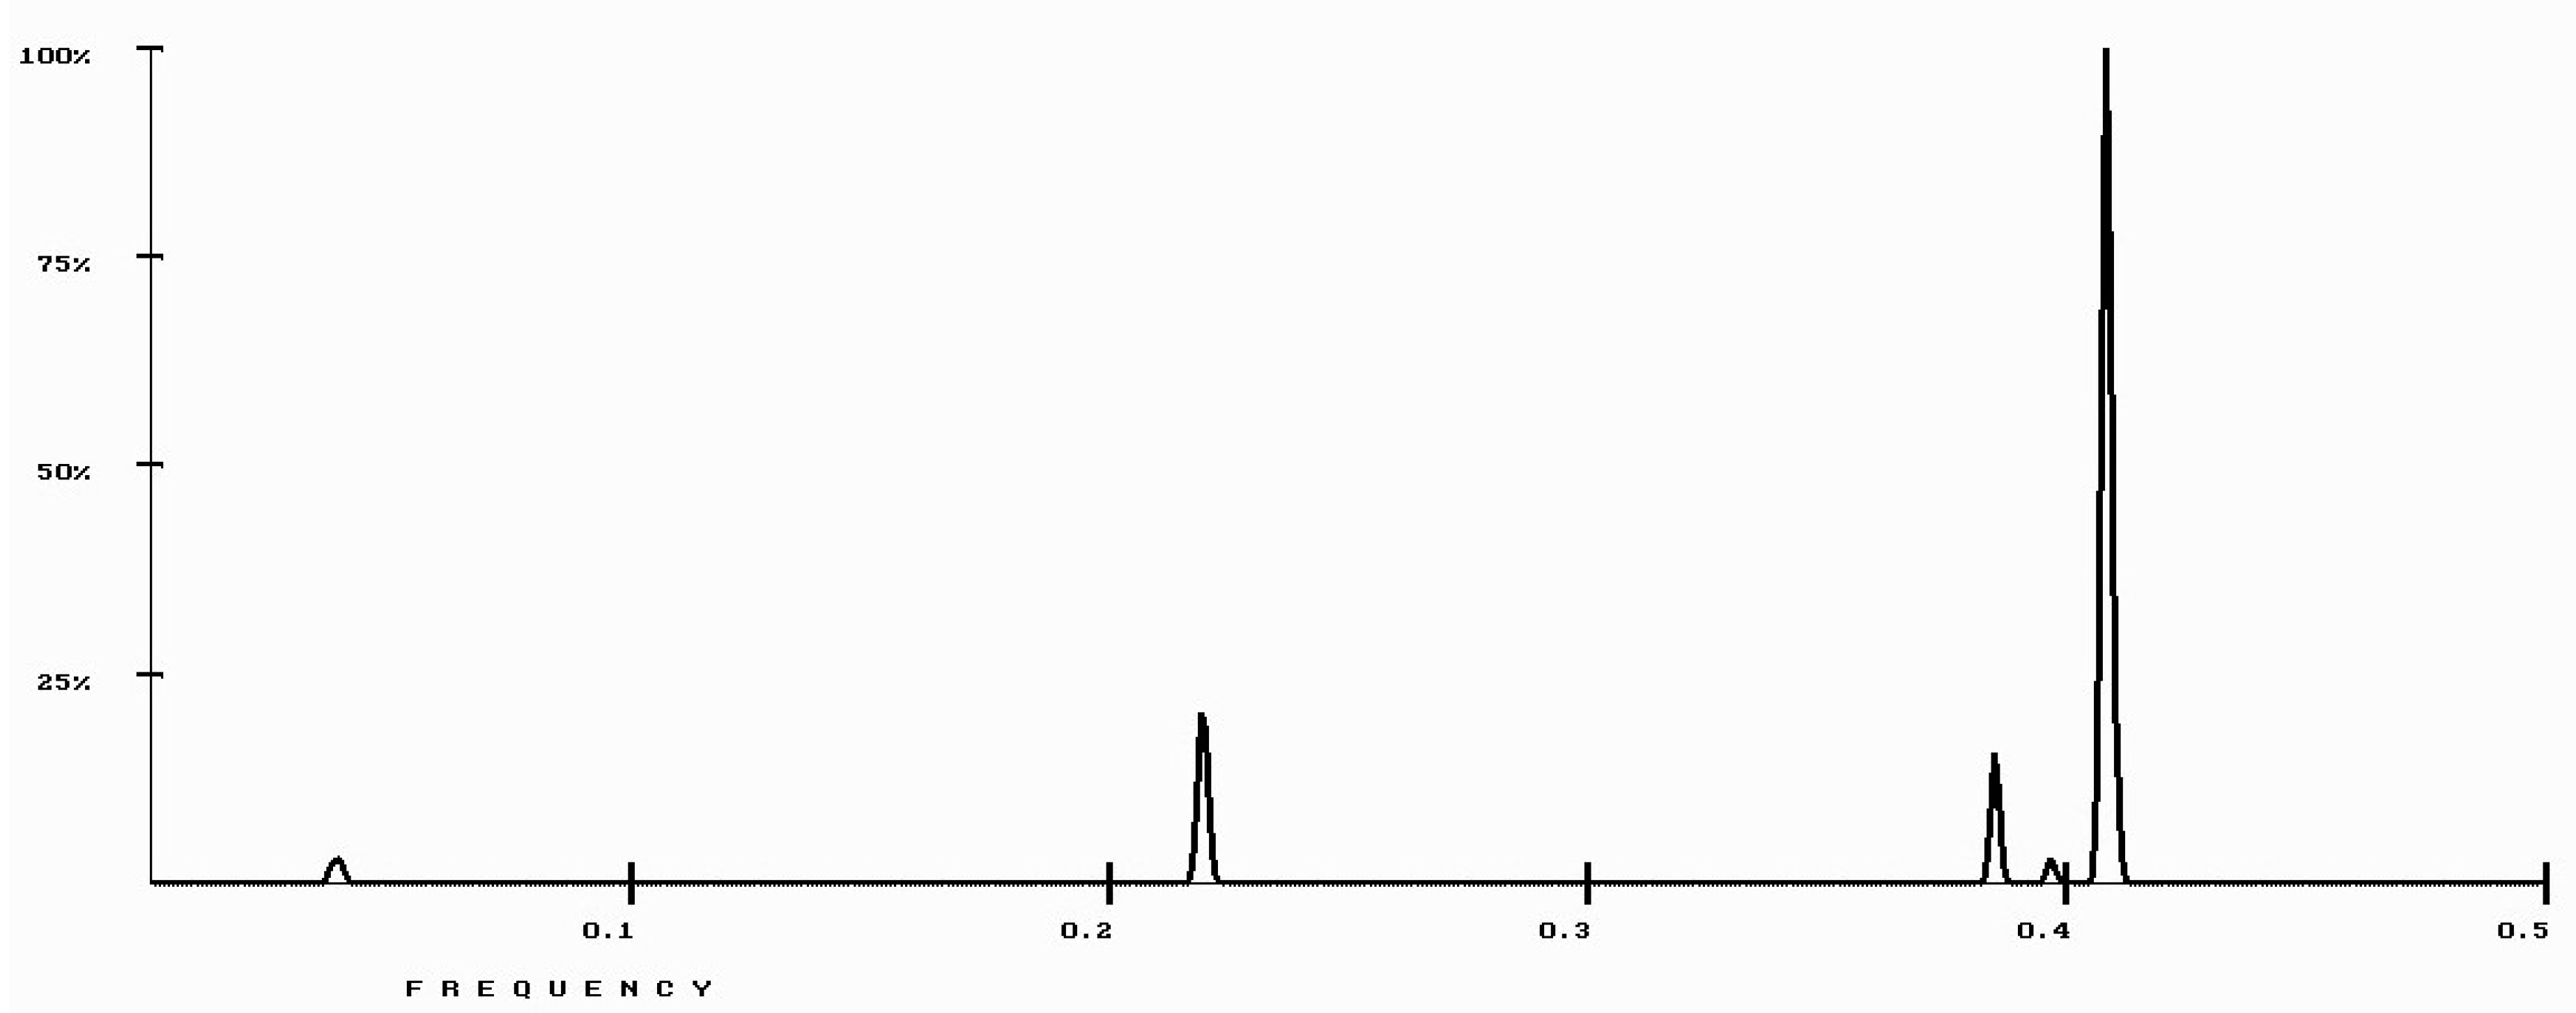
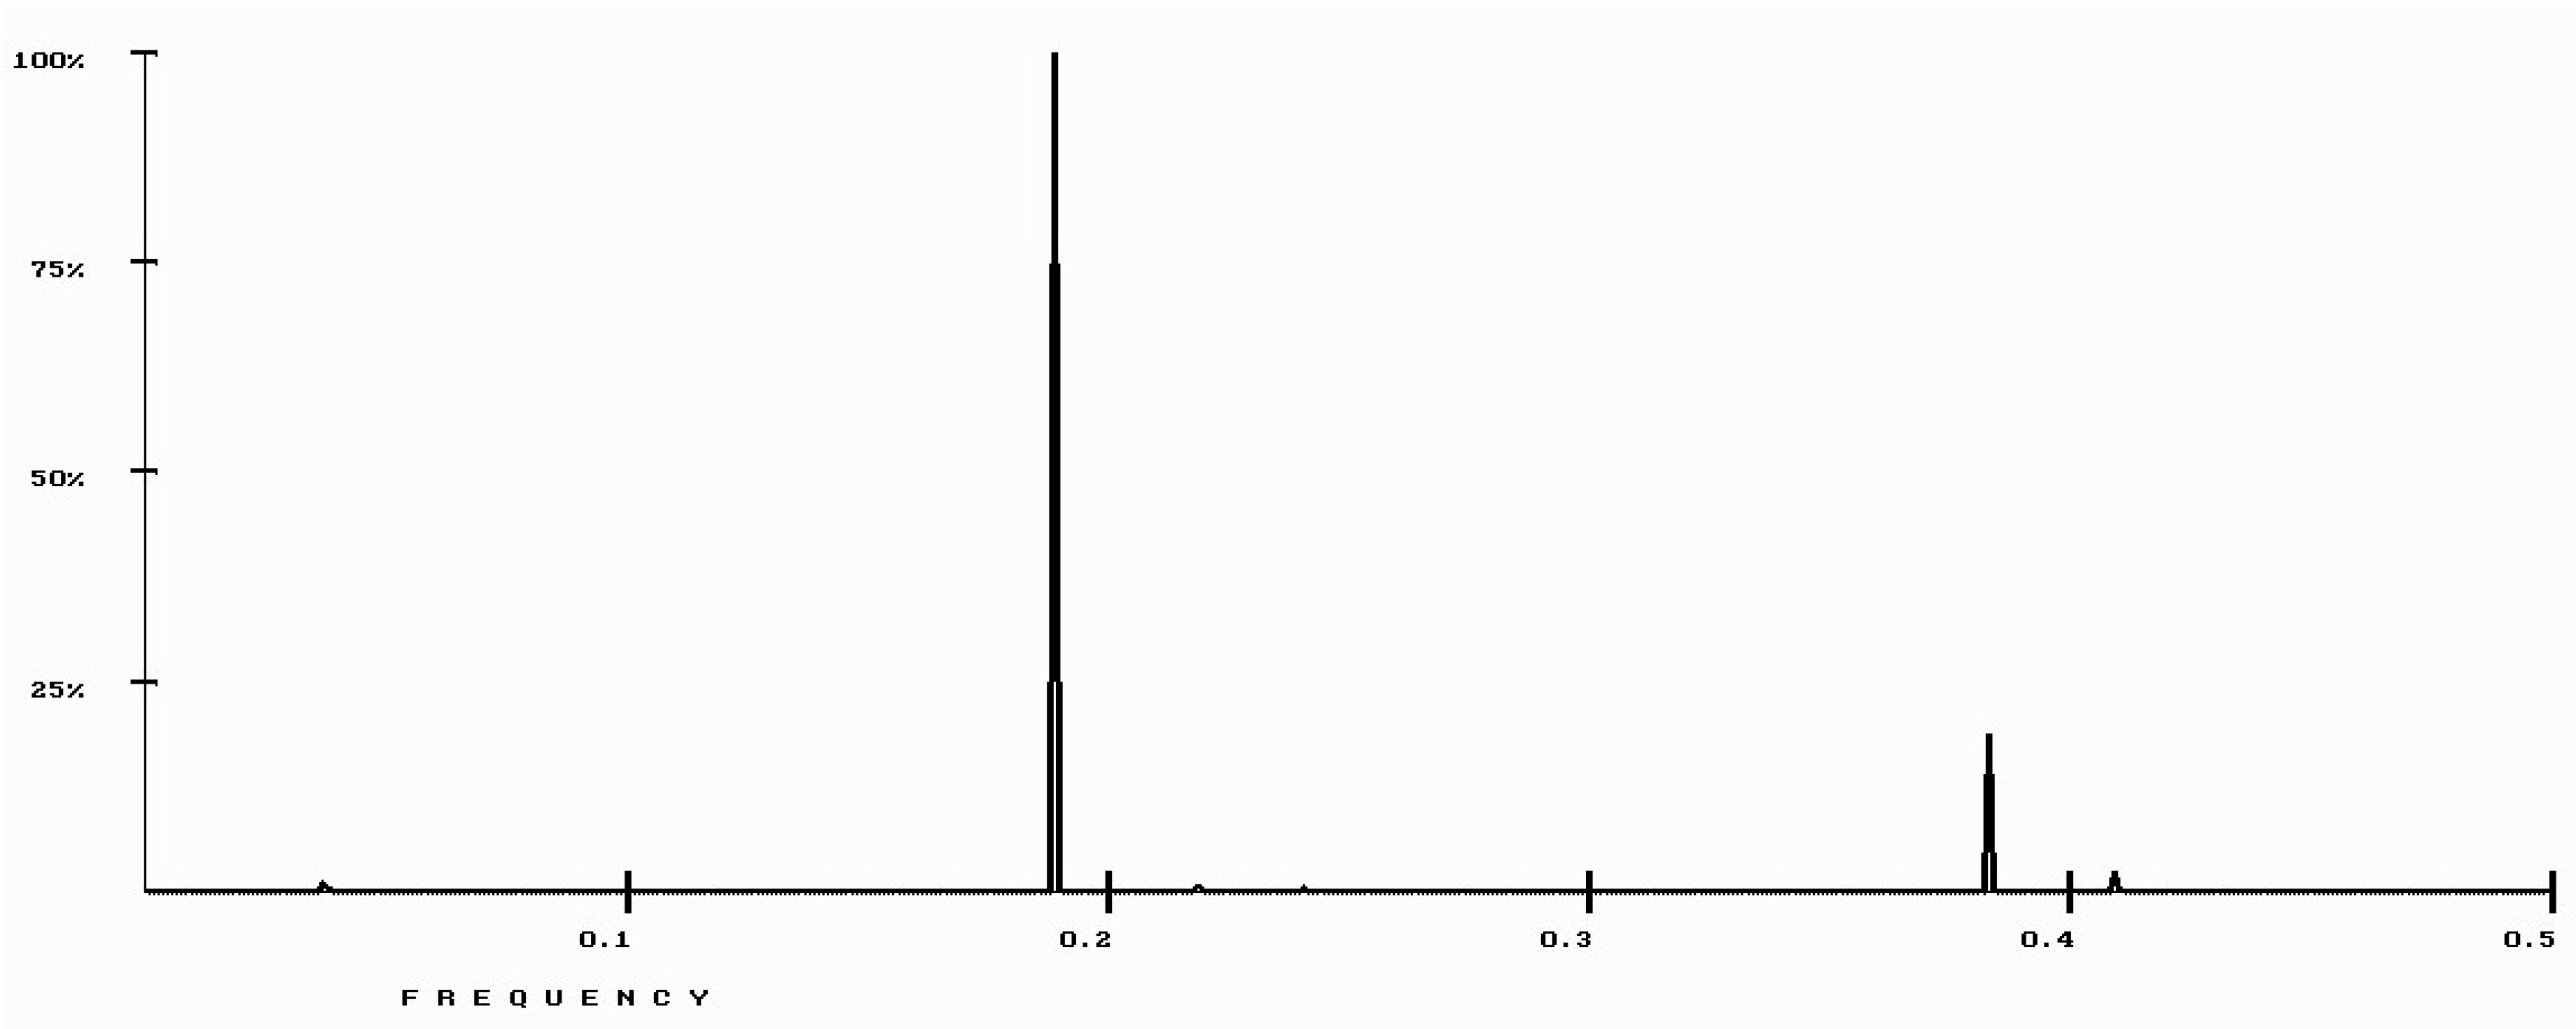
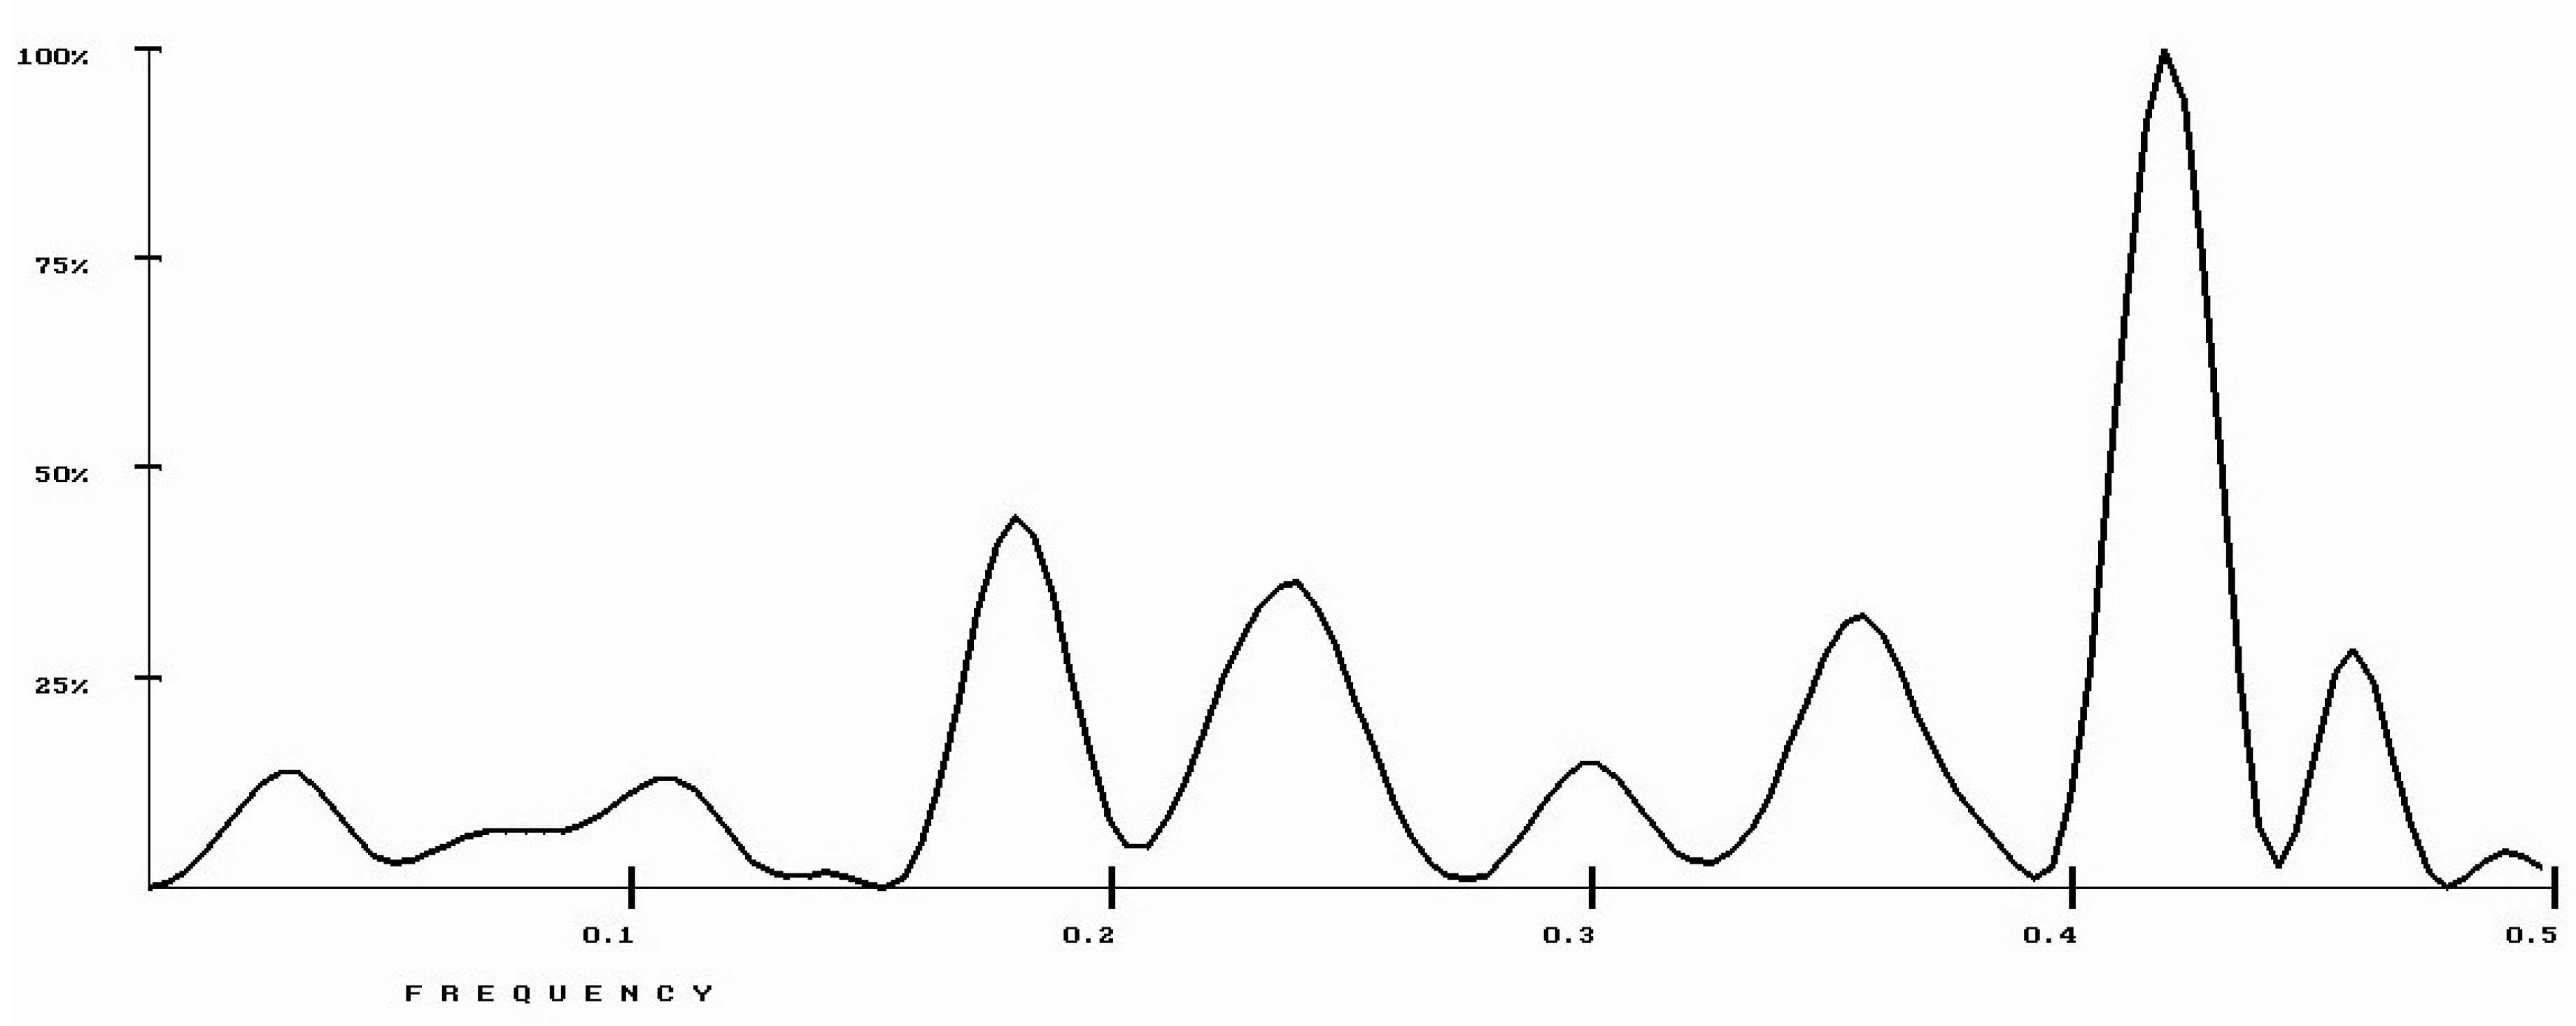
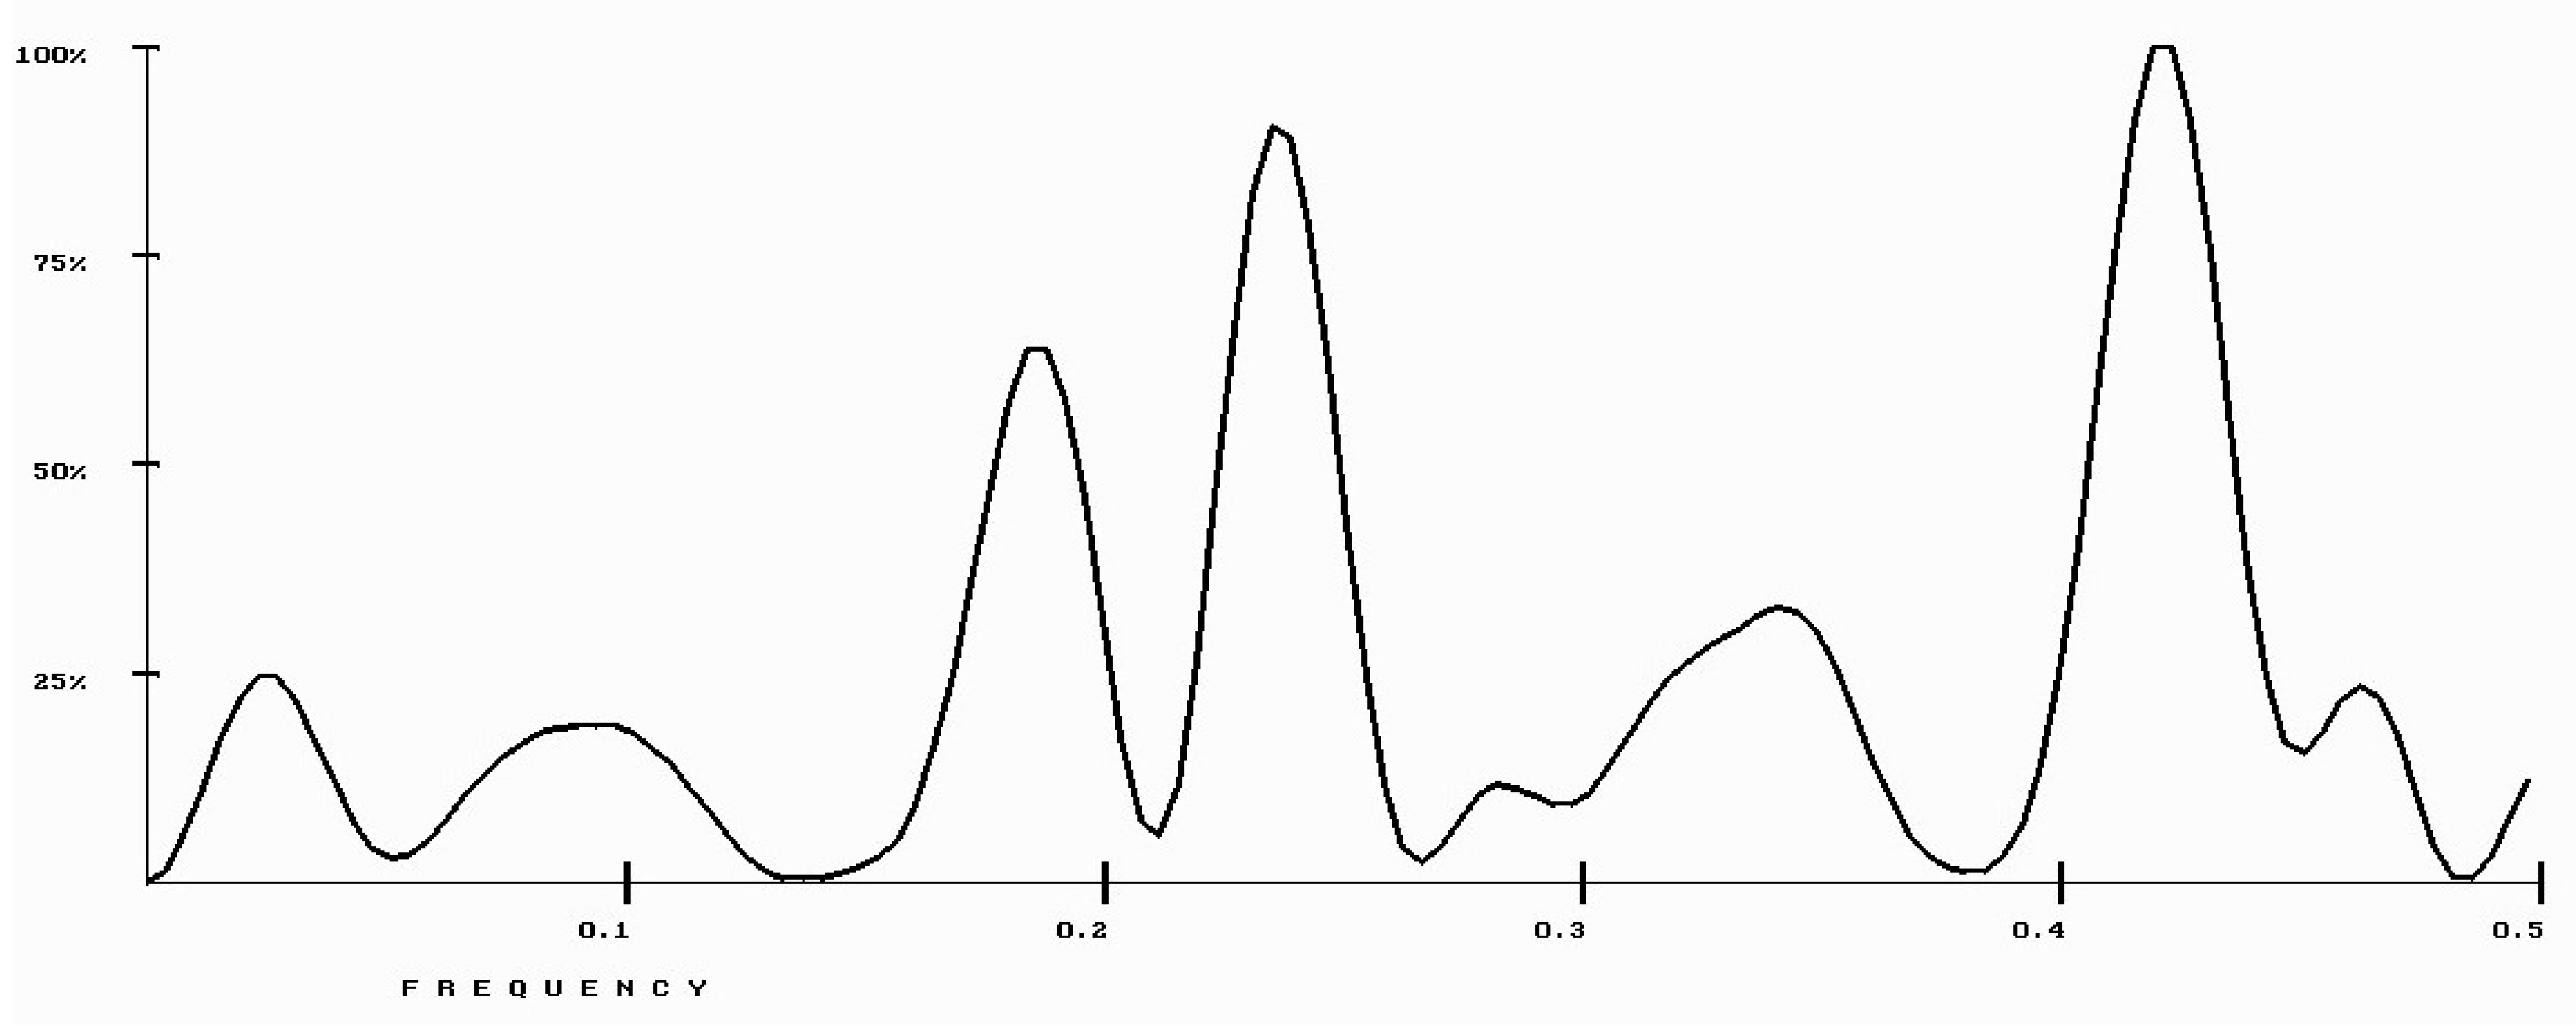
3. Results

We have analysed parathyroid hormones and related proteins using the RRM model to find out their characteristic wavelengths (frequencies), which we propose to be related to their ability to initiate stem cells differentiation. When parathyroid hormone proteins from the UniProt Database, as listed above, were analysed using the RRM, the prominent common frequency was found at f1 = 0.4072 ± 0.0108, as shown in Figure 1. According to the RRM model, the frequency f1 is characterising parathyroid hormone biological function, as well as representing an electromagnetic radiation wavelength of about 502 nm, which is within the blue spectrum of visible light.
To find out the characteristic frequency of recognition/interaction between parathyroid hormone and its receptor, these proteins have been analysed using the RRM model. The prominent common frequency has been found at f2 = 0.1885 ± 0.0108, as shown in Figure 2. According to RRM model the frequency f2 represents an electromagnetic radiation wavelength of about 1066 nm, which is within the infra-red spectrum. The f2 frequency is proposed to characterise recognition/interaction between parathyroid hormone and parathyroid receptor1.
In addition, we have analysed active fragments of the human parathyroid hormone [21]:
  • Fragment PTH 1-34 that binds to the receptor and exhibits parathyroid hormone function (agonist), as shown in Figure 3; and
  • fragment PTH 7-34, which only binds to the receptor but does not exhibit parathyroid hormone function (antagonist), as shown in Figure 4.
It is important to note that both fragments have peak frequencies at both parathyroid hormone functional frequency f1, as well as receptor recognition frequency f2. However, when phases at these two frequencies have been calculated for peptide fragments, it was found that phases at frequency f2 for receptor recognition were similar and opposite to phase for receptor at frequency f1, confirming that both fragments are binding to the receptor. In addition, phases at frequency f1, characterising parathyroid hormone function for fragment PTH 1-34, is close to phases for PTH, while phases for fragment PTH 7-34 was opposite to phases for PTH. This means that both fragments have the ability to interact with receptors at frequency f2, while fragment PTH 1-34 has the same function as PTH due to similar phases at frequency f1, and fragment PTH 7-34 does not have the same function as PTH due to opposite phases at frequency f1. Phases for the parathyroid hormone protein, fragments and receptor at both frequencies are presented in Table 1, as well as on phase circles shown in Figure 5.
These results confirm that frequency f2 = 0.1885 ± 0.0108 is characterising PTH recognition to its receptor, while frequency f1 = 0.4072 ± 0.0108 is characterising PTH function which could be related to stem cell differentiation into osteoblasts. As has been proposed [2] that parathyroid hormone has similar action on initiation of stem cell differentiation into osteoblasts as SDF-1α, which is a key stem cell homing factor, SDF-1α proteins have been analysed using the RRM. The prominent common frequency was found at f3 = 0.3975 ± 0.0108, as shown in Figure 6. Considering the calculation error, the frequencies f1 and f3 are overlapping and thus can represent the same biological function/interaction.
To find out if frequency f3 is indeed common for parathyroid hormone proteins and SDF-1α proteins, these proteins have been analysed using the RRM. The prominent common frequency was found to also be at f3 = 0.3975 ± 0.0108, as shown in Figure 7. According to RRM model this frequency represents an electromagnetic radiation wavelength of about 502 nm.
To find out the common characteristics for all parathyroid hormone-related proteins, parathyroid hormone, parathyroid hormone receptor1 and SDF-1α proteins were analysed using the RRM. The two prominent common frequencies were found: The more prominent at f3 = 0.3975 ± 0.0108 and the less prominent at f2 = 0.1885 ± 0.0108, as shown in Figure 8. According to the RRM model the frequency f3 represents an electromagnetic radiation wavelength of about 502 nm, which is within the blue spectrum of visible light, while the frequency f2 represents an electromagnetic radiation wavelength of about 1066 nm, which is within the infra-red spectrum.
It can be observed from the results above that there are two characteristic frequencies related to PTH activity: f2 = 0.1885 ± 0.0108, related to recognition with its receptor1, and f3 = 0.3975 ± 0.0108, related to its common function with SDF-1α, i.e., initiation of stem cell differentiation into osteoblasts.

4. Discussion and Conclusions

Initiation and control of stem cell differentiation into osteoblasts is of particular interest for bone regeneration, bone healing and bone transplantation. As it has been shown that the population of pluripotent stem cells highly express parathyroid hormone type 1 receptors, it was postulated that parathyroid hormone has a similar action as SDF-1α in control of stem cells differentiation [2]. Moreover, it has been shown that the PhotoBioModulation (PBM) of specific blue and green light electromagnetic wavelengths encourage osteoblastic differentiation of human adipose-derived stem cells [3].
Here, we hypothesised that stimulation of osteoblast differentiation by specific blue and green light wavelengths (frequencies) is related to activation of proteins involved in osteoblast differentiation like PTH and SDF-1α. For this purpose, we have utilised Resonant Recognition Model (RRM), which proposes that protein activation and function are based on specific wavelengths (frequencies) of electromagnetic radiation within ultra-violet, visible, infra-red and far infra-red light. Thus, by using the RRM model, we have analysed parathyroid hormones and related proteins with the purpose to predict wavelengths (frequencies) that characterise parathyroid hormone activities, particularly differentiation of stem cells into osteoblasts.
It can be observed from the results above that there are two important characteristic frequencies (wavelengths) for the activity of parathyroid hormone (PTH), namely parathyroid hormone receptor1 and stromal cell-derived factor-1 (SDF-1α). These frequencies (wavelengths) are f1/f3 = 0.3975 ± 0.0108 (502 nm) and f2 = 0.1885 ± 0.0108 (1066 nm).
According to all above results, the frequency f2 = 0.1885 ± 0.0108 represents parathyroid hormone recognition/interaction with parathyroid hormone receptor1, while the frequency f1/f3 = 0.3975 ± 0.0108 represents the common function of parathyroid hormone and stromal cell-derived factor-1, which is the stem cell differentiation function. It is important to observe that a wavelength of 502 nm related to frequency f1/f3 is exactly between the wavelengths of 420 nm and 540 nm, which in a previous experiment was found to be effective in stimulating osteoblast differentiation [3]. This indicates that specificity of wavelengths (frequencies), which stimulate osteoblast differentiation, could be explained by photo activation of proteins involved in osteoblast differentiation, as predicted by the RRM model. Even more, as the RRM model predicts that the most effective wavelength would be 502 nm, which is in between the already tested wavelengths of 420 nm and 540 nm [3], we propose that a wavelength of 502 nm would induce even more efficient stimulation of osteoblast differentiation. Thus, the findings of this research can be used in development of improved techniques for differentiation of stem cells using the electromagnetic radiation of a specific wavelength of 502 nm. Future research should involve validation of these results by experimental testing of stem cell differentiation.

Supplementary Materials

The following are available online at https://www.mdpi.com/2076-3417/9/10/1979/s1, File S1: Extended Explanation of the Resonant Recognition Model.

Author Contributions

Conceptualization, I.C. and V.P.; methodology, I.C. and D.C.; software, D.C.; resources V.P.; writing—original draft preparation—review and editing, I.C., V.P. and D.C.

Funding

This research received no external funding.

Conflicts of Interest

The authors declare no conflict of interest.

References

  1. Yu, B.; Zhao, X.; Crane, J.; Xian, L.; Lu, W.; Wan, M.; Cao, X. Parathyroid Hormone Induces Differentiation of Mesenchymal Stromal/Stem Cells by Enhancing Bone Morphogenetic Protein Signalling. J. Bone Min. Res. 2012, 27, 2001–2014. [Google Scholar] [CrossRef] [PubMed]
  2. Wang, F.; Du, L.; Ge, S. PTH/SDF-1α Cotherapy Induces CD90+CD34- Stromal Cells Migration and Promotes Tissue Regeneration in a Rat Periodontal Defect Model. Sci. Rep. 2016, 2, 30403. [Google Scholar] [CrossRef] [PubMed]
  3. Wang, Y.; Huang, Y.Y.; Wang, Y.; Lyu, P.; Hamblin, M.R. Photobiomodulation (Blue and Green Light) Encourages Osteoblastic-Differentiation of Human Adipose-Derived Stem Cells: Role of Intracellular Calcium and Light-Gated Ion Channels. Sci. Rep. 2016, 6, 33719. [Google Scholar] [CrossRef] [PubMed]
  4. Cosic, I. Macromolecular Bioactivity: Is it Resonant Interaction between Macromolecules?—Theory and Applications. IEEE Trans. Biomed. Eng. 1994, 41, 1101–1114. [Google Scholar] [CrossRef] [PubMed]
  5. Cosic, I. The Resonant Recognition Model of Macromolecular Bioactivity: Theory and Applications; Birkhauser Verlag: Basel, Switzerland, 1997. [Google Scholar]
  6. Cosic, I.; Cosic, D.; Lazar, K. Analysis of Tumor Necrosis Factor Function Using the Resonant Recognition Model. Cell Biochem. Biophys. 2016, 74, 175–180. [Google Scholar] [CrossRef] [PubMed]
  7. Pirogova, E.; Simon, G.P.; Cosic, I. Investigation of the applicability of Dielectric Relaxation properties of amino acid solutions within the Resonant Recognition Model. IEEE Trans. NanoBiosci. 2003, 2, 63–69. [Google Scholar] [CrossRef]
  8. Pirogova, E.; Cosic, I. The Use of Ionisation Constants of Amino Acids for Protein Signal Analysis within the RRM—Application to Proteases. Mol. Simul. 2002, 28, 845–851. [Google Scholar] [CrossRef]
  9. Cosic, I.; Lazar, K.; Cosic, D. Prediction of Tubulin resonant frequencies using the Resonant Recognition Model (RRM). IEEE Trans. Nanobiosci. 2015, 12, 491–496. [Google Scholar] [CrossRef] [PubMed]
  10. Cosic, I.; Cosic, D.; Lazar, K. Is it possible to predict electromagnetic resonances in proteins, DNA and RNA? Nonlinear Biomed. Phys. 2015, 3, 5. [Google Scholar] [CrossRef]
  11. Cosic, I.; Cosic, D.; Lazar, K. Environmental Light and Its Relationship with Electromagnetic Resonances of Biomolecular Interactions, as Predicted by the Resonant Recognition Model. Int. J. Environ. Res. Public Health 2016, 13, 647. [Google Scholar] [CrossRef] [PubMed]
  12. Cosic, I.; Cosic, D. The Treatment of Crigler-Najjar Syndrome by Blue Light as Explained by Resonant Recognition Model. EPJ Nonlinear Biomed. Phys. 2016, 4, 9. [Google Scholar] [CrossRef]
  13. Cosic, I.; Cosic, D.; Lazar, K. Cancer Related BRCA-1 and BRCA-2 Mutations as Analysed by the Resonant Recognition Model. J. Adv. Mol. Biol. 2017, 1. [Google Scholar] [CrossRef]
  14. Cosic, I.; Cosic, D. Influence of Tuning Element Relief Patches on Pain as Analyzed by the Resonant Recognition Model. IEEE Trans. Nanobiosci. 2017, 16, 822–827. [Google Scholar] [CrossRef] [PubMed]
  15. Cosic, I.; Cosic, D.; Uzelac, B.; Brasovan, S. Possible Mechanism of Titanium Salt Infused Patches Remediation of Autism and Attention Deficit Disorders. Md-Med. Data 2018, 10, 97–102. [Google Scholar]
  16. Cosic, I.; Paspaliaris, V.; Cosic, D.; Kolios, G. Analysis of Interleukin-12 and Interleukin-23 Pathways to Distinguish between Immune Activation and Inflammation Functions. MD-Med. Data 2019, 11, 7–14. [Google Scholar]
  17. Vojisavljevic, V.; Pirogova, E.; Cosic, I. The Effect of Electromagnetic Radiation (550–850 nm) on I-Lactate Dehydrogenase Kinetics. Int. J. Radiat. Biol. 2007, 83, 221–230. [Google Scholar] [CrossRef] [PubMed]
  18. Dotta, B.T.; Murugan, N.J.; Karbowski, L.M.; Lafrenie, R.M.; Persinger, M.A. Shifting wavelength of ultraweak photon emissions from dying melanoma cells: Their chemical enhancement and blocking are predicted by Cosic’s theory of resonant recognition model for macromolecules. Naturwissenschaften 2014, 101, 87–94. [Google Scholar] [CrossRef] [PubMed]
  19. Murugan, N.J.; Karbowski, L.M.; Persinger, M.A. Cosic’s Resonance Recognition Model for Protein Sequences and Photon Emission Differentiates Lethal and Non-Lethal Ebola Strains: Implications for Treatment. Open J. Biophys. 2014, 5, 35. [Google Scholar] [CrossRef]
  20. Karbowski, L.M.; Murugan, N.J.; Persinger, M.A. Novel Cosic resonance (standing wave) solutions for components of the JAK-STAT cellular signalling pathway: A convergence of spectral density profiles. FEBS Open Biol. 2015, 5, 245–250. [Google Scholar] [CrossRef] [PubMed]
  21. Jin, L.; Briggs, S.L.; Chandrasekhar, S.; Chirgadze, N.Y.; Clawson, D.K.; Schevitz, R.W.; Smiley, D.L.; Tashjian, A.H.; Zheng, F. Crystal Structure of Human Parathyroid Hormone 1-34 at 0.9Å Resolution. JBC 2000, 275, 27238–27244. [Google Scholar]
Figure 1. Resonant Recognition Model (RRM) cross-spectrum of parathyroid hormone proteins. The prominent common characteristic frequency for these proteins is at f1 = 0.4072 ± 0.0108, which represents an electromagnetic radiation wavelength of about 502 nm.
Applsci 09 01979 g001
Figure 2. RRM cross-spectrum of parathyroid hormone proteins and parathyroid hormone receptor1 proteins. The prominent common characteristic frequency for these proteins is at f2 = 0.1885 ± 0.0108, which represents an electromagnetic radiation wavelength of about 1066 nm.
Applsci 09 01979 g002
Figure 3. RRM cross-spectrum of parathyroid hormone protein fragment 1-34.
Applsci 09 01979 g003
Figure 4. RRM cross-spectrum of parathyroid hormone protein fragment 7-34.
Applsci 09 01979 g004
Figure 5. Phases for parathyroid hormone protein, fragments and receptor for frequencies f2 and f1. The colour of each phase corresponds to the colour of proteins in Table 1.
Applsci 09 01979 g005
Figure 6. RRM cross-spectrum of stromal cell-derived factor-1 (SDF-1α) proteins. The prominent common characteristic frequency for these proteins is at f3 = 0.3975 ± 0.0108, which represents an electromagnetic radiation wavelength of about 502 nm.
Applsci 09 01979 g006
Figure 7. RRM cross-spectrum of parathyroid hormone proteins and SDF-1α proteins. The prominent common characteristic frequency for these proteins is also f3 = 0.3975 ± 0.0108, which represents an electromagnetic radiation wavelength of about 502 nm.
Applsci 09 01979 g007
Figure 8. RRM cross-spectrum of parathyroid hormone proteins, parathyroid hormone receptor1 proteins and SDF-1α proteins. The more prominent common characteristic frequency for these proteins is at f3 = 0.3975 ± 0.0108, which represents an electromagnetic radiation wavelength of about 502 nm, while the less prominent frequency is at f2 = 0.1885 ± 0.0108, which represents an electromagnetic radiation wavelength of about 1066 nm.
Applsci 09 01979 g008
Table 1. Phases for parathyroid hormone protein, fragments and receptor. The colour of each protein corresponds to the colour of phases in Figure 5.
Protein/Frequencyf2 = 0.1885f1 = 0.4072
PTH−1.98+0.58
PTH 1-34−1.94+1.26
PTH 7-34−1.38−1.88
PTH receptor+0.28

