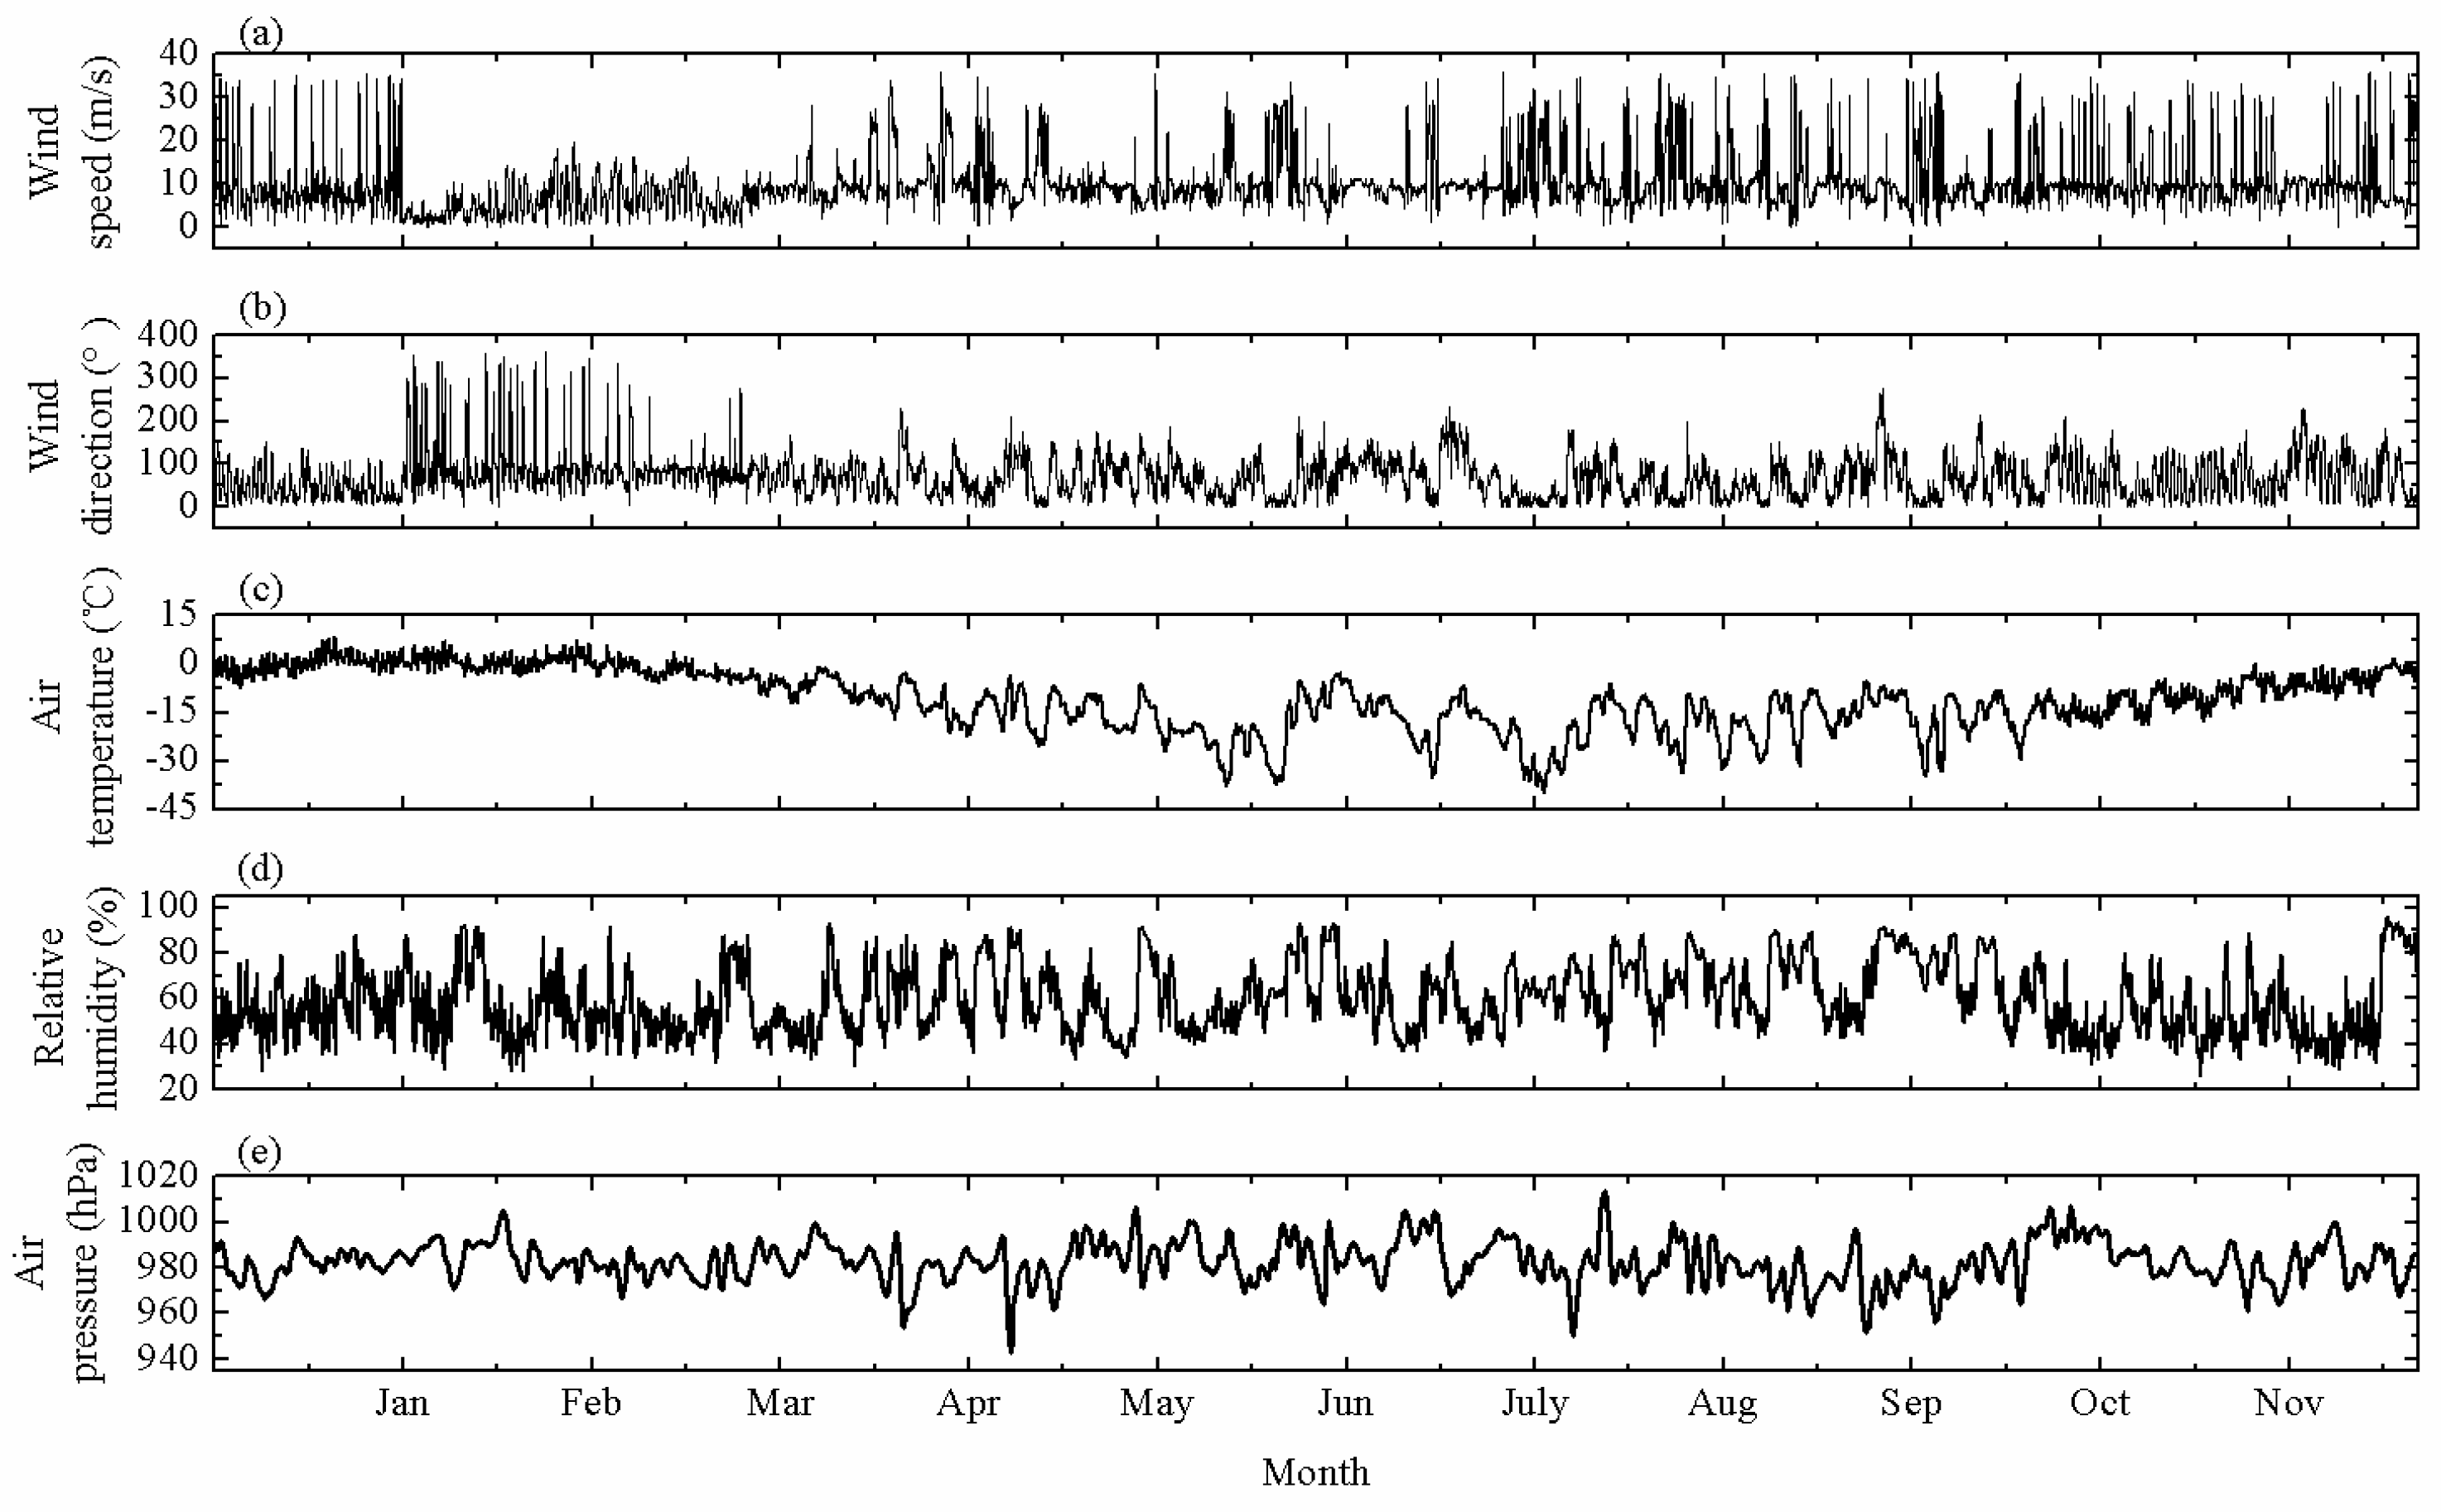
Article

A Study of a Standalone Renewable Energy System of the Chinese Zhongshan Station in Antarctica

1
College of Electrical and Power Engineering, Taiyuan University of Technology, Taiyuan 030024, China
2
College of Water Resources Science and Engineering, Taiyuan University of Technology, Taiyuan 030024, China
*
Author to whom correspondence should be addressed.
Appl. Sci. 2019, 9(10), 1968; https://doi.org/10.3390/app9101968
Submission received: 10 April 2019 / Revised: 7 May 2019 / Accepted: 7 May 2019 / Published: 14 May 2019
(This article belongs to the Special Issue Standalone Renewable Energy Systems—Modeling and Controlling)

Abstract

:
China has built four stations in Antarctica so far, and Zhongshan Station is the largest station among them. Continuous power supply for manned stations mainly relies on fuel. With the gradual increase in energy demand at the station and cost of fuel traffic from China to Zhongshan station in Antarctica, reducing fuel consumption and increasing green energy utilization are urgent problems. This research considers a standalone renewable energy system. The polar environments and renewable energy distribution of area of Zhongshan station are analyzed. The physical model, operation principle, and mathematical modeling of the proposed power system were designed. Low-temperature performance and state of charge (SOC) estimation method of the lead–acid battery were comprehensively tested and evaluated. A temperature control strategy was adopted to prevent the battery from low-temperature loss of the battery capacity. Energy management strategy of the power system was proposed by designing maximum power point tracking (MPPT) control strategies for wind turbine and PV array. The whole power system is broadly composed of a power generator (wind turbine and PV array), an uploading circuit, a three-phase rectifier bridge, an interleaved Buck circuit, a DC/DC conversion circuit, a switch circuit, a power supply circuit, an amplifier, a driver circuit, a voltage and current monitoring, a load, battery units and a control system. A case study in Antarctica was applied and can examine the technical feasibility of the proposed system. The results of the case study reveal that the scheme of standalone renewable energy system can satisfy the power demands of Zhongshan Station in normal operation.

Graphical Abstract

1. Introduction

The rapid changes of sea ice condition in Arctic and Antarctica in recent decades have been considered one of the most impactful phenomena on Earth [1,2,3]. There are more and more researches and observations organized by China in Antarctica every year. Up to now, China has four Antarctic research stations, namely the Great Wall Station (62°12′59″ S, 58°57′52″ W), the Zho2033ngshan Station (69°22′24″ S, 76°22′40″ E), the Kunlun Station (80°25′01″ S, 77°06′58″ E) and the Taishan Station (73°51″ S, 76°58′ E). The Great Wall Station and Zhongshan Station are both perennial research stations, which have the ability to accommodate dozens of expedition members and researchers to spend the whole year in Antarctica. Zhongshan Station was established in an area of Larsemann Hills on East Antarctica on 26 February 1989 as a Chinese observation base of high altitude physics, glaciers, atmosphere, ocean, biological ecology, geology, geomagnetism etc. Zhongshan Station is also the base camp for the Chinese National Antarctica Inland Research Base. Zhongshan Station can accommodate about 25 wintering personnel and 600 summer personnel. The current energy supply of Zhongshan Station mainly depends on fuel. The ecological environment in Antarctica is very fragile, and the fuel produces a lot of harmful gases. Although treated by Zhongshan Station, it cannot achieve zero pollution. The fossil fuels used by Zhongshan Station were transported by the Chinese observatory ship Xuelong every year. As the demand of research and observations increases in Antarctica, the amount of fuel consumption increases accordingly. Therefore, new demands for power supply in Antarctica for green, sustainable and less costly energy sources such as wind, solar, ocean were created.
When humans do research in Antarctica, the impact of human activities on the natural environment of the polar region should be minimized as much as possible. Based on the special meteorological condition of Antarctica, some demands need to be proposed during designing and building the power system used in Zhongshan Station, East Antarctica. The use of fossil fuels is limited due to the inevitable pollution. There are abundant resources of wind, solar, and ocean energy in Antarctica, which can be considered a great advantage in the development of environmentally friendly power generation. Some works and research have reported on small standalone hybrid wind–solar systems which are isolated from the grid for observing systems deployed in the field in the Arctic Ocean and Antarctica [4]. The design of the hybrid wind–solar system was adopted because of the fluctuations of the solar and wind energy resources in polar regions. Some researches of hybrid wind–solar systems have reported. A report by Reference [5] indicates that the best fit of the wind turbine and photovoltaic (PV) array to a given load can be determined by the least square method. Some methods of modeling, designing and evaluating of hybrid renewable energy systems were also developed [6]. A hybrid solar–wind–battery system was used in the isolated site of Potou in the northern coast of Senegal to realize the minimization of the annualized cost and loss of power supply probability [7]. Based on a methodology of optimal sizing of a hybrid PV/wind system, this hybrid power system was installed on Corsica and can meet the desired system reliability requirements [8]. In some harsh environments in Iraq, the design of hybrid systems can be considered renewable resources of power generation and the simulation results illustrate that it is possible to use the solar and wind energy to generate enough power for remote areas [9]. Renewable energy such as wind energy and solar energy have been used in Antarctica. Mawson Station of Australia has built two 300 KW wind turbines to provide continuous power since 2003. On Ross Island in Antarctica, a wind farm has been used to realize 100% of the energy supply of Scott Base of New Zealand and part of the power requirements of McMurdo Station of United States of America. For Princess Elisabeth Station of Belgium, 300 m2 solar panels have been installed and can generate 49 MWh [10]. Syowa Station of Japan has built 55 KW of solar panels to produce an annual output of 44,000 KW h for accommodating up to 110 people in the summer and 28 people in the winter [11].
For a hybrid PV/wind system in Polar Regions, an energy storage system (ESS) plays an important role in storing excess energy and releasing the power as a reliable back-up to the power system for unpredictability and weather dependence of wind and solar energy. An integrated wind–PV hybrid system with a battery ESS was proposed and a power management strategy of this system can realize rapid control of the outputs of wind and PV power for regulating the battery current [12]. In the design of an isolated renewable hybrid power system, a methodology of battery sizing was used to determine the sizing curve and the feasible design space [13]. Using solar, wind, fuel cell, and batteries as input sources may be able to meet the load demand and an energy management strategy is proposed for a DC microgrid [14,15]. A case study of a stand-alone photovoltaic (PV) system was proposed and the environmental impact of batteries used in the renewable energy system was evaluated [16]. Due to the different seasonal changes of power production and demand, the design of renewable energy system should involve the use of surplus energy [17]. A multi-energy system with seasonal storage was designed and optimized in terms of total annual costs and carbon dioxide emissions [18].
In this study, a new standalone renewable energy system of the Chinese Zhongshan Station in Antarctica was designed to realize an environmentally friendly energy supply and to obtain high power generation efficiency. The physical model and mathematical model of the standalone renewable energy system were proposed [19]. Lead–acid batteries were selected as an energy storage system for the standalone hybrid windsolar system and a temperature control strategy was adopted to prevent the battery from low-temperature loss of the battery capacity. Energy management strategy of the power system was also proposed based on results of low-temperature characteristics of battery. The whole power system is broadly composed of 13 parts: (1) a power generator (wind turbines and PV array), (2) an uploading circuit, (3) a three-phase rectifier bridge, (4) an interleaved Buck circuit, (5) a DC/DC conversion circuit, (6) a switch circuit, (7) a power supply circuit, (8) an amplifier, (9) a driver circuit, (10) a voltage and current monitoring, (11) a load, (12) battery units, (13) a control system. A case study of the operational results of the standalone renewable energy system was examined to evaluate the technical feasibility and stability. Analysis of simulation operation results, emission reduction and costs and benefits of renewable energy applications in Antarctica were completed.
In these contexts, this paper focuses on exploring a standalone renewable energy system for Zhongshan Station. Section 2 describes the atmospheric conditions of the study area. Section 3 gives the results of the physical model, operation principle, and mathematical modeling of the power system. The results of the low-temperature characteristics of batteries are shown in Section 4. The energy management strategy of hybrid wind–solar system is given in Section 5. Section 6 introduces the design of the whole power system. The results of a case study of the hybrid wind–solar power system in Zhongshan Station are presented in Section 7. The conclusions are in final section.

2. Atmospheric Conditions of Zhongshan Station, East Antarctica

The meteorological data of Zhongshan Station were obtained from a manned weather station in 2015. Table 1 summarizes the various sensors used in the manned weather station. The weather station consists of a wind speed and wind direction detection sensor (Wind Monitor Model 05103-45, R.M.Young, Traverse City, MI, USA), a temperature and humidity sensor (HMP155A, Vaisala, Vantaa, Finland), an atmospheric pressure sensor (PTB110, Vaisala, Vantaa, Finland). The Wind Monitor sensor has a rugged and corrosion-resistant construction which is suitable for wind measuring applications in harsh environments. The four blade helicoid propeller of the wind speed sensor produces an AC sine wave voltage by rotation. The vane angle of the wind direction sensor is sensed by a precision potentiometer. The Wind Monitor sensor mounts on standard one-inch pipe. The temperature and humidity sensor has excellent stability and can withstand harsh environments. The temperature and humidity probe is protected with a sintered Teflon filter and a radiation shield, which can increase its lifetime by waterproofing, sandproofing and dustproofing. The atmospheric pressure sensor (PTB110) with the capacitive detection principle is a silicon capacitive absolute pressure sensor, which combines the outstanding elasticity characteristics and mechanical stability of single-crystal silicon.
The data of wind speed, wind direction, air temperature, relative humidity and air pressure measured by the weather station in Zhongshan Station from 1 December 2014 to 1 November 2015 are shown in Figure 1. The height of the wind speed and direction with respect to the ground is 10 m. During this period the mean wind speed was 9.8 m/s. The maximum and minimum values of wind speed were 35.9 m/s and 0 m/s, respectively (Figure 1a). The wind near Zhongshan Station was dominated by strong easterly winds, but there were westerly winds with lower wind speeds in February and March (Figure 1b). Surface winds at Zhongshan Station are generally consistent with the observations before. Air temperature of Zhongshan Station is shown in Figure 1c. The average air temperature was −11.18 °C. The maximum and minimum values of air temperature were 8.30 °C and −39.9 °C, respectively. The lowest air temperature occurred on 8 July 2015 and the highest was on 20 December 2014. The results of air temperature distribution are similar to the previous observations. The average relative humidity was 59.6%. The maximum and minimum values of relative humidity were 96% and 26%, respectively. The highest relative humidity occurred on 25 October 2015 and the lowest was on 26 November 2015. As shown in Figure 1d, Zhongshan Station has low relative humidity and dry air. The average atmospheric pressure was 982.4 hPa. The maximum and minimum values of atmospheric pressure were 1013.3 hPa and 942.3 hPa, respectively. The lowest atmospheric pressure occurred on 11 April 2015 and the highest was on 18 July 2015 (Figure 1e). The short-term variations in wind speed, wind direction, air temperature, relative humidity and atmospheric pressure were considerable, which can prove the complexity of the weather conditions at Zhongshan Station.
The multi-year average meteorological data are presented in Figure 2. The monthly average wind speed, radiation, day length, and air temperature in Figure 2 were obtained from the Atmospheric science data center of NASA. The monthly average wind speed from NASA and observed wind speed are shown in Figure 2a. The trend of wind speed from NASA is consistent with the observed results. For the multi-year average wind speed, the maximum and minimum wind speeds were 9.88 m/s in June and 7.5 m/s in January, respectively. The maximum and minimum monthly-observed wind speeds were 10.9 m/s in December and 4.8 m/s in February, respectively. The annual average wind speed from NASA was 9 m/s, which was similar to the annual observed result (9.78 m/s). The monthly average radiation and day length at Zhongshan Station are shown in Figure 2b. The radiation and day length decreased from January, and reached the minimum values at the same time (June). Then the radiation and day length continued to increase until December. The monthly mean radiation in May, June and July were 0.05 KW h/m2/day, 0.00 KW h/m2/day, 0.01 KW h/m2/day, respectively. Additionally, the monthly mean day lengths were 4.05 h, 0 h and 1.23 h, respectively. This phenomenon can indicate that polar night occurs from late May to late July in this region. The monthly mean radiation in January, November, and December were 6.05 KW h/m2/day, 4.97 KW h/m2/day, 6.69 KW h/m2/day, respectively. The monthly mean day lengths in January, November, and December were 24 h, 20.8 h and 24 h, respectively, which polar day lasts from late November to early February of the following year at Zhongshan Station. As can be seen from Figure 2c, the monthly average air temperature at Zhongshan Station exhibited obvious seasonal characteristics. The average yearly air temperature was −19 °C. The maximum and minimum monthly mean air temperature was −7.13 °C in January and −27.3 °C in July.
The weather condition of Zhongshan Station can be summarized as strong easterly winds, lower relative humidity, lower barometric pressure and cold air. The operating temperature range of the standalone renewable energy system in this study should be −50–30 °C based on the analysis of meteorological data at Zhongshan Station. Other meteorological elements should be taken into account during the design of the power supply system. Thus, in this study, the characteristics of power system at low temperatures should be considered and studied for achieve a long-term operation of research station in Antarctica.

3. System Design

3.1. Physical Model and Operation Principle

Based on the analysis of the atmospheric conditions, we designed the standalone renewable energy system. As shown in Figure 3, the proposed renewable energy system in this study is equipped with a power generator, an energy storage system, an end-user and a control station. The power generator consists of the PV arrays and wind turbines (WT), which can complete the conversion of wind energy and solar energy to electric energy. The energy storage system includes low-temperature batteries. The end-user is various loads at Zhongshan Station, which includes instruments for scientific research, electricity for daily use, heating, etc. The control station includes a control system, which has functions of controlling the process of charging and discharging of hybrid wind–solar power system. The rotation of wind turbines can produce AC currents. A three-phase rectifier circuit in the control system is designed to convert the three-phase alternating currents into stable direct currents. A DC chopper circuit is also designed to implement the control strategy for the renewable energy system to complete maximum power output. The control system is used to monitor voltage and current of PV and WT, battery voltage and charging current. This proposed system would be a reliable and sustainable energy supply and guarantee the load demand of Zhongshan Station for 24 h a day.

3.2. Mathematical Modeling of the Power System

3.2.1. PV Array

The polycrystalline panels were assembled by Taiyuan University of Technology in this study. The PV panels can be mainly divided into solar cells made of polymers, silicon materials, and sensitized nanomaterials [20] and silicon PV are mostly used. Advantages and disadvantages of different silicon solar cells are shown in Table 2.
As shown in Table 2, monocrystalline silicon solar cells and polycrystalline silicon solar cells have higher conversion efficiency and smaller size than amorphous silicon solar cells. The monocrystalline silicon solar cells and the polycrystalline silicon solar cells have different appearances due to different manufacturing processes. When assembled into PV panels, the monocrystalline silicon materials cannot be covered. In terms of efficiency of use, monocrystalline silicon solar cells and polycrystalline silicon solar cells are not much different, the former being 1%–2% more than the latter. Due to the different manufacturing processes used, the polycrystalline silicon solar cells are cheaper to produce than the monocrystalline silicon solar cells. Thus, the polycrystalline silicon solar cells are used in this study.
All the PV panels were designed to be positioned in a fixed direction, facing north. The key specifications of the PV panels are presented in Table 3.
A total of 350 PV panels can be used to form a 120 V, 105 KW PV array. The principle of power generation of solar cell is that the solar radiation emits photons to the induction plate of the photovoltaic cell to produce a photoelectric effect, causing internal electrons to move, thereby generating current. Equivalent circuit of the solar cell is shown in Figure 4.
According to equivalent circuit of the solar cell, relevant calculating equations are as follows:
I = I L I d I s h
I s h = I R s h + V R s h
The characteristics of the internal PN junction of the solar cell can be described as follows:
I d = I 0 { exp [ q ( I R s h + V ) λ K T 1 ] }
Substituting Equations (2) and (3) into Equation (1) for calculation, relevant calculating equation is as follows:
I = I L I 0 { exp [ q ( I R s h + V ) λ K T 1 ] } I R s h + V R s h
where I is the output current (A); IL is the photogenerated current (A); I0 is the diode saturation current (A); q is the unit charge (1.6022 × 10⁻¹⁹ C); Rsh is the series resistance (Ω); V is the output voltage (V); λ is the diode ideality factor; K is Boltzmann’s constant (1.3806 × 10⁻²³ J/K); T is the cell temperature (K).
In this study, we use the following equations to describe the relationship between output of solar power and radiation intensity [4]:
{ P s o l a r = P max [ 1 0.004 ( T T s t c ) ] β i β i = i β 1 β 2 β 3
where Psolar is the output of solar power (Wh/day); Pmax is the maximum power at standard test conditions (300 W); T is the ambient temperature (°C); Tstc is the ambient temperature at standard test conditions (25 °C); βi is the adjustment parameter, which i is the average radiation intensity (KW h/m2/day), β1 is the soiling losses factor 0.97, β2 is the non-MPPT point coefficient 0.96, β3 is the anti reverse diode coefficient 0.98.

3.2.2. Wind Turbine

The wind turbine designed and assembled by Taiyuan University of Technology was employed in this study. The key specifications of the wind turbine are presented in Table 4.
Ten wind turbines can be used to form a 100 KW wind farm. Different types of wind turbines output different power based on their power curve characteristics. Through a comprehensive literature review, a model used to describe the performance is proposed as follows [19].
{ P w i n d = P 1 + P 2 + P 3 P 1 = P R t ( v / v R ) 3 ( v c v v R ) P 2 = P R t ( v R v v F ) P 3 = 0 ( v < v c   a n d   v > v R )
where Pwind is the output of wind power (Wh/day), which consists of P1, P2 and P3; Vc is the cut-in wind speed (2.5 m/s); VR is the rated wind speed (10 m/s); VF is the cut-off wind speed (45 m/s); V is the wind speed; PR is the rated electrical power (10 KW), which is average energy at the wind speed of 10 m/s for one minute; t is the time (hours).

3.3. Zhongshan Station Load Data

The load of Zhongshan Station can be divided into: (1) The first type of load is the internal heating system. Once the heating system is not working properly, it will affect the normal life of all the staff of Zhongshan Station and the lives of all personnel will be threatened. Thus, such loads cannot be cut off. (2) The second type of load is electricity for scientific research equipment. There is a lot of scientific research equipment installed in Zhongshan Station to monitor the climate, biochemistry, crustal changes, and movement of Antarctica in real time and obtain valuable on-site observation data. A power outage of equipment may lead to the discontinuity of observations and the lack of integrity of data. Thus, we need to ensure the continuous supply of electricity of scientific research equipment. (3) The third type of load is electricity for daily use. Such loads include electricity for lighting, recreational activities, electronics, etc., where necessary, such loads may be considered for power outages.

4. Analysis of Energy Storage System

At present, most of the wind–solar hybrid power generation systems use secondary batteries that can be repeatedly charged and discharged as energy storage systems, and the electrical energy can be converted into chemical energy for storage. When using electrical energy, the stored chemical energy of batteries can be turned into electrical energy. When we choose a suitable energy storage device, the capacity of the energy storage device and its charge and discharge performance are mainly considered. The battery with high conversion efficiency and low loss is suitable for the design of the standalone renewable energy system. In addition, the maintenance cost and life of the battery should be also key factors in the design. Commonly used batteries include lead–acid batteries, nickel–hydrogen batteries, nickel–cadmium batteries, lithium–ion batteries and sodium–sulfur batteries [20]. The key performance comparisons of each battery are presented in Table 5.
It can be seen from Table 5 that the operating temperature ranges of lead–acid battery and lithium–ion battery are more suitable than other batteries for the requirements of this system. Compared with lead–acid batteries, lithium–ion batteries have certain safety hazards and lithium–ion batteries cost more than lead–acid batteries. Thus, the lead–acid battery is selected to design energy storage system.
A lead–acid battery consists of an electrolyte, positive and negative electrodes. Pb is used as the negative active material of lead–acid batteries, PbO2 can be the positive active material, and the electrolyte is diluted H2SO4. The energy conversion principle of lead-acid batteries can be expressed by the following chemical reaction equations.
P b O 2 + H 2 S O 4 + P b D i s c h arg e P b S O 4 + 2 H 2 O
P b S O 4 + 2 H 2 O C h arg e P b O 2 + H 2 S O 4 + P b
Equations (7) and (8) can describe the discharge and charging process of the lead–acid battery, respectively. In the process of discharge, Pb on the negative electrode is oxidized to become PbSO4, and PbO2 on the positive electrode is reduced to form PbSO4. Diluted H2SO4 in the surrounding area as an electrolyte participates in chemical reactions, forming PbSO4 while producing H2O.
In the process of charge, PbSO4 on the negative electrode is reduced to form Pb and PbSO4 on the positive electrode is oxidized to become PbO2. The concentration of H2SO4 in the surrounding area gradually recovers. The charging process of the lead–acid battery is not finished until PbSO4 of the positive and negative electrodes is completely reduced to Pb and PbO2.
In the process of charge and discharge of lead–acid batteries, the terminal voltage can be expressed as the following equations.
U = E + Δ φ + + Δ φ + I R
U = E Δ φ + Δ φ I R
Equations (9) and (10) represent the change in terminal voltage during the charging and discharging processes, respectively. U is the terminal voltage of the lead–acid battery (V); E is the electromotive force of batteries; Δϕ+ is the overpotential of positive electrode (V); Δϕ- is the overpotential of negative electrode (V); I is the charge or discharge current (A); R is the internal resistance of the battery (Ὠ).
The life of the battery directly determines the time when the power supply system runs stably. This lead–acid batteries used in this power system were developed by Taiyuan University of Technology. Based on the principles of battery array combination, the battery of 2 V, 3 KAh is extended and the battery pack of 60 V, 45 KAh is used as the energy storage device of the power system.

4.1. Study on Low-Temperature Characteristics of Battery

The activity of the electrolyte of the lead–acid battery is easily affected by low temperatures, resulting in a decrease in battery capacity. The power supply system operating in Antarctica requires a long-term constant temperature treatment of energy storage system. Reasonable storage temperature needs to be determined, so as to reduce the energy consumption caused by maintaining the constant temperature as much as possible. Thus, a study on battery characteristics at low temperatures was designed and implemented.
In order to study the low-temperature characteristics of lead–acid batteries, a battery capacity calibration experiment was designed. A low-temperature test chamber (MDF-86V340E, Zhongkeduling, Hefei, Anhui, China) was used to provide stable low-temperature environments from −50 °C to 0 °C. The key specifications of the low-temperature test chamber are presented in Table 6.
The ideal capacity of the battery to be tested is 2 V, 3 KAh under a normal temperature environment. The battery was discharged at a constant current of 15 A at different ambient temperatures from −50 °C to 0 °C. In addition, the battery capacity at different ambient temperatures can be obtained. The battery voltages were measured by an oscilloscope (MSO70404C, Tektronix, Beaverton, OR, USA). The discharge cut-off voltage was set as 1.6 V. The interval for the experimental temperature change was set to 10 °C. We obtained the correlation between battery capacity and voltage at −50 °C, −40 °C, −30 °C, −20 °C, −10 °C and 0 °C. At each ambient temperature, the battery continued to discharge at a constant current until the cutoff voltage was reached. During the experiment, the low-temperature test chamber could maintain the temperature. We took the average values of the voltage to minimize the statistical error and uncertainty. As the temperature decreased, the battery capacity also decreased. The standstill battery capacities were 98.42%, 98.11%, 97.62%, 96.77%, 95.83% and 94.12% at 0 °C, −10 °C, −20 °C, −30 °C, −40 °C, −50 °C, respectively. The discharge capacity of the battery was weakening due to low temperatures. Therefore, the storage temperature of the battery needs to be kept above 0 °C to avoid the low-temperature loss of the battery capacity.

4.2. SOC Estimation

Usually, the battery state of charge and the remaining useful life are considered as two important parameters to quantify and monitor the present battery state. In this study, long-term low temperature is the main factor affecting the battery capacity and the remaining useful life. References [21,22] have reported joint/dual extended Kalman filter and unscented Kalman filter with an enhanced self-correcting model, which can simultaneously estimate the SOC and capacity. The SOC estimation in this study is realized based on study on low-temperature characteristics of battery. The relationship between battery voltage and battery capacity at low temperatures is shown in Figure 5.
The mathematical model of the relationship between battery voltage and battery capacity at different temperatures can be expressed as follows.
{ U 50   ° C = 5.5 × 10 8 × SOC 50   ° C 6 2.51 × 10 5 × SOC 50   ° C 5 + 4.72 × 10 3 × SOC 50   ° C 4 0.471 × SOC 50   ° C 3 + 26.24 × SOC 50   ° C 2 711.8 × SOC 50   ° C + 9362.2 U 40   ° C = 2.9 × 10 8 × SOC 40   ° C 6 1.36 × 10 5 × SOC 40   ° C 5 + 2.58 × 10 3 × SOC 40   ° C 4 0.261 × SOC 40   ° C 3 + 14.64 × SOC 40   ° C 2 434.1 × SOC 40   ° C + 5306.9 U 30   ° C = 1.3 × 10 8 × SOC 30   ° C 6 6.04 × 10 6 × SOC 30   ° C 5 + 1.15 × 10 3 × SOC 30   ° C 4 0.116 × SOC 30   ° C 3 + 6.487 × SOC 30   ° C 2 192.4 × SOC 30   ° C + 2353.8 U 20   ° C = 1.5 × 10 8 × SOC 20   ° C 6 6.82 × 10 6 × SOC 20   ° C 5 + 1.31 × 10 3 × SOC 20   ° C 4 0.132 × SOC 20   ° C 3 + 7.508 × SOC 20   ° C 2 244.2 × SOC 20   ° C + 2760.1 U 10   ° C = 8.0 × 10 9 × SOC 10   ° C 6 3.72 × 10 6 × SOC 10   ° C 5 + 7.13 × 10 4 × SOC 10   ° C 4 0.072 × SOC 10   ° C 3 + 4.098 × SOC 10   ° C 2 122.4 × SOC 10   ° C + 1508.8 U 0   ° C = 4.66 × 10 9 × SOC 0   ° C 6 2.13 × 10 6 × SOC 0   ° C 5 + 4.01 × 10 4 × SOC 0   ° C 4 0.0401 × SOC 0   ° C 3 + 2.229 × SOC 0   ° C 2 25.5895 × SOC 0   ° C + 797.2
where U−50°C, U−40°C, U−30°C, U−20°C, U−10°C and U0°C are the battery voltages at −50 °C, −40 °C, −30 °C, −20 °C, −10 °C, 0 °C, respectively; SOC−50°C, SOC−40°C, SOC−30°C, SOC−20°C, SOC−10°C and SOC0°C are the values of state of charge at −50 °C, −40 °C, −30 °C, −20 °C, −10 °C, 0 °C, respectively.
We evaluated the relationship between battery voltage and battery capacity from −50 °C to 0 °C. However, the values at the non-measured battery voltage and battery capacity could be predicted by interpolation. Equation (11) can be described as follows.
U ( T i ) = a ( T i ) S O C 6 ( T i ) + b ( T i ) S O C 5 ( T i ) + c ( T i ) S O C 4 ( T i ) + d ( T i ) S O C 3 ( T i ) + e ( T i ) S O C 2 ( T i ) + f ( T i ) S O C ( T i ) + g ( T i )
where U(Ti) is the battery voltages at different temperatures from −50 °C to 0 °C; SOC(Ti) is the battery capacity at different temperatures from −50 °C to 0 °C; a(Ti), b(Ti), c(Ti), d(Ti), e(Ti), f(Ti), and g(Ti) are the coefficients of the Equation (12), which have dependences of low temperatures.
The coefficients a(Ti), b(Ti), c(Ti), d(Ti), e(Ti), f(Ti) and g(Ti) from −50 °C to 0 °C are shown in Figure 6.
As shown in Figure 6, the temperature dependence of the coefficients of a(Ti), b(Ti), c(Ti), d(Ti), e(Ti), f(Ti) and g(Ti) is generally in the form of a cubic functions. The coefficients a(Ti), b(Ti), c(Ti), d(Ti), e(Ti), f(Ti) and g(Ti) in Equation (12) at different temperatures could be predicted as follows.
{ a ( T i ) = 9.96 × 10 13 T i 3 4.8 × 10 11 T i 2 9.28 × 10 10 T i + 4.27 × 10 9 b ( T i ) = 4.52 × 10 10 T i 3 + 2.19 × 10 8 T i 2 + 4.28 × 10 7 T i 1.96 × 10 6 c ( T i ) = 8.46 × 10 8 T i 3 4.11 × 10 6 T i 2 8.17 × 10 5 T i + 3.69 × 10 4 d ( T i ) = 8.41 × 10 6 T i 3 + 4.1 × 10 4 T i 2 + 8.25 × 10 3 T i 0.037 e ( T i ) = 4.66 × 10 4 T i 3 0.023 T i 2 0.4657 T i + 2.066 f ( T i ) = 0.0137 T i 3 + 0.675 T i 2 + 13.8716 T i 60.908 g ( T i ) = 0.1654 T i 3 8.2046 T i 2 170.3108 T i + 741.803

4.3. Temperature Control Strategy

Based on the analysis on Section 4.1 and Section 4.2, the storage temperature of the battery needs to be kept above 0 °C to prevent the battery from low-temperature loss of the battery capacity. The heating system in the battery storage compartment ensures that the temperature of the battery can be constant within the ideal operating temperature range and reduces energy consumption by means of intermittent starting. The proportion-integral-differential (PID) algorithm was chosen to design the temperature control strategy.
The chosen heating system is a complex system with larger time lag and inertia. The mathematical model of the temperature control system in this study is described by a first-order inertia lag link. The transfer function of the heater can be expressed as follows.
G ( s ) = k e τ s / ( T s + 1 )
where k is static gain; T is time constant; τ is pure lag time.
This study uses an incremental PID control algorithm. A step input signal is applied to the controlled object to measure the step response of the controlled object, and the approximate transfer function of the controlled object can be obtained by the flying up curve method. Parameters of the transfer function can be seen in Table 7.
The flowchart of the temperature control strategy is given in Figure 7.
After the PID was initialized, the target temperature for battery storage Ta was set first and then the real-time temperature of battery storage Tr was obtained. Generally, Ta is set to be higher than 0 °C. If Ta < Tr, the battery storage temperature could be considered suitable. If Ta > Tr, the heating system will be started and the difference between the target temperature for battery storage Ta and the real-time temperature of battery storage Tr will calculated, which is marked as e. If e < 3, the incremental PID control algorithm will be used to heat the battery storage room. If e > 3, the full power heating will be activated to quickly reach the target temperature for battery storage. After heating, the difference between Ta and Tr will be evaluated again. If TaTr, the heating system will end the heating of the battery storage compartment.

5. Energy Management Strategy

5.1. MPPT Control Strategy for Wind Turbine

Perturbation and observation method with variable step is used to achieve maximum power output of the wind turbine by adjusting the duty ratio. The method needs to estimate the position of the current maximum power point by real-time monitoring of the power difference between the two times, thereby determining the size of the duty cycle. If the difference is positive, the duty cycle will be decreased. Otherwise, the duty cycle will be increased. If it is zero, it indicates that the maximum power point has been reached. Since the wind speed in nature is randomly fluctuating, it may cause the power supply system to oscillate. Two step sizes are proposed in this study. The threshold of the power difference is set. If the difference is within the threshold, a small step will be used. If the difference is outside the threshold, a large step will be used to gradually approach the maximum power point.
The mechanical energy produced by the wind turbine in this study can be expressed as follows.
P W T = 1 2 C p ( λ , β ) S σ v 3
where PWT is the output of wind turbine (W); Cp(λ, β) is wind energy utilization factor; λ is tip speed ratio; β is pitch angle of blade; S is sweep area (m2); σ is air density (Kg/m3); v is wind speed (m/s).
The sweep area of wind turbine can be described as follows.
P W T = 1 2 C p ( λ , β ) S σ v 3
where R is the impeller radius (m).
The wind energy utilization factor can be described as follows.
C p ( λ , β ) = 0.5176 ( 116 λ c 0.4 β 5 ) e 21 λ c + 0.0068 λ
λ and λc in Equation (16) can be described as follows.
{ λ = ω R v = 2 π n R 60 v λ c = 1 λ + 0.08 β 0.035 β 3 + 1
where ω is wind turbine angular velocity (rad/s); n is rotational speed of wind turbine (r/min).
In the study of the MPPT strategy of the wind turbine, β (pitch angle of blade), v (wind speed) and ω (wind turbine angular velocity) are set as input to the wind turbine power generation model. Air density is selected as 0.927 Kg/m3. β is 0 in this study. For wind speed v, we built a natural wind speed model. The wind speed model is considered as a combination of basic wind speed Vb, gradual wind speed Vr, and gust wind speed Vg. The basic wind speed Vb is the average wind speed (7 m/s). The gradual wind speed Vr characterizes the slow change of the wind speed and can be expressed by follows.
V r = V r ( max ) t r 1 t t r 1 t r 2
where Vr(max) is maximum value of gradual wind speed (10 m/s); tr1 is start time of gradual wind (4 s); tr2 is end time of gradual wind (11 s); t is time of gradual wind.
The gust wind speed Vg can characterize the degree of abrupt change in wind speed and can be expressed by follows.
V g = V g ( max ) / 2 × [ 1 cos 2 π ( t t g 1 T g ) ]
where Vg(max) is maximum value of gust wind speed (6 m/s); tr1 is start time of gust wind (3 s); Tg is period of gust wind (6 s); t is time of gust wind.
The model of natural wind speed can be described as follows.
v = V b + V r + V g
We introduced the natural wind model into the wind power model, and the simulation results obtained by MATLAB Simulink of the wind speed, wind turbine output power and rotational speed of wind turbine are shown in Figure 8.
As can be seen in Figure 8a, at the beginning, the wind speed was low (about 2–5 m/s), thus the output power of the wind turbine was also low (Figure 8b). From 4 s to 6 s, the wind speed increased rapidly from the beginning of 2 m/s to 17 m/s, and the corresponding wind turbine output power was gradually increased, which the maximum power can reach 13 kW. After the 8 s, the wind speed began to slowly decrease and the output power decreased slowly. We also simulated the effects of abrupt wind speeds on wind turbine output power at 6 m/s, 8 m/s and 10 m/s (Figure 9). Under the influence of abrupt wind, the response time of wind turbine speed and power is less than 0.14 s.

5.2. MPPT Control Strategy for PV Array

Perturbation and observation method with adaptive variable step is adopted, which achieves self-selection of the step size by adding an adaptive algorithm when setting the step size. This method not only improves the steady state performance of the power system, but also improves the dynamic performance. The step size calculation can be described as follows.
S ( k + 1 ) = N P ( k ) P ( k 1 ) S ( k )
where S(k) is step size (0 < S(k) < 1); N is the constant determined by the sensitivity of the adaptive variable step size adjustment; P(k) is power.
The flowchart of the perturbation and observation method with adaptive variable step is given in Figure 10.
The perturbation and observation method with adaptive variable step obtained I(k − 1), I(k), U(k − 1) and U(k) to calculate P (k − 1) and P(k). We got the value of difference of power dP (Figure 10). The threshold of the power difference (ep) was set. The direction of perturbation can be determined by calculating dP-ep. Then the step size S(k + 1) can be adjusted by Equation (21). Until dP = 0, the maximum power point can be considered to be reached.

5.3. Power Supply Strategy

The prerequisite for stable operation of the wind–solar hybrid power system is to maintain the energy balance between power generation and power consumption. If the power converted by wind and solar is less than the actual load, the battery plays the role to supply power to the load. On the contrary, if the power converted by wind and solar is greater than the actual load, the battery stores excess electrical energy. The flowchart of the power supply strategy is given in Figure 11.
After the energy assessment, three energy supply methods were selected: (1) Wind energy available; (2) Wind and solar energy available; (3) Solar energy available. After the SOC estimation was completed, whether the output power of the generator (wind turbine and PV array) can meet the load was calculated and evaluated. In all three energy supply methods, when the energy output is greater than the load, the output power of the generator can supply the load. If SOC < 90%, the output power of the generator should charge the battery. Otherwise, the battery does not need to be charged. When the energy output is less than the load, as long as SOC is greater than 10%, the battery and the power generator can directly provide the power of the load. If SOC < 10%, the power supply of a part of the load should be cut off to ensure the power generator and the battery providing power to the remaining load.

6. Circuit Design

The block diagram of the standalone renewable energy system is illustrated in Figure 12. As can be easily seen, the whole system is broadly composed of a power generator (wind turbines and PV array), an uploading circuit, a three-phase rectifier bridge, an interleaved Buck circuit, a DC/DC conversion circuit, a switch circuit, a power supply circuit, an amplifier, a driver circuit, a voltage and current monitoring, a load, battery units, and a control system. The electric energy generated by the wind turbine converts into direct current through the three-phase rectifier bridge, and concentrates with the electric energy generated by the photovoltaic power generator. Then the electric energy generated by the wind energy and the solar energy are converted into stable direct currents to loads and the battery units by the interleaved Buck circuit. The wind turbine side is designed with an unloading circuit to prevent excessive output power from damaging the equipment under high wind conditions. The bus voltage is 24 V and the battery voltage is 12 V, thus, a DC/DC conversion circuit is designed. The model’s parameters of circuits were chosen by empirical and commercial general specifications, which is a common method in circuit design.

6.1. Control System

In this study, the core of control system is selected as MSP4305438A (Texas Instruments, Dallas, TX, USA). The microcontroller is a reduced instruction set computer (RISC) with a 16-bit mixed-signal processor, which has a high processing power, a fast computing speed and an efficient development environment. The microcontroller can operate stably in a low-temperature environment (−50 °C) and was used multiple times in monitoring in Antarctica and the Arctic Ocean [4]. The control system has 11 sets of I/O ports, which can monitor the voltage and current of wind turbine, PV array and batteries in real time, and realizes the control strategy of the power system. Terminal names and general descriptions of the electrical interface of the control system are shown in Table 8.

6.2. DC/DC Conversion Circuit and Power Supply Circuit

The DC/DC conversion circuit and power supply circuit are shown in Figure 13. In this study, the DC/DC conversion circuit can provide better stability to the proposed power system over wide ranges of input and output voltages, and enable more stable and accurate current limiting operation. A thermal shutdown in this circuit is implemented to prevent damages owing to excessive heat.
The output voltage of DC/DC conversion circuit can be set by external resistors and the resistors are calculated as follows.
R 2 = V r e f / 70 μ A
R 3 = R 2 ( 12 / V r e f 1 )
where R2 and R3 are external resistors; Vref is the reference voltage set inside the circuit (1.238 V). The resistances of R2 and R3 are 18 KΩ and 156 KΩ, respectively. Other relevant parameters of the DC/DC conversion circuit can be seen in Table 9.
The power supply circuit includes a primary voltage-regulator and a secondary voltage-regulator. Primary voltage-regulator is designed by LT1129 (Analog Devices Inc., Norwood, MA, USA), which can generate 3.3 V at supply of 12 V for MCU, some sensors and some detection circuits in this power system. LM78M05 (Texas Instruments, Dallas, TX, USA) is selected as the core of the secondary voltage-regulator, which can generate 5 V at supply of 12 V to fulfill the requirements of the amplifier. Relevant parameters of the power supply circuit can be seen in Table 10.

6.3. Charging Circuit

The solar/wind charging circuit is shown in Figure 14. The three-phase input of wind turbine converts AC to DC through a three-phase rectifier bridge, and mixes with the input of the PV array. In this circuit, freewheeling diodes are replaced to reduce rectification losses and the current sharing effect is significantly enhanced. The electric energy generated by wind and solar is very unstable. The electric energy is converted into a stable and usable DC through the interleaved Buck circuit. The choice of MOS tube considers the following elements: (1) Withstand voltage greater than or equal to 3 times DC bus voltage; (2) The current value is less than 1/4 of the rated current; (3) Low on resistance.
As shown in Figure 14, MOSFET RU190N08 (Ruichips Semiconductor, Shenzhen, Guangdong, China) is selected as the power device of the interleaved Buck circuit, which has a withstand voltage of 80 V and a withstand current of 190 A. Relevant parameters of the power supply circuit can be seen in Table 11.
The inductance of interleaved Buck circuit can be obtained as follows.
L B u c k = V 0 ( 1 D ) / ( r I L f s )
where LBuck is the inductance of interleaved Buck circuit; V0 is DC bus voltage (24 V); D is the minimum duty cycle of the PWM control method (0.57); r is inductor current ripple peak-to-peak factor (0.4); IL is inductor rated current (40 A); fs is switching frequency of PWM control signal (20 KHz). Thus the inductance of interleaved Buck circuit LBuck is 32 μH.

7. A case Study in Antarctica

7.1. Existing Power Supply System in Zhongshan Station

At present, there are three sets of diesel generator in Zhongshan Station. In the process of power generation, the on-duty personnel should be arranged to record and maintain the relevant parameters of the generators. Based on the data provided by the Chinese National Antarctica Research Expeditions, we aggregated the data of the existing diesel power supply system at Zhongshan Station in Antarctica in 2013, 2014 and 2015. The average monthly power supply and monthly fuel consumption of Zhongshan Station are obtained. The actual monthly load power and fuel consumption are shown in Figure 15.
As can be seen from Figure 15, the annual power consumption of Zhongshan Station is closely related to climatic conditions. The trend of monthly load power has a good correlation with the monthly average air temperature. The peak annual power consumption of Zhongshan Station is concentrated in May, June, July and August. At this time, it is the winter and polar night in Antarctica, which the air temperature in these months is the lowest in one year. However, scientists would continue to conduct scientific investigations near Zhongshan Station. At the same time, the outside temperature is low and the demand of indoor heating is increasing. Therefore, the power consumption of Zhongshan Station will also increase. As shown in Figure 2b, the annual radiation intensity and day lengths are the lowest in this period. The power supply of Zhongshan Station mainly depended on the wind turbine and the battery. Zhongshan Station has a total load of 100 KW. The monthly average power consumption is 72,516 KW h, the monthly average fuel consumption is above 20 t. Polar day occurs from December to January in Zhongshan Station, and it can make full use of solar power to generate electricity. The power consumption of the load in February, March, April, September, October, and November basically maintain the average power consumption of Zhongshan Station, which both wind and solar energy resources can generate electricity, and batteries have electricity reserves.

7.2. Analysis of Simulation Operation Results

The power generation of the standalone renewable energy system in Zhongshan Station from 2014 to 2015 is presented in Figure 16.
The results of Zhongshan Station load were previous monitoring data. The power generated by wind energy and solar energy was calculated by mathematical models of the standalone renewable energy system. If the power generated by the standalone renewable energy system cannot meet the requirement of load, the battery will act as an energy storage system to supply the load of the Zhongshan Station to maintain the normal operation. Accordingly, battery capacity can be also derived from the simulation. The observed wind speed data were selected to complete simulation calculation. The values of radiation intensity from NASA were used to calculate power generation by PV array. As can be seen in Figure 16, the monthly average load of Zhongshan Station remained basically stable within one year. The annual load of Zhongshan Station was 870,196 KW h. The minimum and maximum values of the load were 56,175 KW h in November and 87,743 KW h in July, respectively. The average value of the load of Zhongshan Station was 72,516 KW h. Wind power production dominated the power supply of the standalone renewable energy system and generated 747,858.4 KW h in a year, which was 86% of the load. The monthly average maximum and minimum values of wind power were 74,400 KW h in March, May, July, August, October and 8455.4 KW h in January. In March, April, October and November, only the energy generated by wind can meet the load of Zhongshan Station. The solar power was shown strong seasonal fluctuations owing to the polar night (June and July) in Antarctica. The annual solar power of Zhongshan Station was 97,361 KW h. The monthly average solar power of polar day in January and December were larger, which were 19,659.9 KW h and 21,779.7 KW h, respectively. The minimum value of monthly average solar power in a year appeared in June (0 KW h) and July (34 KW h). In January, February, May, June and July, wind and solar energy were less than the load required for the month, thus, the energy storage system also provided power to the load.
Especially in August, the sum of the power of wind, solar, and battery (75,712.83 KW h) was less than the load (82,938 KW h), and fuel was used to complete the power supply (7225.17 KW h) to the load.

7.3. Analysis of Emission Reduction

Analysis of cost and benefits may be susceptible to external factors, such as changing fuel purchase prices, the cost fluctuation of transporting fuel and etc. In Antarctica, the analysis of cost and benefits may encounter various complicated situations. The risk of oil spill in transport, atmospheric emissions, or hidden cost of maintenance requirements can rarely achieve comprehensive monetization. However, direct cost savings are in reduced use of fossil fuels. Based on the result of a one-year simulation operation of the standalone renewable energy system in Zhongshan Station, it is found that fuel was used to complete the power supply to the load only in August. The monthly fuel consumption of Zhongshan Station is shown in Table 12.
The existing power supply system of the Antarctic Zhongshan Station has a fuel consumption of 241.33 t per year. The results of simulation operation of the standalone renewable energy system indicate that fuel consumption can be reduced to 2.08 t. The standalone renewable energy system has provided an average annual fuel saving of around 98.8%. Refer to the operation results of Australia’s Mawson Station, which is similar in size to Zhongshan Station, Mawson Station used about 0.7 million liters of diesel fuel annually to provide power and heating. Through the introduction of renewable energy supply, the annual fuel saving of Mawson Station was around 32%, equivalent to a saving of 2918 t of carbon dioxide during the first six years of operation [10]. The estimated annual carbon dioxide emissions of existing power supply system of the Antarctic Zhongshan Station were 616.4 t and Zhongshan Station’s estimated annual carbon dioxide emissions were 5.3 t in the year of simulation, which can reduced carbon emissions by 611.1 t in one year and 3666.6 t of carbon dioxide during the first six years of operation.
The use of the standalone renewable energy system will improve the health of the local environment and reduce the cost of environmental governance.

7.4. Costs and Benefits of Renewable Energy Applications in Antarctica

Mawson Station has built a wind farm which costs about 8.9 million Australian dollars. The cost of a wind turbine was 0.74 million Australian dollars. Undiscounted simple payback period of the wind farm in Antarctica is estimated to be from 5 to 12 years. For South Pole Station, the project of installing nine 100 KW wind turbines was estimated to cost approximately 4.3 million US dollars. In McMurdo Station, a 1 MW wind turbine has cost 2–3 million US dollars. Net savings of this project remain 1–4 million US dollars over a 20-year life span. Similarly, SANAE IV Station of South Africa has installed a 100 KW turbine with a simple undiscounted payback period of about 10 years. The simple undiscounted payback period of PV system is shorter than wind turbine. For example, a solar thermal system at SANAE IV Station has a payback period of 6 years by saving 10,000 L fuel annually. In the preliminary research stage of the standalone renewable energy system in Zhongshan Station, it is hard to accurately estimate cost savings after the introduction of renewable energy. However, based on the cost savings estimate of other stations, the use of the standalone renewable energy system was estimated to save approximately 1.43 million US dollars in one year.

8. Conclusions

In this study, the standalone renewable energy system used in Zhongshan Station was proposed to achieve long-term stable operation. The meteorological data of Zhongshan Station obtained from a manned weather station in 2015 was comprehensively analyzed. Based on the atmospheric conditions and load data of Zhongshan Station, the physical model, operation principle and mathematical modeling of the proposed power system were designed in this study. The low-temperature performance and characteristics of energy storage system were tested and evaluated. The characteristics of battery and SOC estimation method were also present. To prevent the battery from low-temperature loss of the battery capacity, a temperature control strategy was adopted to keep the storage temperature of the battery above 0 °C. Energy management strategy of the power system was proposed, including a MPPT control strategy for wind turbine and PV array and a power supply strategy. The whole power system is broadly composed of a power generator (wind turbines and PV array), an uploading circuit, a three-phase rectifier bridge, an interleaved Buck circuit, a DC/DC conversion circuit, a switch circuit, a power supply circuit, an amplifier, a driver circuit, a voltage and current monitoring, a load, battery units and a control system. The simulation calculation of power generation of the standalone renewable energy system was presented in this study. Zhongshan Station’s estimated annual carbon dioxide emissions were 5.3 t in the year of simulation, which can reduce carbon emissions by 611.1 t in one year and 3666.6 t of carbon dioxide during the first six years of operation. Based on the cost savings estimation of other stations, the use of the standalone renewable energy system was estimated to save approximately 1.43 million US dollars in one year. The results of simulation calculation reveal that the proposed power system can satisfy the power demands of Zhongshan Station in normal operation.
In this study, the proposed power system does not realize completely environmentally friendly operation during its lifecycle because of use of lead–acid batteries and a small amount of fuel. In future work, a more environmentally friendly energy storage system needs to be designed and adopted, such as pumped energy storage, flywheel energy storage, etc. More renewable energy harvesting systems can be used to collect wave energy, temperature and salinity difference energy in Polar Regions. The power generator and the energy storage system need slightly adjusted to achieve 100% environmentally friendly power generation. More works on using advanced sizing methods will be realized to choose power of the photovoltaic array, wind turbine and battery capacity more reasonable.

Author Contributions

Conceptualization, G.Z.; methodology, Y.D.; software, G.Z.; validation, G.Z.; formal analysis, Y.D.; investigation, Y.C.; writing—original draft preparation, G.Z.; funding acquisition, Y.D., X.C.

Funding

This research was funded by the National Key Research and Development Program of China, grant number 2016YFC1400303, 2016YFC1402702.

Acknowledgments

The authors would like to thank the Chinese National Antarctica Research Expeditions for supporting our work in Antarctica. Comments from the anonymous reviewers and the editor are also gratefully appreciated.

Conflicts of Interest

The authors declare no conflict of interest.

References

  1. Rothrock, D.A.; Percival, D.B.; Wensnahan, M. The decline in arctic sea-ice thickness: Separating the spatial, annual, and interannual variability in a quarter century of submarine data. J. Geophys. Res. Oceans 2008, 113, C05003. [Google Scholar] [CrossRef]
  2. Perovich, D.K.; Grenfell, T.C.; Light, B. Transpolar observations of the morphological properties of Arctic sea ice. J. Geophys. Res. 2009, 114, C00A04. [Google Scholar] [CrossRef]
  3. Haas, C.; Hendricks, S.; Eicken, H. Synoptic airborne thickness surveys reveal state of Arctic sea ice cover. Geophys. Res. Lett. 2010, 37. [Google Scholar] [CrossRef] [Green Version]
  4. Zuo, G.Y.; Dou, Y.K.; Chang, X.M. Design and Application of a Standalone Hybrid Wind–Solar System for Automatic Observation Systems Used in the Polar Region. Appl. Sci. 2018, 8, 2736. [Google Scholar] [CrossRef]
  5. Borowy, B.S.; Salameh, Z.M. Optimum photovoltaic array size for a hybrid wind/PV system. IEEE Trans. Energy Convers. 1994, 9, 482–488. [Google Scholar] [CrossRef]
  6. Deshmukh, M.K.; Deshmukh, S.S. Modeling of hybrid renewable energy systems. Renew. Sustain. Energy Rev. 2008, 12, 235–249. [Google Scholar] [CrossRef]
  7. Bilal, B.O.; Sambou, V.; Ndiaya, P.A. Optimal design of a hybrid solar–wind-battery system using the minimization of the annualized cost system and the minimization of the loss of power supply probability (LPSP). Renew. Energy 2010, 35, 2388–2390. [Google Scholar] [CrossRef]
  8. Diaf, S.; Diaf, D.; Belhamel, M. A methodology for optimal sizing of autonomous hybrid PV/wind system. Energy Policy 2007, 35, 1303–1307. [Google Scholar] [CrossRef]
  9. Dihrab, S.S.; Sopian, K. Electricity generation of hybrid PV/wind systems in Iraq. Renew. Energy 2010, 35, 1303–1307. [Google Scholar] [CrossRef]
  10. Tin, T.; Sovacool, B.; Blake, D. Energy efficiency and renewable energy under extreme conditions: Case studies from Antarctica. Renew. Energy 2010, 35, 1715–1723. [Google Scholar] [CrossRef]
  11. Obara, S.; Morizane, Y.; Morel, J. A study of small-scale energy networks of the Japanese Syowa Base in Antarctica by distributed engine generators. Appl. Energy 2013, 111, 113–128. [Google Scholar] [CrossRef]
  12. Ghoddami, H.; Delghavi, M.B.; Yazdain, A. An integrated wind-photovoltaic-battery system with reduced power-electronic interface and fast control for grid-tied and off-grid applications. Renew. Energy 2012, 45, 128–137. [Google Scholar] [CrossRef]
  13. Sreeraj, E.S.; Chatterjee, K.; Bandyopadhyay, S. Design of isolated renewable hybrid power systems. Sol. Energy 2010, 84, 1124–1136. [Google Scholar] [CrossRef]
  14. Gunasekaran, M.; Ismail, H.M.; Chokkalingam, B. Energy Management Strategy for Rural Communities’ DC Micro Grid Power System Structure with Maximum Penetration of Renewable Energy Sources. Appl. Sci. 2018, 8, 585. [Google Scholar] [CrossRef]
  15. Vasiliev, M.; Alameh, K.; Nur-E-Alam, M. Spectrally-Selective Energy-Harvesting Solar Windows for Public Infrastructure Applications. Appl. Sci. 2018, 8, 849. [Google Scholar] [CrossRef]
  16. Akinyele, D.; Belikov, J.; Levron, Y. Battery Storage Technologies for Electrical Applications: Impact in Stand-Alone Photovoltaic Systems. Energies 2017, 10, 1760. [Google Scholar] [CrossRef]
  17. Carroquino, J.; Bernal-Agustín, J.; Dufo-López, R. Standalone Renewable Energy and Hydrogen in an Agricultural Context: A Demonstrative Case. Sustainability 2019, 11, 951. [Google Scholar] [CrossRef]
  18. Gabrielli, P.; Gazzani, M.; Martelli, E. Optimal design of multi-energy systems with seasonal storage. Appl. Energy 2018, 219, 408–424. [Google Scholar] [CrossRef]
  19. Ma, T.; Yang, H.X.; Lu, L. Technical feasibility study on a standalone hybrid solar-wind system with pumped hydro storage for a remote island in Hong Kong. Renew. Energy 2014, 69, 7–15. [Google Scholar] [CrossRef]
  20. Argyrou, M.; Christodoulides, P.; Kalogirou, S. Energy storage for electricity generation and related processes: Technologies appraisal and grid scale applications. Renew. Sustain. Energy Rev. 2018, 94, 804–821. [Google Scholar] [CrossRef]
  21. Wang, Y.J.; Zhang, C.B.; Chen, Z.H. A method for joint estimation of state-of-charge and available energy of LiFePO4 batteries. Appl. Energy 2014, 135, 81–88. [Google Scholar] [CrossRef]
  22. Dong, G.Z.; Chen, Z.H.; Wei, J.W. An online model-based method for state of energy estimation of lithium-ion batteries using dual filters. J. Power Sources 2016, 301, 277–286. [Google Scholar] [CrossRef]
Figure 1. Time series of hourly (a) wind speed, (b) wind direction, (c) air temperature, (d) relative humidity and (e) air pressure obtained by the manned weather station at Zhongshan Station, Antarctica.
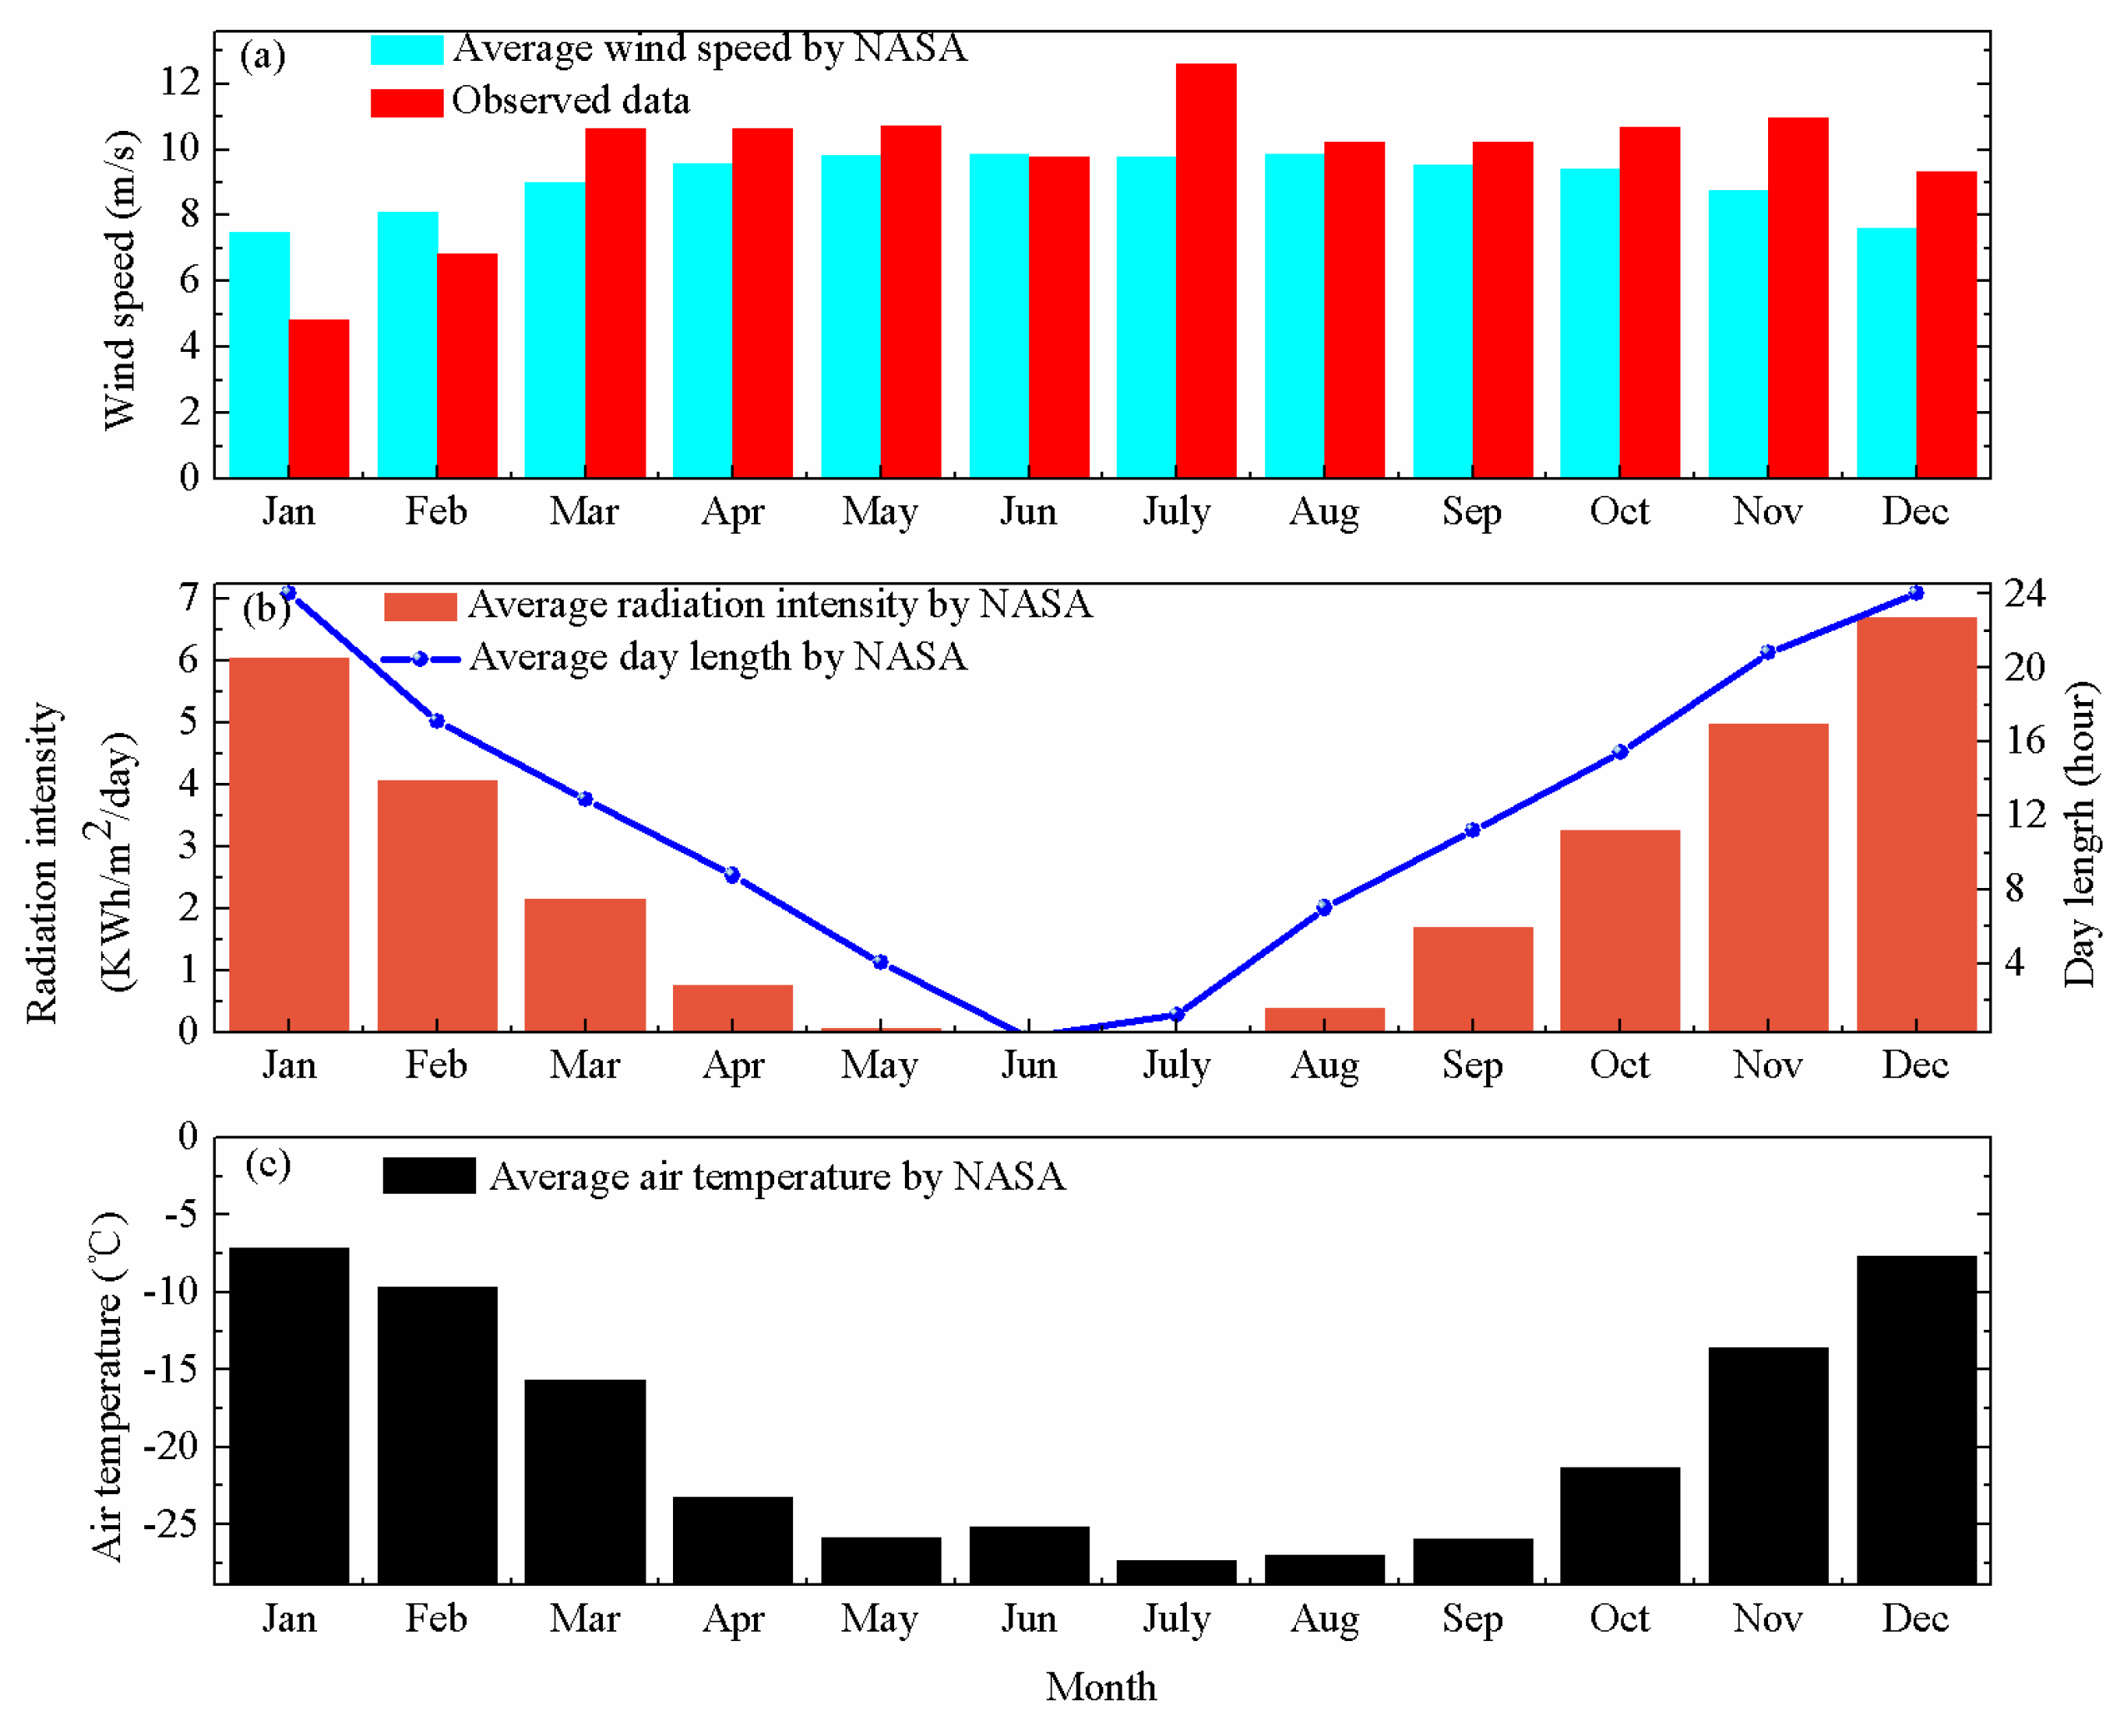
Applsci 09 01968 g001
Figure 2. The monthly meteorological data of Zhongshan Station. (a) wind speed, (b) solar radiation and day length, (c) air temperature.
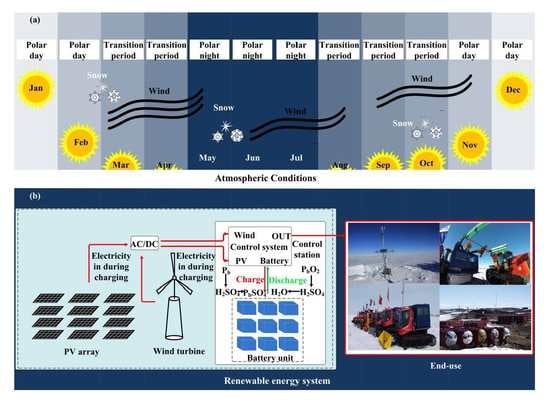
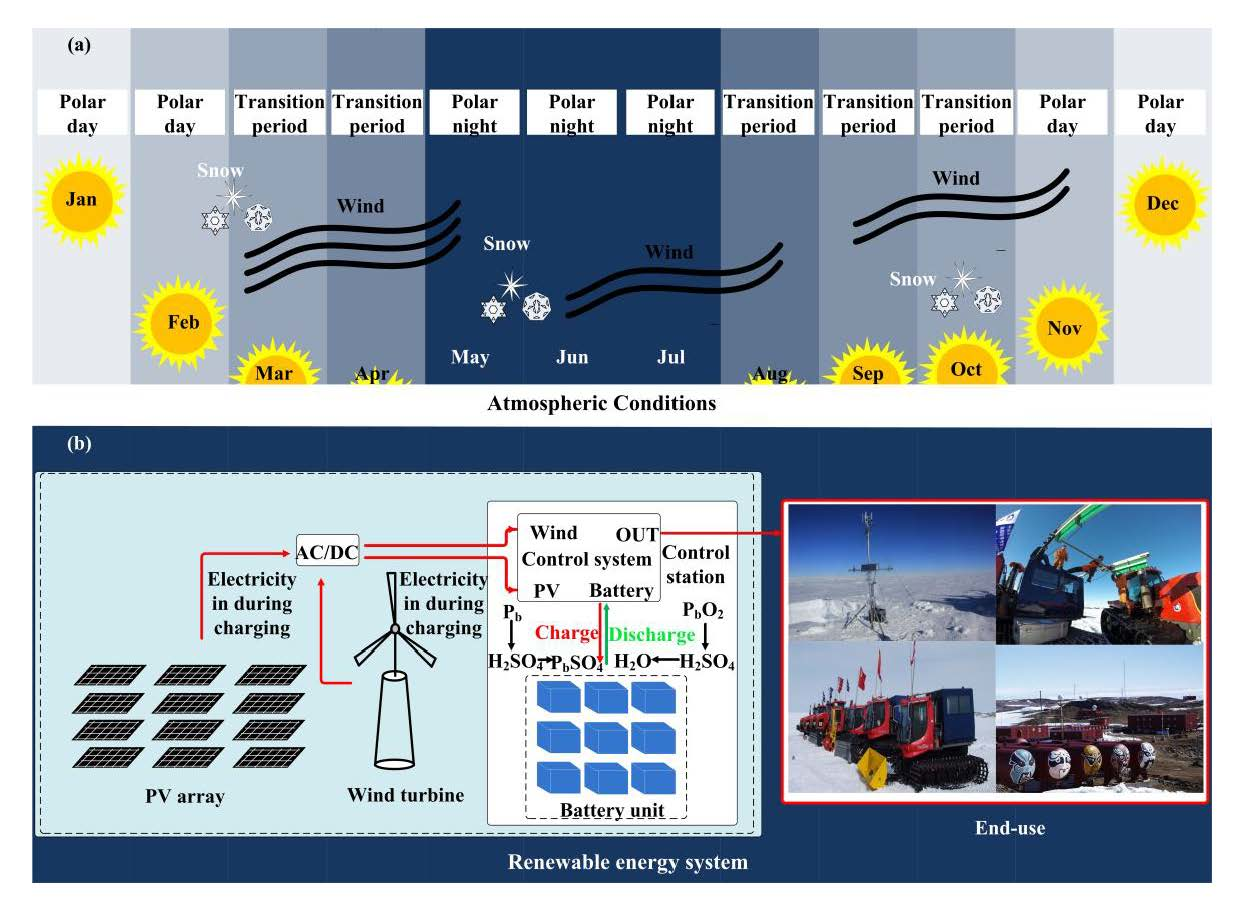
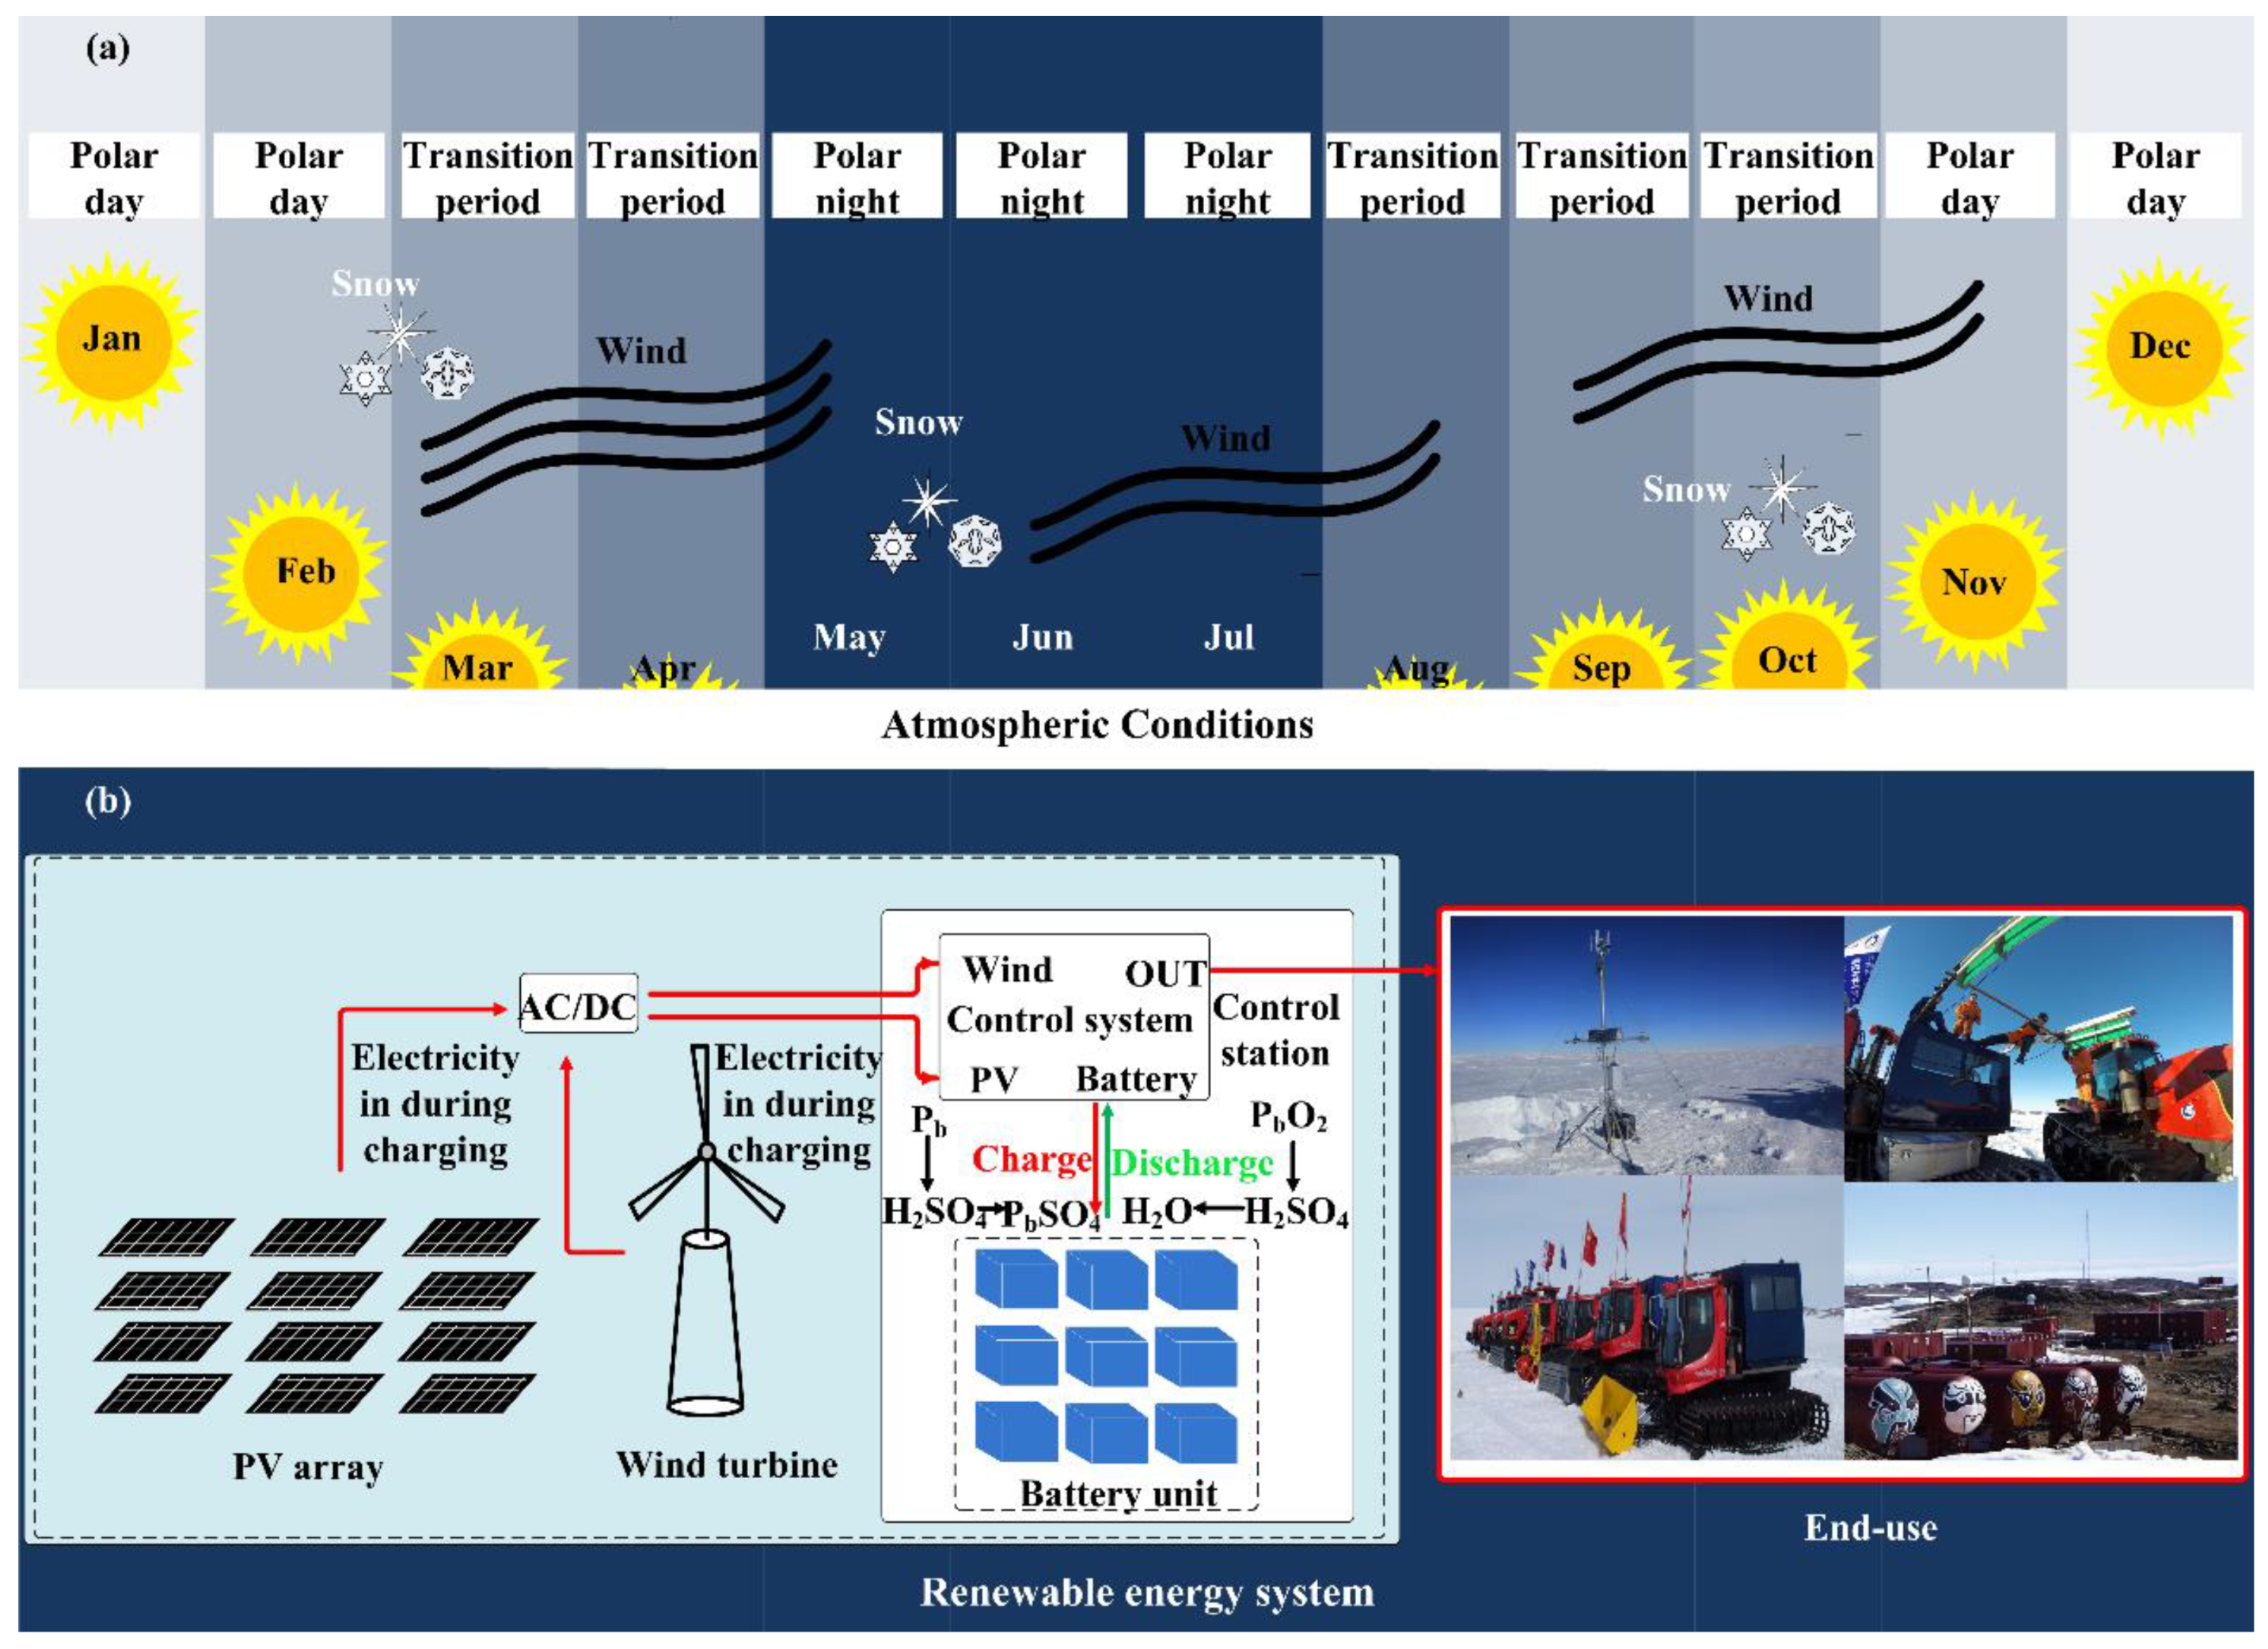
Applsci 09 01968 g002
Figure 3. (a) Atmospheric conditions, (b) Schematic of the renewable energy system.
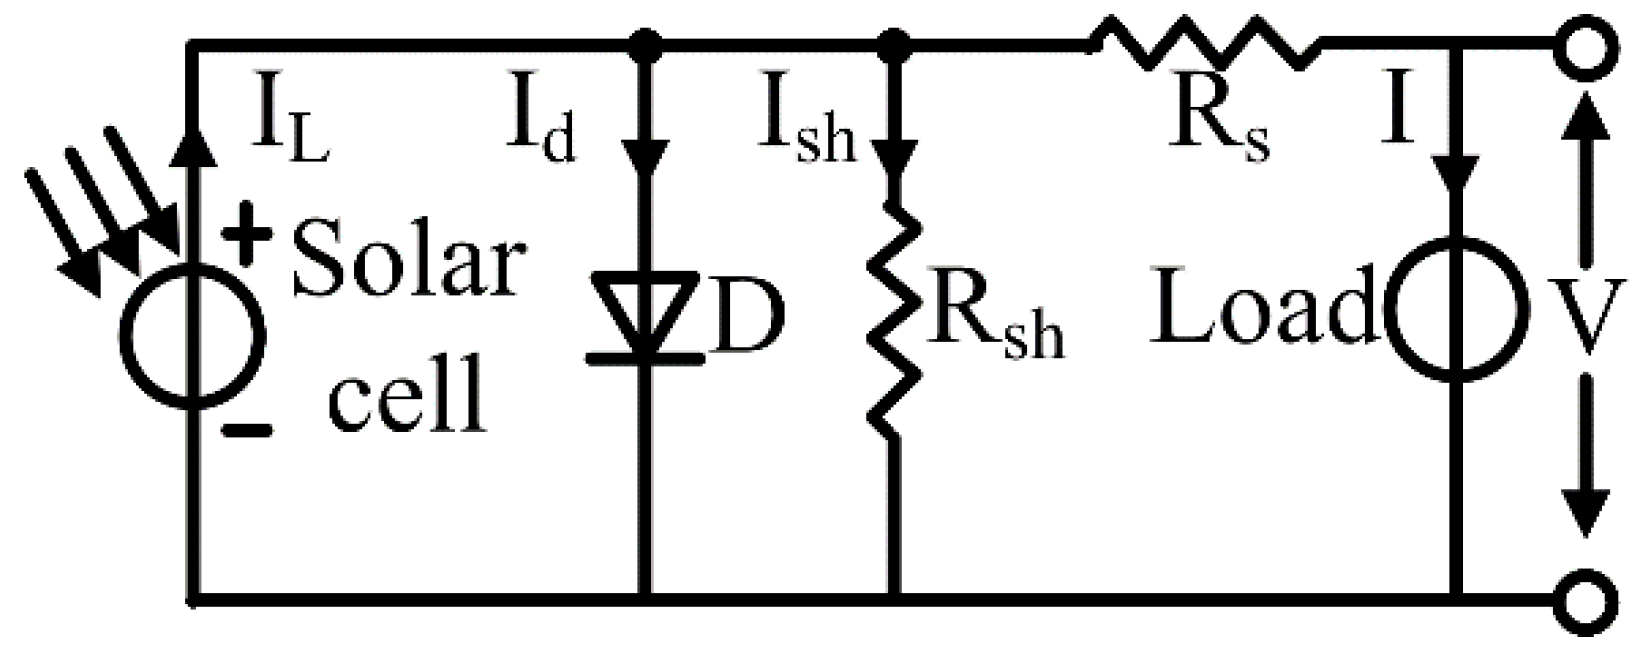
Applsci 09 01968 g003
Figure 4. Equivalent circuit of the solar cell.
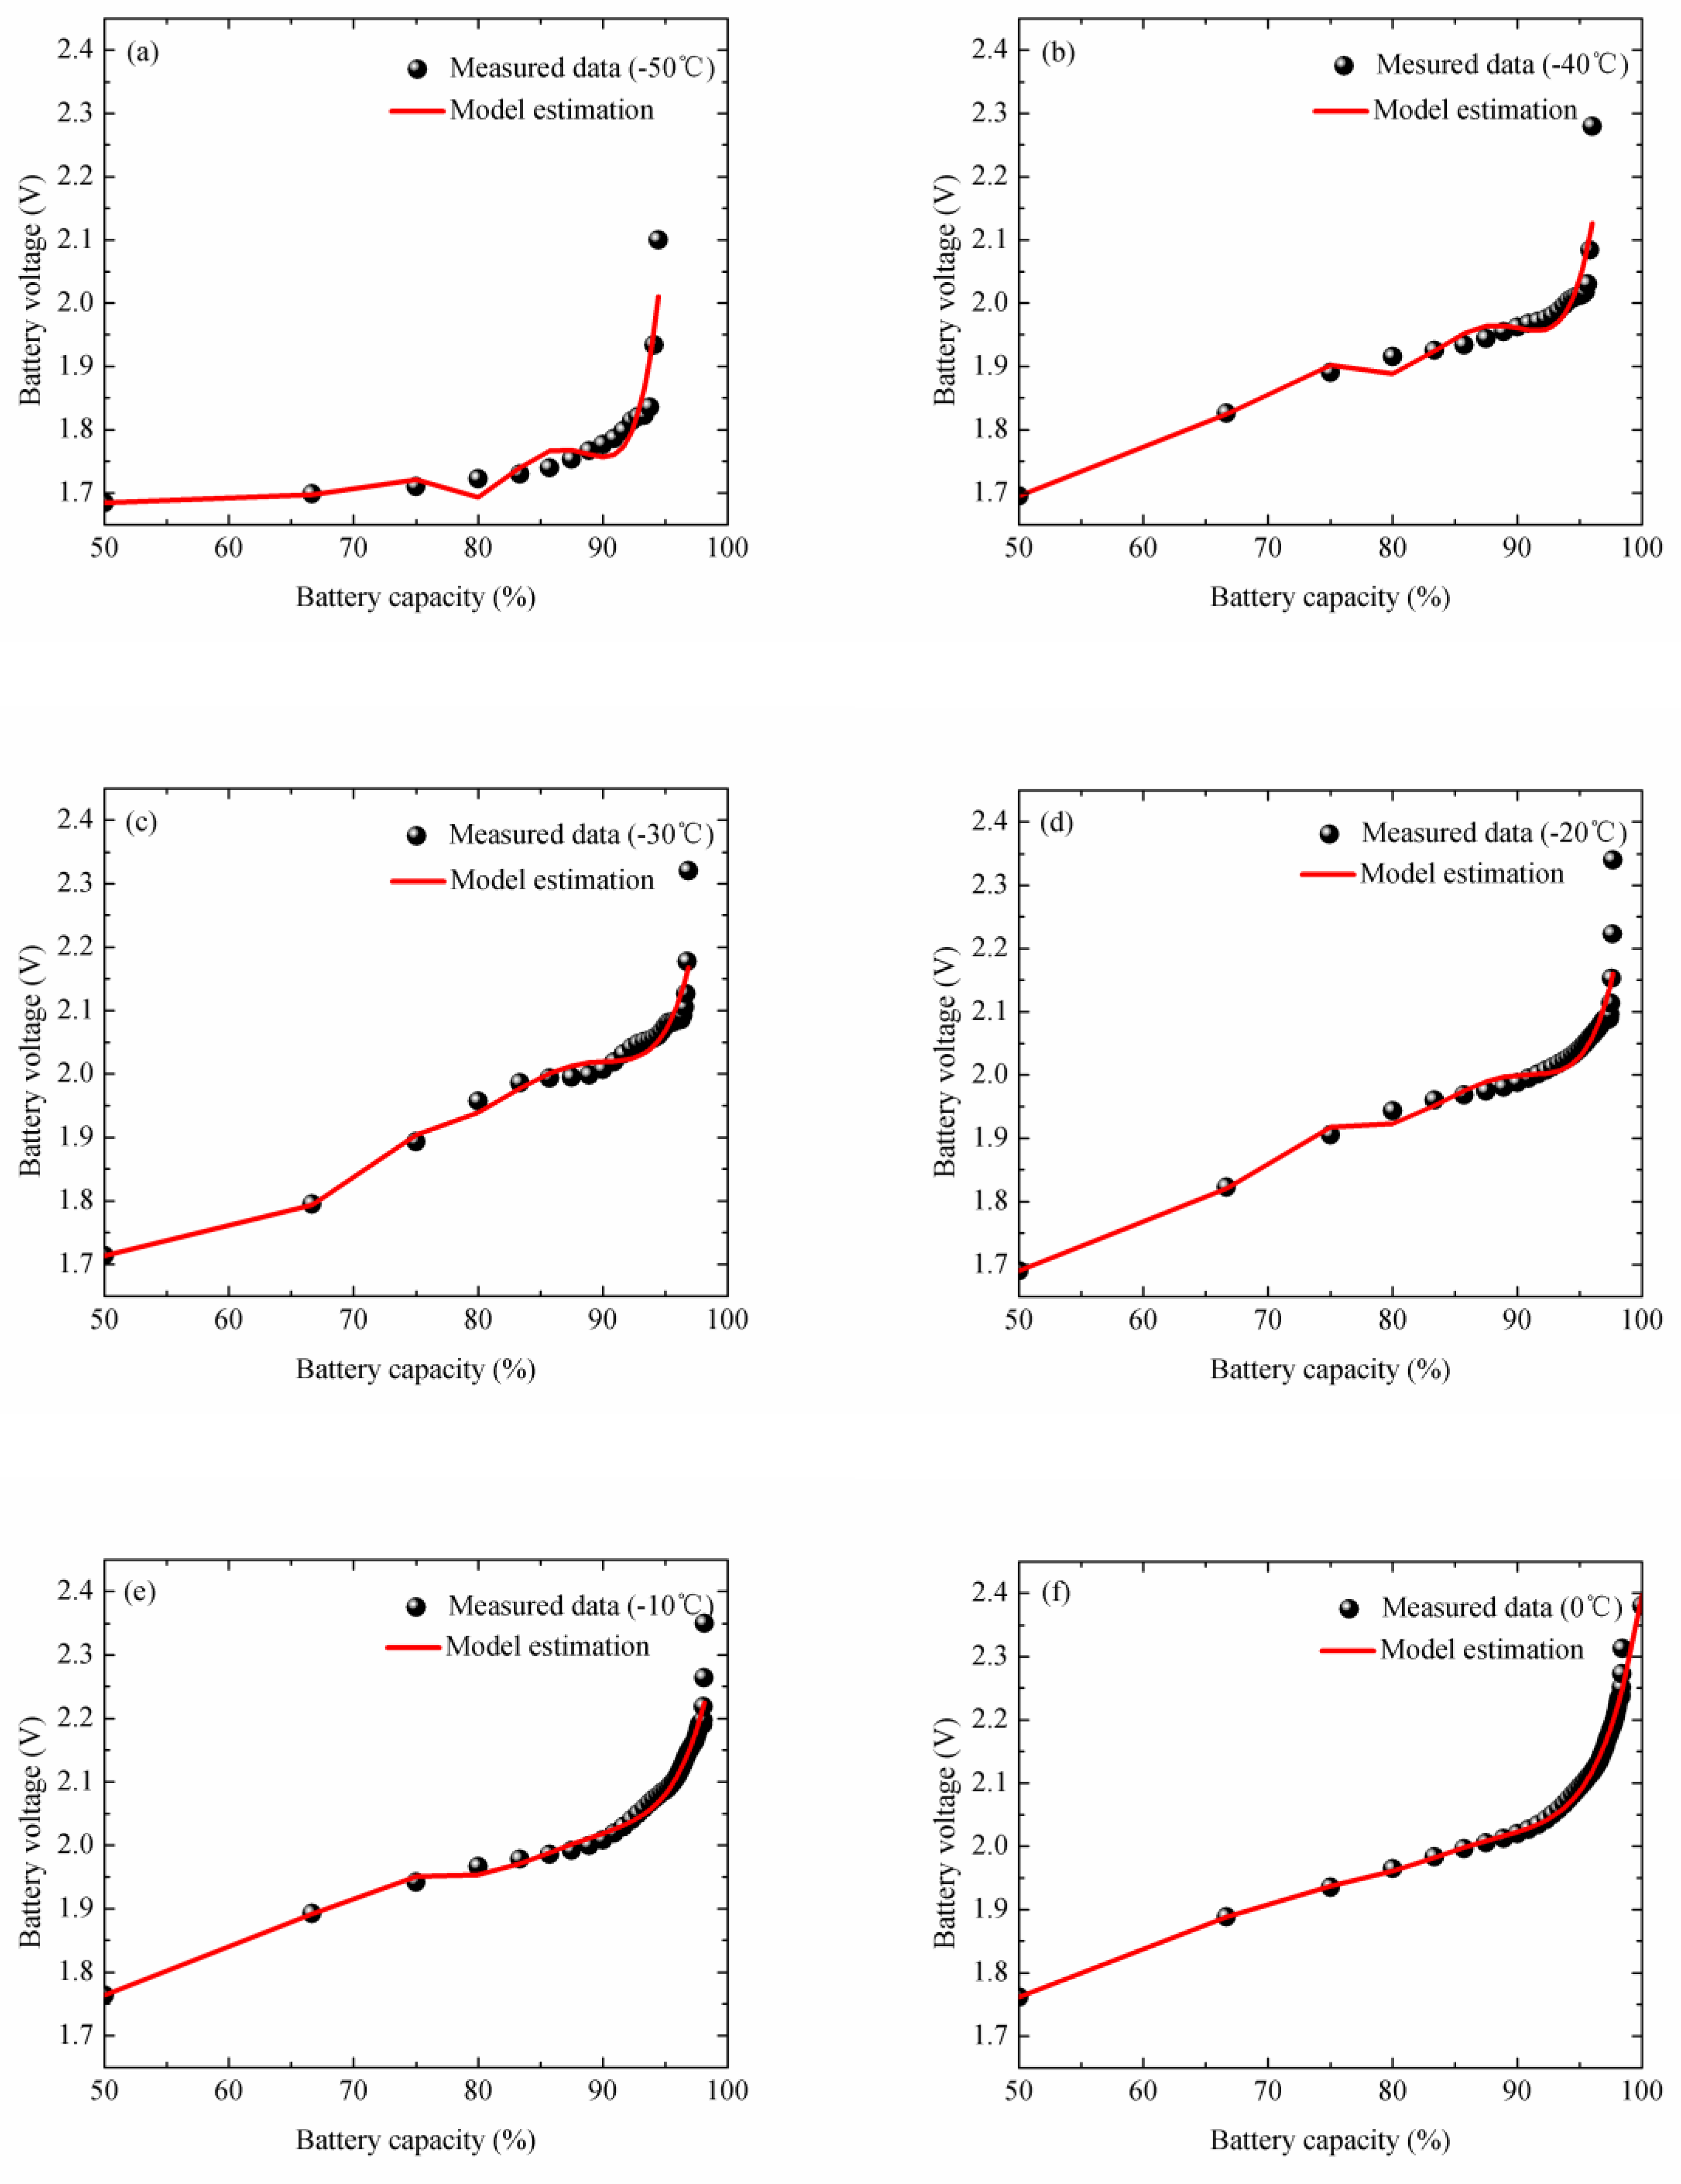
Applsci 09 01968 g004
Figure 5. (af) show the relationship between battery voltage and battery capacity at −50 °C, −40 °C, −30 °C, −20 °C, −10 °C, 0 °C, respectively.
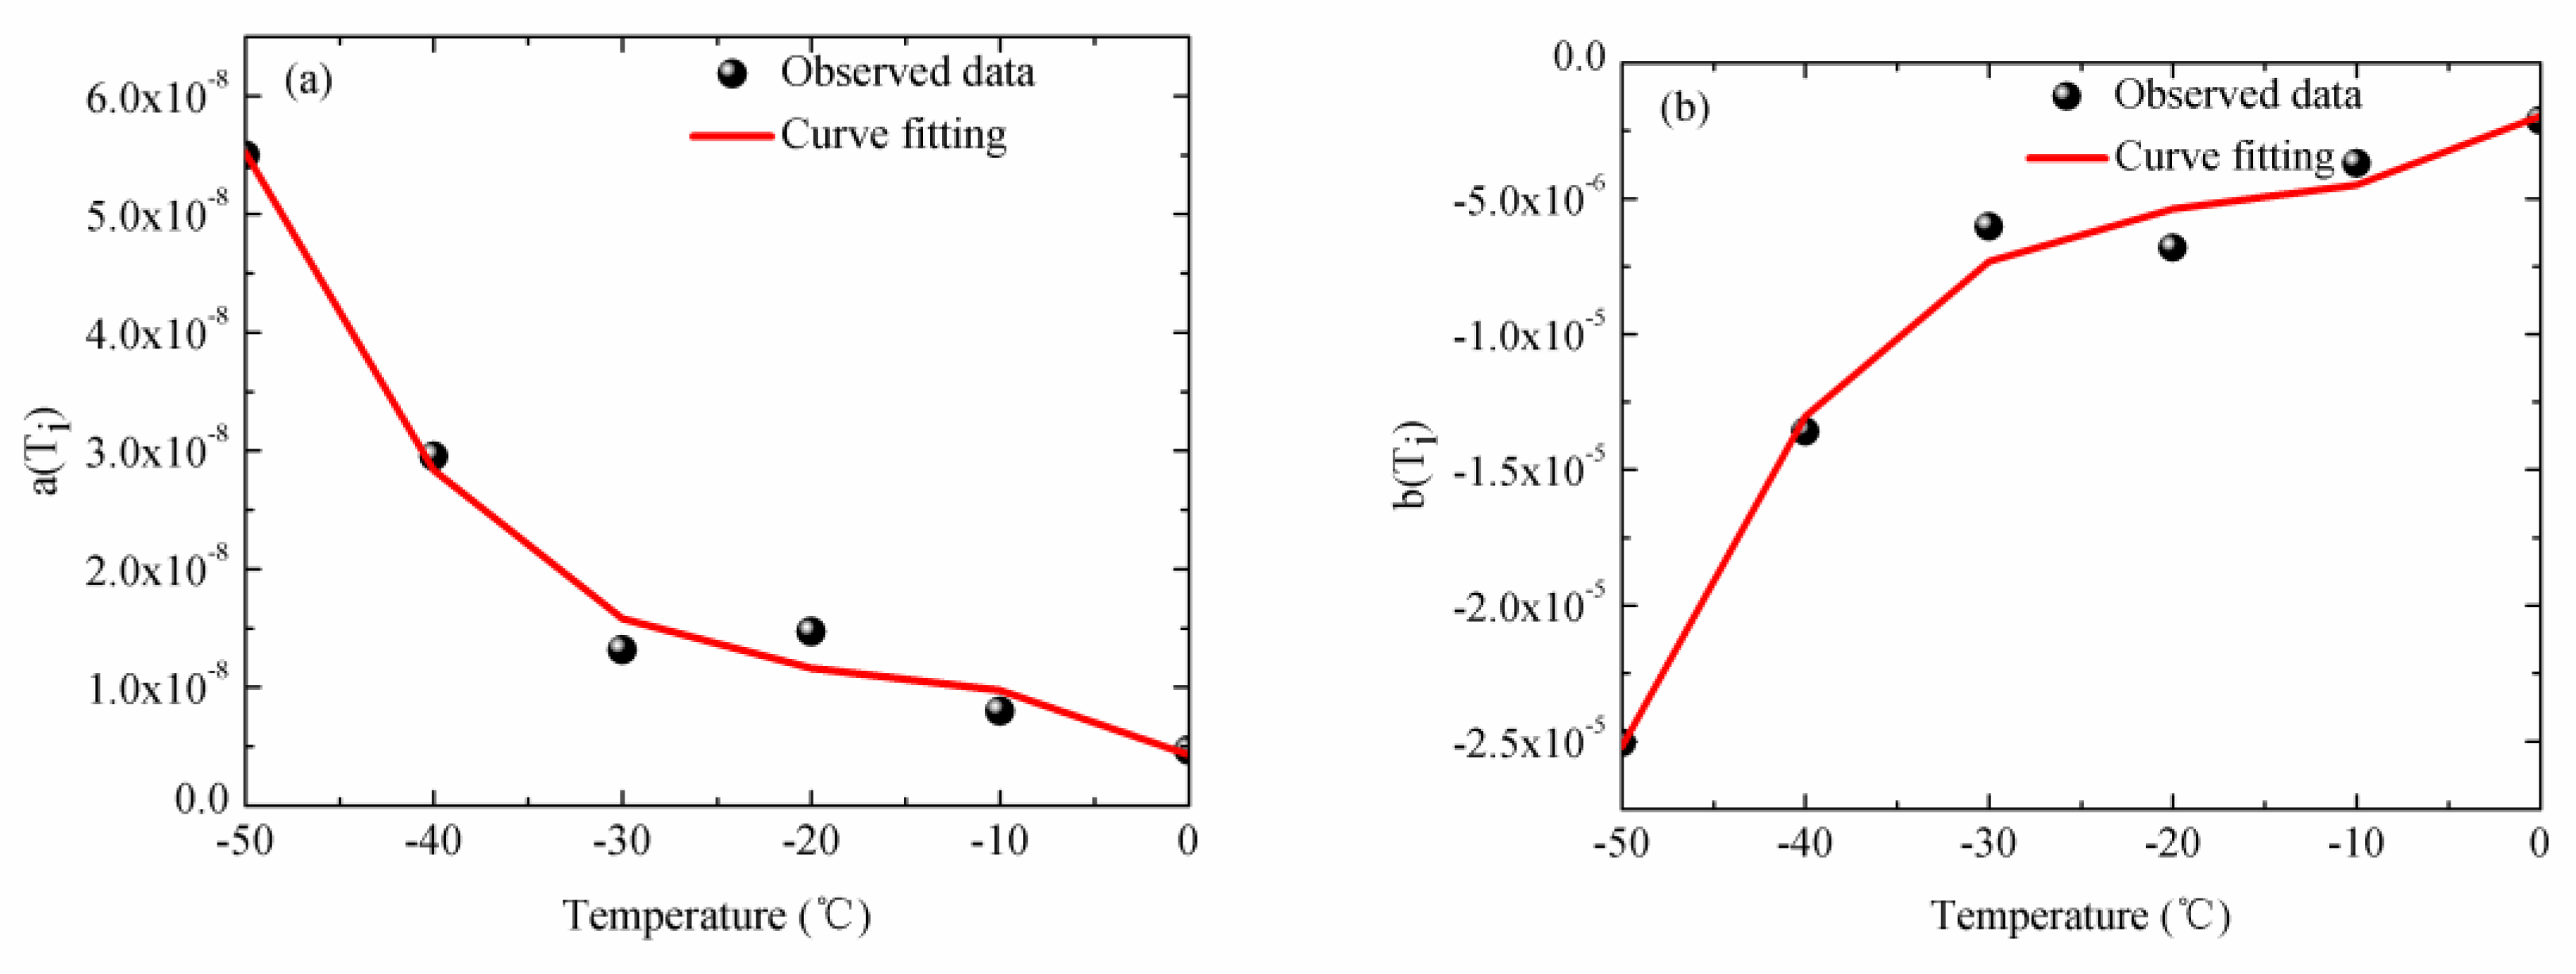
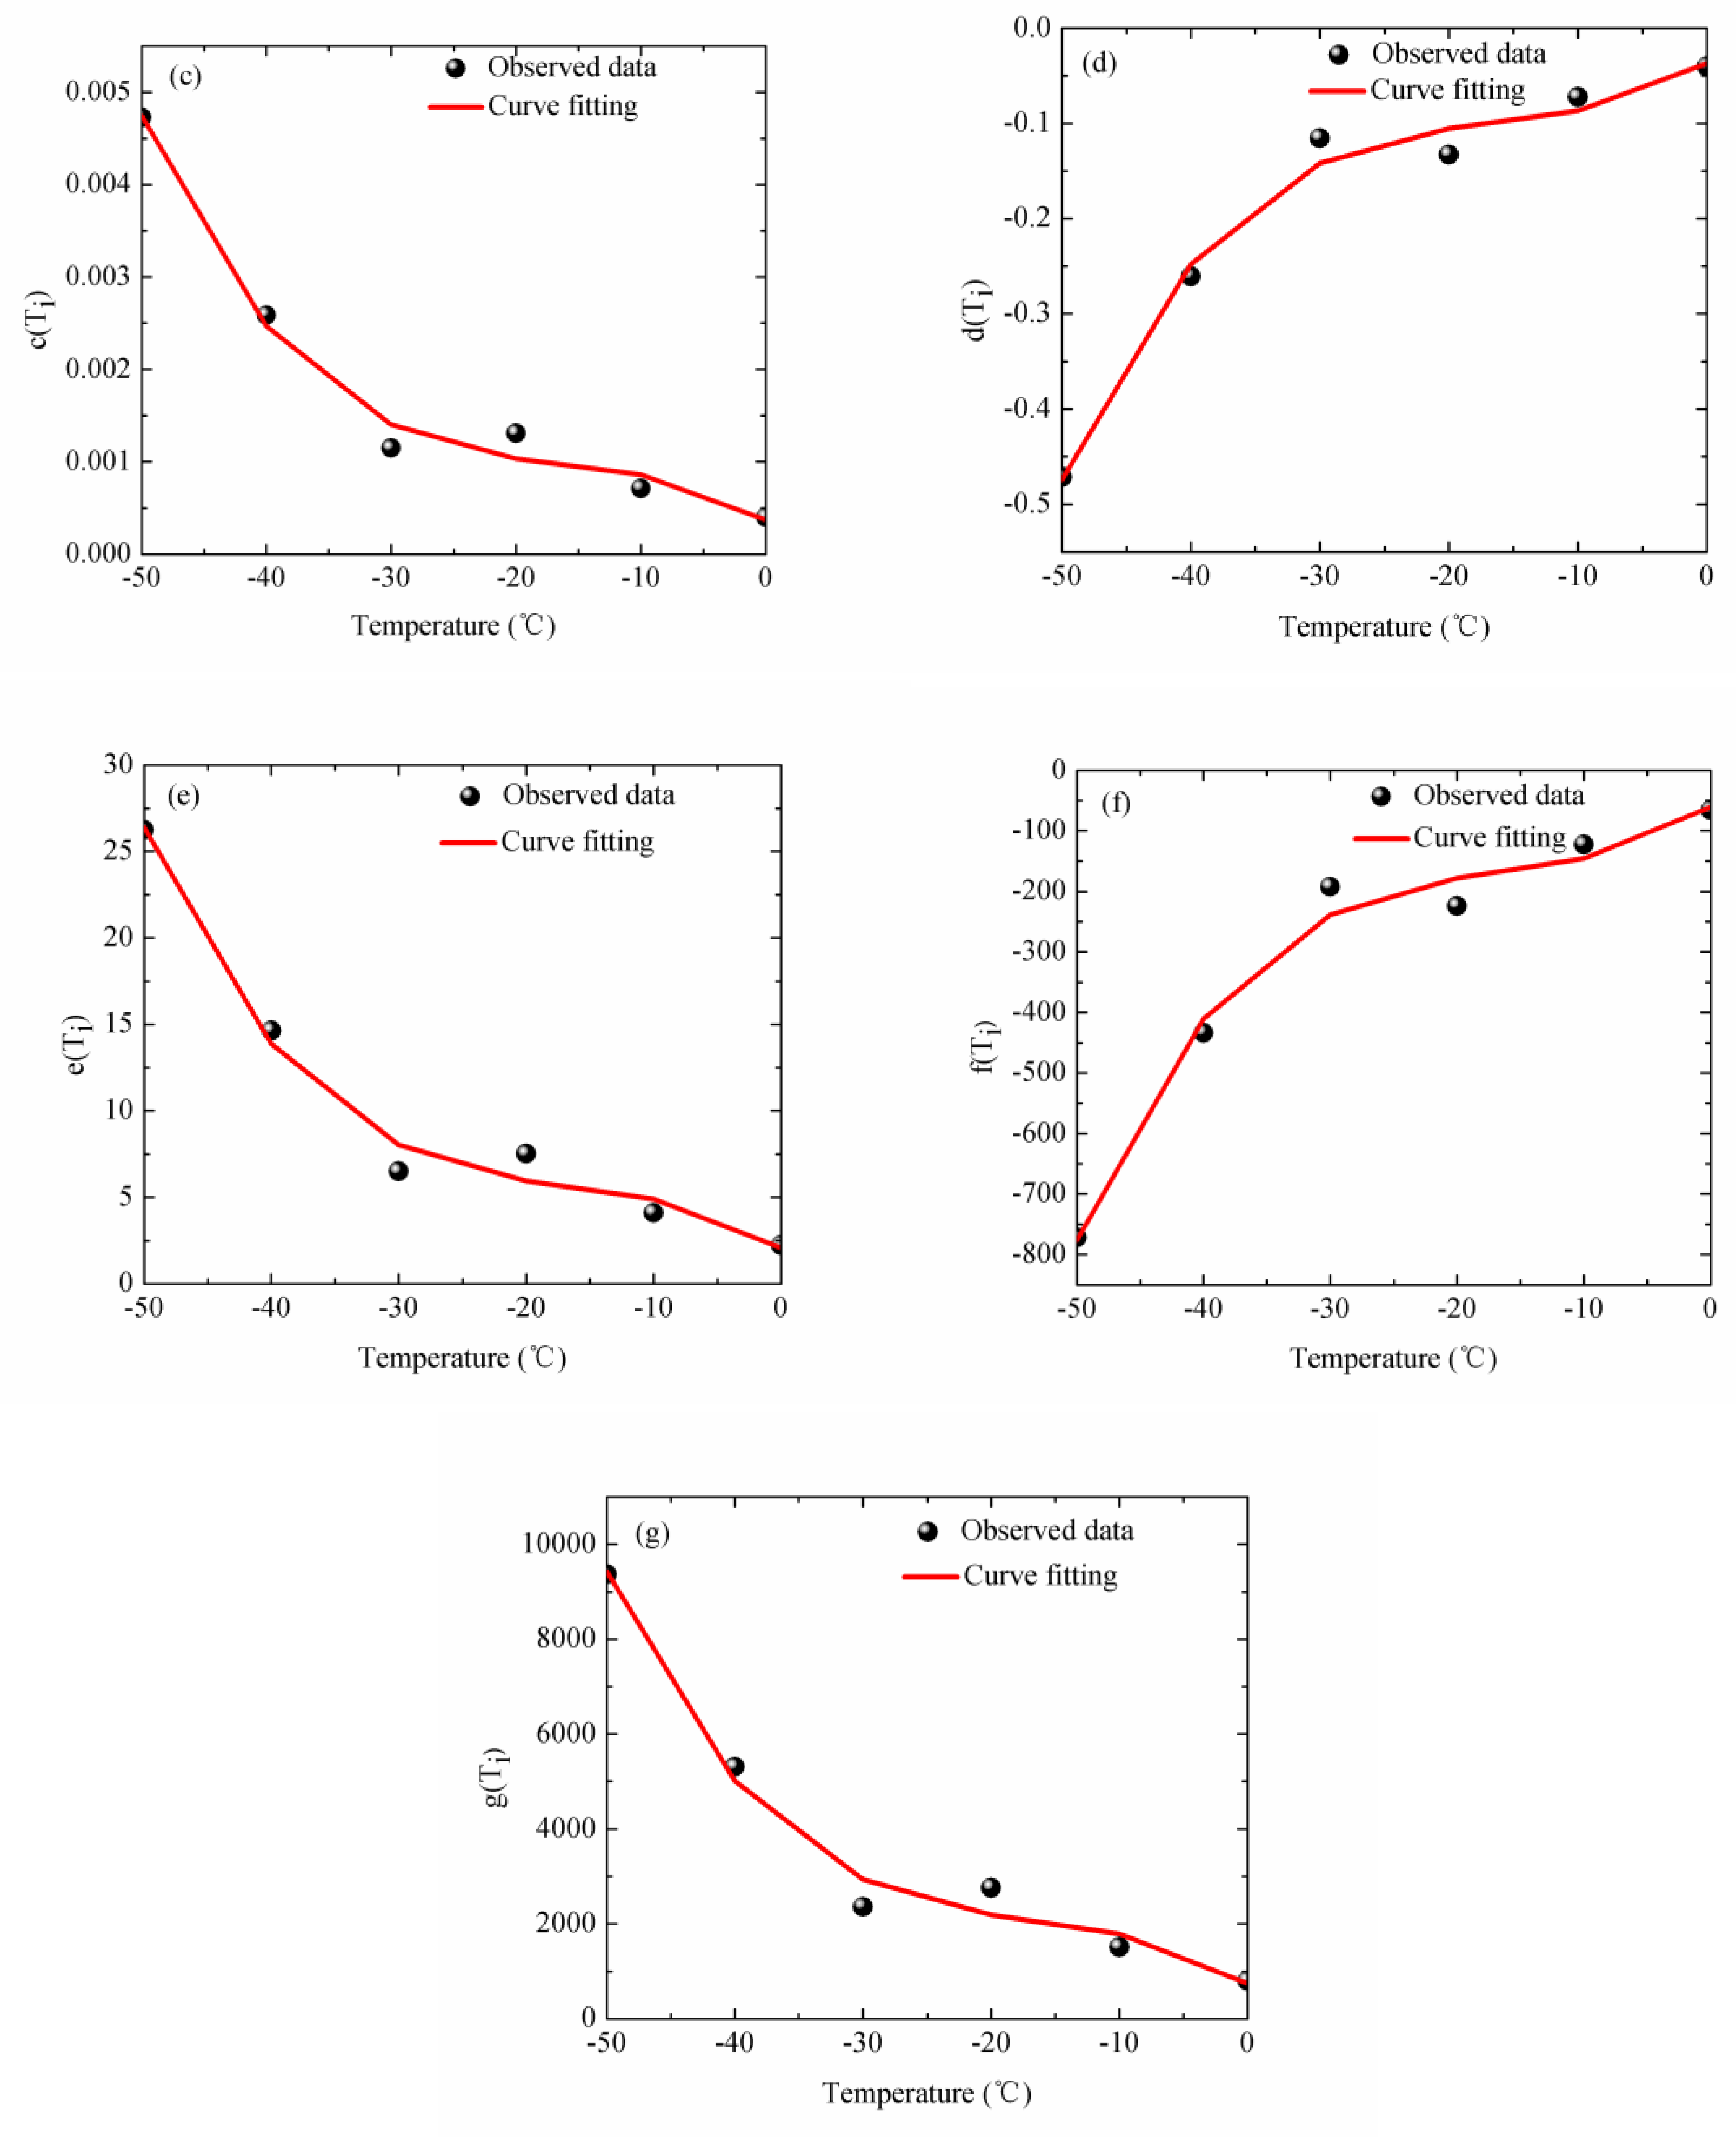
Applsci 09 01968 g005
Figure 6. (ag) show the coefficients a(Ti), b(Ti), c(Ti), d(Ti), e(Ti), f(Ti) and g(Ti) from −50 °C to 0 °C, respectively.
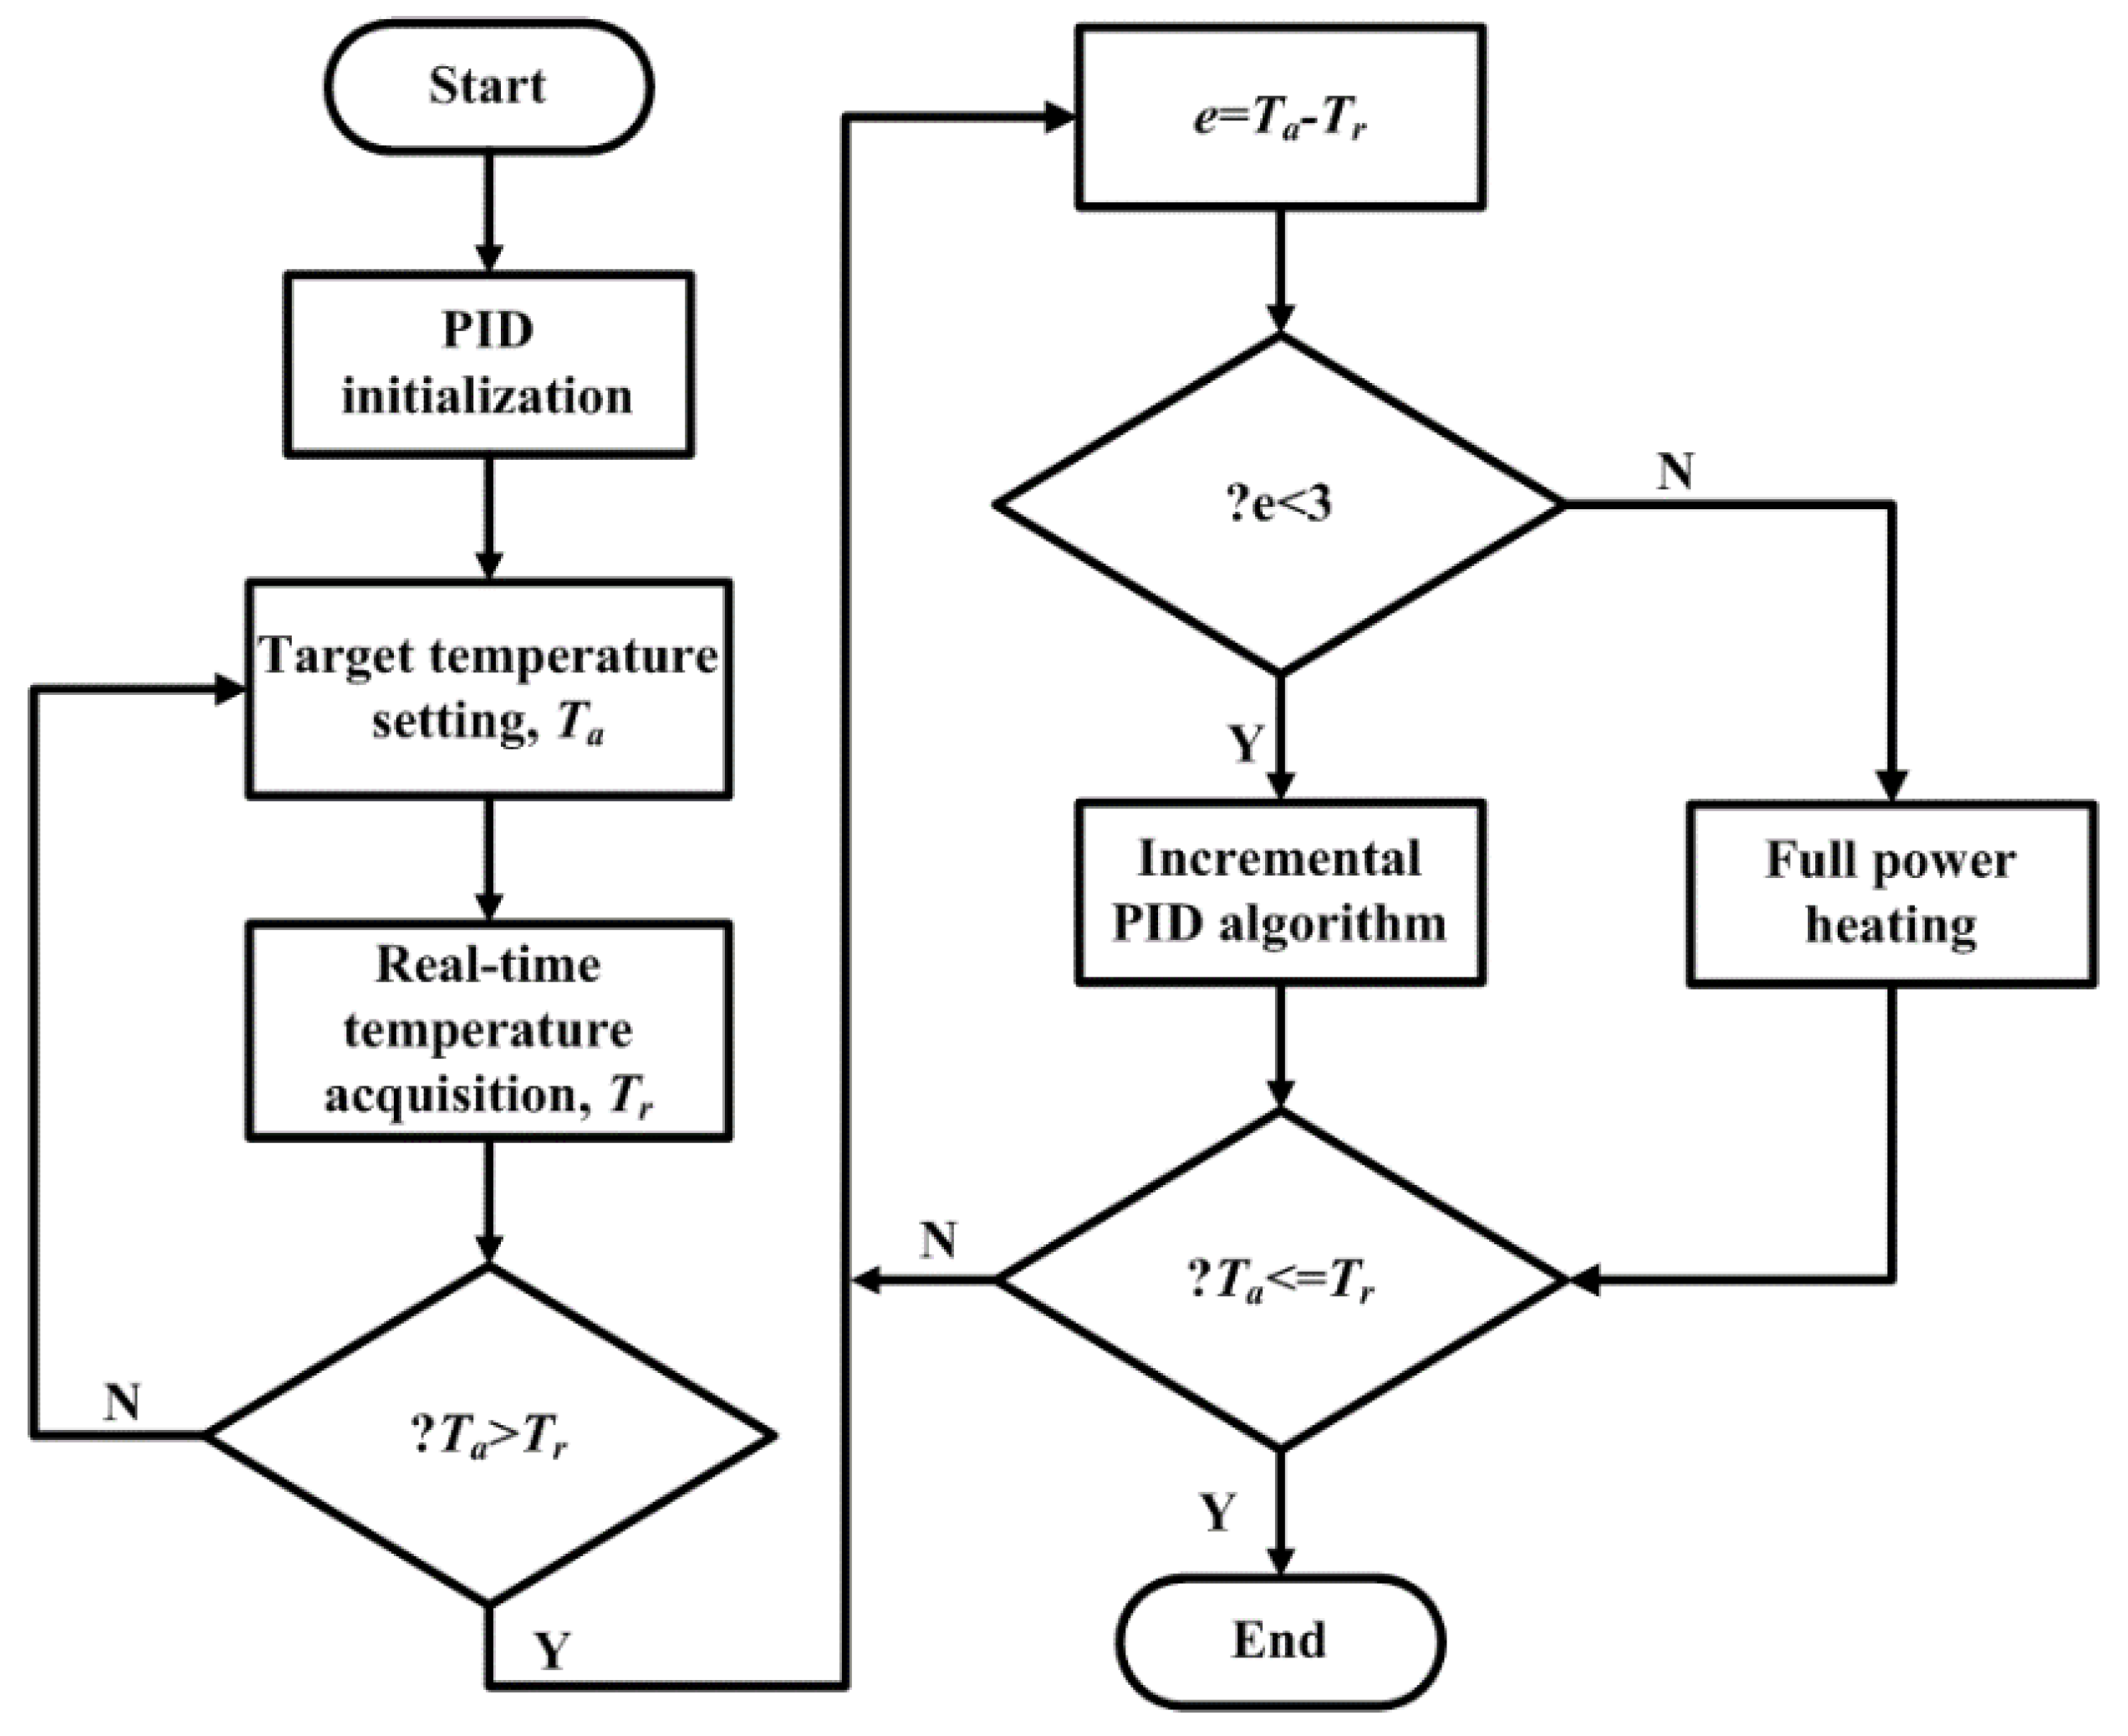
Applsci 09 01968 g006aApplsci 09 01968 g006b
Figure 7. The flowchart of the temperature control strategy.
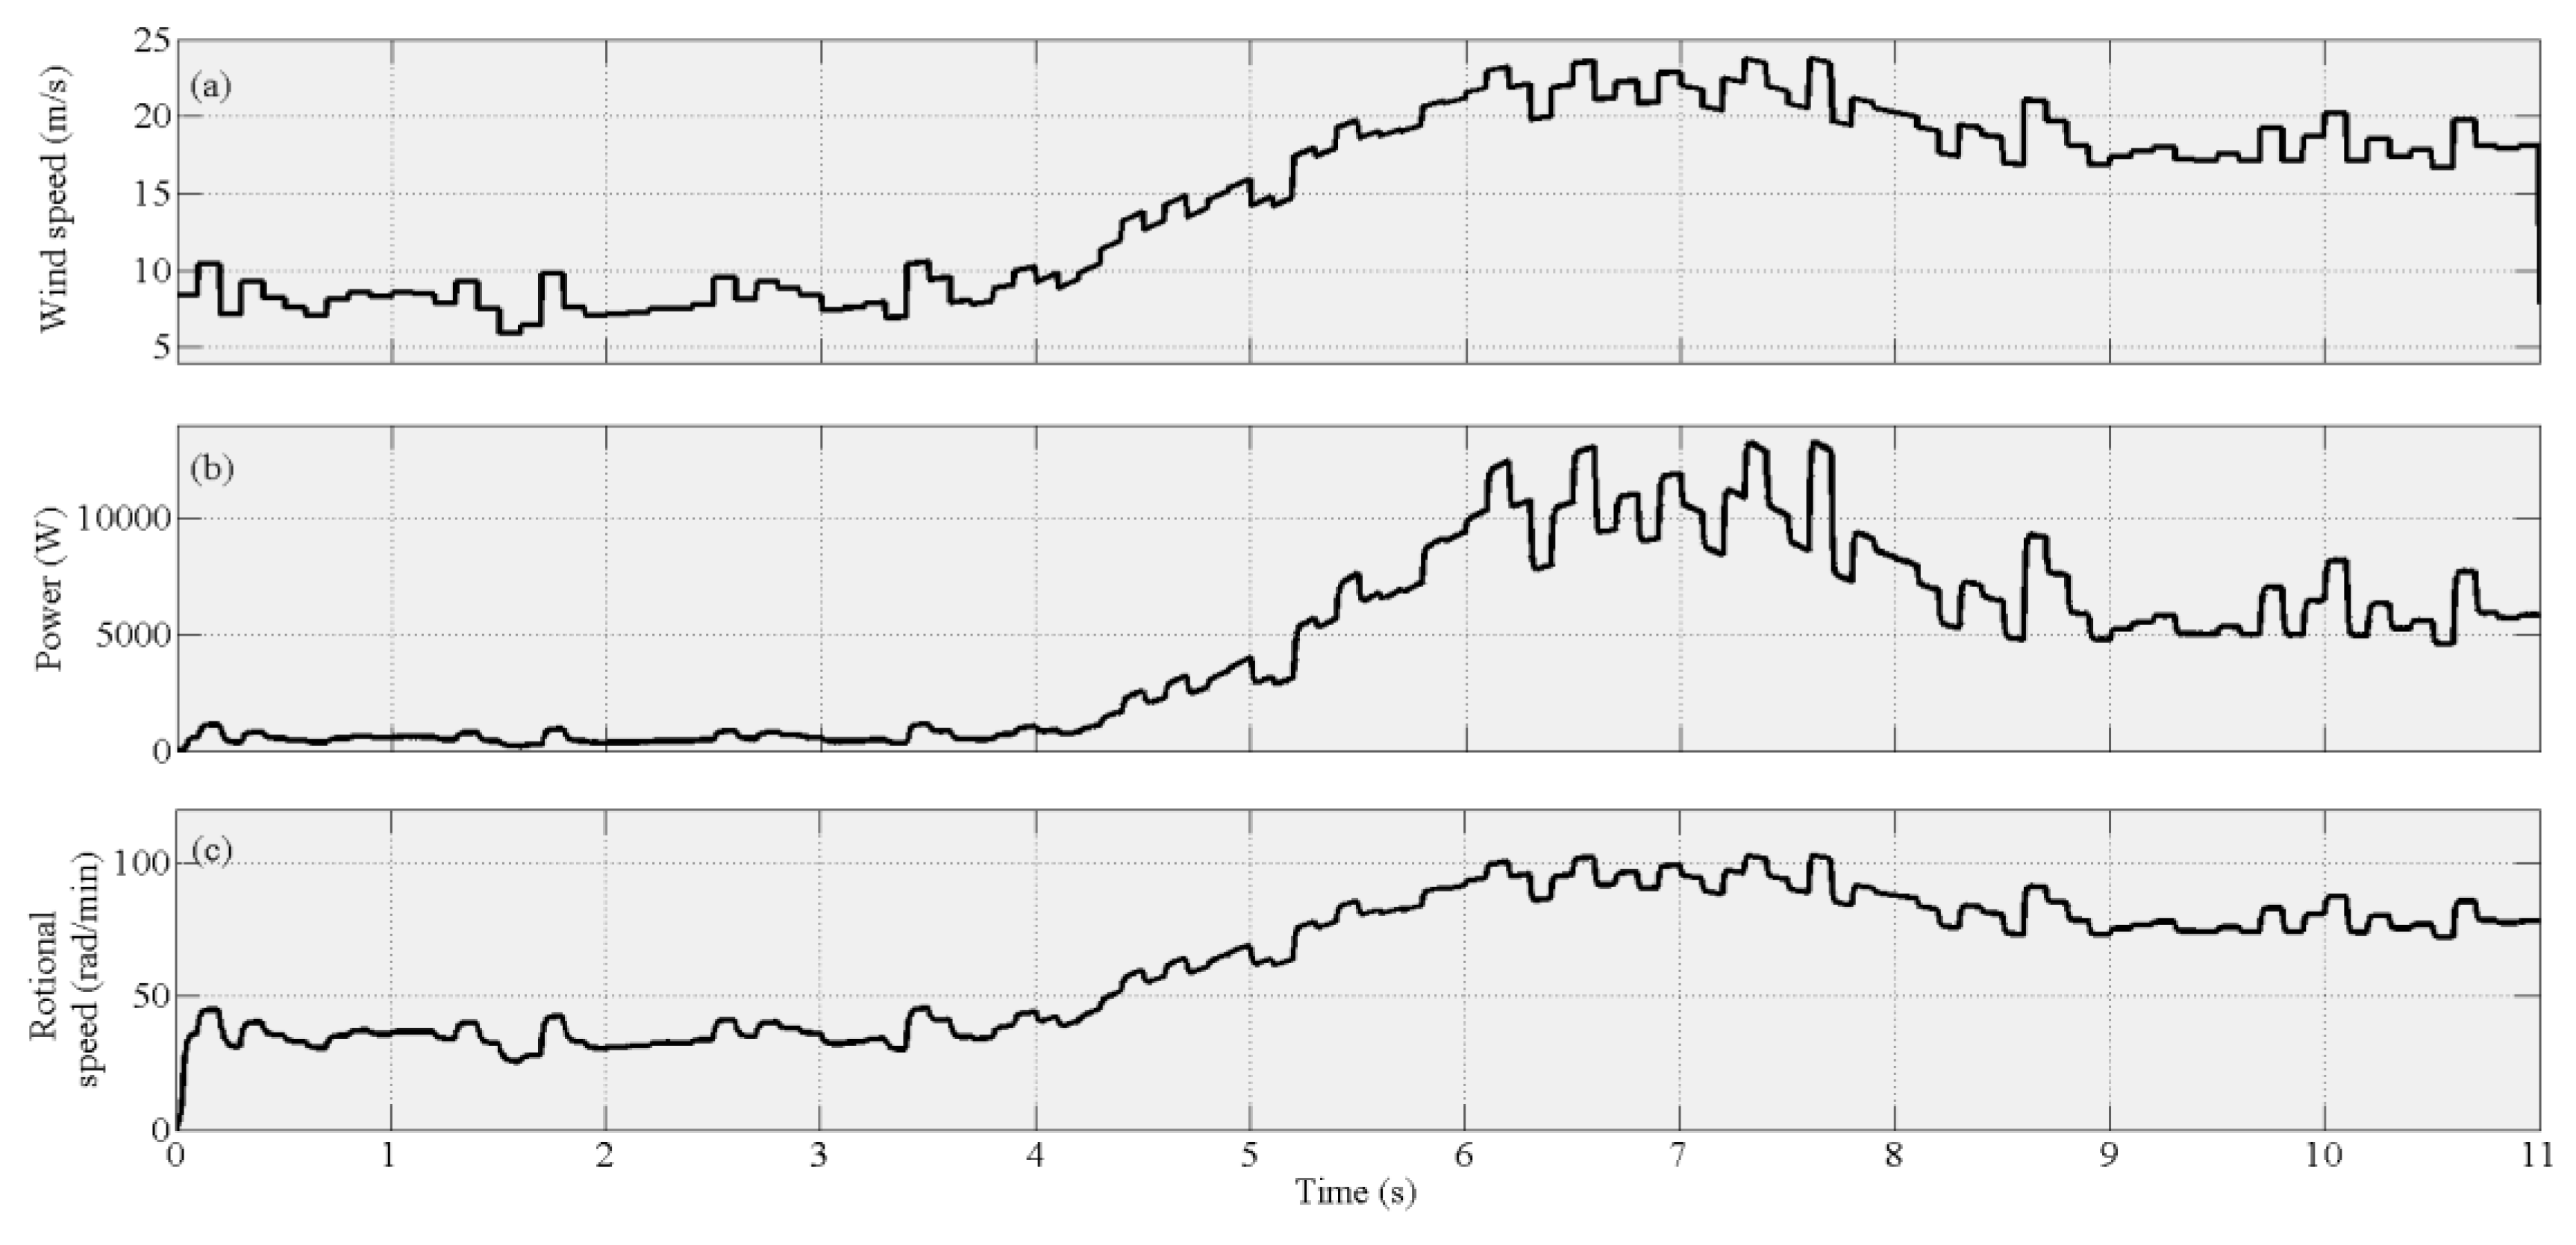
Applsci 09 01968 g007
Figure 8. The simulation results of (a) the wind speed, (b) wind turbine output power and (c) rotational speed of wind turbine.
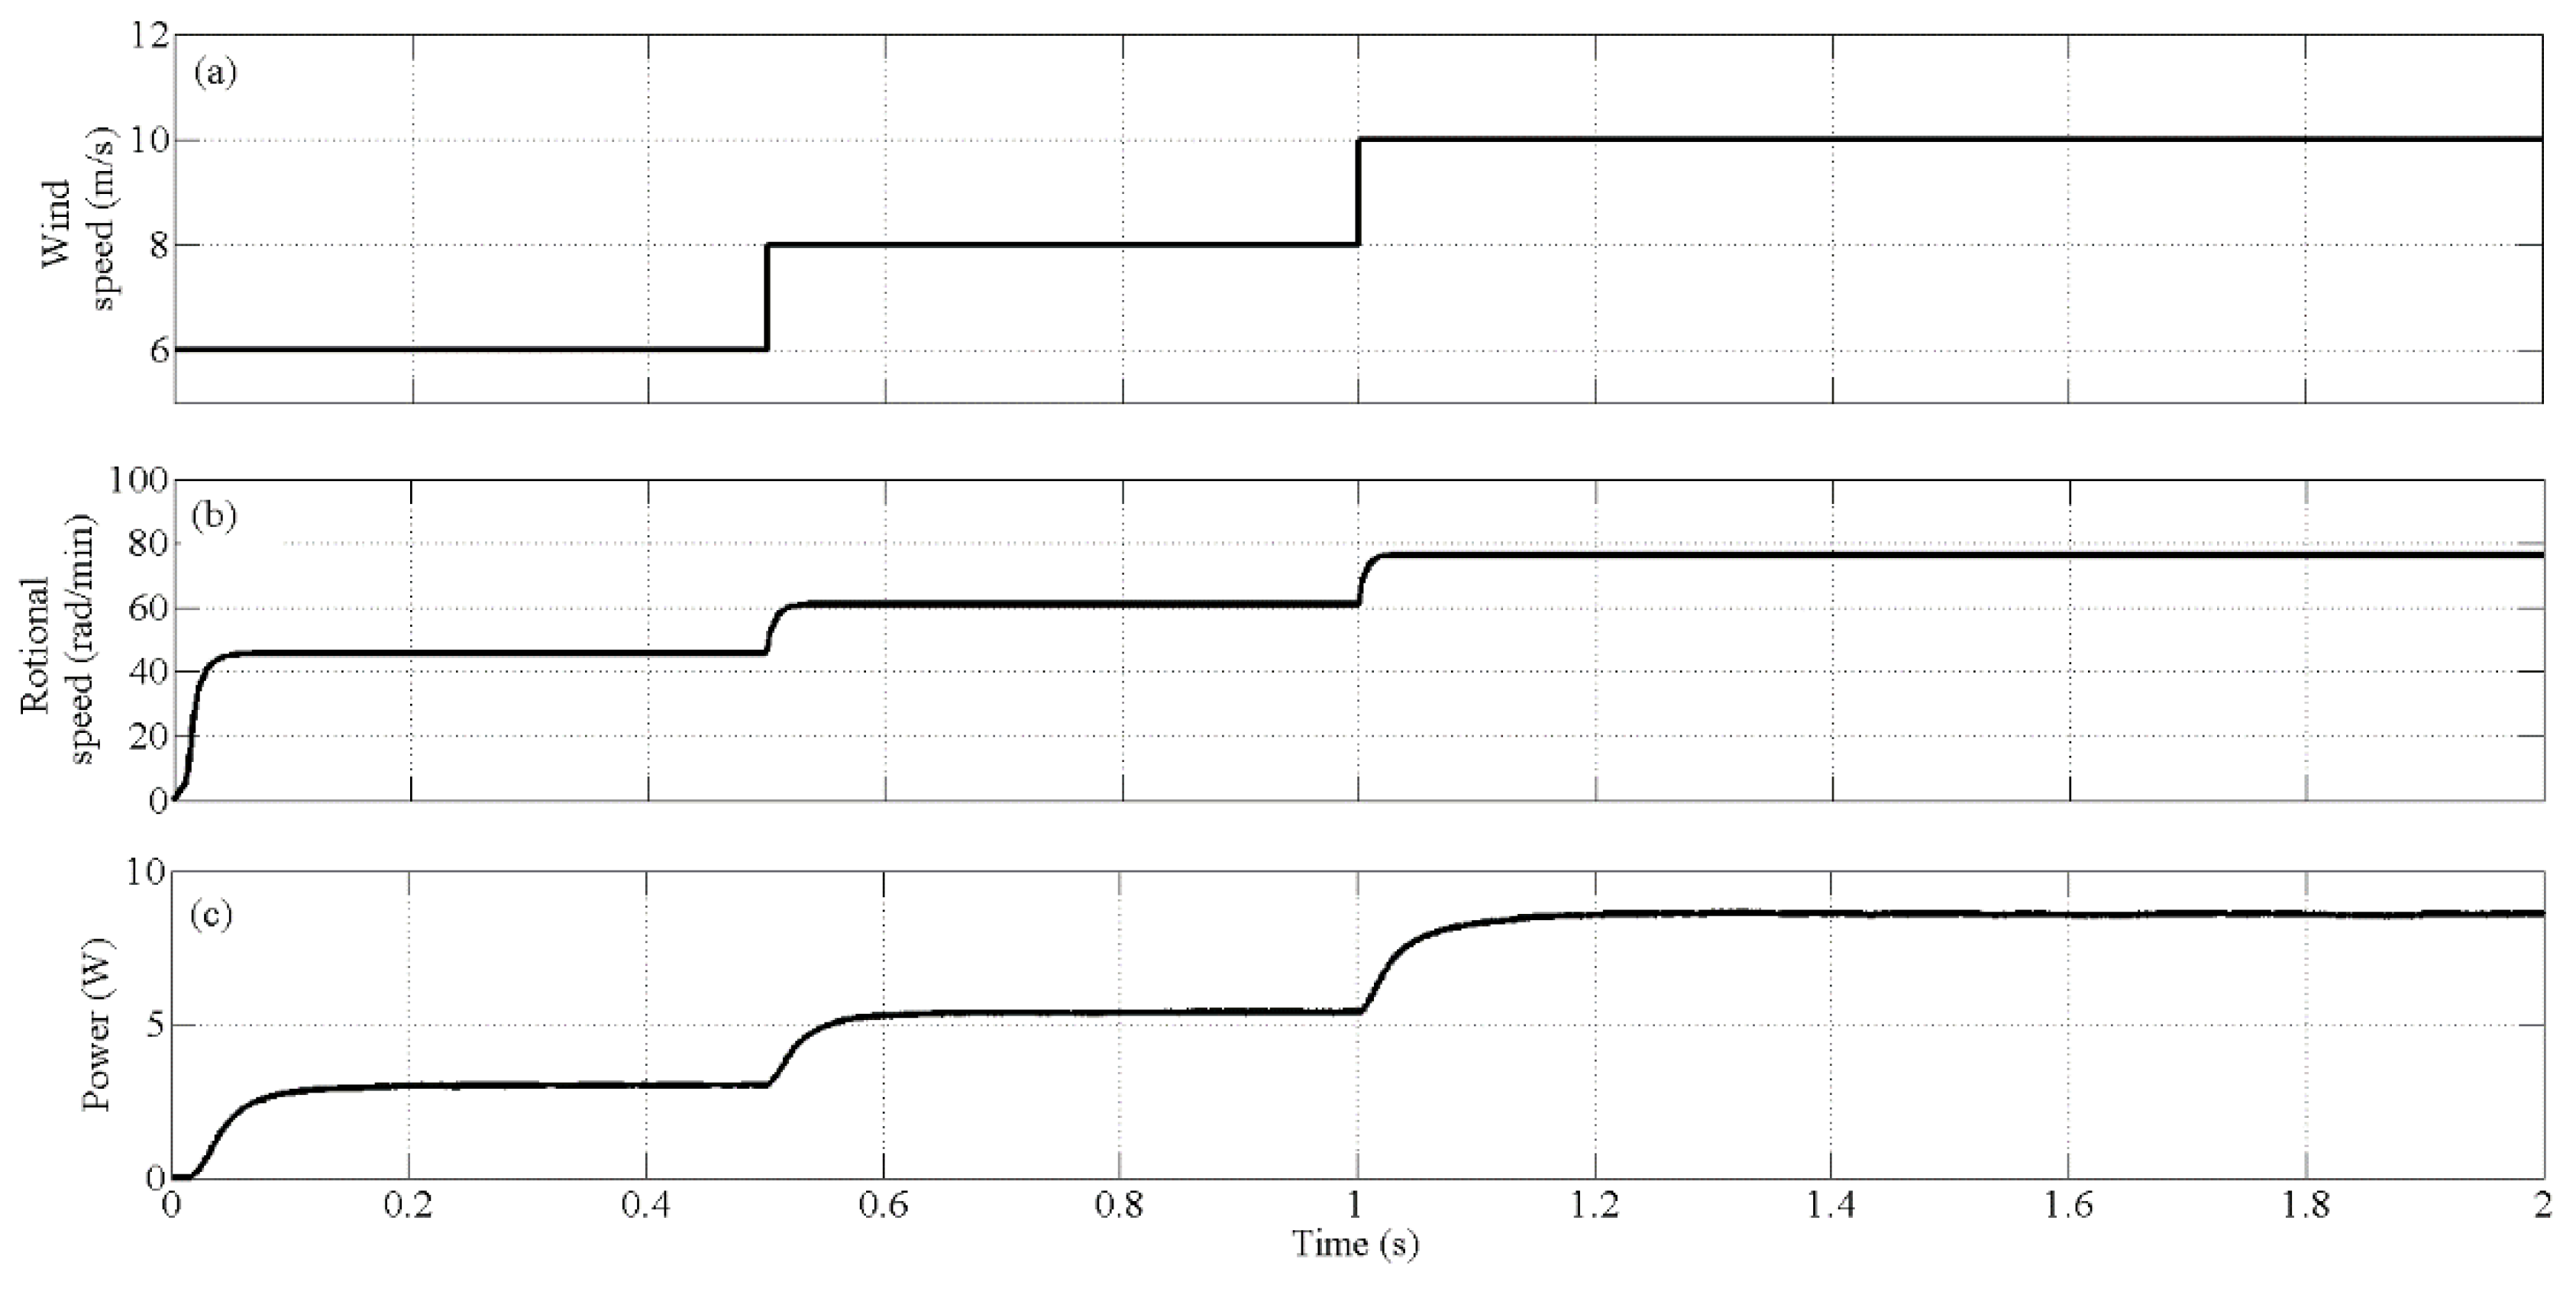
Applsci 09 01968 g008
Figure 9. The simulation results of (a) the wind speed, (b) wind turbine output power and (c) rotational speed of wind turbine at abrupt wind speeds.
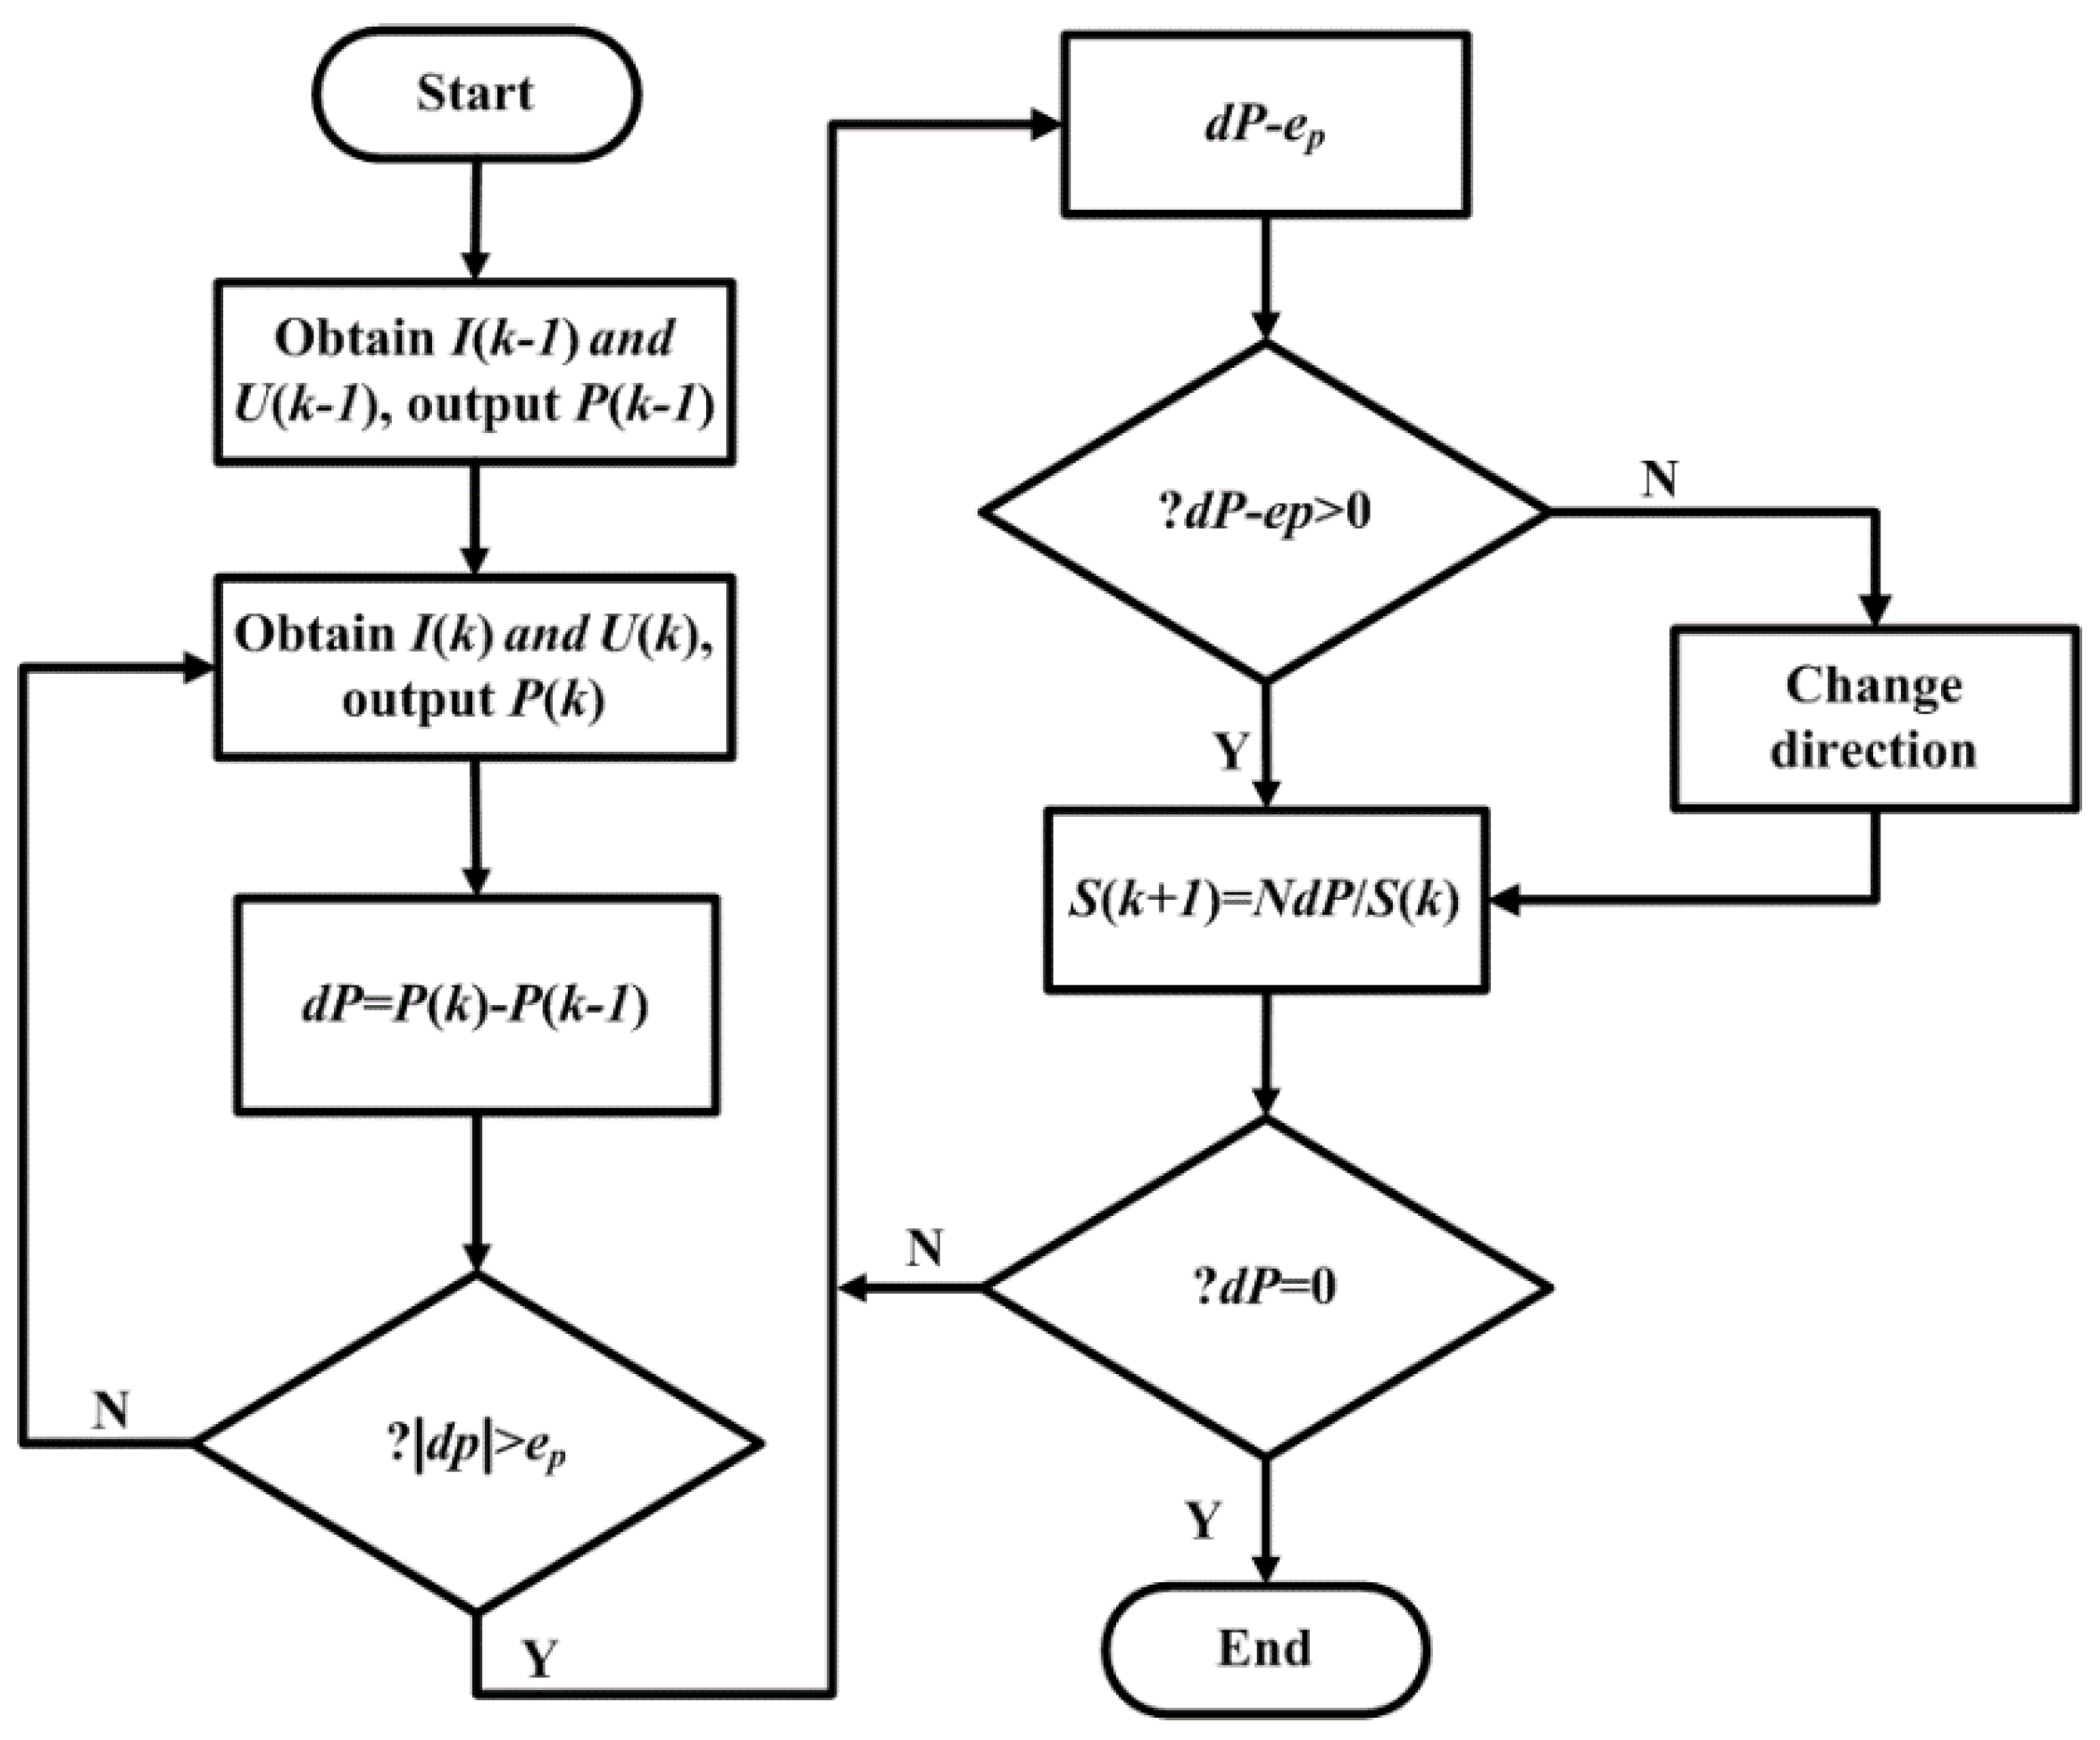
Applsci 09 01968 g009
Figure 10. The flowchart of the perturbation and observation method with adaptive variable step.
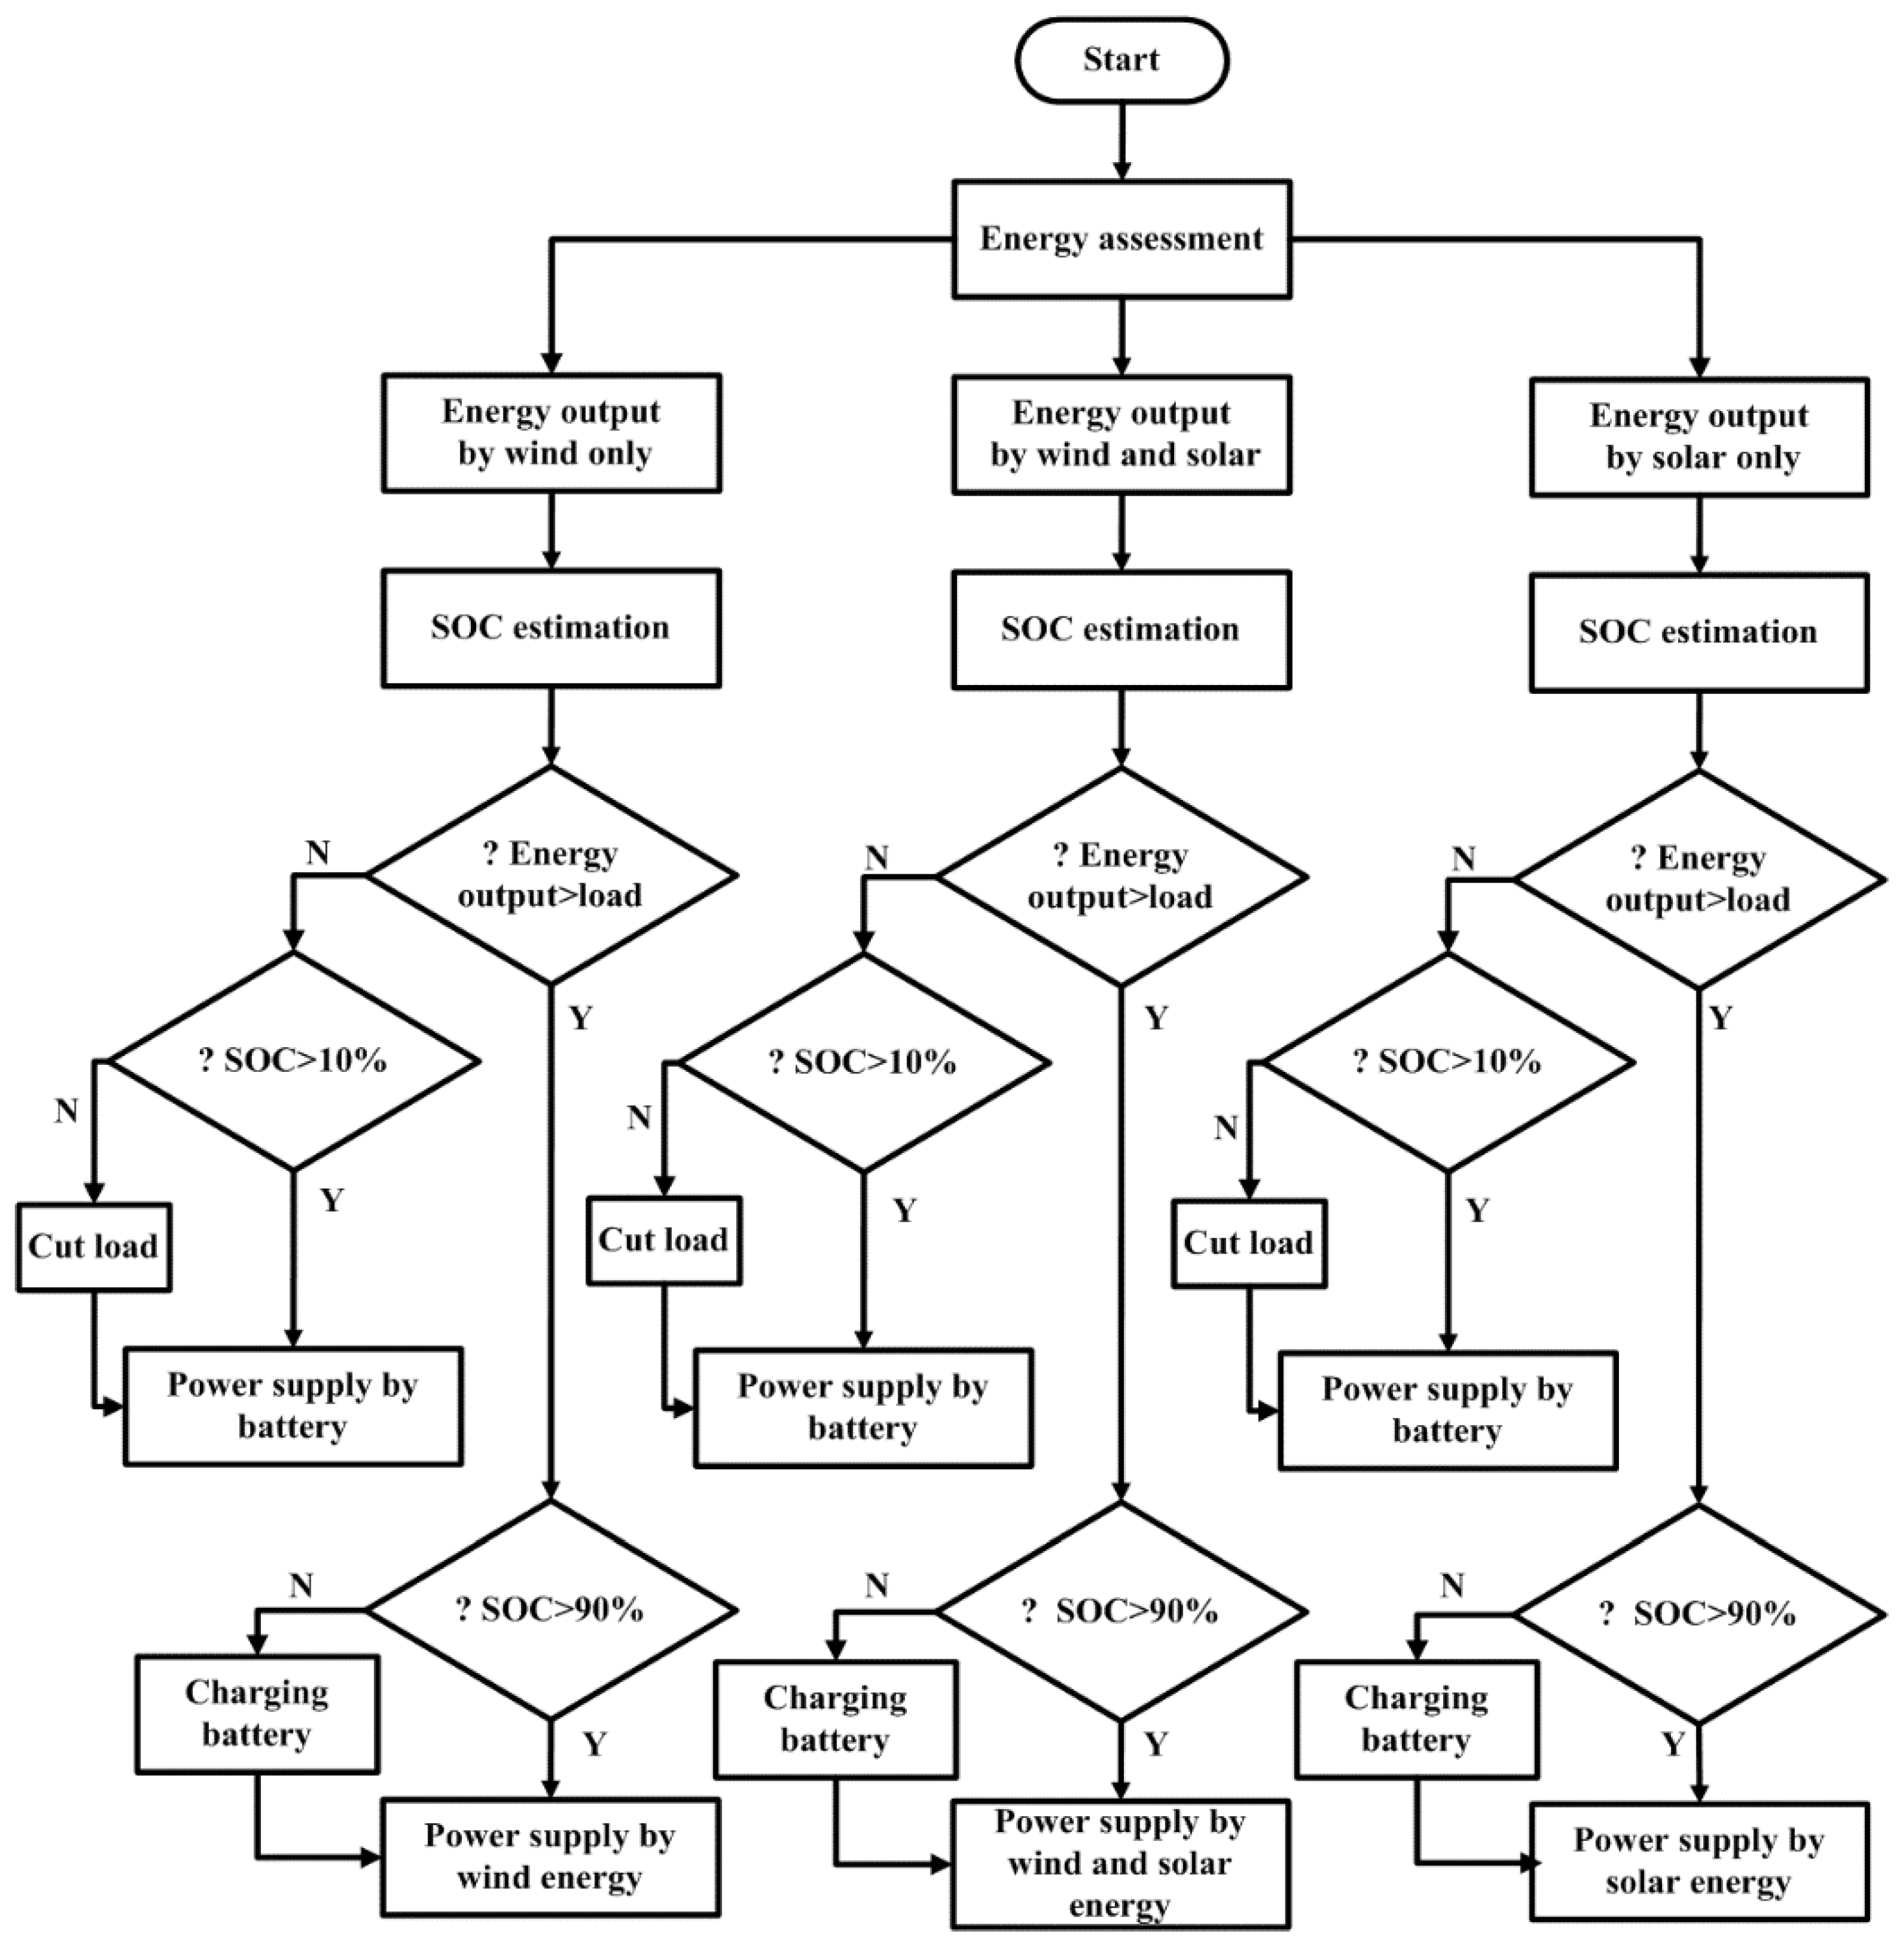
Applsci 09 01968 g010
Figure 11. The flowchart of the power supply strategy.
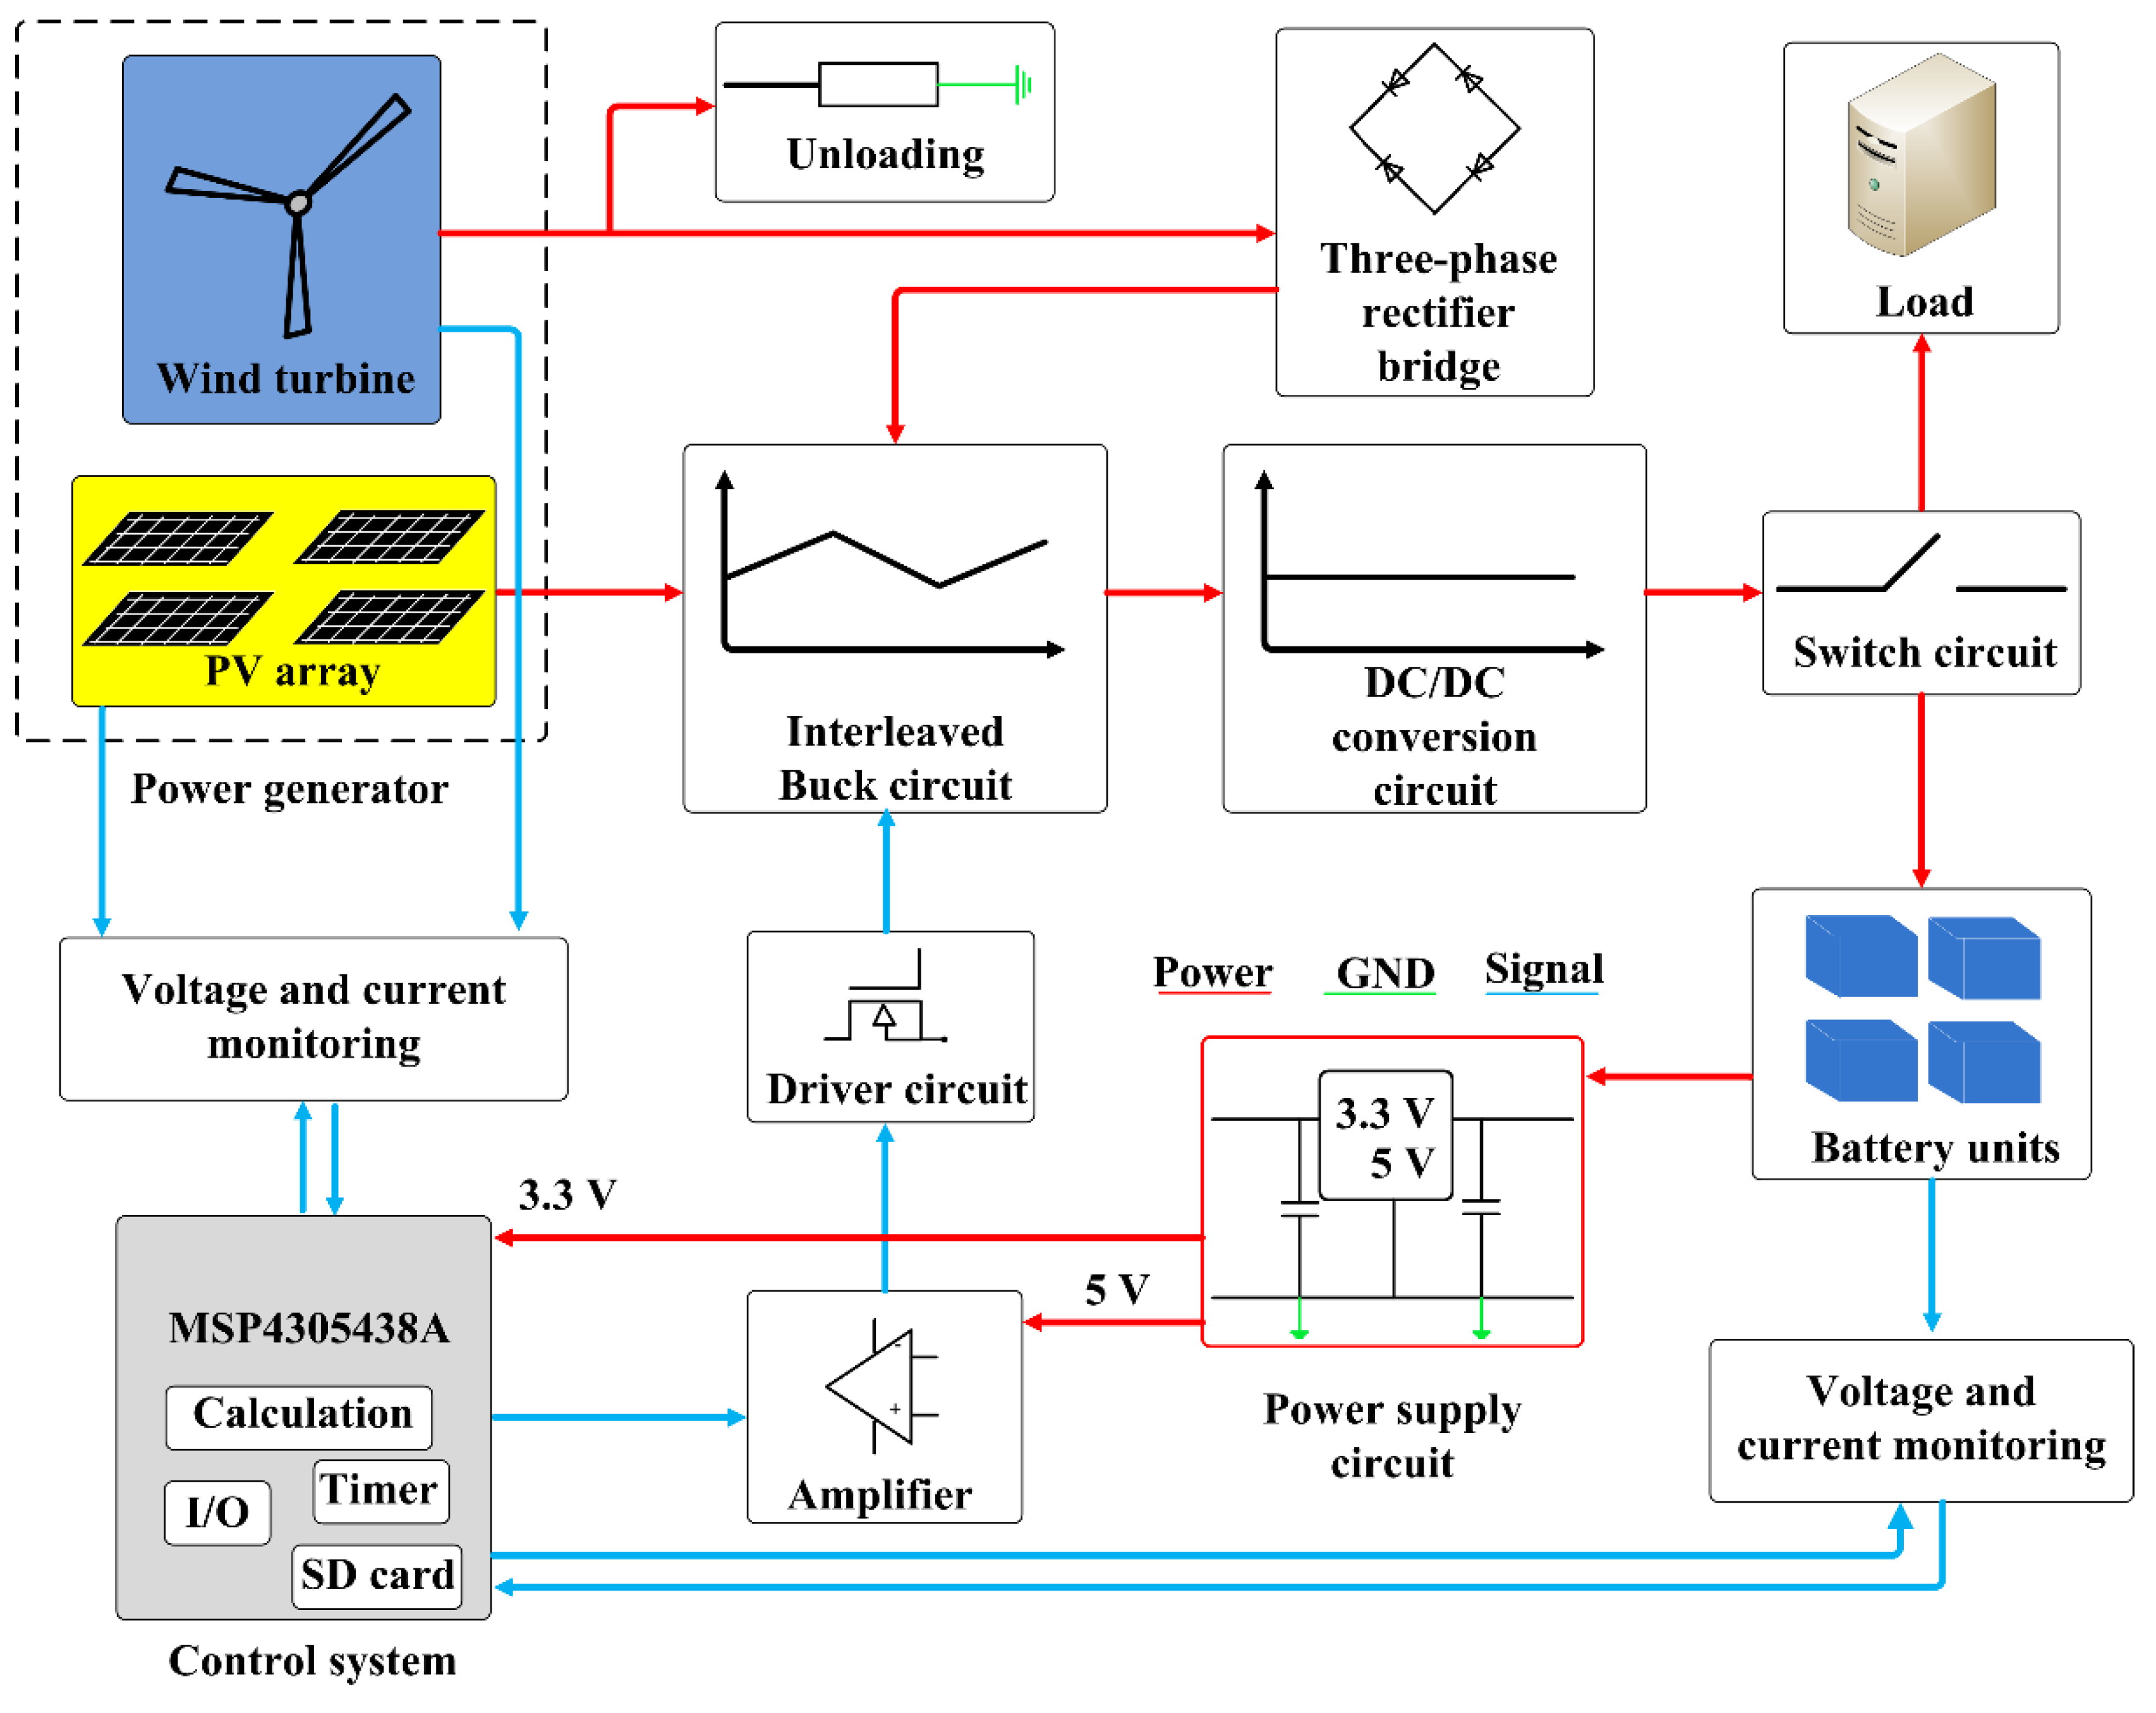
Applsci 09 01968 g011
Figure 12. Block diagram of the standalone renewable energy system by hybrid solar–wind system.
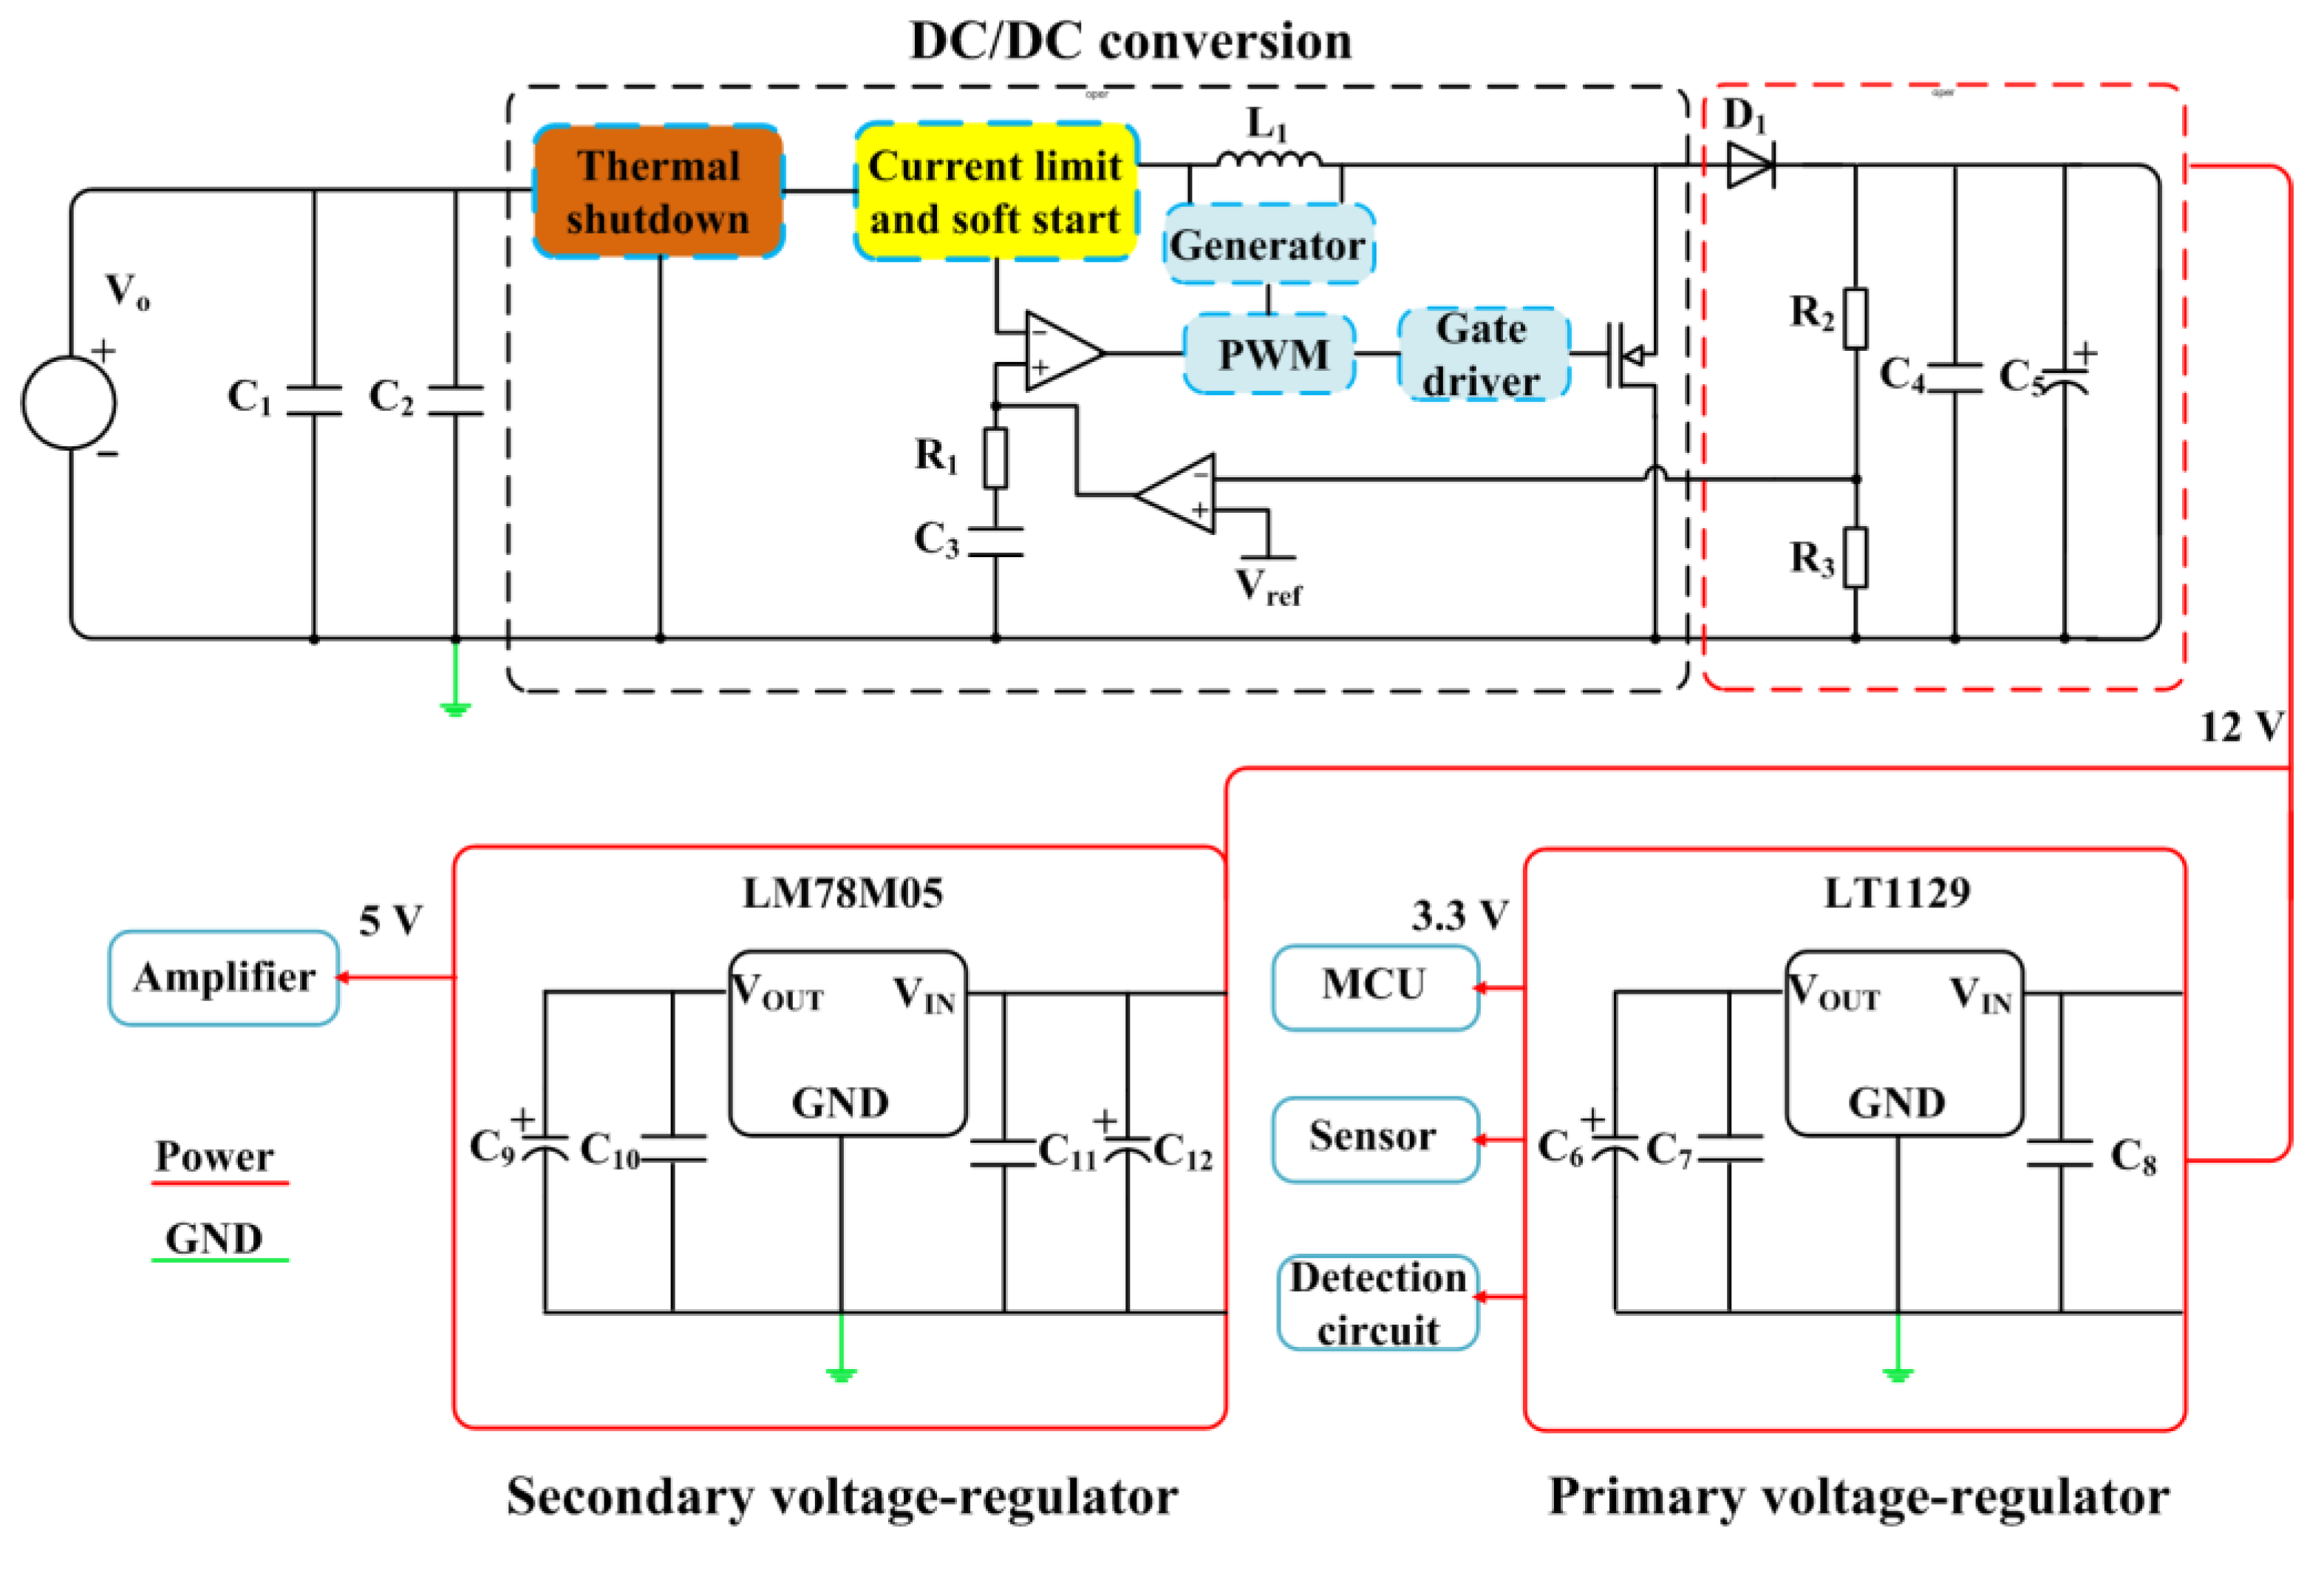
Applsci 09 01968 g012
Figure 13. The DC/DC conversion circuit and power supply circuit.
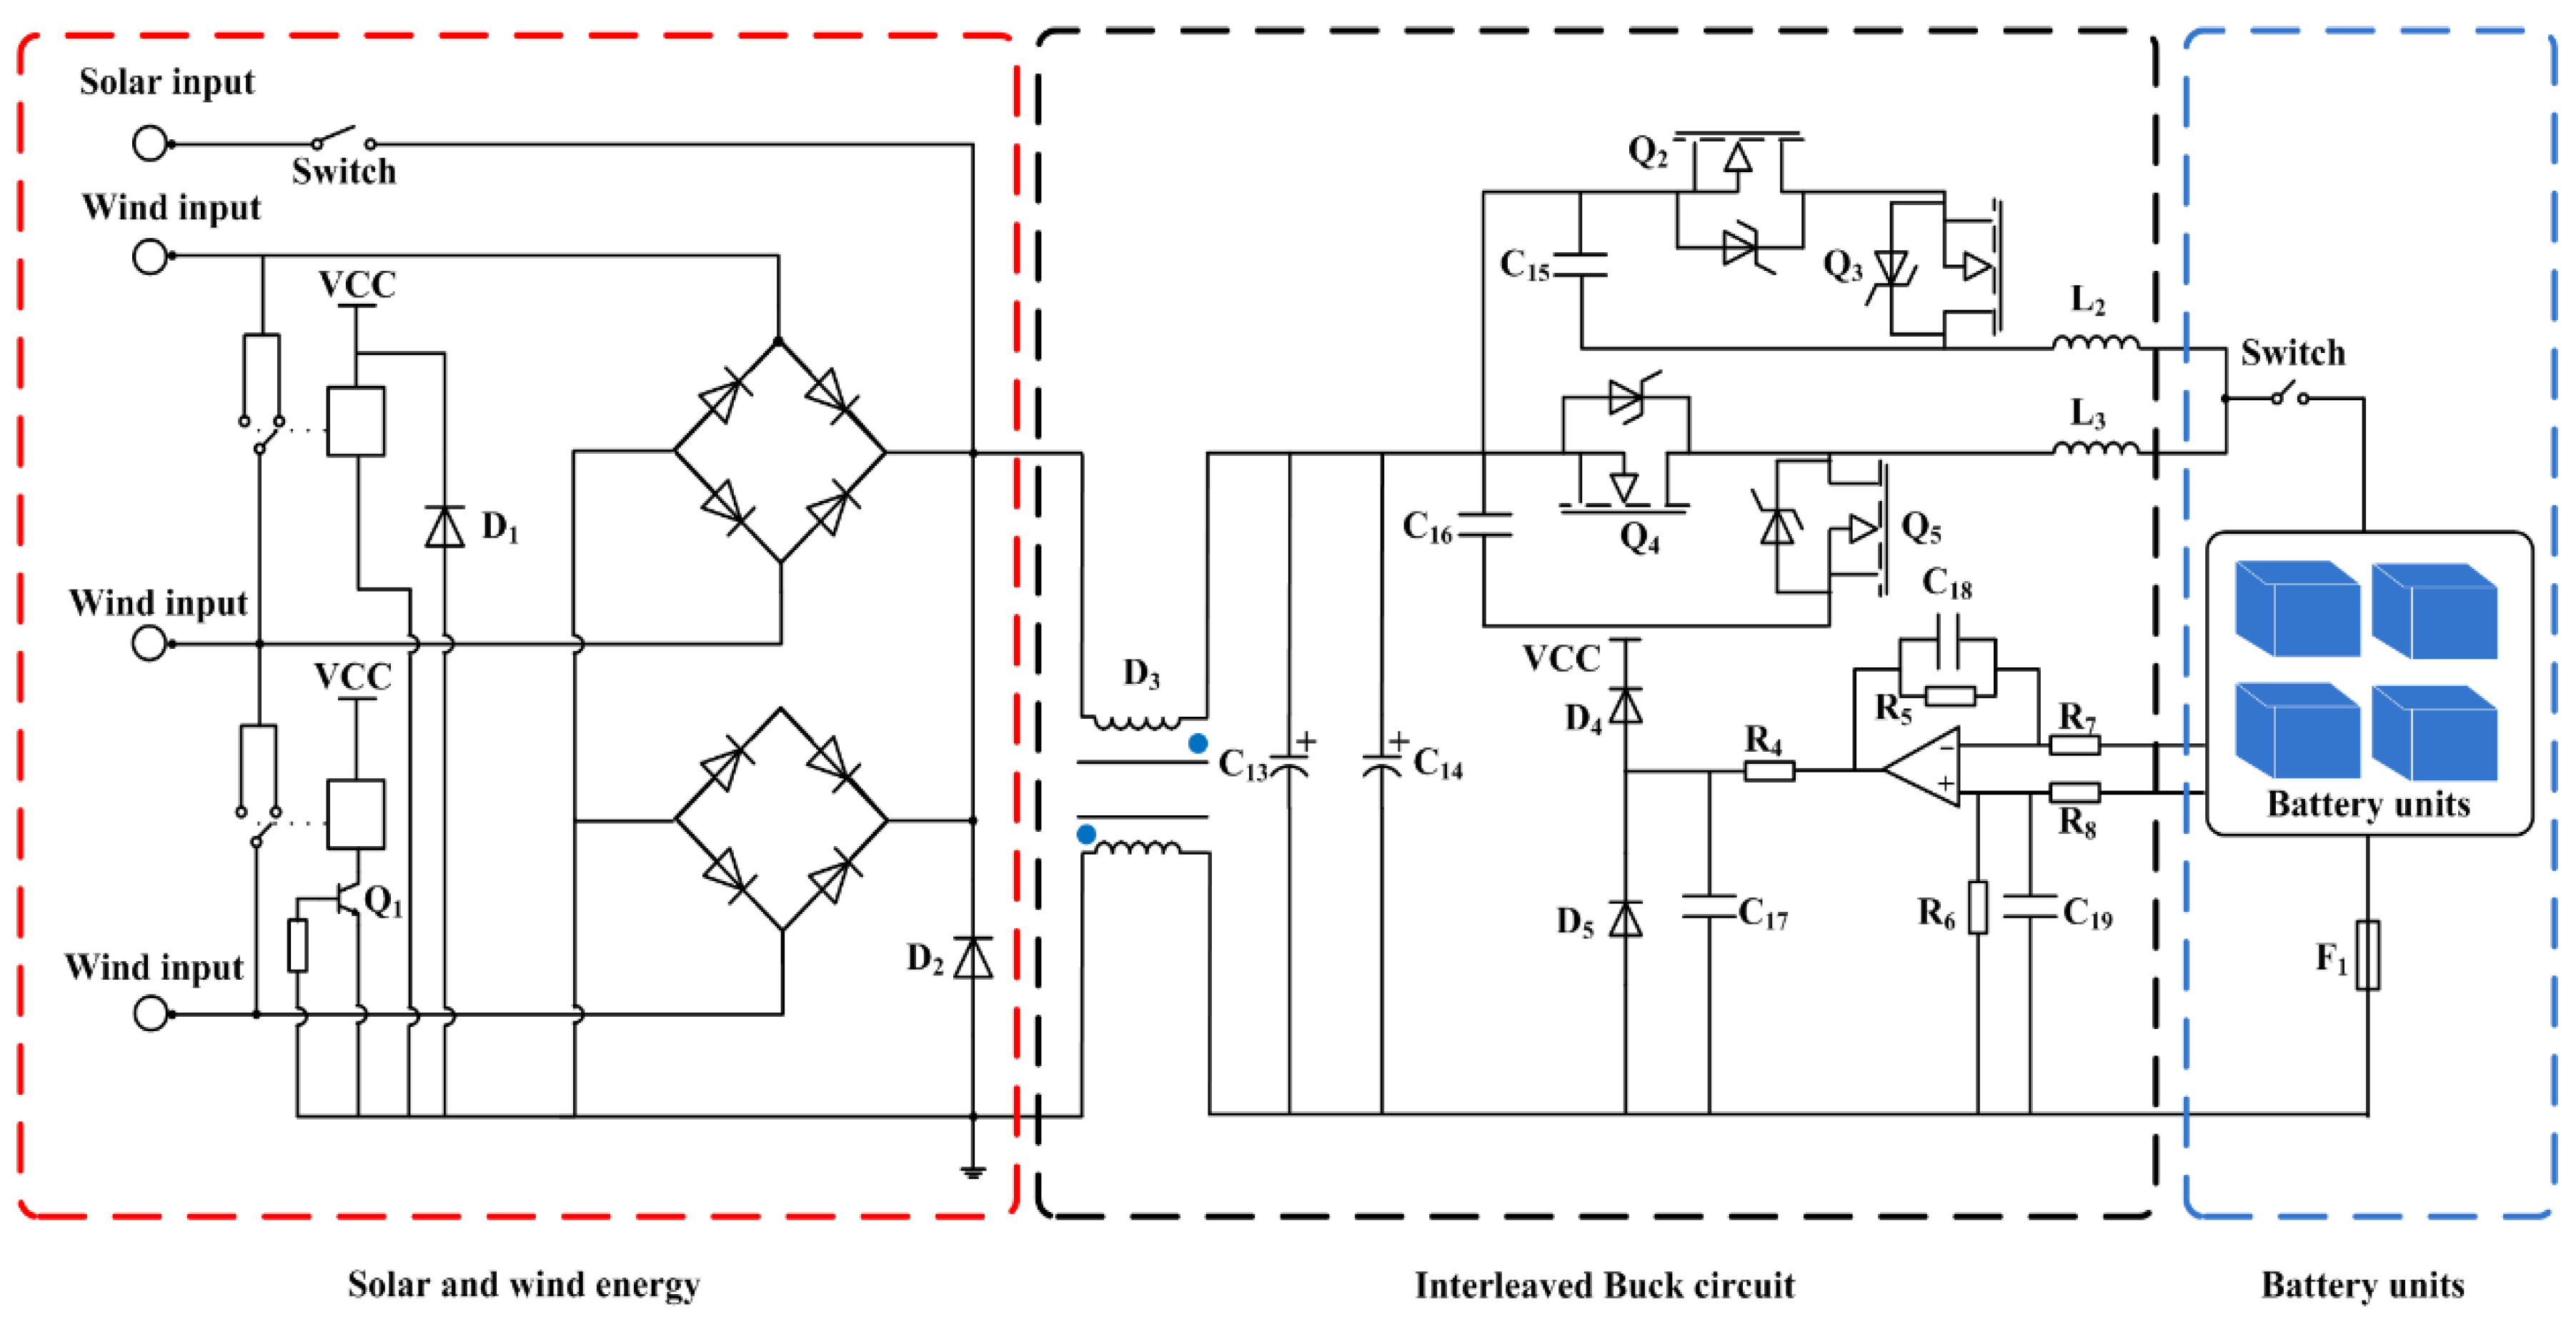
Applsci 09 01968 g013
Figure 14. The solar/wind charging circuit.
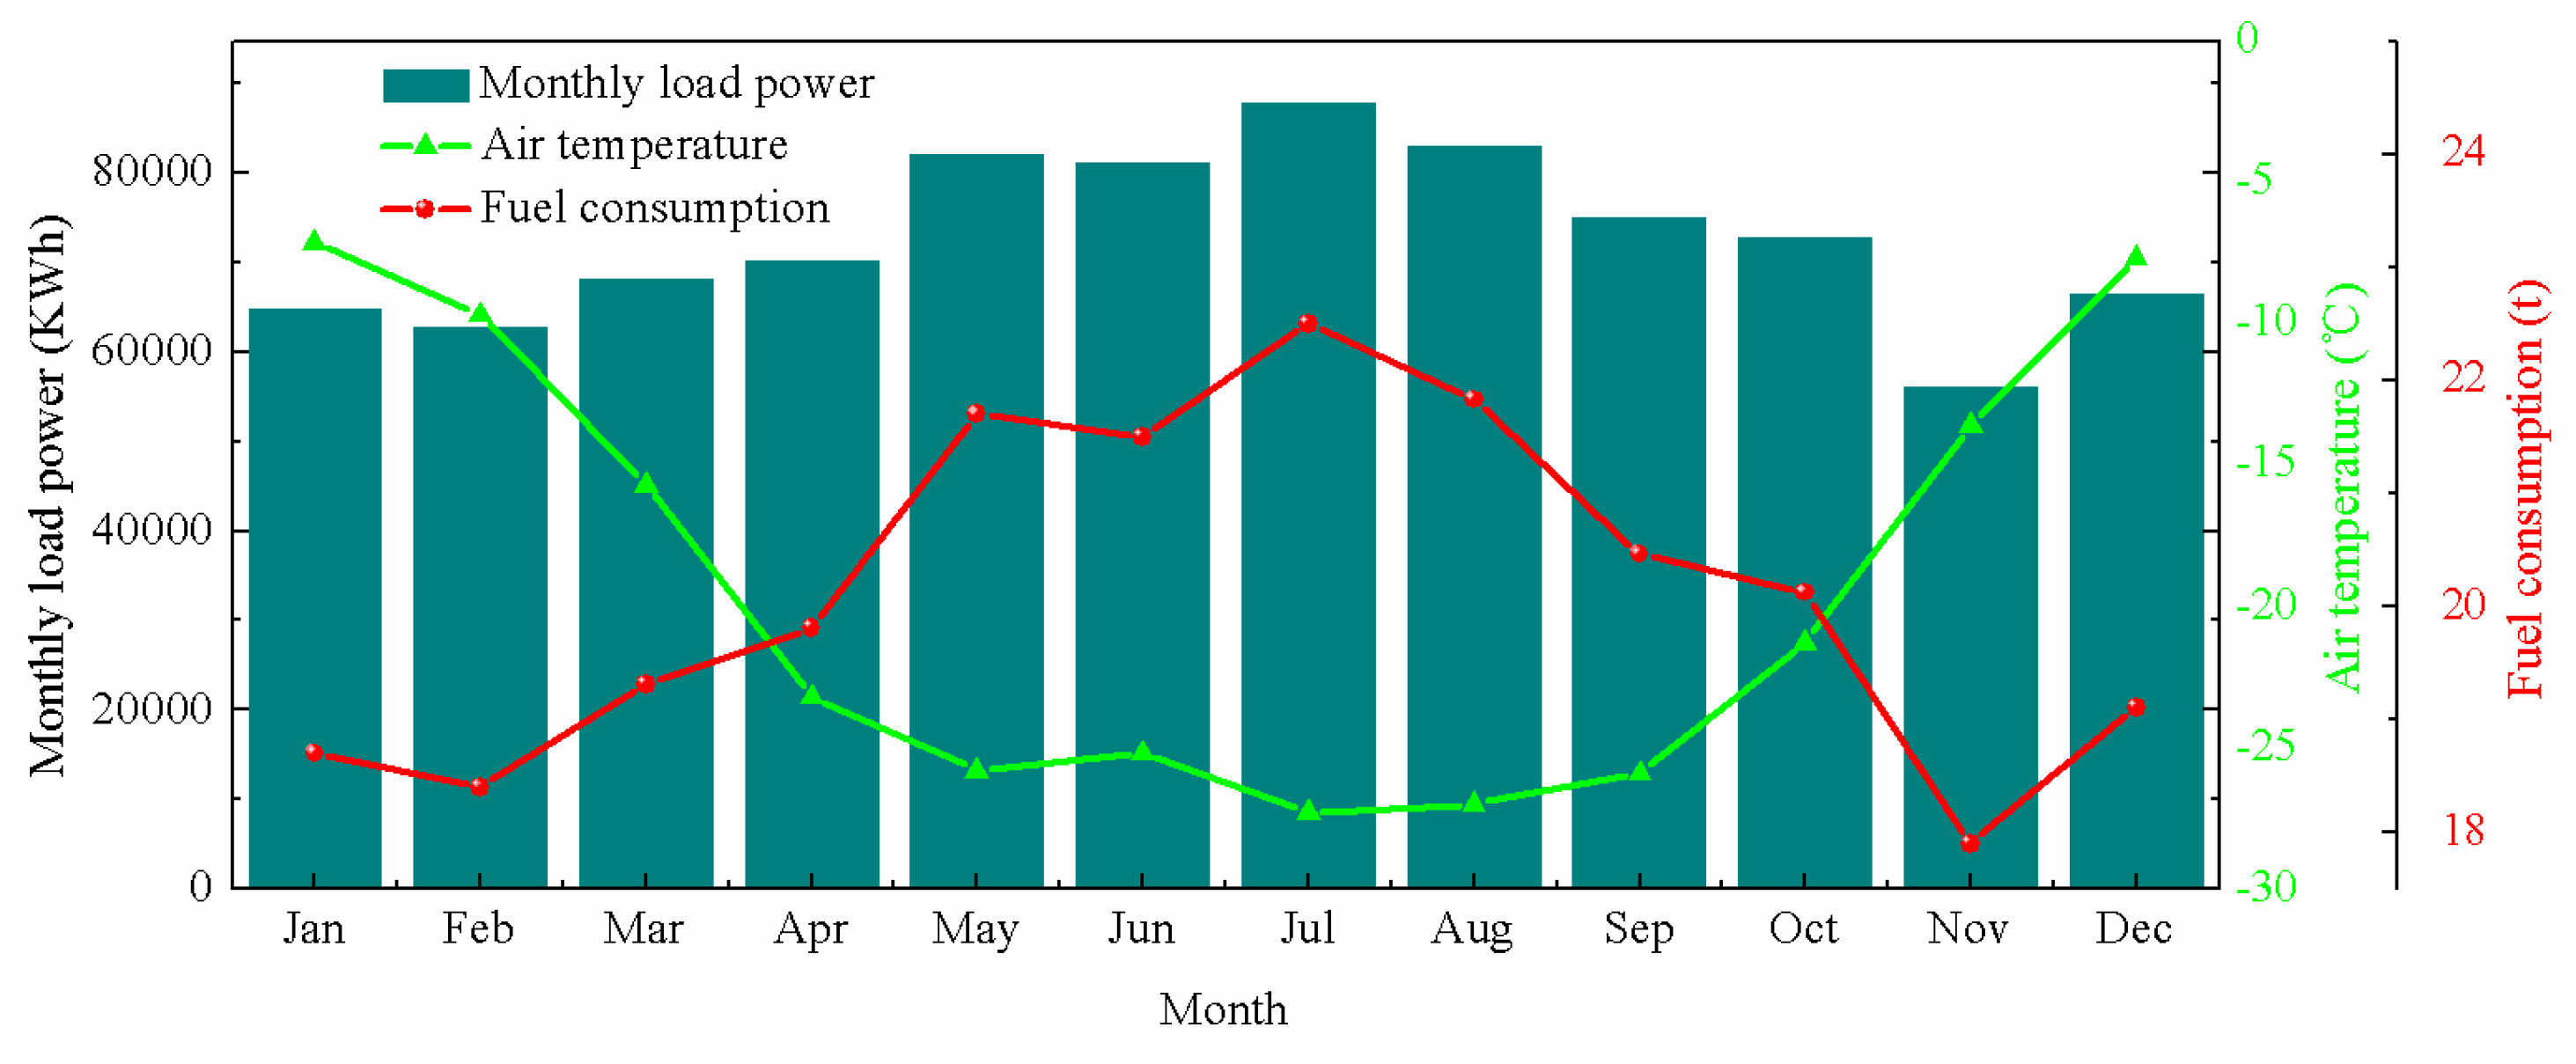
Applsci 09 01968 g014
Figure 15. Actual monthly load power, air temperature and fuel consumption in Zhongshan Station.
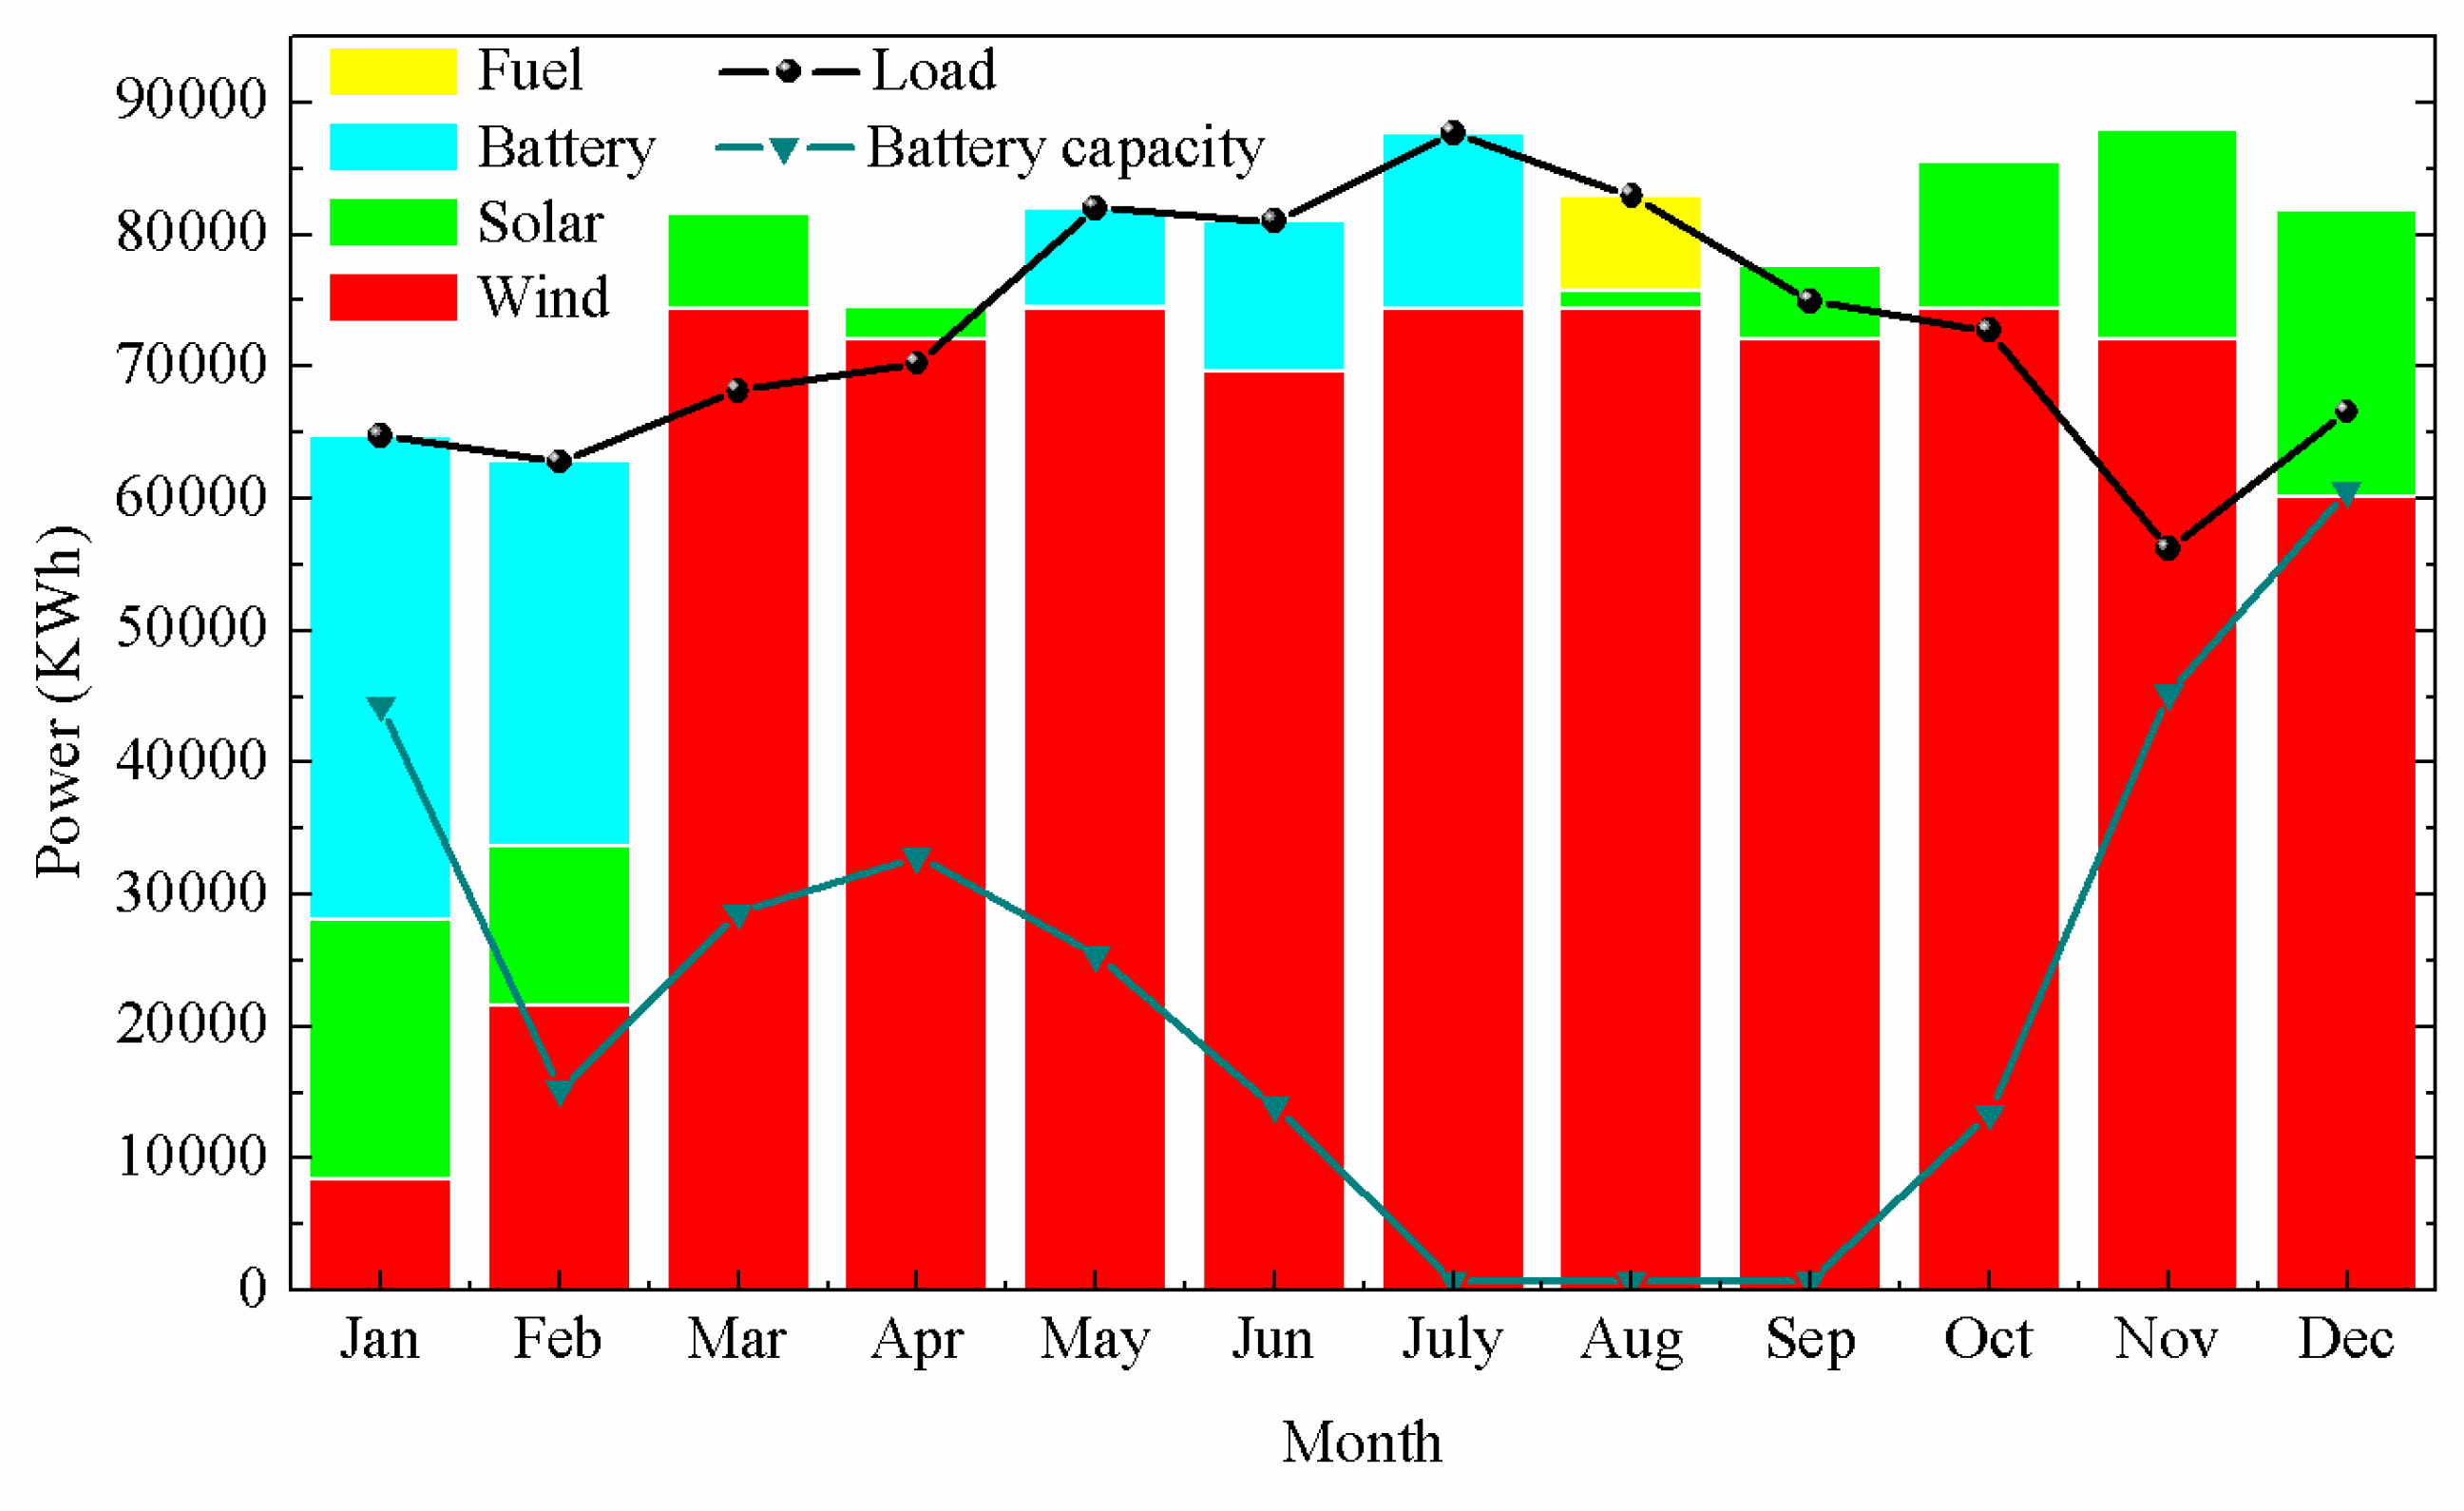
Applsci 09 01968 g015
Figure 16. The power generation of the standalone renewable energy system in Zhongshan Station from 2014 to 2015.
Applsci 09 01968 g016
Table 1. Sensor information of the manned weather station.
Sensor NamePerformanceSensor Model
Wind speedTemperature range: −60–30 °C Accuracy: 0.5 m/sWind Monitor Model 05103-45, R.M.Young, Traverse City, MI, USA
Wind directionTemperature range: −60–30 °C Accuracy: 0.3°Wind Monitor Model 05103-45, R.M.Young, Traverse City, MI, USA
Air temperatureTemperature range: −60–10 °C Accuracy: 0.1 °CHMP155A, Vaisala, Vantaa, Finland
Air humidityTemperature range: −60–10 °C Accuracy: 2%RHHMP155A, Vaisala, Vantaa, Finland
Atmospheric pressureTemperature range: −60–30 °C Accuracy: 0.6 hPaPTB110, Vaisala, Vantaa, Finland
Table 2. Advantages and disadvantages of different silicon solar cells.
Material NameAdvantagesDisadvantages
Monocrystalline siliconHigh conversion efficiency, mature technology and small footprintExpensive and high requirement for incident angle of sunlight
PolysiliconThe conversion efficiency is higher than that of amorphous silicon, the manufacturing cost is lower than that of monocrystalline silicon, and the low requirement for incident angle of sunlightConversion efficiency is lower than monocrystalline silicon, and the process is complicated
Amorphous siliconMinimum requirement for incident angle of sunlight and high acceptance rate of astigmatismLow conversion efficiency
Table 3. Key specifications of the photovoltaic (PV) panels.
CharacteristicsValueUnit
Open circuit voltage (Voc)42.64V
Optimum operating voltage (Vmp)34.96V
Short circuit current (Isc)9.48A
Optimum operating current (Imp)8.59A
Maximum power at STC 1 (Pmax)300W
Operating temperature−50 to 85°C
Size1956 × 992 × 50mm
1 Standard test conditions.
Table 4. Key specifications of the wind turbine.
CharacteristicsValueUnit
Cut in speed2.5m/s
Rated wind speed10m/s
Cut off speed45m/s
Rated power10KW
Peak power12KW
Diameter of impeller7.8m
Operating temperature−50 to 85°C
Number of blades3
Generator typeThree-phase AC permanent magnet generator
Blade materialReinforced glass steel
Table 5. Key performance comparisons of each battery.
ClassificationElectrolytePrincipleOperating Temperature (°C)
Lead–acid batteriesDilute sulfuric acidOxidation-reduction reaction−50 to 70
Lithium–ion batteriesOrganic lithium salt electrolyteIon migration−50 to 70
Nickel–cadmium batteriesPotassium hydroxide aqueous solutionOxidation-reduction reaction−20 to 45
Nickel–hydrogen batteriesPotassium hydroxide aqueous solutionOxidation-reduction reaction−20 to 60
Sodium–sulfur batteriesNa-β-Al2O3Chemical reaction300 to 350
Table 6. Key specifications of the low-temperature test chamber.
CharacteristicsValueUnit
Rated power668W
Rated voltage220V
Temperature range−60 to 86°C
Temperature adjustment accuracy0.1°C
Effective volume340L
Noise level52dB
Table 7. Parameters of the transfer function.
ParameterValue
k0.8
T48.75
τ11.2
Table 8. Terminal names and general descriptions of the electrical interface of the control system.
Terminal NameDescriptionDirection
P6.7Voltage monitoringInput
P7.5Current monitoringInput
P6.0Battery condition monitoringInput
P6.1Wind turbine unloadingOutput
P1.1, P1.2, P4.5, P4.6PWM controlOutput
P4.0, P4.1, P4.2, P4.3PWM driveOutput
Table 9. Relevant parameters of the DC/DC conversion circuit.
ParameterValueUnit
C11μF
C21μF
C33.3nF
C40.1μF
C510μF
R113
R218
R3156
L13.3μH
Table 10. Relevant parameters of the power supply circuit.
ParameterValueUnit
C6100μF
C70.1μF
C80.1μF
C9100μF
C100.1μF
C110.1μF
C120.47μF
Table 11. Relevant parameters of the solar/wind charging circuit.
ParameterValueUnit
C13470μF
C14330μF
C15100pF
C16100pF
C170.1μF
C180.1μF
C190.1μF
R430
R515
R615
R730
R830
L2100mH
L3100mH
Table 12. Monthly fuel consumption of Zhongshan Station.
JanFebMarAprMayJunJulAugSepOctNovDec
Fuel consumption(t)18.718.419.3119.8121.721.522.521.8320.4620.1217.919.1

