Review

Personal Climatization Systems—A Review on Existing and Upcoming Concepts

by
Alexander Warthmann
*,
Daniel Wölki
,
Henning Metzmacher
and
Christoph Van Treeck
Institute of Energy Efficiency and Sustainable Building E3D, RWTH Aachen University, 52074 Aachen, Germany
*
Author to whom correspondence should be addressed.
Appl. Sci. 2019, 9(1), 35; https://doi.org/10.3390/app9010035
Submission received: 26 September 2018 / Revised: 14 November 2018 / Accepted: 20 December 2018 / Published: 22 December 2018
(This article belongs to the Special Issue New Heating and Cooling Concepts)

Abstract

:
To accomplish the current climate goals of the federal republic of Germany, energy efficiency within the building and automotive sector must improve considerably. One possible way to reduce the high amount of energy required for heating, ventilation, and air-conditioning (HVAC) is the introduction of personal climatization systems in combination with the extension of the standardized room air temperature range. Personal systems allow improvements of climatic conditions (heating, cooling, and air quality) within sub-areas of the room instead of conditioning an entire room air volume. In this regard, personal systems are perfectly suitable for locations with local air-conditioning focal points, such as open-plan offices and vehicle cabins, where they substantially improve the energy efficiency of the entire system. This work aims to summarize previously conducted research in the area of personal climatization systems. The investigated local thermal actuators comprise fans for the generation of air movement, ventilators for the improvement of the air quality within the respiratory area of persons, water-conditioned panels for the climatization of persons via longwave radiation and conduction, radiant heaters, and combinations of the systems. Personal systems are superior to mixing ventilation regarding the improvement of the perceived air quality and thermal comfort. Furthermore, the introduced overview shows that personal climatization systems are generally more energy-efficient than conventional air-conditioning and facilitates the extension of the indoor air temperature corridor of the HVAC. Table fans and climatized seats are highly effective in connection with the improvement of personal thermal comfort. The performance of the overwhelming majority of applied personal environmental control systems is user-controlled or depends on a predefined load profile, which is generally defined person independent. Single studies reveal that effectively controlled automated systems have a similar thermal impact on a user’s thermal comfort as user-controlled ones. The implementation of an automated control system is feasible by using novel approaches such as the so-called human-centered closed loop control-platform (HCCLC-platform). The latter contains a central data server which allows asynchronous, bi-directional communication between multi-modal sensor data, user feedback systems, thermal actuators and numerical calculation models used to assess the individual thermal comfort of a person. This enables a continuous and holistic reflection of the thermal situation inside a room and the estimation of the corresponding impact on an individual’s thermal comfort. Considering the measured and simulated thermal state of a single person, the described system is capable of determining body-part-specific energy requirements that are needed to keep the overall thermal comfort level of an individual person on a high level.

1. Introduction

In connection with the goals of the European Union, the greenhouse gas emissions in Germany must be reduced by 55% and 80% until 2030 and 2050 [1], respectively. To accomplish these goals, the energy efficiency of buildings and vehicles must be substantially increased, where the main task of buildings and vehicles is to guarantee a thermally comfortable indoor climate to the occupants. Here, the sectors trade, commerce and services contribute to more than 15% of the final energy consumption in Germany, where more than 50% of their energy consumption is used for heating, ventilation, and air-conditioning (HVAC) [2]. About a quarter of their energy consumption can be attributed to office buildings, in which more than 70% of the final energy consumption is used for HVAC systems [2].
A reduction of the energy consumption used for the climatization of buildings is counteracted by the wish of occupants for a thermally comfortable indoor climate. Here, it is known that an improved indoor climate can substantially enhance the productivity and health of occupants in buildings and vehicles [3,4]. According to Wyon et al. [5], the ambient air temperature is interrelated with productivity. Even though, McCartney and Humphreys [6] could not confirm this observation, they found a correlation between thermal sensation and productivity. Rim et al. [7] showed an improvement of the thermal indoor climate in tropical regions using preconditioned air from the outside. The researchers state that even though additional energy is required for the preconditioning of air, it is economically reasonable to follow this approach, because the resulting energy overhead can be easily compensated by the resulting performance and health improvements. Here, the researchers state that an increased building ventilation rate enhances health and productivity of the occupants especially at indoor temperatures above 24.5 C . Furthermore, Rim et al. [7] state that the energy consumption and corresponding costs for providing a minimum building ventilation rate of 25 L s −1 at an indoor temperature of 28 C is very low compared to the annual salaries in Singapore.
Labor costs are one of the most important cost factors during the life cycle of an office building. Therefore, investments in the performance improvement of the staff pays rapidly [8]. Personal environmental control (PEC) improves the quality of the thermal climate directly in the area of an individual. It is moreover economically reasonable due to both, the higher productivity of the occupants and the enhancement of the standardized temperature corridor related to HVAC, which is specified in DIN EN ISO 7730 [9].
In contrast to the building, there is no legal regulation concerning the determination of the energy demand of the vehicle air-conditioning. Therefore, the economical and comfort-related factors of vehicles are not comparable [10]. For a reasonable energy consumption forecast of the air-conditioning system of a vehicle detailed, vehicle-specific information about the average driving profile, climatic boundary conditions and the driving behavior is required [10]. Based on an average outdoor climate/driving profile calculated on the base of the new European driving cycle (NEFZ), Kemle et al. [10] calculated the additional average annual energy consumption of an air-conditioning system as 0.5 L /100 km. This result is representative for systems that use convective heating for the conditioning of an entire vehicle cabin of cars with conventional combustion engines and ambient temperatures of 22 C .
Vehicles with combustion engines are superior to currently available electric driven vehicles regarding their driving range [11]. Some high-cost electric vehicles have a high battery capacity and a driving range above 400 k m , which of course depends on the local environmental weather conditions. However, the used accumulators are heavy and compared to the driving range expensive [11]. The majority of the currently available electric vehicles have a maximum driving range of about 200 k m [11]. Vehicles with combustion engines reuse the waste heat of the combustion process to heat up the vehicle cabin. Since electric vehicles have a much higher energy efficiency, the whole energy for the air-conditioning system must be delivered by the accumulator itself. Therefore, the use of conventional air-conditioning concepts reduces the driving range of the vehicle substantially. The diminution of the energy demand for air-conditioning is therefore of fundamental importance to produce cost-effective electric vehicles with an acceptable and reliable driving range.
Having said this, it becomes clear that innovative HVAC approaches for electric vehicles are required to be able to support or substitute currently available HVAC systems. One of these approaches that combines highly efficient, decentralized climate actuators that act closely to the human body is investigated in [12,13,14,15]. Furthermore, it is of great importance on the way to an energy-efficient, demand-based air-conditioning system that the entire or partly substitution of existing central HVAC systems is accompanied by optimized control strategies that consider the balancing of energy consumption and thermal comfort [10].
Neither in the vehicle nor in the building it is efficient to condition the entire air volume with the goal to provide a thermally comfortable indoor climate. By applying decentralized, energy-efficient local thermal actuators (PEC) persons can be individually conditioned for example by introducing an independent heated seat in combination with personal ventilation systems. As a result, the occupants experience an individual thermal climate-optimization, which allows to extend the temperature corridor that must be provided by the HVAC system in order to guarantee optimal thermal comfort and reduces the overall system energy consumption greatly.
According to Melikov et al. [16] and Huizenga et al. [17], about 50% of the occupants are dissatisfied with the indoor air temperature and perceived air quality in existing buildings with displacement ventilation. Here, Melikov et al. [16] showed that an improvement of the occupants’ thermal satisfaction can be achieved by increasing the supply air temperature. This, however, could worsen the perceived indoor air quality (IAQ). It is well known that the minimum predicted percentage of dissatisfied (PPD) concerning the indoor climate in centrally air-conditioned buildings is 5% [9,18]. A building with a central HVAC system conditions the entire room air volume and requires well defined thermal environmental conditions to be able to provide thermal comfort to the occupant. This is due to the various combinations of physical parameters that can cause thermal discomfort due to draughts (DR), vertical air temperature differences, cold or warm floors and asymmetric radiation (PD) [9]. If an occupant experiences overall thermal discomfort, local thermal asymmetries will be even more unpleasant [19,20].
A central HVAC system is heating and cooling a room and the human body as a whole in an almost homogeneous manner. In contrast to this, applied personal HVAC systems improve the quality of the physical ambient in sub-areas of the room and are perfectly suitable for indoor spaces with local air-conditioning hot spots such as vehicle cabins or workplaces in office buildings. Furthermore, it allows to condition single body parts under consideration of body-part-specific energy demands that are related to local thermal comfort. Furthermore, for personalized climatization systems it is acceptable to increase thermal asymmetries and asymmetries related to local air velocities due to the reason that individual control is available. This, however, requires a higher sensor coverage to be able to ensure thermal comfort. According to Brager et al. [21] applied personal control systems for the workplace improve thermal comfort and perceived air quality. An energy-efficient implementation of the personal HVAC system goes along with the extension of the targeted room air temperature range, thereby ensuring energy savings, while at least providing constant thermal comfort [21]. Such energy-efficient air-conditioning systems can contribute to tackle questions related to energy poverty. The latter is related to individuals that mainly have low incomes and can simply not afford to condition their indoor space in a sufficient manner due to high energy costs [22,23,24]. According to Pye et al. [22], Csiba et al. [24], more than 10% of the European citizens live in energy poverty as a result of increasing energy costs [23]. The solution of this problem is addressed by only a few countries so far [23]. However, the importance of addressing this point increases due to the shift to natural energy sources that imply additional increases in energy costs and encourage energy poverty. The topic gained so much importance that the European Union published a handbook about energy poverty [24]. A possible solution for this fundamental issue is the use of energy-efficient personalized climatization systems. Such systems were already used successfully in the past. Here, local air-conditioning systems were efficiently applied in private households for example the use of under-desk heating systems in Japanese households [25]. However, the implementation of such climatization strategies needs further investigations, especially in the context of energy poverty, where the identification of concerned households represents one of the future challenges [26]. Liddell and Morris [27] concluded that insufficient heating and cooling comes along with health implications especially for infants. It significantly affects mental health of adolescents and adults. Furthermore, the researchers discovered a correlation between energy poverty and mortality rate. An improved thermal comfort and a higher perceived air quality enhance the productivity and lead to less absence days of the occupants [6]. Furthermore, applying personal HVAC systems can save more than 30% of the energy consumption in office buildings [28] and improves the thermal sensation of passengers in vehicles, while operating at a lower exergetic level [13]. This paper summarizes previously conducted research in the area of personalized climatization and aims to show possible improvement potentials related to the design and implementation of energy-efficient and comfortable indoor environments that go hand in hand with increased health and productivity of the occupants inside. Furthermore, it summarizes and compares existing approaches and provides suggestions for the selection and combination of adequate systems for specific thermal environments.

2. Thermal Comfort

Thermal comfort is strongly depending on a person’s subjective sensation of the thermal environment, which differs from person to person [9]. However, according to Huizenga et al. [17], Bauman et al. [29], thermal comfort, room acoustics and air quality are weak points of existing buildings. Therefore, it is essential to improve the thermal and air quality within buildings since anticipated comfort, health and productivity of individuals are linked to all of them [6,30]. Predicted productivity, for instance, increases concurrently to thermal satisfaction [6,17,30]. Furthermore, since humans spend most of their time indoors [31], the control of the indoor climate is of great importance.
The general experience of thermal comfort of humans depends on thermal and non-thermal influences of the indoor climate [32]. The human body seeks to maintain an overall thermal equilibrium, which is achieved as soon as its energy losses equal the gains [32,33]. This is the case, if the body’s core temperature neither exceeds 37 C nor falls bellow a temperature of 36 C . Within this physiological temperature range, the human skin has an average surface temperature of about 34 C . Current research shows that individual thermal comfort correlates well with further individual and partly intercorrelated personal issues such as experience, expectation, behavior and physiological adaptation of humans [34]. Cultural and social background of a person affect thermal comfort as well [35]. If the occupant is able to adjust the thermal impacts (for example by adjusting shadings or the heating power of a radiator), the thermal environment will be experienced as more comfortable than without individual adjustment possibilities [30,36,37,38,39]. Current standards, such as DIN EN ISO 7730 [9], ASHRAE 55 [18], ISSO-publicatie 74 [40], consider this by lowering the requirements for HVAC for naturally ventilated buildings. However, the adaptability of occupants is limited [41], which can be partly attributed to prescribed dress codes and the general acceptance of the occupants. Assuming light office work, an indoor room temperature of 23.5 C is an averaged thermal optimum [42]. In contrast, the majority of studies did not consider a constant optimum indoor temperature, because it comes along with several issues, such as the thermal history of an individual person [41] and the preceding outdoor temperature [43]. However, control strategies for HVAC systems that are based on the predicted mean vote (PMV) ensure higher thermal comfort than strategies based on a static indoor air temperature [44,45], buildings are most commonly controlled towards a static optimum indoor temperature without taking further environmental conditions into account.

3. Determination of Thermal Comfort

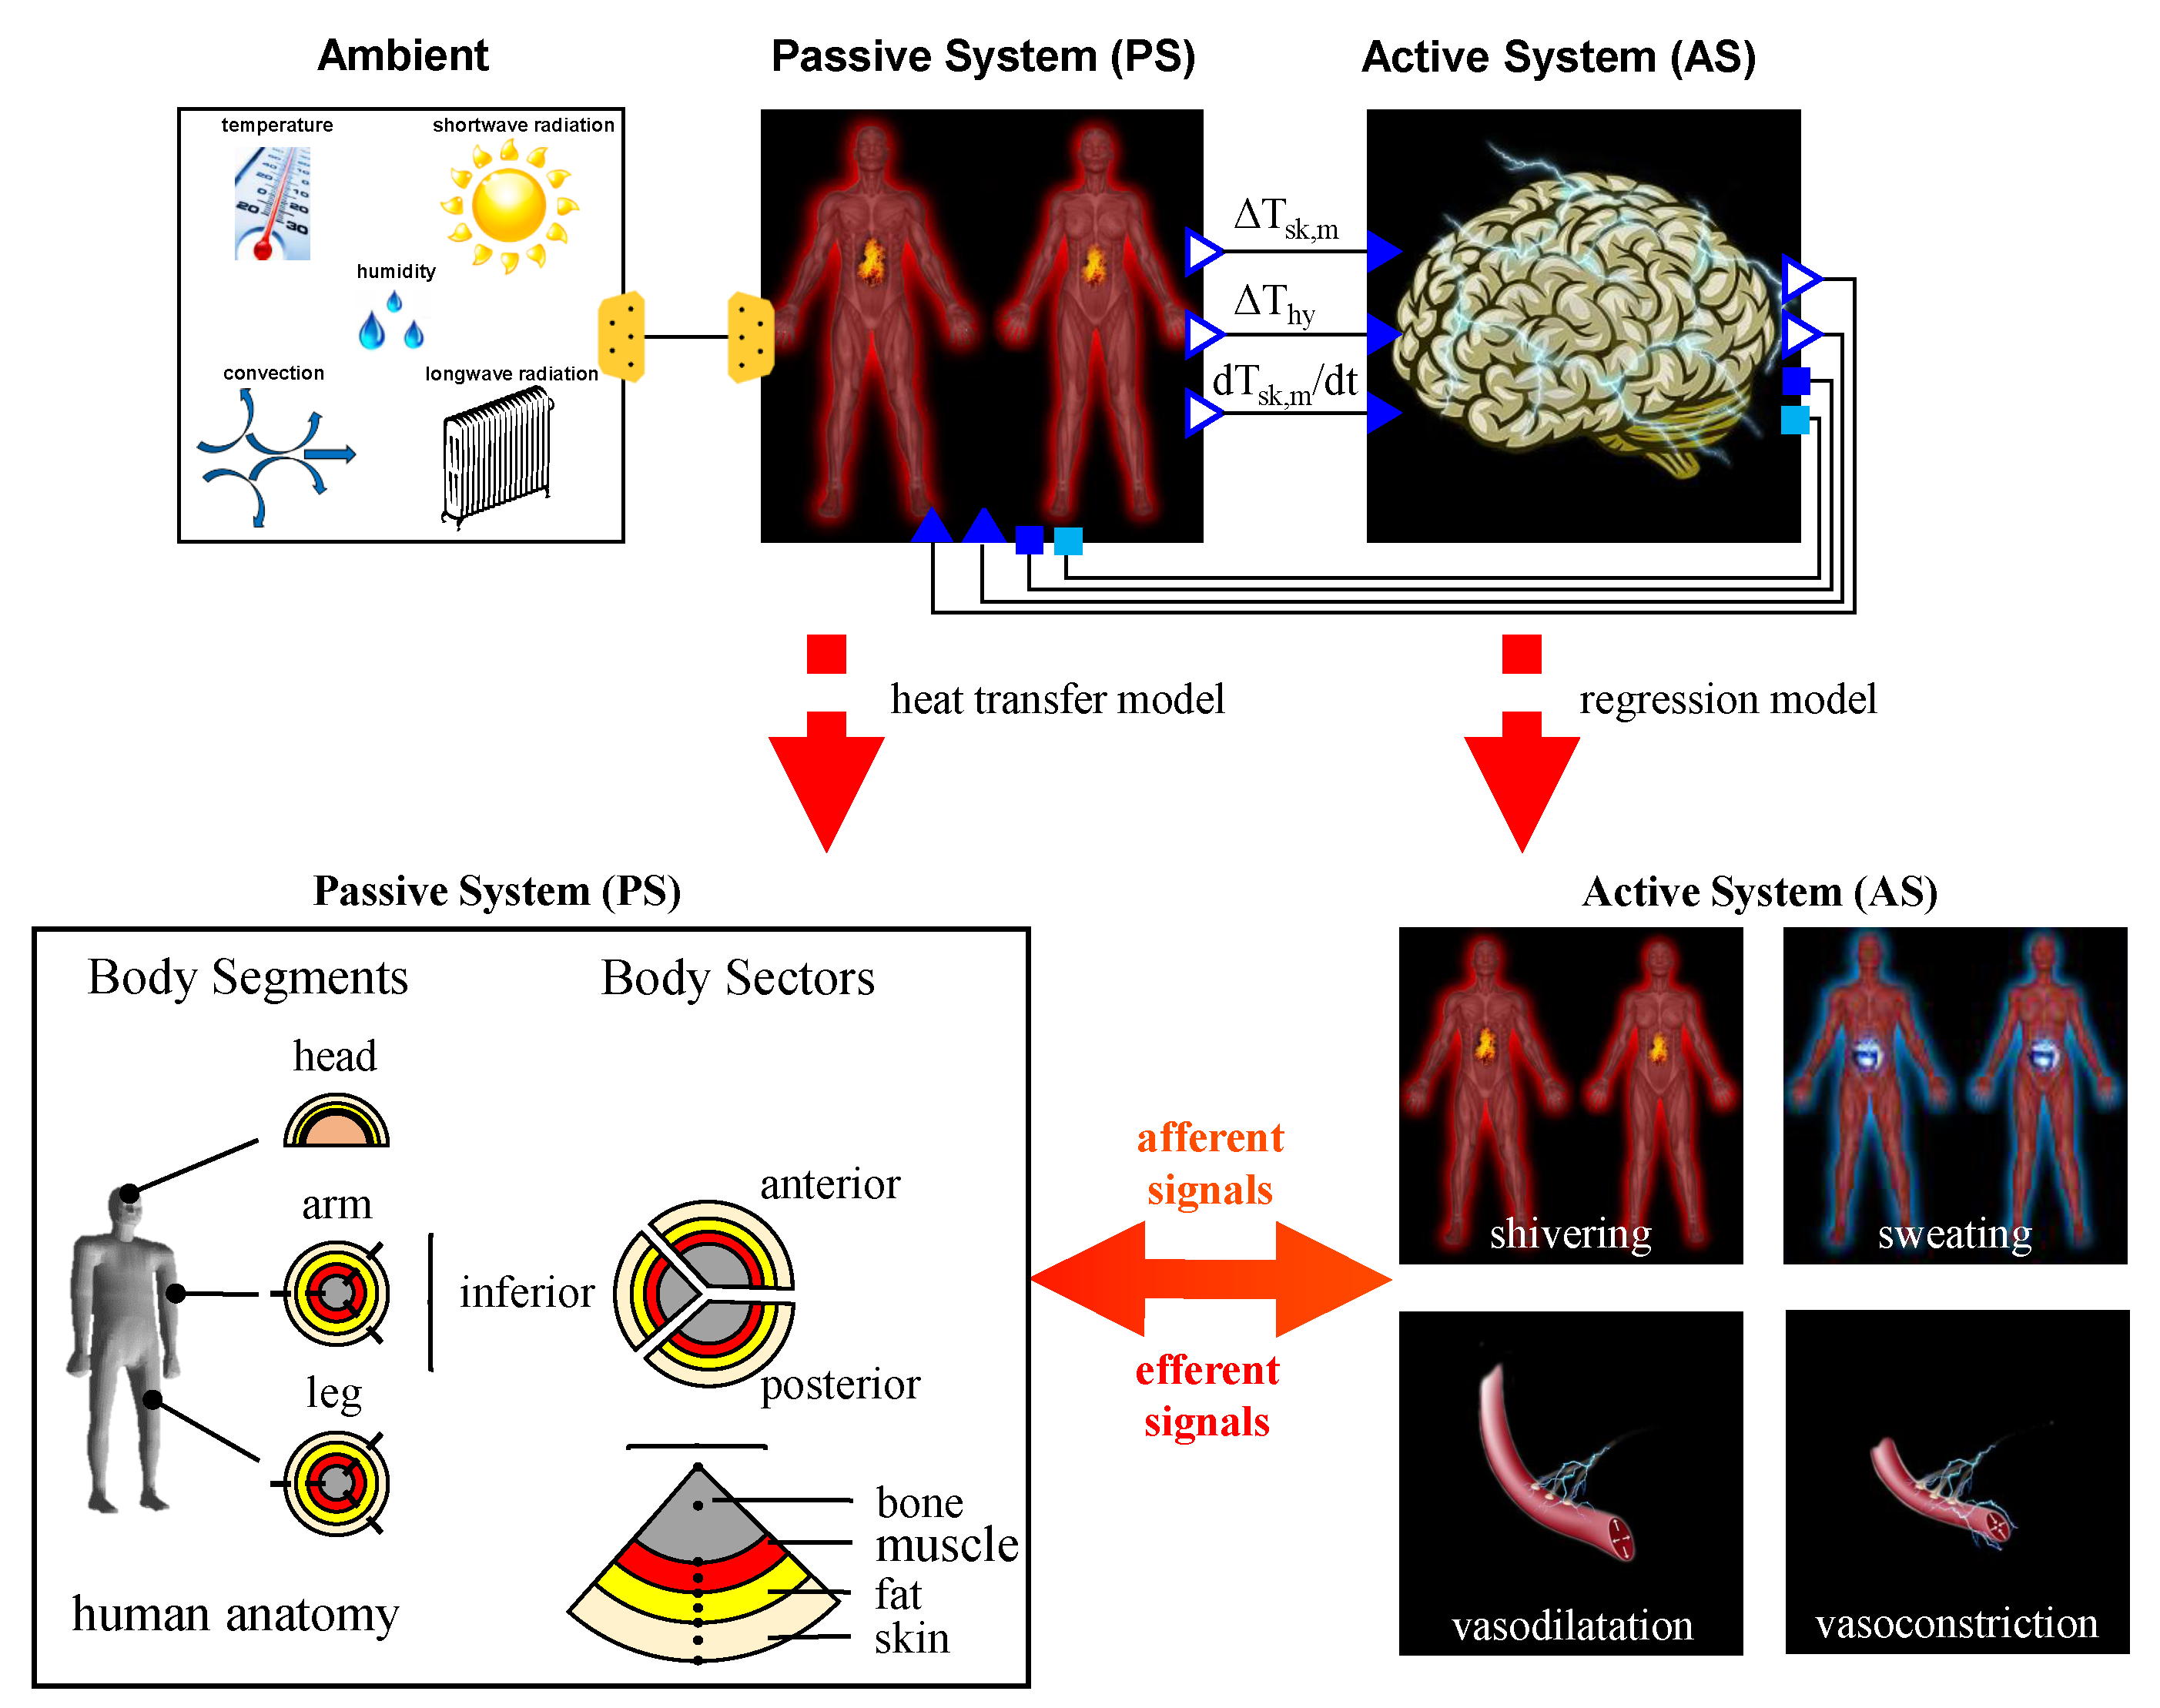
The PMV/PPD model of Fanger [32] is an established model to predict thermal comfort under static conditions close to thermal neutrality and moderate indoor climates for a large group of people, where PMV represents the predicted thermal sensation and PPD the percentage of dissatisfied persons with the thermal environment [32]. In contrast, adaptive comfort models consider the human as an active part of the comfort assessment model. These adaptive models are more precise, especially inside naturally ventilated buildings with high adaptation possibilities of the occupants, because in this case, they represent the real environmental conditions more accurately than the PMV [39,46,47]. To consider this fact, Fanger and Toftum [48] transformed its PMV model into an adaptive PMVe model, using an expectancy factor, which reduces the calculated PMV in connection with the expectations of the occupants. Several adaptive models consider psychological, physiological and behavioral adaptation processes. For instance, the predictions of the adaptive models of Yao et al. [49] and Humphreys and Nicol [50] better present the real thermal sensation than predictions based on PMV [51]. The adaptive thermal heat balance model (ATHB) of Schweiker and Wagner [52] combines the adaptive comfort approach of ASHRAE 55 [18], DIN EN 15251 [47] with Fanger’s PMV model. In this regard, the researchers developed equations that are used to dynamically modify the clothing insulation level and the metabolic heat production of the PMV model. Furthermore, the equations consider behavioral, physiological and psychological adaptation processes of individuals and were derived on the basis of ASHRAE RP884. The evaluation of the model was performed by the use of an independent dataset the researchers gained from experiments in their own test facility. The predicted results of the ATHB model show good agreement with experimental data and results produced by the PMV and ATC model. Finally, ATHB itself is assumed to be applicable to naturally ventilated and air-conditioned buildings.
de Dear et al. [39] developed an adaptive model for the estimation of the optimal indoor air temperature that is linked to the outdoor air temperature. The determination of an equivalent temperature is a suitable approach for the thermal assessment of a heterogeneous indoor climate and facilitates the comparison between different thermal environments. Such a model is the “Standard Effective Temperature” (SET) [18,53]. According to this model, the indoor air temperature of a fictive environment is calculated (50% relative humidity, < 0.1 m s −1 air velocity, radiant temperature equals air temperature, 1 met, 0.6 clo) so that the thermal heat loss via the skin is equal in the fictive and real environment. DIN EN ISO 14505-2 [54], Nilsson [55] describe the equivalent temperature model (Teq). This temperature corresponds to the calculated indoor air temperature of a fictive and thermally homogeneous room without air velocity so that the heat exchange via convection and radiation is equal between the fictive and real environment. International standards consider adaptive approaches for the assessment of naturally ventilated buildings [18,47], but as Kim et al. [51] have shown, adaptive models are also advantageous for the assessment of air-conditioned buildings. Thermal comfort can be determined through both, applying thermal comfort models and performing user surveys [
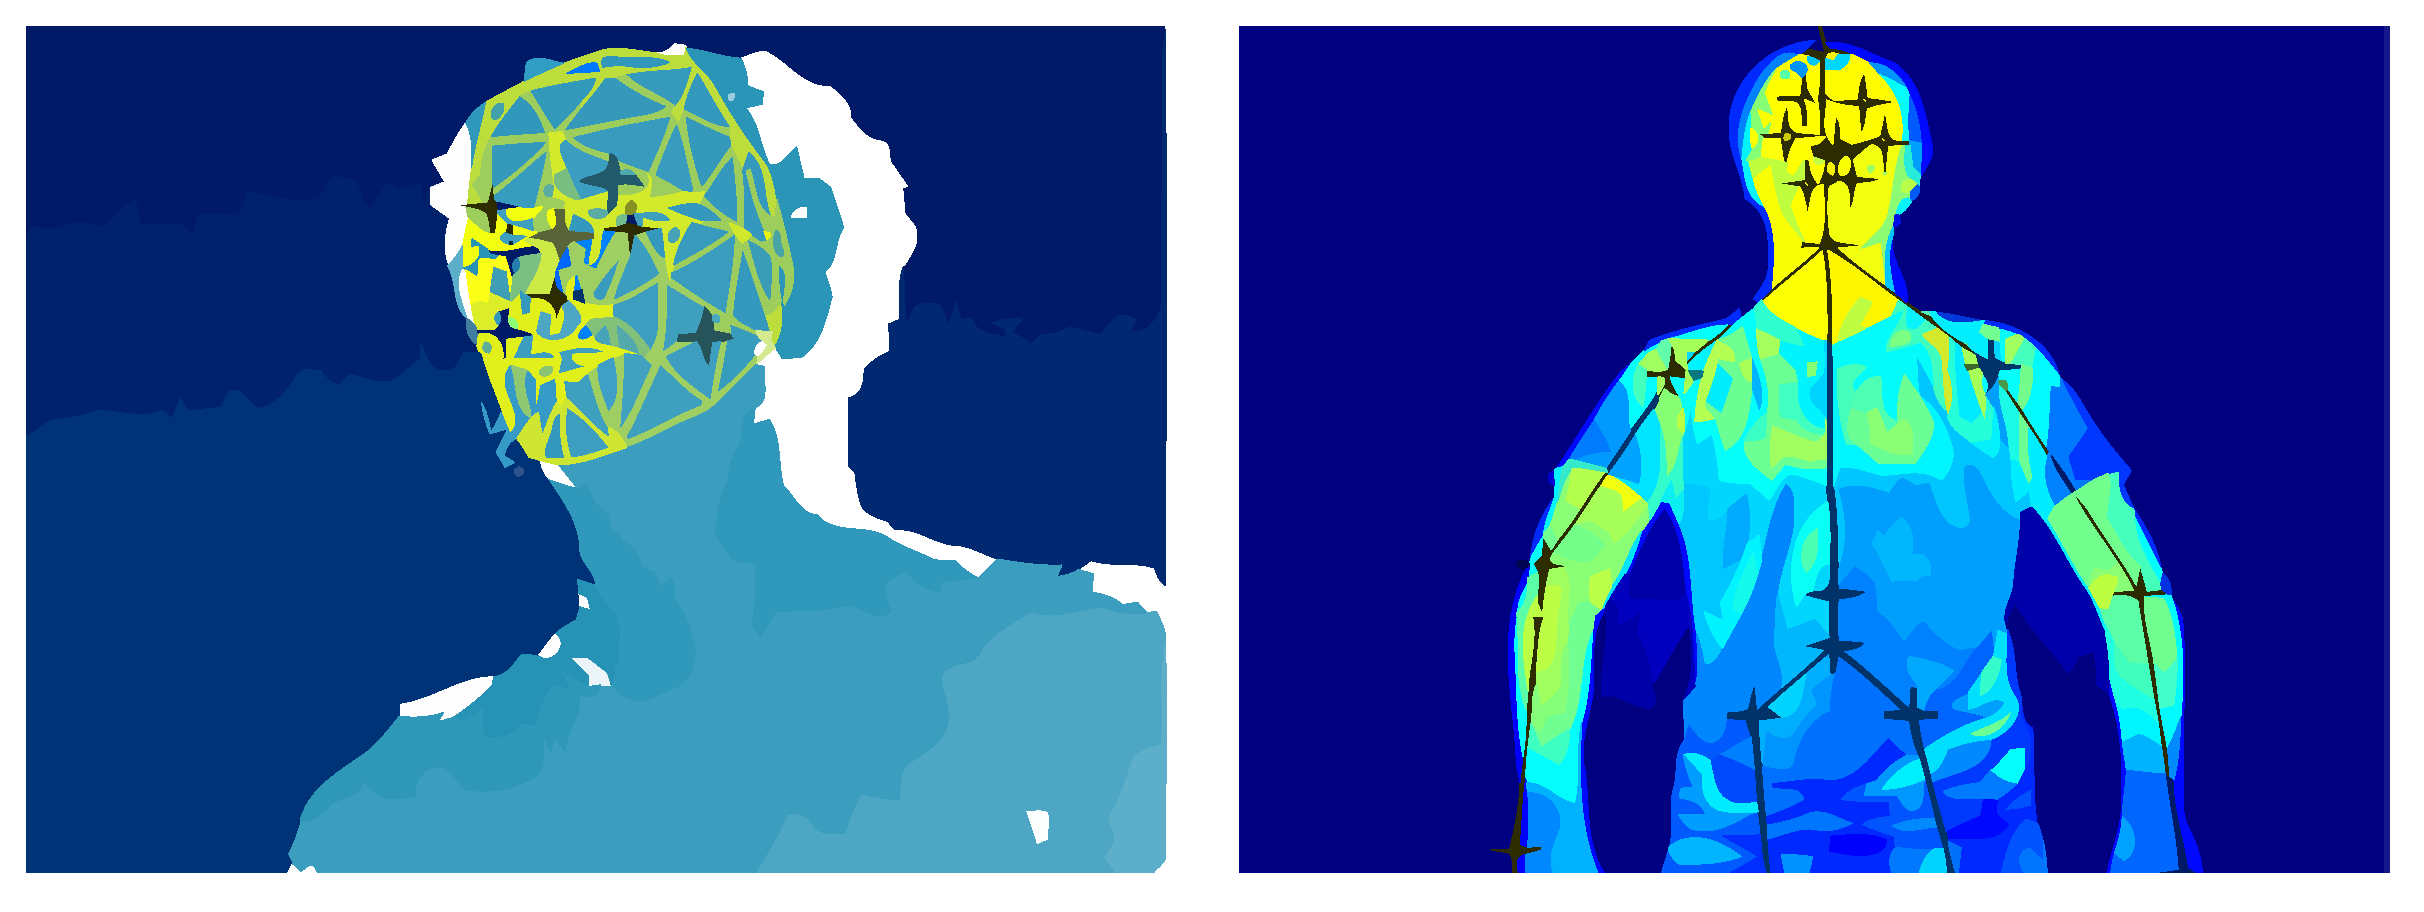
56]. Since thermal sensation correlates with thermophysiological characteristics such as the body core temperature, skin temperature and sweating [57], the measurement of either the skin temperature or the body core temperature enables the determination of the contemporary thermal sensation [58,59]. Skin temperature depends on clothing insulation and operative temperature [60] and can be measured at exposed locations using contactless infrared sensors. [19,20,58,61,62,63,64,65] showed that the global thermal comfort of a person is affected by the local thermal comfort of individual body parts. Regarding this, Arens et al. [19], Zhang [64], Zhang et al. [65] describe a physiological thermal comfort model for steady, homogeneous, transient and asymmetric environmental conditions considering the correlation between local and global thermal sensation. It estimates the global thermal comfort based on the determined state of the local thermal comfort. Thermal manikins and models considering thermophysiological reactions are suitable for the examination of thermal comfort and the assessment of local heat losses under inhomogeneous environmental conditions [66].

4. Personal Climatization Systems

Personal climatization systems individually improve the indoor climate within the operation range of the occupant and are highly suitable for open-plan offices or vehicles. Effective heating in cold environments is mainly achievable by using heated surfaces, radiant heaters and warm air. Personal cooling is especially done by applying directed air flow. The cooling effect can be further improved by preconditioning the air down to a lower air temperature. Personal ventilation is the supply of fresh, preconditioned air towards the breathing area of the occupants and improves the quality of the inhaled air, which improves thermal comfort and perceived air quality. Simultaneously, the concentration of the contaminants in the inhaled air is reduced and therefore, the risk of cross-contamination is lowered. Personal climatization individually improves the local thermal environment under consideration of individual thermal preferences and hence, reduces complaints about the indoor climate. Thermal optimization of the workplace leads to a higher productivity and improved health of the staff [6,30]. Higher quality of the inhaled air reduces the amount of absence days, which further improves the productivity of the occupants.
Although several studies have shown that occupants request for a higher air velocity especially in a neutral to warm environment [67,68,69,70,71], current standards generally restrict the use of air velocity for air-conditioning [9,18]. The energy-efficient implementation of personal climatization must be accompanied by the application of an extended target temperature range of the HVAC system. However, the possible, optimal energy-efficient ambient temperature range depends on the building size, outdoor climate, occupancy and must consider the thermal comfort of the occupants within the building [72]. Personal evaporative coolers with supply of 100% fresh air reduce the cooling energy demand by 6% K −1 due to the related possible increase of the maximum room temperature [73]. The cooling energy savings can be enlarged to 25% K −1 by supplying 40% recirculated room air.
Using personal fresh air supply, the influencing factors on the energy demand of the HVAC system differ between cold and hot humid outdoor climate [74,75]. According to Schiavon et al. [74], in hot and humid regions such as Singapore, the introduction of personal fresh air supply can save up to 51% of the energy compared to mixing ventilation. Their calculation is based on the assumption that the maximum room air temperature increases from 24 C to 28 C , the volume air flow decreases from 6.5 L s −1 to 2.5 L s −1 and the personal thermal actuators are solely enabled when the occupant is present. As revealed by Schiavon and Melikov [75], in high standard heat insulated buildings of cold regions such as Copenhagen, the use of personal climatization systems saves up to 60% of the energy consumption of the HVAC compared to mixing ventilation. To achieve this, the supply temperature must be preconditioned to a low, but thermally acceptable temperature. In addition, the maximum indoor temperature must be guaranteed to be thermally acceptable. The latter is of highest importance for saving energy, because otherwise the energy consumption would be higher than without personal climatization systems since, as a result of the essential heating of the supply air for thermal acceptance, the cooling load would be extended, too. Bauman et al. [29] evaluated a personal environmental control system, consisting of preconditioned supply air on top of the desk, a radiant heating panel below the desk and individual lighting control implemented in office buildings of a bank in San Francisco. The accomplished system reduces the dissatisfaction with the thermal quality and air quality to 0% and 6%, respectively. Both, thermal quality and perceived air quality, increase by 0.84 scale steps and 0.46 scalepoints (bipolar seven point scale), respectively. By using PEC both, thermal air quality and perceived air quality, are consequently superior to lighting quality, furnishing, conception of space and room acoustics [29], which is contrary to existing evaluations of these factors in conventionally conditioned buildings [17,29].
Several local actuators for personal climatization systems are used in the automotive sector. Most widely used are seat heating/cooling, heated steering wheels and heated side panels. According to Schmidt et al. [12], seat heating alone is not able to provide thermal comfort at 17.4 C (dissatisfaction partly >40%). In contrast, a combined personal heating system, consisting of seat heating, heated steering wheel, heated side panels and heated panels in close distance to the feet ensures thermal comfort down to an ambient temperature of 16 C [13].
A detailed overview of the currently available, personal climatization systems is summarized in Table A1, Table A2, Table A3, Table A4, Table A5, Table A6. In general, personal climate actuators can be classified into three groups:
  • local personal ventilation
  • local radiant panels
  • combined local thermal actuators (radiation, convection)
All three groups are further divisible into the following categories, in close correlation to their individual thermal effect:
Most of the listed studies were performed under controlled ambient conditions within laboratory studies and need further validation in the field. Current field studies [29,76,77,78,79] confirm the potential of personal HVAC systems in terms of thermal comfort. Fundamentally for the investigation of personal HVAC systems are studies assessing the correlation between whole-body and local thermal sensation.
Most of the personal cooling systems are based on the local enhancement of air velocity for the improvement of the thermal comfort. Increasing air velocity improves both, thermal comfort and perceived air quality [80]. Commercially available fans used for the generation of air movement do not contain any definition of the cooling power. The calculation of the thermal compensation related to the energy consumption of ventilation systems leads to a benchmark (CFE) of the cooling power of several applied ventilation systems [81]. Similar to this, Zhang et al. [28] developed a general benchmark (CP) for local thermal actuators, which act close to the human body. It requires a standardized experimental setup for the comparison of the air-conditioning performance between different thermal actuators such as different fans. This is important for the transferability of these results to arbitrary environments. Arens et al. [82] investigated various experimental setups and their impact on the performance estimation of ceiling fans. Without a known comparable cooling/heating power, the obtained results of their studies are only comparable with respect to the used thermal actuators. Varying air velocity that is similar to natural wind decreases thermal sensation more considerably than a constant air velocity [76,83,84]. According to Uğursal and Culp [85], the ventilation of the head, hands and feet is more effective than the ventilation of the head only (Table A1-6).

4.1. Desk-Mounted Personal Actuators

Personal climatization systems at workplaces that consist of desk-mounted climate actuators improve thermal comfort and perceived air quality. Most of the related studies address cooling via ventilation using fans that are mounted above or below the desk. Some of them use radiation or conduction to improve thermal sensation and comfort. An overview of the corresponding literature and their results is given in Table A1. The thermal performance of immobile climate actuators is sensible to the location and posture of the related person. If a person leaves the climatization area, the thermal impact of manually operated desk-mounted ventilation system drops [86,87]. In contrast, horizontal movement of the occupant does not significantly influence the thermal performance of a ventilator. Using air movement can provide thermal comfort up to an ambient temperature of 28 C and a relative humidity of 80%. According to Atthajariyakul and Lertsatittanakorn [88], He et al. [89] this is feasible by using a table fan (maximum energy consumption of 3 W ) with a supply air velocity of 1.5 m s −1 (Table A1-1, Table A1-12). Supplying air at a velocity of 2.3 m s −1 at ambient temperatures of up to 30 C is comfortable and leads to a thermal acceptance higher than 80% [89]. A fan (average air velocity 0.8 m s −1) with air velocity profiles that are comparable to natural wind has a higher cooling effect than constant airflow of the same average air velocity [76,84] (Table A1-8, Table A1-9, Table A1-10). According to Cui et al. [84], a variable airflow provides higher thermal comfort than a constant airflow at an ambient temperature of at least 30 C . Since horizontal and varying air speeds that are directed towards the face have a high ventilation efficiency, it can save up to 21.34% of cooling energy, when compared to a constant personal air flow [90].
Bauman et al. [91] used thermal manikins for investigations of the cooling power related to different air speeds produced through an under-desk-mounted ventilation device (maximum volumetric air flow 70 L s −1). Therefore, the cooling power temperature equivalent that is necessary for the climatization of an entire person equals 4 K at 28 C and 3 K at 26 C . According to Watanabe et al. [92] the local temperature effect that can be produced by an under-desk-mounted heating panel at an ambient temperature of 20 C equals a 2.8 K increase in overall room temperature, using mixing ventilation. Boerstra et al. [93] (Table A1-5) showed that a personal HVAC system with automated control can provide the same thermal comfort as a user-controlled system, if the ventilation load profiles are equal. However, occupants prefer scenarios with user-controlled ambient conditions. According to He et al. [94], a water cooled table surface (cooling power 130.7 W ) that cools the upper body region, ensures global thermal comfort at ambient temperatures between 28 C to 32 C (Table A1-3). In such scenarios, however, occupants are expecting increased air movement. The investigated table surface temperature used in their study was set between 22.8 C and 25.5 C , respectively. Veselý et al. [95] showed that a heated desk pad improves thermal comfort of occupants at an ambient temperature of 18 C (Table A1-2).

4.2. Personal Vertical and Horizontal Ventilation

The use of personal ceiling fans ensures thermal comfort in warm environments [82]. However, horizontally and vertically mounted fans (Table A2) condition a larger space than table fans, which makes this kind of personal HVAC systems unusable for a dedicated climatization of individual body parts. Personal ceiling fans installed above chairs that are positioned in close distance to the window are of big advantage for mixing ventilation systems during the summer season, because they direct cool fresh air to the respiratory area of the occupant, which provides individual thermal comfort in an energy-efficient way [96]. Energy-efficient ceiling fans (Table A2-15) improve thermal comfort and perceived air quality at a constant airflow up to ambient temperatures of 28 C [97]. The performance of oscillating fans with varying, personal airflow depends on the oscillation interval. According to Pasut et al. [97], oscillating fans have no impact on thermal comfort at a cycle duration of 25 s , of which 15 s are designed to be resting time. Ceiling fans with that produce air speeds of 1.2 m s −1 considerably improve thermal comfort and achieve a thermal acceptance higher than 80% at ambient temperatures of 30 C and a relative humidity of 80% [98] (Table A2-14).
According to Huang et al. [99], standing fans that produce air speeds up to 2 m s −1 provide thermal comfort at ambient temperatures of 30 C , but are insufficient for higher ambient air temperatures (Table A2-17). Confirming this, Zhai et al. [100] showed that air temperatures of up to 30 C will be better accepted (80%) if horizontal fans are used. Furthermore, the acceptable maximum ambient temperature additionally depends on a person’s metabolic rate [9]. According to Arens et al. [101], horizontal ventilation ensures thermal comfort at metabolic rates of 1.2 met and ambient temperatures of 29 C , whereas a metabolic rate of 1.0 met can be regarded as comfortable at ambient temperatures of 31 C (Table A2-20).

4.3. Conditioned Seats

According to Zhang [64], local cooling of the back and pelvis has a higher thermal influence on the whole-body than local warming of the back and pelvis. Investigated studies from the current literature that deal with conditioned seats are summarized in Table A3. It is obvious that conditioned seats generally improve thermal sensation and comfort. The use of heated and ventilated seats in vehicles confirms the importance of conditioned seats as personal climate actuators [102,103]. While the heated seat increases the temperature of the seat surface to a temperature level above the ambient temperature, the ventilated seat accelerates the adaptation of the seat surface to the ambient temperature level. Both actuators, however, support the faster adaptation of the conditioned seat to the ambient climate than it is possible with conventional seats [102]. Movement of the occupant in front of the workplace does not affect the thermal influence of the seat as long as the occupant is sitting on the seat [86].
According to Pallubinsky et al. [104], seats with water cooled backrests (30 C ) do not significantly affect thermal comfort at ambient temperatures of 32.3 C . In contrast, ventilated seats, with ventilators attached to the side corners of the seat, significantly improve thermal sensation [105]. Hereby, the preferred air velocity depends on the ambient temperature and equals 0.48 m s −1 at 22 C to 24 C and 1.87 m s −1 at 26 C (Table A3-26). A seat with built-in fans in the area of the upper leg and backrest (Table A3-28) enables thermal acceptance above 85% and ambient temperature of 30 C but cannot provide sufficient thermal comfort at 32 C [106]. A ventilated seat with fans installed in the armrests (Table A3-30) enables thermal comfort of Japanese men and women at ambient temperatures between 28 C and 33.4 C [107]. According to Washinosu et al. [108], a higher number of women than men accepted ambient temperatures between 28 C and 30 C , when using seats with fans that are mounted in armrests of the seat (Table A3-27). However, the thermal acceptance of men rises after physical strain in warm environments concurrently to the increase in sweat production [108].
Heated chairs are able to compensate ambient temperatures down to a minimum temperature of 5 C , which is expressed in comfort votes as “little uncomfortable” (−1 on a scale range [−3:0]) with the highest local dissatisfaction sensed at the hands and feet [109] (Table A3-32). Tests with a heated seat reveal that under cold climatic conditions most occupants prefer the sensation of warmth [78]. In the study of Shahzad et al. [78], the occupants manually controlled the corresponding seat surface temperature between values of 29 C and 39 C . According to Watanabe et al. [92], the heating power of a heated backrest equals an increase in ambient temperature of 5.2 K assuming a basic ambient start temperature of 20 C . The heated seat applied by Veselý et al. [95] improves thermal sensation by one scale point per 20 W heating load and has a high thermal effect related to its energy consumption. A water-conditioned seat in a vehicle environment [110] will ensure a high thermal satisfaction at ambient temperatures between 15.6 C and 28 C if the heated and cooled seat is automatically controlled depending on the ambient temperature (Table A3-31). As stated by Pasut et al. [111], a seat with integrated heating pads (energy consumption 27 W ) and fans (energy consumption 45 W ), designed for application in the cooling and heating period provides thermal comfort between 16 C and 29 C .

4.4. Foot Warmer and Heating/Cooling Systems for the Lower Body

As shown by Zhang [64], heating of the feet improves the overall thermal comfort of individuals in cold environments, whereas cooling the feet causes an opposite effect. Findings of Pallubinsky et al. [104] support that cooling the sole of the feet (Table A4-36) worsens a human’s overall thermal comfort. Table A4 summarizes studies that deal with the climatization of the lower part of the human body. It becomes clear that only a few personal HVAC systems that condition the lower part of the body were investigated so far. Consequently, the number of studies that investigate the cooling performance of such systems is small. Conventional radiant heaters are not an adequate alternative to local footwarmers, because ascending warm air causes a cooling effect at the feet level, which is contrary to the desired heating effect. Furthermore, these systems have a higher energy consumption than locally applied foot-warmer systems [112].
The “Kotatsu” is a local heater for the lower body, which is traditionally used in Japanese households. A climate chamber study conducted by Enomoto et al. [25] showed that heating the lower body with temperatures between 32 C and 38 C ensures thermal comfort at an ambient temperature of 14 C . According to Zhang et al. [112], a new developed box such as a radiant heater for the feet (energy demand: 30 W ) causes a temperature effect that is equivalent to a 5 K increase in global ambient air temperature (Table A4-35). Furthermore, in this study ambient temperatures of 18.9 C were evaluated as comfortable. They showed that the resulting HVAC energy savings ranges between 38% and 75% compared to mixing ventilation and for the location of San Francisco. According to Foda and Sirén [113], local underfloor heating will save heating energy if the system is implemented in front and at the sides of a seat. In addition, the system must cover a total surface area of about 1 m 2 and operate at surface temperatures of 39 C . In contrast, a local heat pad does not improve whole-body thermal sensation at ambient temperatures of 17.7 C (Table A4-34) [95].

4.5. Combined Personal Climate Actuators (Ventilation and Radiation)

As discovered by Bauman et al. [29], using combined personal user-controlled climate actuators significantly improves the satisfaction of individuals with their thermal environment (100%) and perceived air quality (94%), when compared to mixing ventilation. The combination of personal ceiling fans, seat fans and table fans improves thermal comfort and prevents cross-infections within office rooms according to Habchi et al. [86]. As stated by the researchers, the performance of a seat fan is robust against any movement of the seat and enables energy savings up to 14.87% compared to the use of a single ceiling fan. Pallubinsky et al. [104] showed that a combination of personal HVAC systems that consists of a ventilation systems for the face region (air velocity 1.28 m s −1) and a conductive underarm cooling system (water temperature 22.7 C ) facilitates thermal comfort at ambient temperatures of up to 32.3 C (Table A5-39). According to Melikov et al. [114], heating the back and thigh region provides thermal acceptance at values bigger than 80% and ambient temperatures of up to 23 C . Additional radiant heating of the legs and contact heating via heated seats causes thermal acceptance values higher than 85% at ambient temperatures down to 17 C (Table A5-43). Backrest heating combined with a heated floor pad causes a global temperature effect equivalent to an increase in global air temperature of 5.9 K . The concept, however, requires additional air movement [92]. Veselý et al. [95] investigated a combined personal heating system consisting of a heated seat, desk- and floor pad (maximum energy demand 163 W ). The combination of the different systems was shown to provide better overall thermal comfort than each of the used actuators could provide in single mode. Nevertheless, the use of conditioned seats has the highest energy efficiency. As shown in Table A5-38, this actuator combination ensures thermal comfort down to ambient temperatures of 17.9 C independent of the applied control strategy. The user-controlled personal HVAC system implemented by Knudsen and Melikov [115] comprises thermal actuators for face ventilation, under-desk ventilation, heated chairs and under-desk heating panels. It ensures a high thermal acceptance and good perceived air quality at temperature ranges between 20 C and 26 C (Table A5-42). According to Pasut et al. [116], the combined application of temperature-controlled seats and table fans within a temperature range of 18 C to 29 C leads to a thermal dissatisfaction below 10%. The study results of Zhang et al. [117], Arens et al. [118] reveal that the combination of personal cooling (hand-cooling, face-ventilation) and heating (hand-warmer, foot-warmer) system extends the comfortable ambient temperature range up to values between 18 C and 30 C . This, however, facilitates energy savings of up to 40%. A temperature range between 20 C and 28 C would save about 30% of HVAC energy.

4.6. Personal Ventilation with Preconditioned Air

Personal ventilation enhances the air quality at the workplace via directed fresh air towards the respective breathing area [119]. Such systems use either outdoor air or room air extracted from high quality air layers or combined indoor/outdoor air. Through the separation of the inhaled air from the general room air, the amount of inhaled pathogens decreases [120]. Beyond that, personal ventilation improves thermal comfort, especially in case of high ambient temperatures [120]. If personal ventilation is applied, the indoor climate will be comfortable even at high ambient temperatures, which leads to corresponding energy savings [121].
According to Li et al. [122], heating the feet improves a global “cold” sensation, whereas cool air supply towards the face improves a global “warm” thermal sensation. The efficiency of personal ventilation depends on the air source and the related air temperature. At ambient temperatures between 23 C and 26 C a supply of indoor spaces with outdoor air provides a higher air quality than recirculated indoor air [123,124].
The application of preconditioned outdoor air through the headrests improves both, the pureness of the inhaled air as well as the expected thermal comfort [103]. Melikov et al. [125] confirm the substantial improvement of air quality at ambient temperatures of 24 C by applying personal ventilation instead of mixing ventilation. A chilled ceiling extended by personal ventilation systems greatly enhances the air quality compared to a chilled ceiling extended by displacement ventilation [120]. According to Kaczmarczyk et al. [123,124], supply air whose temperature is below the ambient temperature improves IAQ greatly. Tsuzuki et al. [126] showed that the cooling force on the body is strongly depending on the applied personal HVAC system as the cooling impact varies between 3 K and 9 K . Personal ventilation fundamentally enhances the perceived air quality and may also improve thermal comfort at ambient temperatures starting from 26 C . This is especially the case, if the supply air temperature is preconditioned to a lower air temperature than the prevailing ambient temperature. Melikov et al. [125] revealed that a supply air temperature that is 3 K below the ambient temperature is favorable. Verhaart et al. [127] moreover stated that at ambient temperatures of 27.5 C a supply air temperature of 23 C is more comfortable than a supply air temperature of 26 C . At ambient temperatures of 20 C , preconditioned personal ventilation improves thermal comfort without decreasing air quality (preconditioned supply air temperature: 26 C , air temperature after mixing with room air: 24 C ). Furthermore, unheated horizontal ventilation of the face region decreases thermal sensation [128]. The impact of personal ventilation further depends on the relative humidity. Personal ventilation improves the perceived air quality more considerably at a relative humidity of 70% than at a relative humidity of 30%. Furthermore, a low volume flow rate ( 3.5 L s −1) enhances the inhaled air quality more significantly than a high-volume flow rate ( 6.5 L s −1) [129]. If the occupants have control over the volume flow rate of the personal ventilation system, thermal comfort will be achieved at ambient air temperatures between 20 C and 26 C [130]. However, the researchers could not determine an optimal volume flow rate, since the occupants had mainly chosen values between 0 L s −1 and 16 L s −1.
In rooms equipped with displacement ventilation, personal ventilation systems that use air of layers in close distance to the floor, enhance the perceived air quality at ambient temperatures between 26 C and 29 C (Table A6-49, Table A6-50). It additionally compensates a 3 K increase of ambient temperature [131,132,133,134]. According to Amai et al. [135], under-desk-mounted ventilation devices ensure thermal comfort up to an ambient temperature of 28 C and a relative humidity of 50% (Table A6-58), whereas air ventilation devices with preconditioned air above the desk revealed to be more effective with respect to thermal efficiency. Personal ventilation improves air quality independent of the number and behavior of individuals inside a room [136].
Occupants with free control over the supply air speed prefer a supply air speed between 1.2 m s −1 and 1.7 m s −1 at ambient temperature of 26 C , whereas supply air speeds between 1.5 m s −1 and 1.7 m s −1 is preferable at ambient temperatures of 29 C [133]. Tests with thermal manikins and corresponding simulations conducted by Assaad et al. [90] show that a sinusoidal airflow has a higher thermal effectiveness than a constant airflow. In addition, the cooling effect of the sinusoidal airflow is positively correlated with a frequency increase. The optimal oscillation frequency for thermal comfort and air quality is found to be between 0.5 Hz and 1 Hz at average volume flow rates between 3.5 L s −1 and 7.5 L s −1. Hence, such a variable air flows can save 16.1% of the cooling energy compared to a constant air flows. Applying sideways air ventilation, Liu et al. [137] state an optimal frequency for thermal comfort between 2 Hz and 4 Hz . Kalmár [138], Kalmár and Kalmár [139] showed that personal face ventilation with horizontally varying origins of air streams also improves thermal comfort of individuals. According to Bauman et al. [140], air stratification and the impact of personal underfloor ventilation depend on the supplied volume airflow. Supplementing a personal underfloor ventilation with a table fan improves the ventilation performance from 10.38% to 22.05% according to Makhoul et al. [141] and further increases energy savings from 8% to 13%, when compared to mixing ventilation. Personal supply of preconditioned fresh air through the ceiling saves 34% of the cooling energy demand of mixing ventilation [142]. However, the efficiency of this kind of ventilation strongly depends on the window type, if used for seats that are in close distance to a window. The cooling power of vertical ventilation rises concurrently with the increase in air velocity and with the decrease of the ambient and supply air temperature [143].

5. Innovative Control System for Personalized Thermal Comfort Prediction

An automated control of the personal HVAC system that considers thermal comfort must include the real thermal state of an individual. Although advanced HVAC systems comprise several environmental factors such as radiant temperature, air velocity and air temperature, the majority of the HVAC systems in existing buildings is controlled solely based on the measured air temperature. Measuring the skin temperature of the occupant allows the determination of the thermal sensation of the related person. In this way, climate actuators, which are closely positioned to a person’s body, can be personalized to ensure optimal thermal comfort for an individual. The skin temperature varies between different body parts and depends on several influencing factors such as metabolic activity and clothing insulation. The distribution of the skin temperature has been investigated by Arens and Zhang [58], Liu et al. [60], Clark et al. [144], Nielsen and Nielsen [145]. There are temperature differences up to 1.1 K in the face between forehead (highest temperature), chin, and cheek (lowest temperature) [146]. As a result, the thermal sensation also correlates well with the skin temperature. Thermal sensation is strongly correlated with the body core temperature. This is for example shown by [20,57,58,59,66,147,148,149,150]. Under decreasing or steady thermal comfort the skin temperature is a highly accurate signal for the current thermal sensation, whereas in the case of an improving thermal comfort from a poor ambient condition, the absolute skin temperature is not well correlated with the current thermal sensation, because positive influences have an anticipatory effect on thermal sensation [57]. However, a finger skin temperature below 30 C is usually a signal for dissatisfaction due to cold stress [147].
As shown in Table A1, Table A2, Table A3, Table A4, Table A5, Table A6, the overwhelming majority of the studies consider personal HVAC systems without automated control. Among these are user-controlled systems and systems with predefined heating/cooling loads. Single studies compare the thermal performance and energy efficiency between automated and user-controlled personal HVAC systems (Table A1-5 and Table A5-38). For instance, Boerstra et al. [93] investigated a seemingly automated, personalized ventilation system, whose ventilation load profile is based on preceding user-controlled trials in the same thermal environment. The researchers did not find any significant difference between user control and automation with respect to air quality and thermal comfort of the subjects, though they did not develop a transferable hardware-based system. Vesely et al. [151] and Vissers [152] confirmed the capability of automatically controlled personal HVAC systems by implementing such a heating system with manual adjustment from the researchers, considering the measured fingertip skin temperature. Although there was no significant difference regarding thermal comfort between user-controlled and automatic indoor climate comfort control, the implemented automated system had a higher energy consumption than the user-controlled one. Reasons for the increased energy consumption are the obviously higher heating power during the initial stage of the trial, due to delayed user-controlled heating and a slightly higher average power during the final stage [95]. On one side user control is often mentioned as the solution for assuring thermal comfort in an energy-efficient way, on the other side the received results towards user-controlled and automated control of personal thermal actuators show that there is no perceivable difference between these two systems regarding thermal comfort and perceived individual air quality. The desire for user control of the occupants is confronted with a less predicted productivity in scenarios with user control due to the increased distraction. However, the evaluation of a personal climatization systems inside a laboratory Bauman et al. [29] showed that the majority of occupants seldom (once a day) adjusts the personal HVAC systems. Taking all these facts into account, a suggested system might consist of a fully automated system combined with a user feedback system, which results in a continuously learning and partly personalized system. High quality automated control algorithms for air-conditioning systems essentially require the accurate estimation of the current ambient conditions and the thermal state of the present occupant. The latter is feasible, using thermophysiological models that consider characteristics such as age, gender or body constitution of individuals. Such a system is introduced in [15,153,154,155,156].

5.1. Real-Time Skin-Measurement for Smart and Personalized Control

The skin temperature includes information about the thermal state of an individual person. Therefore, measuring the skin temperature allows to estimate the prevailing thermal sensation and comfort. It can be measured by using resistance-thermometers attached to the skin, whereas a contactless measurement makes a higher acceptance by the occupants possible. Using an infrared camera allows measurement of the local skin temperature without contact and hence enables the estimation of the local thermal comfort [148,157]. This makes predictions about the impact of locally supplied heating or cooling possible. The contactless skin temperature measurement was realized by Metzmacher et al. [15,153,155] applying thermographic pose and face recognition. This developed independent system is integrated in the expandable and modular “human-centered closed loop control”-platform (HCCLC-platform). A central data server acts as proxy for the communication between hardware (sensors, actuators) and software (numerical models, processing, visualization). It receives the skin temperature by applying thermal image recognition and real-time aggregation of information sent by multi-modal sensors. As a result, the thermophysiological state and the prevailing thermal comfort of an individual person can be determined. The entire system includes the subsequently described modules.

5.1.1. Data Server and Data Model

According to Metzmacher et al. [15,153,155] the data server serves as abstraction layer for multi-modal, real-time data communication and acts as proxy between hardware and software components. Signals can be sent and demanded simultaneously, and the received data can be saved in an external database. The used data model for the communication between software and hardware is key-value-based. The key and value of the model correspond to the names and values of the sent signals, respectively. Corresponding to this scheme, the received information is saved in a hash map and also in a database in case it is reasonable.
The data server developed by Metzmacher et al. [15,153,155] is implemented in Java and contains a HTTP-interface for the connection with various independent modules via TCP/IP applying an XML schema. A dedicated software which transforms the serial data into the XML schema and transfers the information towards the data server allows the integration of serial devices, too. Several independent software components are connected with the data server and enable the processing of conventional sensor data about the air temperature, relative humidity, air velocity and average radiant temperature; the recognition of thermal and segmental data, and their visualization. The fundamental system of Metzmacher et al. [15,153,155] is highly expandable and numerous calculation models for statistical evaluation can be integrated via TCP/IP. All the connected modules are allowed to request and send data points. For instance, the system is suited to control several personal local thermal actuators and in this way pursues the automated control of personal climatization systems regarding thermal comfort and energy consumption.

5.1.2. Thermal Image Recognition and Processing

The human body parts are segmented under consideration of available thermal differences and the so-called thermal image recognition creates a thermal image out of these identified and tracked segments [15,153,155]. The thermal image recognition is fundamental for the evaluation of thermal comfort and consists of the pose and face tracking. Applying gesture recognition on the received thermographic images the thermal image processing module identifies the surface temperature of the single body segments. All the obtained data is sent to the data server by the thermal image-recognition software which acts as a client.

5.1.3. Two-Camera System

The developed contactless skin temperature measurement is based on the research of Zhang [158], Hartley [159], Hirschmuller [160]. It comprises a two-camera system and measures the motion and temperature using an infrared camera. The two-camera system of Metzmacher et al. [15,153,155] separates the thermal image tracking from the image detection with the result that the thermal camera independently measures the surface temperatures while a motion sensor tracks the face and body. Therefore, the image recognition operates independent of the spatial and thermal resolution of the thermographic image. Figure 1 shows both the tracked depth (left) and thermal (right) image of the face. These images also contain the defined segments each belonging to a measurement point which in turn are positioned according to the detected face and skeleton.
Metzmacher et al. [15,153,155] used the infrared camera FLIR A35 for the thermographic image. Clothing affects the contactless measured temperature as represented in Figure 1. Therefore, the contactless measurement of the skin temperature is most suitable for the face region since it is usually unclothed. Below the thermographic camera a dual-camera (Microsoft Kinect) is installed which is applied as depth (near-infrared) and motion sensor. The entire two-camera system improves the recognition of shapes and the separation of the foreground from the background. Therefore, the image registration is robust to affine ambiguity, illumination and surface colors. It is capable of detecting the location and pose of individuals and single body parts and to capture and track the face profile virtually. The face detection algorithm is based on the work of Smolyanskiy et al. [161] and applies the so-called “Active Appearance Model” (AAM). Hereby, a generative face model will be laid on an input image which allows face tracking. The thermal camera operates independent from the camera for estimating the spatial location and hence the received images are merged afterwards.

5.1.4. Image Registration

The applied cameras differ in various aspects such as the spatial position of the camera itself, focal length and image sensor [15,153,154,155]. Seeing that the thermal camera has a lower resolution than the depth image of the Microsoft Kinect, the latter acts as reference system for one coherent coordinate system. The thermal and color matrices are accordingly mapped into the depth coordinate system. The image registration module is developed for these merging and transformation processes. Although the images of the Kinect cameras (depth and color) can be mapped by applying internal parameterization without any calibration algorithm an automated camera calibration algorithm is essential for the allocation of the thermal image pixels to the depth image. After fusion of the images the skin and surface temperatures of the predefined sectors can be determined using virtual measuring points. A calibrated reference-temperature sensor allows the continuous calibration between the contactless measured and real temperature. This leads to a continuously high accuracy of all thermographically measured segment temperatures.

5.1.5. Measuring Point

A pixel of the thermal camera image contains the measured temperature information and a group of pixel merges to a measuring point of a predefined size [15,153,154,155]. The measuring point averages the temperature information of all related pixel and it finally resembles a sensor containing data which is transferred as signal to the data server.

5.1.6. Validation of the Skin Temperature

The accuracy of the measured skin temperature was investigated by Metzmacher et al. [153] using a PT100-resistance-thermometer fastened to the skin. Using contact-based thermal sensors simultaneously to the contactless thermographic sensor the accuracy of the determined skin temperature improves. Both results are processed by the data server simultaneously. However, the applicability of contactless infrared sensors for clothed body parts is limited since in this case, the measured skin temperature varies dependent on the clothing insulation and fitting.

5.1.7. Visualization

The module for 2D-/3D-visualization integrated in the data server visualizes the measured data and calculated results in real time [15,153,154,155]. This allows immediate insight into the comfort assessment of the system and the detection of measuring errors.

5.2. Thermophysiological Model MORPHEUS

The developed thermophysiological human model of Wölki [156] allows the real-time estimation of the thermoregulatory actions of a human individual. In this way, it is possible to predict an individual’s thermal comfort under transient and inhomogeneous environmental conditions, when coupled to thermal comfort models such as the balance comfort model (BCM) of Schmidt [62].
The general model structure of MORPHEUS [156] allows to include individual specific properties such as body composition, body height, gender and age. Consequently, the model allows to predict individual specific thermoregulatory responses and thermal comfort. MORPHEUS [156] itself is implemented in the acausal modeling language Modelica and follows a component-based implementation approach. Dymola, a commercially available simulation environment, is used for simulation purpose and allows to export the model as functional mock-up unit (FMU) for co-simulation. The humanoid is designed as a combination of Passive System (PS) and Active System (AS), which both are coupled via temperature error signals. Figure 2 shows a schematic of MORPHEUS, containing the fundamental model components.

5.2.1. Boundary Conditions

The model requires knowledge about several boundary conditions such as global and body-part-specific air temperatures, relative humidity, local air velocity and radiant temperature [156]. These properties can be measured, using conventional sensors.

5.2.2. Passive System (PS)

According to Wölki [156] the Passive System describes the human anatomy via 8 cylindrical elements and a hemisphere for the head segment. The body parts are divided into several sectors that are composed of a combination of seven virtual tissue materials (bone, muscle, fat, skin, lung, brain, viscera). The heat exchange between the body parts is implemented via a central blood flow model. All geometrical model parameters can be scaled, which enables their adaptation towards body composition parameters of individuals.

5.2.3. Active System (AS)

The AS considers the thermoregulatory functions of the central nervous system (CNS), which are triggered via variations of the body core and skin temperature [156]. Here, the model considers the four thermoregulatory mechanisms sweating, shivering, vasodilation and vasoconstriction. The latter two alter the blood perfusion of the skin thus affecting the energy transfer between the human body and the environment.

5.2.4. Ambient Model

The Ambient model [156] contains heat transfer models for convection, radiation and evaporation. It also considers a clothing model, whose parameters were extracted from [162] and models the dry and wet heat loss of the body through clothing layers.

5.2.5. Comfort-Related Determination of the Optimal Performance Enhancement

Applying the equivalent temperature approach, MORPHEUS is used to compute the required local performance enhancement of decentralized climate actuators to provide optimal thermal comfort for an individual person [15,153,154]. The entire experimental setup is schematically illustrated in Figure 3.
MORPHEUS is implemented as an independent module and plays a central role in the formerly described HCCLC-system. The necessary parameters required for the assessment of the equivalent temperature (Teq) are provided by MORPHEUS. These factors are convective heat flow (Qc), radiant heat flow (Qr) and their related heat transfer coefficients hc and hr as well as body-part-specific skin and clothing surface temperatures, which are all simulated or measured in real time. Metzmacher et al. [153] compared the simulated skin and surface temperatures of the model with the measured skin and surface temperatures. Corresponding results show a difference between the simulated and measured temperature signals, which can be partly traced back to the model configuration, which was representative for a standardized human being that differed from the test subject. Nevertheless, the researcher showed good agreement between the simulation and measurement-based local performance enhancements (maximum performance difference 1.7 W ).

6. Discussion

It is known that expanding the allowed ambient temperature corridor reduces the energy consumption of HVAC systems. According to Nicol et al. [163], lowering the targeted room temperature during the heating period saves about 10% K −1. This outcome is supported by Hoyt et al. [164], who confirm a predicted energy saving that can be attributed to the expansion of the room temperature of about 10% K −1 for both, the heating and the cooling period. However, the achievable energy savings depend on several factors, one of them being e.g., the outdoor climate conditions. The fundamental intention of the indoor temperature range is to provide a comfortable indoor climate for the occupants inside. 
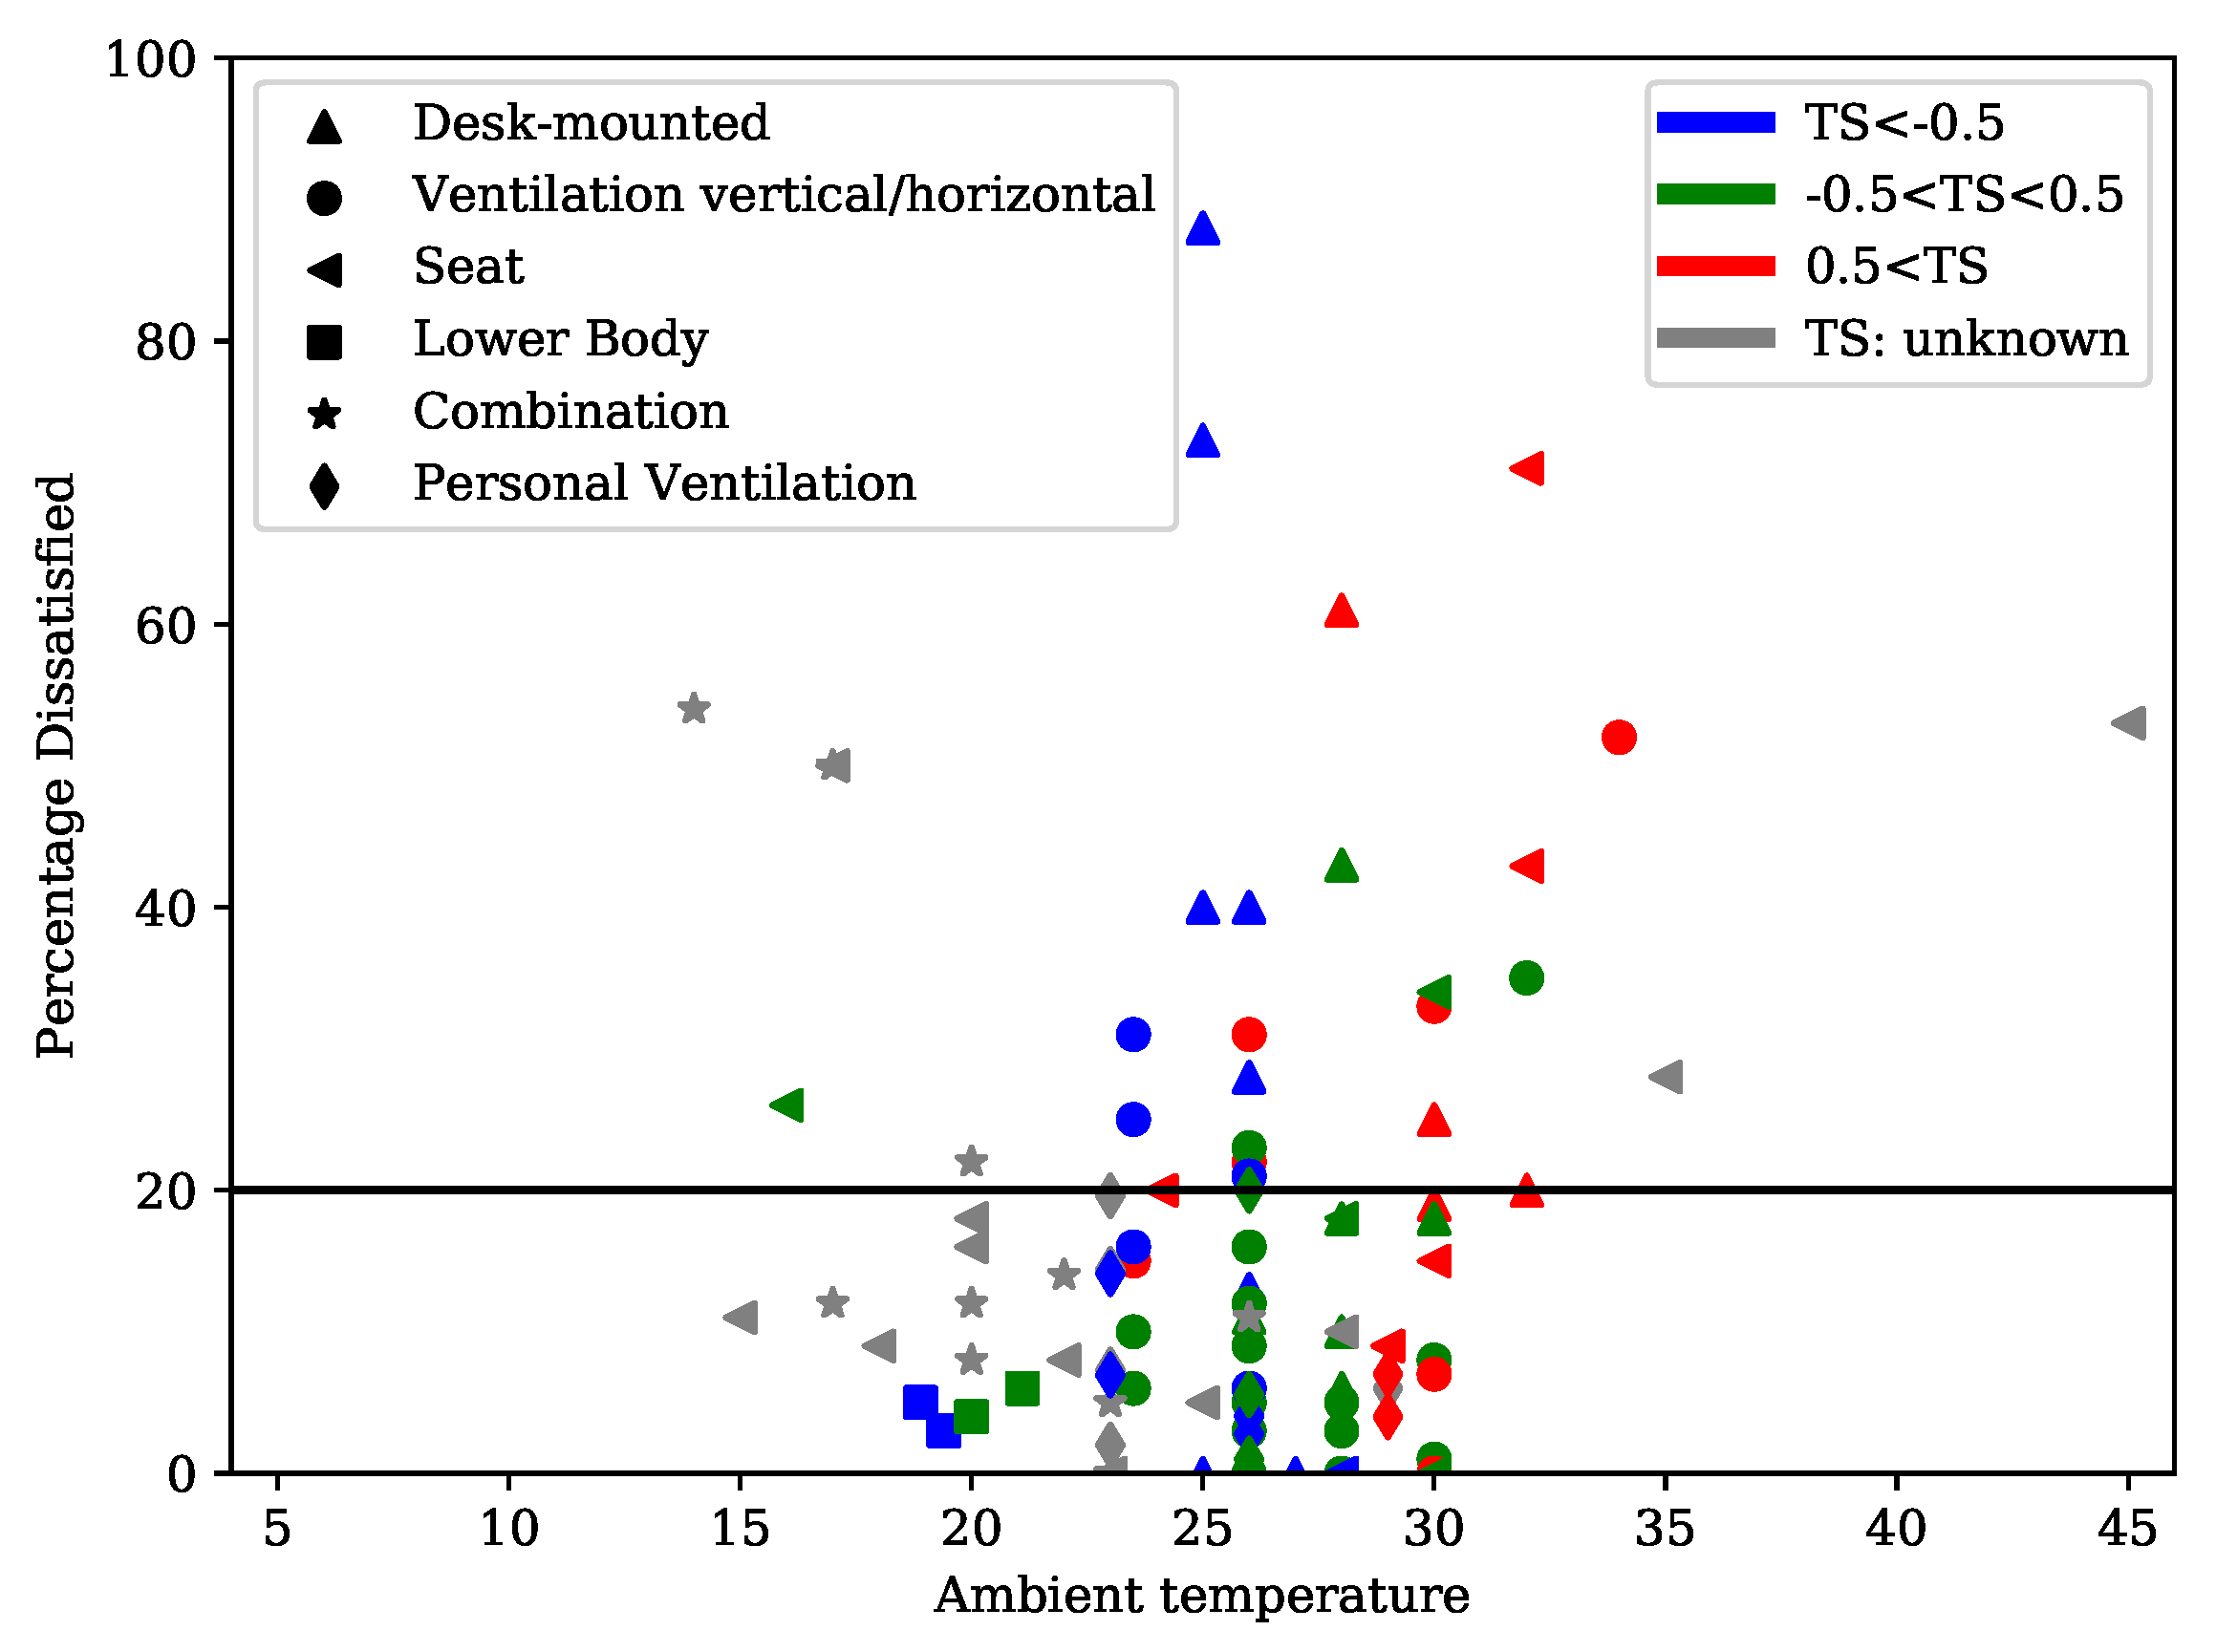
Figure 4 shows the correlation between the percentage of dissatisfied individuals related to the indoor air temperature. It is shown that the corresponding dissatisfaction of individuals strongly depends on the used personal climatization system (see Table A1, Table A2, Table A3, Table A4, Table A5, Table A6). The black solid line in Figure 4 represents a PPD that can be regarded as acceptable according to DIN EN ISO 7730 [9], ASHRAE 55 [18] and corresponds to a value of 20%. It is obvious that the implementation of personal HVAC systems allows a considerably high expansion of the acceptable ambient temperature range for both, the warm and cold area.
Applying directed airflows towards the face region improves thermal comfort and perceived air quality. A cheap and straightforward approach for the generation of such airflows is the application of table fans. These systems were repeatedly tested for ambient temperatures between 26 C and 30 C and are able to ensure thermal comfort even at relative humidities of 80% with a dissatisfaction value below 20% (Table A1-1). A small amount of studies applied the table fans at air temperatures of 32.3 C (Table A1-4) and 35 C (Table A1-13). However, the supply air must be preconditioned to 22 C in order to ensure thermal comfort at an ambient air temperature of 35 C .
The application of water cooled table surfaces (Table A1-3, Table A1-4) ensures thermal comfort up to air temperatures of 32 C . Furthermore, a heated table pad guarantees thermal comfort at ambient temperatures down to 18.1 C (Table A1-2). Conditioned table surfaces can be applied for both, heating and cooling. However, the energy consumption of the investigated systems is comparably high (> 80 W ). In contrast, the majority of the available table fans has an energy demand of less than 4 W .
Personal cooling systems that use ceiling or standing fans (Table A2) affect the indoor climate related to the body as a whole and can provide thermal comfort with a maximum satisfaction of 100% at ambient temperatures up to 30 C (Table A2-14, Table A2-16, Table A2-17, Table A2-20). In addition, there are systems available that show a very low energy uptake of 10.5 W only, thus being quite energy-efficient. However, further research shows that horizontal ventilation is not capable to compensate air temperatures above 30 C (Table A2-17).
Conditioned seats have a high efficiency in delivering heating and cooling energy to the human body. Since this personal HVAC system is mobile, its performance is independent of the occupants current position inside a room. According to Brooks and Parsons [109], Zhang et al. [110], conditioned seats in vehicles ensure thermal comfort down to ambient temperatures of 15 C (Table A3-31, Table A3-32). However, this result could not be confirmed by Schmidt et al. [12], who used heated seats to compensate a global reduction of indoor air temperatures. In their study, the researchers showed that the dissatisfaction of individuals rises above 40% at ambient temperatures of 17.4 C due to increasing thermal asymmetries that appear across the human body surface. Table A3 reveals that the use of conditioned seats allows to extend the acceptable ambient air temperature range in office buildings within a range between 18 C and 30 C . Shahzad et al. [78] showed that heated seats can have an energy consumption of about 20 W and cause an improvement of thermal sensation by one scale point. However, the system’s overall energy consumption is strongly depending on the used system components and the used control algorithms. Corresponding studies listed in Table A3 show that the energy consumption of conditioned seats is very low, but their influence on thermal comfort is high.
There are only a few literature sources that deal with local foot heating systems. According to Enomoto et al. [25], local heating of the lower body ensures global thermal comfort at very low ambient temperatures that can reach down to 14 C (Table A4-37). Furthermore, current research (Table A4-36) shows that local cooling of the feet is inefficient and worsens the overall thermal sensation of individuals at ambient temperatures of up to 32.3 C . A heated foot pad has negligible impact on a person’s thermal comfort at an air temperature of 17.7 C (Table A4-34). Zhang et al. [112] developed a closed construction of a foot heater, which is able to improve thermal comfort at an ambient temperature of 18.9 C . Their system was shown to save about 500 W of heating energy per occupant (Table A4-35).
The use of combined multiple personal climate actuators has a higher and more uniform thermal impact on the human body than the use of single thermal actuators that are locally applied to individual body parts. Here, the results of Schmidt et al. [12,13] indicate that reduced indoor temperatures require a combination of multiple thermal actuators in order to keep a person in thermal neutrality. As already mentioned before, the main reason for dissatisfaction and discomfort, while using a single actuator, is the resulting temperature asymmetry across the body surface. Veselý et al. [95] showed that the use of a heated seat has a higher energy efficiency (20 W /1TS) than the combination of a heated seat in combination with a desk and floor pad (80 W /1TS), which is the logic consequence of the increased number of energy consuming actuators. However, the combined heating power of these actuators is advantageous compared to a single actuator (Table A1-2, Table A4-34, Table A5-38). Such a combined system provides thermal comfort for ambient temperatures down to 17.9 C . According to Pasut et al. [116], a conditioned seat can provide thermal comfort at ambient temperatures between 18 C and 29 C (Table A3-24, Table A5-40) with an overall energy consumption of less than 16 W . This is a fractional amount of the energy required for mixed ventilation systems (about 750 W ) that aim to achieve the same thermal impact.
Personal face ventilation with preconditioned air (Table A6) is mainly used to ensure a high air quality. Such systems direct cool fresh air towards the respiratory area of a person. According to Habchi et al. [86], face ventilation can be used to reduce the risk of cross-infections and decreases the absence days of the staff. Furthermore, the face ventilation provides a comfortable room climate at ambient temperatures up to 30 C (Table A6-45, Table A6-46).
The studies listed in Table A5 show that the use of combined thermal actuators (Table A5-38, Table A5-39) can extend the acceptable ambient temperature range to values between 17.9 C and 32.3 C . Considering all above mentioned systems, it can be concluded that a minimum ambient temperature of 16 C can be regarded as comfortable, when using personal HVAC systems (Table A3-24). In vehicles, however, even temperatures of 15 C and 10 C have been found to be comfortable (Table A3-31, Table A3-32). The highest identified ambient temperature that could be ranked as comfortable was found to be 35 C . Here, preconditioned airflows that were directed towards the face (Table A1-13) with a supply air temperature of 22 C were used. Consequently, on the base of all the studies listed in Table A1, Table A2, Table A3, Table A4, Table A5, Table A6 lead to the assumption that the comfortable indoor air temperature range can be specified between 16 C and 35 C , if personal HVAC systems are used. Furthermore, there is a need for studies outside the formerly mentioned temperature range, since there is only a small amount of studies that consider such extreme ambient temperatures. However, those studies are necessary for getting an impression on the maximum efficiency of personal HVAC systems and corresponding energy savings.
The results of Figure 4 suggest a temperature range between 18 C and 30 C , in which the majority of studies predicts a thermal dissatisfaction value below 20%. A possible way of doing this is to use conditioned seats in combination with personal ventilation systems. The same temperature range was identified by Zhang et al. [117] to be comfortable in connection with locally applied comfort actuators. Here, the researchers estimated that the possible energy savings can be 40%, when compared to a room air temperatures between 21.5 C and 24 C . According to Hoyt et al. [67,165], however, energy savings are strongly depending on the local climatic conditions.
Ghahramani et al. [72] state that an increase in room air temperature between 3 K to 6 K causes energy savings between 6.7% in Miami and 46.1% in San Francisco.
According to Schiavon and Melikov [166], the use of personal air movement systems can save cooling energy between 17% to 48%. However, the possible energy saving depends on air velocity, building characteristic, outdoor climate and the energy demand of the personal climate actuator. Under the same environmental conditions, the use of a table fan (30 W ) caused a higher total energy consumption as a mixing ventilation system [167]. This reinforces the need for the implementation of energy-efficient thermal actuators that have to be combined with efficient control algorithms.
Besides their energy saving due to an increase in energy efficiency, personal HVAC systems accelerate the reaction speed of the air-conditioning system as a result of the decrease in climatization area [168]. This is of importance since the thermal satisfaction of occupants depends on the available user control as well as on the system’s adaptation speed [30]. It can be shown that most of the studies investigate the efficiency of climate actuators as well as their thermal impact, but only a few studies consider the corresponding control algorithms. The optimal control algorithm for personal HVAC must prevent energy waste and must consider user needs [169]. Existing buildings that offer user control reach a higher thermal acceptance than buildings with central HVAC and high level of automation. However, according to Shahzad et al. [170] user control reduces the efficiency of air-conditioning and increases the energy consumption as a result of the inverse relation between user control and automated control.
Previous studies [93,95,151,152,171] show that automatic and user-controlled personal HVAC systems provide similar thermal comfort for occupants. Here, automated systems increase the productivity of individuals due to reduced distraction [93]. Since productivity depends on the satisfaction of the occupants, an automated personal HVAC system that partly considers user control represents an optimum way of implementation. This is achievable through the development of personalized systems that are combined with learning algorithms, which consider user feedback. Here, the “human-centered closed loop control”-platform (HCCLC-platform) developed by Metzmacher et al. [153], Wölki et al. [154] represents one way of applying personalized control algorithms to personal control systems within the building and vehicle sector. For this purpose, various personal local actuators can be simultaneously implemented and operated by the HCCLC-platform.
The latter is capable of estimating body-part-specific equivalent temperatures, which are used to calculate the required local heating/cooling power of body parts that is required to provide overall thermal comfort to a person [153,154]. The corresponding energy demand can be determined on the base of measured skin temperatures and/or simulation results generated with the thermophysiological model MORPHEUS.
The implementation of energy-efficient personalized climatization systems requires models for the determination of human thermal comfort. The most commonly used model in the building sector for the determination of the overall thermal comfort of individuals is Fanger’s [32] PMV/PPD model. It predicts the overall thermal sensation and dissatisfaction for a group of individuals near thermal neutrality in a static manner and is the predominantly used model for designing central HVAC systems. Although Fanger’s model shows good prediction performance with respect to thermal discomfort of a group of individuals, the model is not applicable for the prediction of individual thermal comfort. Alternative models, such as the adaptive model described in EN ISO 15251 [47] or ASHRAE Standard 55 [18] correlate the operative indoor temperature with the mean running outdoor temperature over a specific time period (four days up to one month). In contrast to Fanger’s PMV/PPD the adaptive model takes the adaptive component of occupants into consideration, which is e.g., the change of clothing insulation or the change operations on windows. However, the model is restricted to non-air-conditioned buildings and defines temperature ranges that are comfortable for a group of individuals instead of a direct comfort quantity. Due to the reason that these models are targeting on a group of individuals, they cannot be applied for the prediction of individual human thermal comfort, which is necessary in connection with the use of personalized climatization systems.
The model of Arens and Zhang [58] predicts local thermal sensation depending on measured skin temperatures and considers thresholds for skin temperatures that correlate well with thermal discomfort. Some multi-segment comfort models also determine thermal sensation and comfort for single body parts as well as the body as a whole [19,61,66]. Zhang et al. [20,61] introduced a model for the prediction of local and overall thermal sensation/comfort that can be applied to human individuals. In uniform environments the researchers showed that overall thermal sensation is dominated by local body parts such as the back/chest region and the pelvis. According to the researchers, the whole-body thermal sensation depends on the three body parts that show the most extreme local thermal sensation in cold and warm environments. This supports the thesis that improving local thermal sensation is of high importance for ensuring whole-body thermal sensation and comfort. However, the developed model is not generally applicable yet, since it is based on a small amount of data. It is furthermore questionable, if such a model should have a higher integration of personal factors, since these have a remarkable impact on individual thermal sensation and thermal preference.
Schmidt [62] showed that existing thermal sensation and comfort models need further improvements with respect to transient and asymmetrical environmental conditions. As a consequence, the researcher implemented a new model that represents a combination of the approaches of Fanger [32] and Zhang et al. [20,61]. In addition, the so-called balance comfort model (BCM) applies Fanger’s global heat balance equation to individual body parts and uses the set of equations of Zhang to predict local and overall thermal sensation and comfort of individuals. Furthermore, the researcher included thermal conduction in the energy balance equation to be able to consider the influence of contacting surfaces on a person’s thermal comfort. However, as all the local comfort models mentioned before, BCM requires further experimental data to make the model more robust with respect to its prediction results.
Consequently, the use of personalized climatization systems requires thermal comfort models that are able to predict an individual’s thermal comfort. Here, information on global ambient conditions as well as information regarding local micro-climatic situations close to the human body are required. Such a comfort model combined with personalized climatization would be capable to ensure person-specific thermal comfort in various thermal environments. In
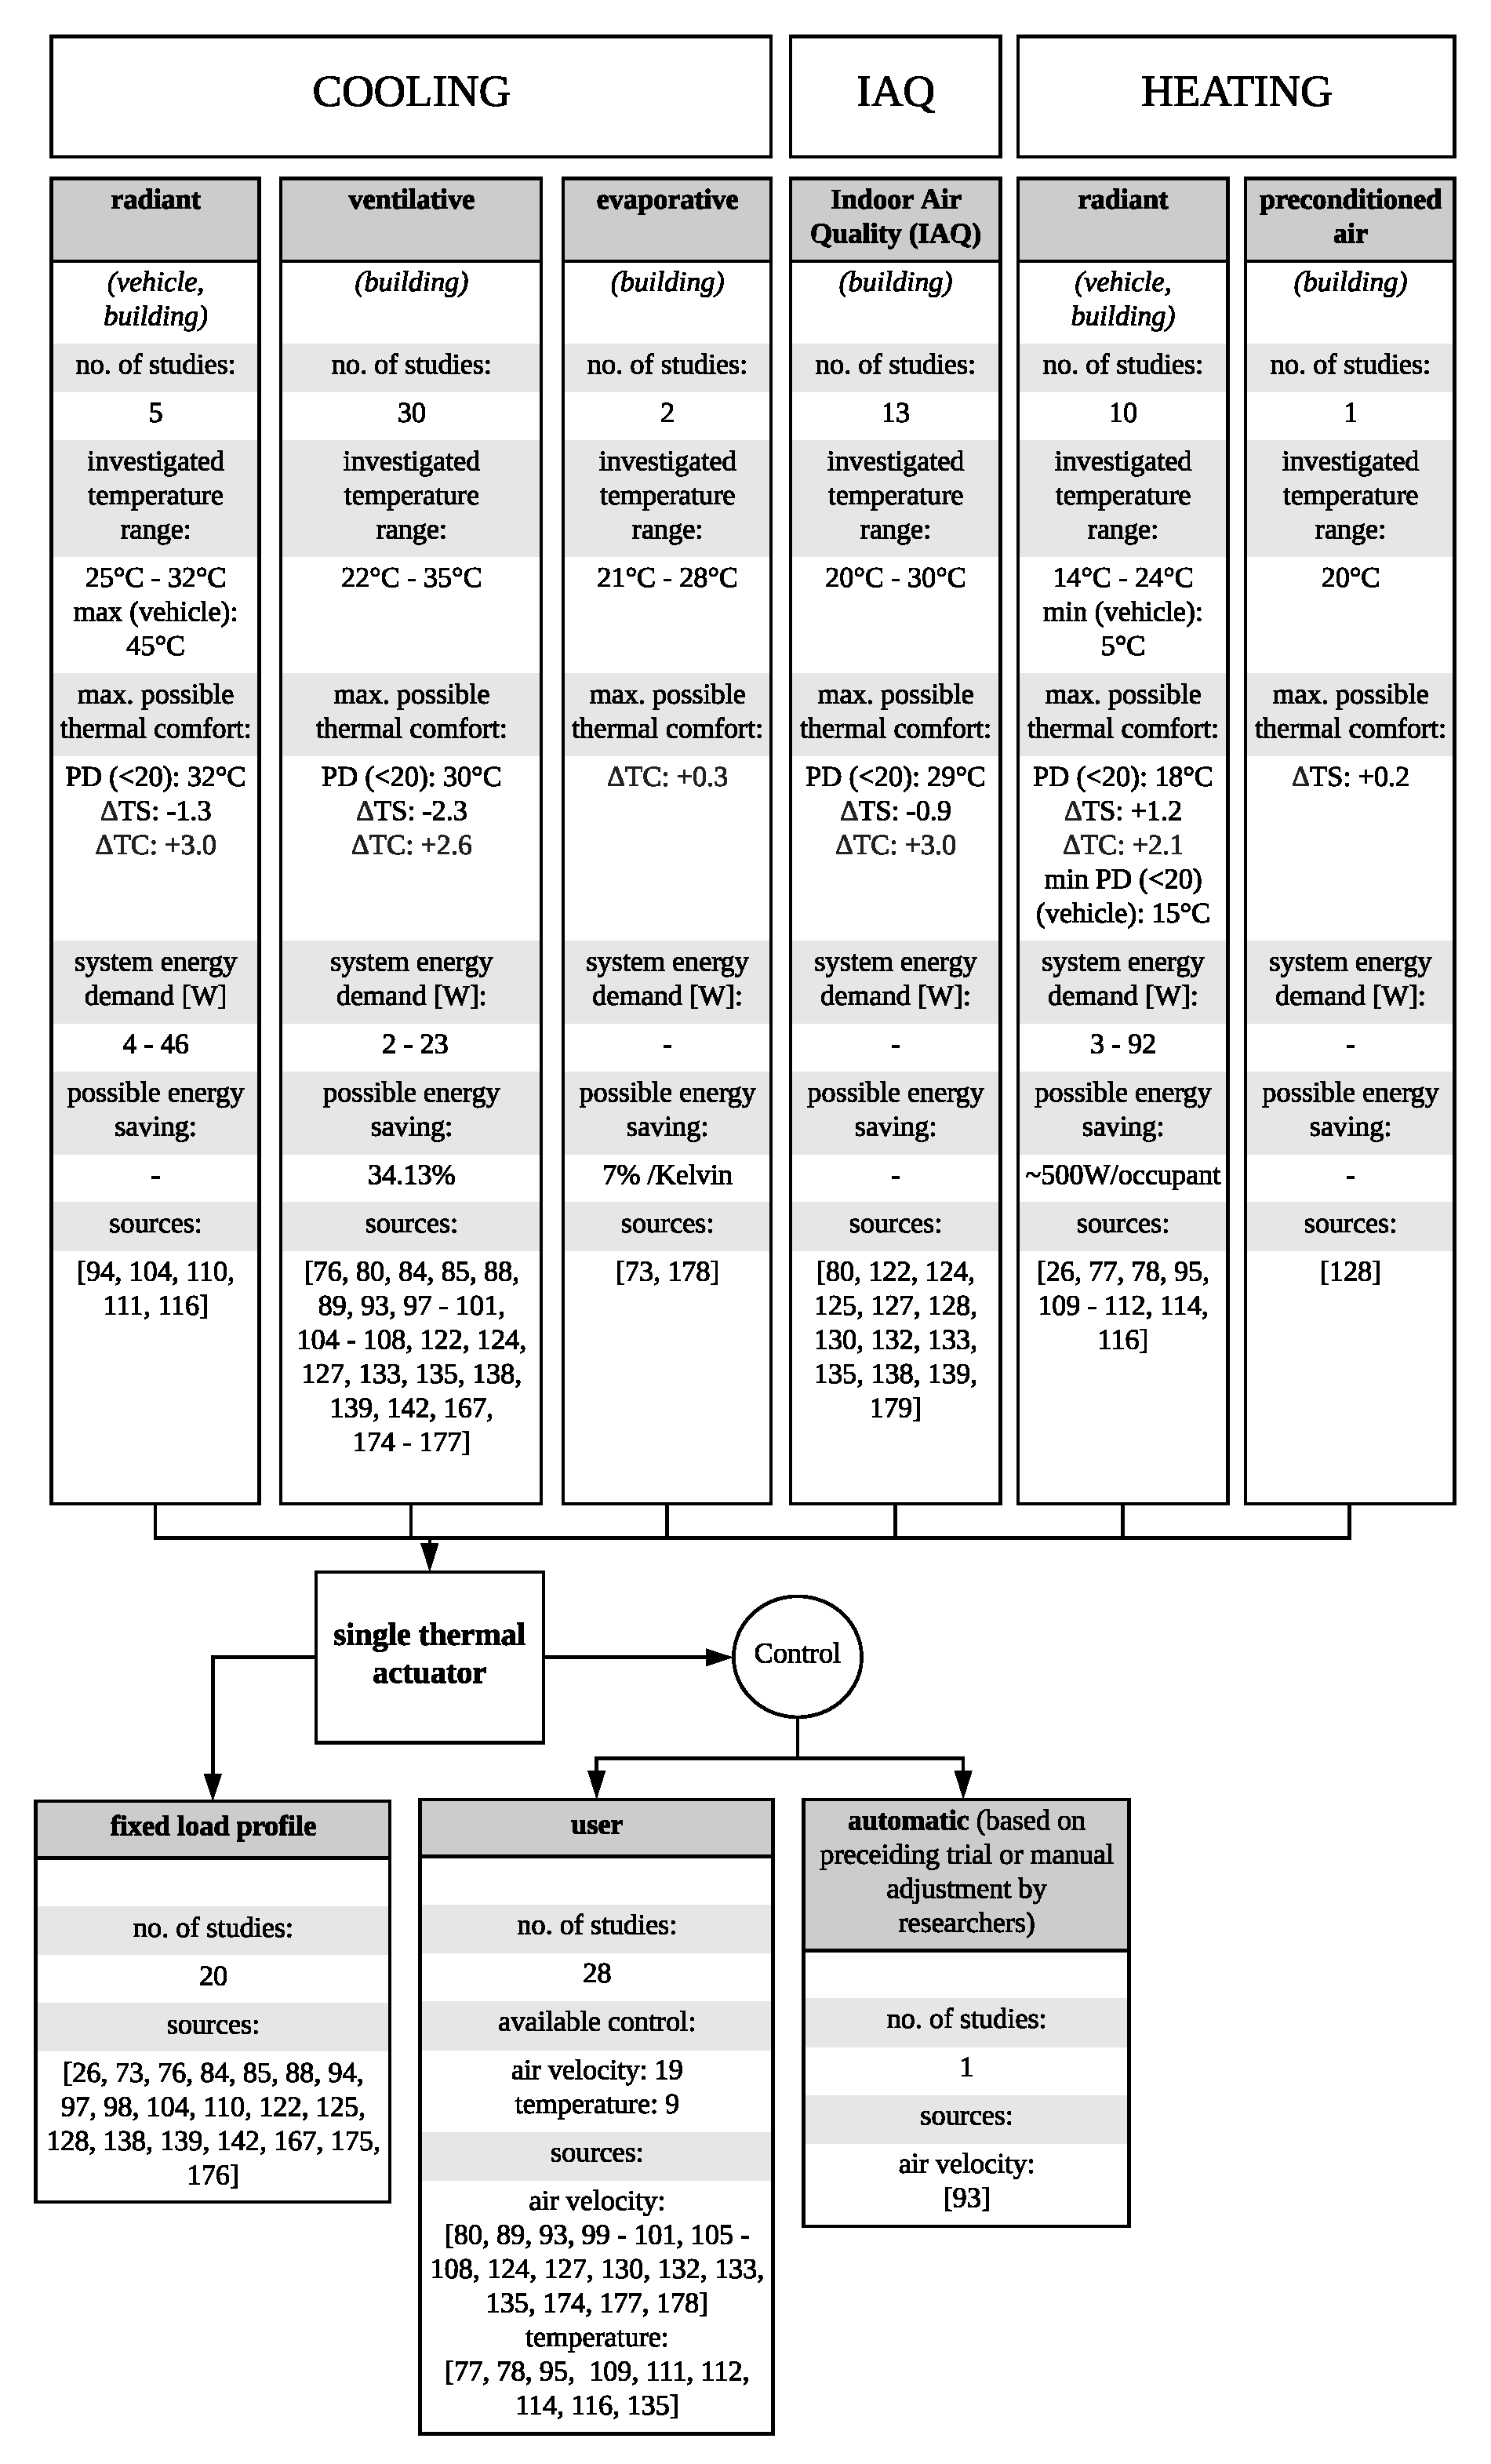
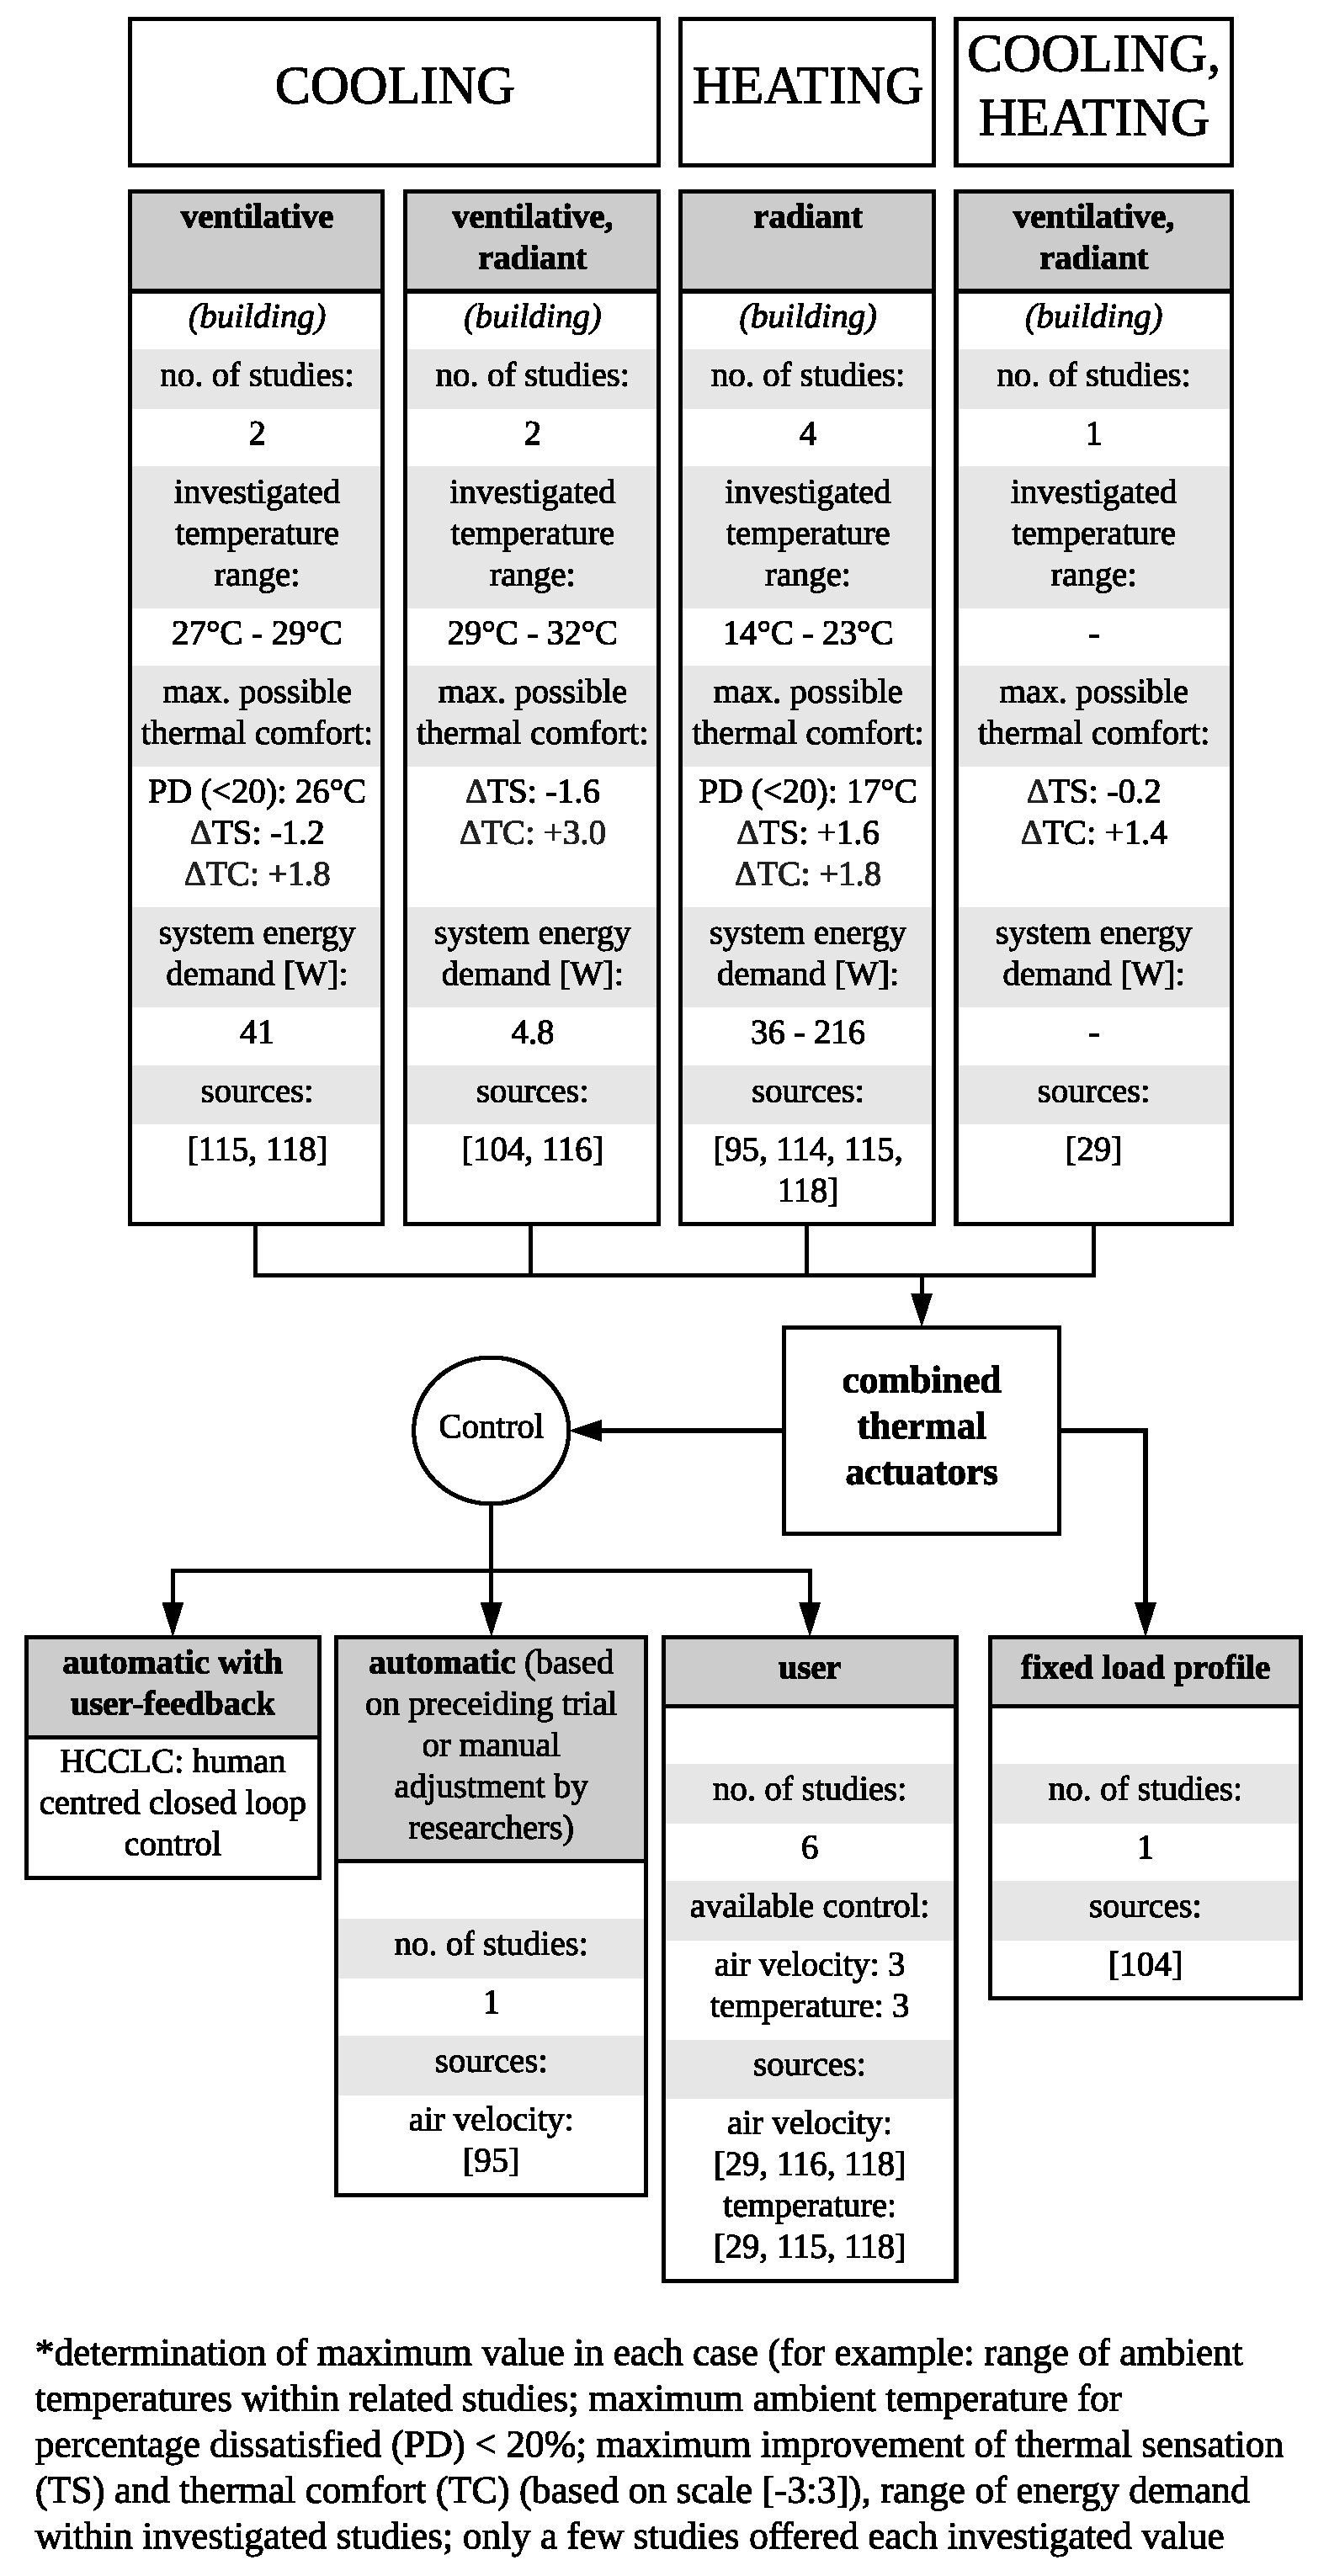
 Figure A1 and Figure A2 the different existing heating and cooling methods are compared with respect to their tested ambient conditions, their possible impact on thermal comfort and energy demand. The Figure A1 and Figure A2 shows the maximum range of values for the different methods, based on the published data of the single studies. It becomes clear that only a few studies contain comprehensive data about the investigated aspects. It is obvious that the majority of the studies that deal with personalized cooling use personal ventilation systems. This method has a high energy efficiency with an average energy demand of 2 W to 23 W . Although less studies focus on radiant cooling, this method is also capable to provide thermal comfort at ambient temperatures of up to 32 C . Above all, radiant panels are simultaneously efficient at heating the environment and can save about 500 W per person, as it is shown in Figure A1 and Figure A2. In comparison, only a few studies investigate the concurrent application of multiple cooling or heating methods and do not consider extreme ambient conditions. Personalized climatization is basically suitable for both, ensuring a person-specific optimized thermal comfort and for ensuring a healthy environment. It is obvious that for a broader application of personalized climatization systems, such systems have to be further investigated.

7. Conclusions

According to DIN EN ISO 7730 [9], the operative indoor temperature range of HVAC systems in office buildings must be kept between 22 C and 24.5 C to provide a comfortable indoor climate for the occupants inside. By applying personal HVAC systems, this temperature range can be expanded to values between 18 C and 30 C while causing thermal dissatisfaction below 20% (see Figure 4). Only a few studies investigate thermal comfort outside this temperature range (see Table A1, Table A2, Table A3, Table A4, Table A5, Table A6). Some of them [109,110,116] prove that even higher or lower ambient temperatures can be regarded as comfortable, when using personal HVAC systems. According to these researchers, a wider indoor air temperature range between 16 C and 35 C is still comfortable. However, there is a need for further research since the data base for these temperature levels is quite small. Zhang et al. [117] confirmed that an indoor air temperature range between 18 C to 30 C can be regarded as comfortable. Furthermore, the researchers estimated the predicted energy savings for this temperature range to be 40%, when personal climatization systems are used that consist of a heated and ventilated keyboard, foot warmer and an air supply system that directs local air flows towards the face region of a person. The calculated energy savings of the researchers is valid for a comparison of their system to mixing ventilation systems that are designed for a temperature range between 21.5 C and 24 C . However, a systems’ energy demand strongly varies with respect to the applied hardware components, applied control algorithms and system design. For example, the energy demand for cooling systems varies between 2 W to 46 W as shown in Figure A1 and Figure A2. Furthermore, Hoyt et al. [67,165] showed that the achievable energy saving is strongly dependent on the outdoor climate.
Results of a field study performed by Bauman et al. [29] confirm the advantages of personal HVAC systems in comparison to central air-conditioning systems regarding thermal comfort and perceived air quality. In their study, the researchers implemented a personal HVAC system and included a user control approach, which was designed for office buildings in San Francisco. According to Huizenga et al. [17], Bauman et al. [29], thermal comfort, IAQ and room acoustics are commonly weak points in existing buildings. Consequently, there is a high optimization potential. Most of the existing personal HVAC systems in the literature [93,95,171] are user-controlled systems that do not consider automated control of local thermal actuators.
The so-called HCCLC-concept described in [15,153,155,156,172] uses a human being/numerical human thermoregulation model as a core component of a personalized HVAC system. The system itself can be expanded by a variable amount of local climate actuators and allows to consider user feedback systems to establish self learning control algorithms with the goal to automate the entire climatization of individuals in a much more energy-efficient way than it is currently done in buildings and vehicles.
Finally, this paper contains an extensive comparison of existing and investigated personal thermal actuators from the current literature and enables the choice of thermal actuators and their combination depending on environmental conditions, energy demand, expected thermal comfort and thermal comfort improvements. The corresponding selection process is enabled by the use of Figure A1 and Figure A2, Table A1, Table A2, Table A3, Table A4, Table A5, Table A6. Additionally, the paper showed the necessity and potential of local thermal comfort models in connection with the design and application of energy-efficient personal climatization systems and highlighted the potential of further areas of system application such as for the improvement of health, productivity or the reduction of mortality rates due to energy poverty.

Author Contributions

A.W. conducted the literature research, and wrote the major part of this article; D.W. wrote, reviewed and edited the paper; H.M. edited the paper and contributed to the material; C.v.T. supervised this work.

Funding

This research received no external funding.

Conflicts of Interest

The authors declare no conflict of interest.

Abbreviations

The following abbreviations are used in this manuscript:
Aautomated control
AAMactive appearance model
ASActive System
ATHBadaptive thermal heat balance
BCMbalance comfort model
Ccooling
CCchilled ceiling
CFchilled floor
CMWconstant mechanical wind
CNScentral nervous system
DRdraught rate
DVdisplacement ventilation
Ffemale participants
FMUfunctional mock-up unit
Hheating
HVACheating, ventilation, and air-conditioning
HCCLChuman-centered closed loop control
IAQindoor air quality
Mmale participants
max.maximal
MORPHEUSMorphable Human Energy Simulator
NEFZnew european driving cycle
No.number
PAQperceived air quality
PMVpredicted mean vote
PDpercentage dissatisfied
PECpersonal environmental control
PPDpredicted percentage dissatisfied
PSPassive System
PVpersonal ventilation
Ref. WBevaluation of thermal state of whole body without personalized air-conditioning (reference)
Res. WBevaluation of thermal impact of personalized air-conditioning on whole body
rhrelative humidity
RMPround movable panel
SETstandard effective temperature
SNWsimulated natural wind
Ttemperature
Taambient temperature
Tsupplysupplied temperature
TSthermal sensation [−3:3]
TCthermal comfort [−3:3]
Uavailable user control
UFADunderfloor air distribution
vair velocity
vsupplysupplied air velocity
WBwhole body

Appendix A. Tables Concerning Existing Studies about Personal Climatization Systems

Subsequently, the description of all the abbreviations within the tables.
  • Participating Subjects throughout the research study:
    • M: Number of male participants
    • F: Number of female participants
  • Task of the investigated personal climatization systems:
    • H: Heating
    • C: Cooling
    • IAQ: Improvement of the indoor air quality
  • Available Control over the power stage of the personal climatization systems:
    • -: Predefined load profile, no personal control
    • U: Available user control
    • A: Automated power-adjustment of the personal climatization systems dependent on the determined thermal sensation/comfort
    • Available control concerns either supplied temperature T or supplied air velocity v.
  • Ta: Ambient air temperature [ C ]
  • rh: Relative humidity [%]
  • Tsuppl: Supplied air temperature [ C ]
  • vsuppl: Supplied air velocity [ m s −1] (unless otherwise stated)
  • Res. WB: Thermal impact of the personal climatization systems on the whole body
  • Ref. WB: Thermal impact of air-conditioning without thermal actuators on the whole body (reference)
    • TS: Thermal Sensation, interval [−3:3] (unless otherwise stated)
    • TC: Thermal Comfort, interval [−3:3] (unless otherwise stated)
  • PD: Percentage Dissatisfied due to thermal quality (unless otherwise stated)
Table A1. Desk-mounted personal climatization systems (ventilation, radiation and conduction).
No.SourcePlaceSubjectsTaskSystemControlTarhTsupplvsupplRes. WBRef. WBPD
MFHCIAQ[ C][%][ C][m s 1 ]TSTCTSTC[%]
1He et al. 2017 [89]CHN23-X-Ventilation-2680261.50−0.2−0.30.40.111 a
2.30−0.6−0.50.40.128 a
U: v2680262.300.00.50.40.111 a
-2880281.500.30.60.7−0.518 a
2.30−0.30.40.7−0.56 a
U: v2880282.300.00.80.7−0.510 a
-3080301.500.80.11.3−0.925 a
2.300.60.11.3−0.919 a
U: v3080302.300.50.31.3−0.918 a
a: PD based on not thermally acceptable responses; energy demand: 2 W (1.5 m/s) and 3 W (2.3 m/s)
2Veselý 2017 [95]NLD76X--RadiationU: T18.15235 a-−0.80.0−1.2−0.2-
a: max. surface temperature; WB TC: [−1:−0;+0:1]; max. energy demand: 80 W
3He et al. 2017 [94]CHN1010-X-Radiation-286022.8-−0.10.40.60.05 a
306023.9-0.30.20.9−0.615 a
326025.5-0.80.11.4−1.215 a
a: PD based on not thermally acceptable responses; max. energy demand: 15 W
4Pallubinsky et al. 2015 [104]NLD88-X-Ventilation-32.329.332.31.281.2−0.01.7−0.4-
Radiation22.70.001.5−0.21.7−0.4-
WB TC: [-2:-0;+0:2]
5Boerstra et al. 2014 [93]DNK1211-X-VentilationU: v2830-2.500.5---61
fixed a2830-2.500.4---43
a: predetermined load profile based on preceding user-controlled trials
6Ugursal et al. 2012 [85]USA2119-X-Ventilation (head)--4523.90.280.60.70.50.8-
Ventilation (head, hands, feet)0.220.60.80.50.8-
WB TC: [-2:-0;+0:2]; Subjects preferred higher air movement; high metabolic activity: 1.9 met
7Cui et al. 2012 [84]CHN126-X-Ventilation CMW a-28-281.080.4−0.30.4−0.2-
Ventilation SNW b1.060.3−0.50.4−0.2-
Ventilation CMW a30-301.081.0−0.80.9−0.6-
Ventilation SNW b1.060.8−0.70.9−0.6-
WB TC: [−3:0]; a: constant mechanical wind; b: simulated natural wind; working period; reference: 26 C ambient temperature
8Hua et al. 2012 [76]CHN129-X-Ventilation CMW a-2850281.080.0−0.4---
Ventilation SNW b1.06−0.1−0.4---
Ventilation CMW a3050301.080.6−0.7---
Ventilation SNW b1.060.5−0.6---
9Hua et al. 2012 [76]CHN102-X-Ventilation CMW a-28.440-0.80−0.1−0.5−0.0−0.5-
Ventilation SNW b0.76−0.1−0.3−0.0−0.5-
Field study; a: constant mechanical wind; b: simulated natural wind; reference: 26 C ambient temperature
10Cui et al. 2012 [84]CHN126-X-Ventilation CMW a-28-281.060.3−0.30.4−0.2-
Ventilation SNW b0.2−0.40.4−0.2-
Ventilation CMW a30-281.060.9−0.60.4−0.2-
Ventilation SNW b0.6−0.50.4−0.2-
WB TC: [−3:0]; a: constant mechanical wind; b: simulated natural wind; resting period; reference: 26 C ambient temperature
11Akimoto et al. 2009 [173]JPN62-X-Ventilation-2850--0.0−0.81.3−1.2-
U: v2850--−0.1−0.81.3−1.2-
WB TC: [−3:0]
12Atthajariyakul et al. 2008 [88]THA105-X-Ventilation-2570250.50−0.9-−0.4-0 a
1.00−1.3-−0.4-40 a
1.50−1.7-−0.4-73 a
2.00−2.0-−0.4-88 a
2670260.50−0.2-0.3-0 a
1.00−0.3-0.3-0 a
1.50−0.9-0.3-13 a
2.00−1.4-0.3-40 a
2770270.500.1-0.4-0 a
1.00−0.1-0.4-0 a
1.50−0.4-0.4-0 a
2.00−0.8-0.4-0 a
2875280.500.5-0.9-0 a
1.000.0-0.9-0 a
1.50−0.3-0.9-0 a
2.00−0.5-0.9-6 a
a: PD based on TS between −1 and 1
13Zhang et al. 2007 [174,175]CHN300-X-Ventilation (face)-3540221.000.20.51.4−0.3-
WB TC: [−2:−0;+0:2]
Table A2. Personal climatization systems applying horizontal and vertical ventilation.
No.SourcePlaceSubjectsTaskSystemControlTarhTsupplvsupplRes. WBRef. WBPD
MFHCIAQ[ C][%][ C][m s 1 ]TSTCTSTC[%]
14Zhai et al. 2015 [98]USA88-X-Ventilation, vertical-2660260.30.22.00.31.70
0.7−0.22.00.31.70
0.9−0.61.70.31.70
80260.30.11.70.61.50
0.7−0.11.90.61.50
0.9−0.11.90.61.50
2860280.70.21.90.81.10
0.9+0.02.10.81.10
1.2−0.12.10.81.10
80280.850.41.81.30.40
1.20.11.71.30.40
1.60.11.51.30.40
3060300.850.71.21.7−0.38
1.20.51.61.7−0.30
1.60.41.91.7−0.38
80301.20.81.12.2−1.47
1.60.51.62.2−1.40
1.80.51.42.2−1.40
WB TS: [−4:4]; WB TC: [−4:−0;+0:4]
15Pasut et al. 2014 [97]USA88-X-front c, oscillation a (2 W)-2850280.7 b1.10.91.00.4-
sideways c, oscillation a (2 W)0.9 b0.91.01.00.4-
front c, oscillation a (3 W)0.7 b1.00.81.00.4-
sideways c, oscillation a (3 W)0.8 b1.10.61.00.4-
front c, constant (2 W)-2850280.7 b0.90.81.00.4-
sideways c, constant (2 W)0.9 b0.61.01.00.4-
front c, constant (3 W)0.7 b0.21.31.00.4-
sideways c, constant (3 W)0.8 b0.31.11.00.4-
upright c (2 W)-2850280.7 b0.71.01.00.4-
upright c (3 W)0.9 b0.41.31.00.4-
a: Ratio 10:15 (flow of air:rest time) in seconds; b: air speed at 1.1m height (peak if oscillation; average if constant ventilation); c: use of ceiling fans applying ventilation; WB TS: [−4:4]; WB TC: [−2:−0;+0:2]
16Zhai et al. 2013 [100]USA88-X-Ventilation, horizontal (2.9 W a)U: v2660260.3 a0.02.0--0
Ventilation, horizontal (5 W a)U: v28280.7 a0.21.9--3
Ventilation, horizontal (8 W a)U: v30301.0 a0.51.3--1
Ventilation, horizontal (3.3 W a)U: v2680260.4 a0.01.6--5
Ventilation, horizontal (5.6 W a)U: v28280.7 a0.51.8--5
Ventilation, horizontal (10.5 W a)U: v30301.3 a1.00.4--33
a: averaged used power; WB TS: [−4:4]; WB TC: [−4:4]
17Huang et al. 2013 [99]CHN1515-X-Ventilation, horizontal-2845280.60.0−0.30.5−0.4-
1.0−0.2−0.40.5−0.4-
1.5−0.4−0.40.5−0.4-
3045300.60.7−0.71.4−1.0-
1.00.5−0.51.4−1.0-
1.50.1−0.41.4−1.0-
2.00.0−0.41.4−1.0-
3245320.61.4−1.21.9−1.4-
1.01.0−0.81.9−1.4-
1.50.8−0.71.9−1.4-
2.00.5−0.81.9−1.4-
3445340.61.8−1.32.0−1.7-
1.01.3−1.12.0−1.7-
1.51.2−1.12.0−1.7-
2.00.9−1.02.0−1.7-
U: v2845280.5a0.0−0.20.5−0.40
3045302.0a0.2−0.21.4−1.00
3245321.6a0.5−0.51.9−1.435
3445341.9a0.9−0.72.0−1.752
a: preferred air velocity; WB TC: [−3:0]
18Makhoul et al. 2013 [142]-55-XXVentilation; 22.12% b-26-165.0 a−0.71.6---
Ventilation; 29.62% b207.5 a−0.71.6---
Ventilation; 33.12% b2410.0 a−0.81.4---
Ventilation; 20.19% b27-165.0 a0.11.5---
Ventilation; 27.25% b207.5 a−0.11.6---
Ventilation; 34.13% b2410.0 a−0.21.5---
Ventilation; 26.97% b28-165.0 a0.31.2---
Ventilation; 31.08% b207.5 a0.01.4---
Ventilation; 33.47% b2410.0 a−0.31.5---
a: volume air flow L/s; b: energy saving compared to the application of mixing ventilation (same TC); WB TC: [−4:4]
19Yang et al. 2010 [79]-1616-XXVentilation, vertical- a26-214 b0.3---12
23.50.8---22
261.0---31
218 b−0.3---6
23.50.0---12
260.3---23
2112 b−0.6---6
23.5−0.1---3
260.4---16
2116 b−1.0---21
23.5−0.5---12
260.0---9
23.5-214 b0.1---6
23.50.6---15
218 b−0.4---10
23.5−0.2---6
2112 b−0.9---16
23.5−0.3---10
2116 b−0.9---31
23.5−0.6---25
a: Subjects chose the (fixed) fan, but did not have any influence on the used power stage; b: volume air flow L/s; Field study
20Arens et al. 1998 [101]USA6257-X-Ventilation, horizontal, oscillation; 1.2metU: v2550250.74 a----14 b
2650260.74 a----8 b
2750270.74 a----1 b
2850280.74 a----9 b
2950290.74 a----15 b
3050300.74 a----27 b
Ventilation, horizontal, constant; 1.2 metU: v2750271.04 a----3 b
2850281.04 a----1 b
2950291.04 a----1 b
3050301.04 a----23 b
Ventilation, horizontal, oscillation; 1.0 metU: v2550250.74 a----8 b
2650260.74 a----12 b
2750270.74 a----10 b
2850280.74 a----16 b
2950290.74 a----20 b
3050300.74 a----2 b
Ventilation, horizontal, constant; 1.0 metU: v2750271.04 a----14 b
2850281.04 a----2 b
2950291.04 a----12 b
3050301.04 a----10 b
a: average air velocity at the highest power stage; b: percentage of responses beyond the range of ±1.5
Table A3. Personal climatization systems applying temperature-controlled and ventilated seats.
No.SourcePlaceSubjectsTaskSystemControlTarhTsupplvsupplRes. WBRef. WBPD
MFHCIAQ[ C][%][ C][m s 1 ]TSTCTSTC[%]
21Shahzad et al. 2017 [77,78]GBR2915X--Radiation: seat, backrest (30 W; max. 53.6 C )U: T2429-01.31.80.10.320 a
a: Percentage of subjects who are not satisfied with the thermal environment (<2, scale [−3:3]); Field study; separate temperature control for seat and backrest; preferred temperature: 29 C to 39 C ; reference: thermal assessment prior to the use of the thermally conditioned seat
22Veselý et al. 2017 [95]NLD76X--Radiation: seat, backrest (21 W; max. 28 C )U: T1847-0−0.3+0.0−1.2−0.2-
WB TC: [−1:−0;+0:1]; reference: operative temperature 17.7 C
23Pallubinsky et al. 2015 [104]NLD88-X-Radiation: seat, backrest-32.329.33001.5−0.31.7−0.4-
WB TC: [−2:−0;+0:2]
24Pasut et al. 2014 [116]USA1112XX-Radiation: seat, backrest; 0.8 cloU: T1650-0−1.00.7−1.7−0.726 a
1850-00.21.0−1.0−0.09 a
Radiation: seat, backrest; 1 cloU: T1650-00.00.7−1.7−0.726 a
Radiation: seat, backrest; 0.5 cloU: T2950-00.70.92.4−1.19 a
a: Percentage dissatisfied based on negative TC responses; WB TS: [−4:4]; WB TC: [−2:−0;+0:2]; max. energy demand: heating: 16 W, cooling: 3.6 W
25Pasut et al. 2013 [111]USA1416XX-Radiation: seat, backrest (27 W a)U: T1650-00.00.8−1.8−0.6-
Radiation: seat, backrest ( 23.5 W a)1850-00.01.0−1.0−0.2-
Radiation: seat, backrest ( 16.5 W a)2550-00.21.20.51.4-
Radiation: seat, backrest ( 45.5 W a)2950-00.50.32.3−0.7-
a: average energy demand; WB TS: [−4:4]; WB TC: [−2:−0;+0:2]
26Sun et al. 2012 [105]-1616-X-Ventilation, ventilators at the corners of the seat (max. 23.04 W , 1.87 m s −1)U: v22-220.48 a−0.5-−0.6--
24-240.48 to 1.22 a−0.4-−0.5--
26-261.87 a1.0-1.9--
a: preferred air velocity
27Washinosu et al. 2010 [108]JPN120-X-Ventilation: armrest, seatU: v28502811.11 a−0.20.61.8−1.418
30503011.11 a0.30.02.5−2.234
0828502811.11 a−1.01.01.300
30503011.11 a0.31.02.2−1.60
a: volume air flow in L s −1
28Watanabe et al. 2008 [106]JPN70-X-Ventilation: seat, backrest (max. 31.9 L/s)U: v28502821.3 a−0.10.70.10.70 b
30503023.8 a0.40.01.9−1.00 b
32503229.4 a2.1−1.32.8−1.743 b
Ventilation: seat, backrest (max. 4.8 L/s)U: v2850284.8 a00.70.10.80 b
3050304.8 a1.4−0.11.9−1.015 b
3250324.8 a2.8−1.62.8−1.771 b
a: preferred volume air flow in L s −1; b: percentage of subjects who did not accept the thermal environment; WB TC: [−2:2]
29Kogawa et al. 2007 [176]JPN22-X-Ventilation: armrest (max. 19.44 L s −1)U: v27-27-−0.3−0.50.5−0.8-
130.0−0.30.7−0.9-
WB TC: [−3:0]
30Onga et al. 2007 [107]JPN019-X-Ventilation: armrest (max. 19.44 L s −1)U: v28502811.11 a−0.2−0.10.1−0.5-
180−0.2−0.20.3−0.8-
a: average volume air flow L s −1; WB TC: [−3:0]
31Zhang et al. 2007 [110]DNK177XX-Radiation: seat, backrest-1545440-0.5 a--11
1845370-0.6 a--9
2245370-0.6 a--8
2545370-0.6 a--5
284525–370-0.4 a--10
3545250-0.4 a--28
4545180-0.0 a--53
a: instead of thermal comfort: thermal acceptance (TA), scale (TA): [−1:−0;+0:1]; environment of the study: vehicle
32Brooks, Parsons 1999 [109]-80X--Radiation: seat, backrest (max. 55 C )U: T540--−0.9−1.0−2.5−2.1-
1040--0.3−0.2−2.0−1.5-
1540--0.8−0.3−0.6−0.5-
20 a30--0.90.00.20.0-
a: surface temperature of the wall: 5 C ; WB TC: [−3:0]; environment of the study: vehicle
33Melikov et al. 1998 [114]-126X--Radiation: backrest (max. 60 C )U: T17-------50 a
20-------17 a
23-------0 a
a: Percentage of subjects who did not accept the thermal environment
Table A4. Personal climatization systems concerning the lower human body (radiation).
No.SourcePlaceSubjectsTaskSystemControlTarhTsupplvsupplRes. WBRef. WBPD
MFHCIAQ[ C][%][ C][m s 1 ]TSTCTSTC[%]
34Veselý et al. 2017 [95]NLD76X--heating pad 92 WU: T17.748--−1.0−0.0−1.2−0.2-
WB TC: [−1:−0;+0:1]
35Zhang et al. 2015 [112]USA88X--reflector incandescent bulb 21 WU: T18.9--0−0.91.5 a−0.61.5 a5
reflector incandescent bulb 15 W19.4--0−0.61.7 a−0.61.5 a3
reflector incandescent bulb 12 W20.0--0−0.31.7 a−0.61.5 a4
reflector incandescent bulb 5 W21.1--00.01.8 a−0.61.5 a6
a: instead of thermal comfort: thermal acceptance (TA); Subjects preferred an alternating, high heating power to a constant, lower heating power; There were ergonomic complaints due to the closed foot heater; energy saving per occupant: 500 W to 700 W towards 3 W to 21 W additional energy consumption; reference: ambient air temperature 21 C
36Pallubinsky et al. 2015 [104]NLD88-X-cooling panel-32.329.321.801.9−0.71.7−0.4-
WB TC: [−2:−0;+0:2]
37Enomoto et al. 2009 [25]JPN80X--temperature-controlled box inside climate chamber-14-140−3.0−2.5---
230−2.2−0.9---
320−0.90.0---
4100.50.0---
5001.9−1.1---
WB TS: [−4:4]
Table A5. Combination of personal thermal actuators (ventilation, radiation) for personal climatization systems.
No.SourcePlaceSubjectsTaskSystemControlTarhTsupplvsupplRes. WBRef. WBPD
MFHCIAQ[ C][%][ C][m s 1 ]TSTCTSTC[%]
38Veselý et al. 2017 [95]NLD76X--radiation: seat + backrest 17 W, desk mat 63 W, floor mat 69 WU: T17.948--0.70.3−1.2−0.2-
fixed a17.936--0.50.4−1.2−0.2-
A b: T17.948--−0.4+0.0−1.2−0.2-
a: fixed heating power: average heating power of the last part of a preceding trial (same thermal environment) of each thermal actuator; b: Automation based on fingertip temperature; max. energy demand: seat+backrest 36 W, 28 C ; desk mat 80 W , 35 C ; floor mat 100 W , 30 C ; WB TC: [−1:−0;+0:1]
39Pallubinsky et al. 2015 [104]NLD88-X-Ventilation 1.28 m s −1; radiation (underarm) 22.7 C -32.329.322.71.281.00.11.7−0.4-
WB TC: [−2:−0;+0:2]
40Pasut et al. 2014 [116]USA1112-X-Ventilation 1.2 W ; radiation: seat+backrest 3.6 W U: v2950--0.212.4−1.1-
WB TS: [−4:4]; WB TC: [−2:−0;+0:2]; table fan significantly improves TS
41Arens et al. 2008 [118]USA99XXXradiation: hand-heater 28.6 W , foot heater 30 W ; ventilation: face-ventilation 35 W , hand-ventilation 6 W -18-35/32 a-−0.90.6−1.20.2-
19.9-35/32 a-−0.31.2−0.61.6-
27.5-281.000.31.41.40.2-
29-280.80.92.0−1.4-
U: T,v18-35/32 a-−0.71.1−1.20.2-
19.9-35/32 a-−0.21.9−0.61.6-
24.2-24.5/25 a0.600.02.60.32.0-
27.5-281.00−0.21.91.40.2-
29-280.71.02.0−1.4-
a: average temperature hand/foot heater; WB TS and WB TC: [−4:−0;+0:4]
42Knudsen et al. 2005 [115]-2424XXXPV (20 C ): RMP, UD ATD: 5 L s −1; radiant heating: seat, under-desk (UD), floor panel 47 C U: T,v20-20/40/45d15 a-0.8 b-0.5 b8 c
22-15 a-0.8 b-0.5 b14 c
26-15 a-0.7 b-0.5 b11 c
a: volume air flow L s −1; b: instead of thermal comfort: thermal acceptance (TA), scale (TA): [−1:−0;+0:1]; c: Percentage of Dissatisfied due to perceived air quality (PAQ); d: PV: 20 C , UD: 40 C , backrest: 45 C ; reference: air temperature 22 C
43Melikov et al. 1998 [114]-126X--radiation: max. 60 C (back+thighs)U: T17--0.00----50 a
20--0.00----22 a
23--0.00----5 a
radiation: max. 60 C (back, thighs, legs (front+back))U: T14--0.00----54 a
17--0.00----12 a
20--0.00----12 a
23--0.00----0 a
a: based on thermal not acceptable responses; cold local thermal sensation at hands and arms due to following ambient air temperature: 14 C to 20 C
44Bauman et al. 1997 [29]USA42XX-Ventilation; radiation (lower body)U: T,v----0.31.50.50.10
WB TC: [1:4:7]; change of TS: +0.84 (with personal thermal actuators) vs +0.16 (reference); PD based on subjects with TS < −1 or TS > +1; reference: 10 to 12 persons per building; Field study
Table A6. Personal ventilation (possible preconditioning of the supplied air) and evaporative coolers.
No.SourcePlaceSubjectsTaskSystemControlTarhTsupplvsupplRes. WBRef. WBPD
MWHCIAQ[ C][%][ C][m s 1 ]TSTCTSTC[%]
45Kalmar et al. 2012 [139]HUN109-XXchilled ceiling (CC)-30-305.55 a-0.8-0.8-
87chilled floor (CF)28.5-28.55.55 a-0.6-1.1-
a: volume air flow L s −1; alternating air flow through 3 air jets (mounted on a horizontal plane which is placed on the desk); dissatisfaction due to draught
46Kalmar et al. 2017 [138]HUN100-XX30s interval, average age: 24-30-300.481.11.31.41.4-
20 s interval, average age: 241.01.01.41.4-
10 s interval, average age: 240.80.71.41.4-
30 s interval, average age: 57-30-300.481.01.21.51.6-
20 s interval, average age: 571.01.21.51.6-
10 s interval, average age: 570.80.61.51.6-
01030 s interval, average age: 24-30-300.480.10.01.20.6-
20 s interval, average age: 24−0.0−0.11.20.6-
10 s interval, average age: 240.0−0.21.20.6-
30 s interval, average age: 57-30-300.480.80.91.21.0-
20 s interval, average age: 570.70.61.21.0-
10 s interval, average age: 570.50.41.21.0-
alternating horizontal air flow towards the face supplied by 3 air jets; volume air flow: 5.55 L s −1
47Verhaart et al. 2016 [127]NLD57-XXductless PVU: v27.5-232.5−0.12.80.80.0-
262.50.01.50.80.0-
WB TC: [-5:5]
48Dalweski et al. 2014 [133]-1713-XXductless PV, max. 1.7 m s −1U: v261624.50–20 a0.10.8 b0.30.8 b1
1523.65–20 a0.00.9 b0.30.7 b1
291327.55–20 a0.90.7 b1.40.3 b7
1426.15–20 a0.60.7 b1.20.4 b4
a: preferred volume air flow L s −1; b: instead of thermal comfort: thermal acceptance (TA), scale [−1:−0;+0:1]
49Dalewski et al. 2013 [132]-1713--Xductless PV b, max. volume air flow 16 L s −1U: v2335 ± 5------2 a
29------6 a
a: Percentage Dissatisfied with perceived air quality (PAQ); b: ratio 60:40 (recirculated indoor air:outdoor air)
50Ghaddar et al. 2013 [177]-44-X-personal evaporative cooler; air-conditioning: CC/DV-23.5 a-23.510.00 b-1.6---
26.2 a-26.210.00 b-0.2---
28 a-2810.00 b-0.2---
U: v21 a-21--2.2-1.8-
a: Temperature of displacement ventilation; b: volume air flow L s −1; WB TC: [−4:4]; temperature of chilled ceiling: 17 C ; 7% energy saving towards mixing ventilation
51Chen et al. 2012 [130]-1729--XPV ATD (Air Task Device); recirculated room airU: v23-208.25 a−1.4---7
237.11 a−1.2---14
26-209.50 a−0.6---3
239.06 a−0.5---4
2610.21 a−0.3---6
a: average volume air flow L s −1
52Melikov et al. 2011 [125]-2015--XPV, 2 air jets in the headrest-2035 ± 5227.00 a-----
-23237.00 a-----
-26267.00 a-----
a: volume air flow L s −1; coldest local TS: neck
53Arens et al. 2011 [80]USA99-XXVentilation a: 2 * 4″ (8 W )-2850280.601.50.61.7−0.2-
Ventilation a: 1 * 4″ (4 W )1.001.01.01.7−0.2-
Ventilation a: 2 * 4” (8 W )1.000.61.61.7−0.2-
Ventilation a: 2 * 2″1.001.01.51.7−0.2-
Ventilation a: 2 * 4″ (8 W )U: v285028-0.51.81.7−0.2-
Ventilation a: 2 * 2″0.81.01.7−0.2-
a: air jets for the cooling of the face region; WB TS: [−4:4]: WB TC: [−2:−0;+0:2]
54Li et al. 2010 [122]-99-XXPV; UFAD: 22 C , 480 L s −1-26-260.30−0.4-−0.3--
660.70−0.8-−0.3--
118220.30−0.5-−0.3--
470.70−0.8-−0.3--
107PV; UFAD: 18 C , 360 L s −1-26-260.30−0.4-−0.3--
580.70−0.8-−0.3--
137220.30−0.7-−0.3--
280.70−0.8-−0.3--
Preference for a cooler than neutral TS, higher TC through lower TS; reference: use of mixed ventilation; solely use of UFAD: TS about −0.35
55Chakroun et al. 2011 [73]-3-X-evaporative cooler; CC/DV; 100% outdoor air; chilled ceiling: 17 C -225118.83.00 a-1.51.5--
2351205.00 a-1.61.5--
245121.310.0 a-1.31.5--
a: volume air flow L/s; reference: 21 C ; energy saving: 5.8% to 17.5% towards mixing ventilation; WB TC: [−4:4]
56Kaczmarczyk et al. 2009 [128]-1616X-XPV: round movable panel (RMP)-2030210.55−0.4-−0.2--
260.550.05-−0.2--
57Melikov et al. 2008 [178]DNK1616--XPV: round, movable panel (RMP)-2630270.30-0.3 a-0.3 a-
0.60-0.3 a-0.3 a-
70270.30-0.3 a-0.1 a-
0.60-0.2 a-0.1 a-
a: instead of thermal comfort: perceived air quality (PAQ), scale (PAQ): [0:1]
58Amai et al. 2007 [135]-012-XXair jet (duct) (3DU+) (back, head)U: T,v2850--−0.3−0.3−0.3−0.3-
table fan (PEM) from front (upper body)U: T,v2850--−0.5−0.5−0.3−0.3-
under-desk unit (TU) from front (lower body)U: T,v2850--−0.1−0.7−0.3−0.3-
remote controlled air supply unit (duct) (RCU) placed behind the occupantU: T,v2850--−0.4−0.5−0.3−0.3-
remote controlled air supply unit (duct) (RCU) placed behind the occupant, mesh chairU: T,v2850--−0.3−0.5−0.3−0.3-
120-XXair jet (duct) (3DU+) (back, head)U: T,v2850--−0.4−0.50.3−0.7-
table fan (PEM) from front (upper body)U: T,v2850--−0.5−0.50.3−0.7-
under-desk unit (TU) from front (lower body)U: T,v2850--0.1−0.70.3−0.7-
remote controlled air supply unit (duct) (RCU) placed behind the occupantU: T,v2850--−0.3−0.50.3−0.7-
remote controlled air supply unit (duct) (RCU) placed behind the occupant, mesh chairU: T,v2850--−0.6−0.50.3−0.7-
WB TC: [−3:0]; Subjects have control over air flow direction and targeted body regions; reference: air temperature 26 C
59Kaczmarczyk et al. 2004 [124]-30-XXPV: outdoor air; polluted indoor airU: v233020-----7 a
23-----14 a
PV: recirculated air; polluted indoor airU: v233023-----20 a
263020-0.5-0.9-20 a
a: Percentage of Dissatisfied with perceived air quality (PAQ); volume air flow max. 15 L s −1
Figure A1. Summarizing chart of personalized climatization systems depending on heating and cooling method: single thermal actuators.
Applsci 09 00035 g0a1
Figure A2. Summarizing chart of personalized climatization systems depending on heating and cooling method: combined thermal actuators.
Applsci 09 00035 g0a2

References

  1. BMU. Klimaschutz in Zahlen (2018) Fakten, Trends und Impulse Deutscher Klimapolitik; BMU: Berlin, Germany, 2018.
  2. Schlomann, D.B.; Wohlfarth, K.; Kleeberger, H.; Hardi, L.; Geiger, D.I.B.; Pich, D.A.; Gruber, E.; Gerspacher, A.; Holländer, E.; Roser, D.A. Energieverbrauch des Sektors Gewerbe, Handel, Dienstleistungen (GHD) in Deutschland für die Jahre 2011 bis 2013 Schlussbericht an das Bundesministerium für Wirtschaft und Energie (BMWi); ZEW: Mannheim, Germany, 2015. [Google Scholar]
  3. Fisk, W.J.; Rosenfeld, A.H. Estimates of Improved Productivity and Health from Better Indoor Environments. Indoor Air 1997, 7, 158–172. [Google Scholar] [CrossRef] [Green Version]
  4. Wargocki, P.; Frontczak, M.; Schiavon, S.; Goins, J.; Arens, E.; Zhang, H. Satisfaction and self-estimated performance in relation to indoor environmental parameters and building features. In Proceedings of the 10th International Conference on Healthy Buildings Indoor Environmental Quality (IEQ), Brisbane, Australia, 8–12 July 2012; Volume 1. [Google Scholar]
  5. Wyon, D.P.; Andersen, I.; Lundqvist, G.R. The effects of moderate heat stress on mental performance. Scand. J. Work Environ. Health 1979, 5, 352–361. [Google Scholar] [CrossRef] [PubMed]
  6. McCartney, K.J.; Humphreys, M.A. Thermal comfort and productivity. Indoor Air 2002, 1, 822–827. [Google Scholar]
  7. Rim, D.; Schiavon, S.; Nazaroff, W.W. Energy and Cost Associated with Ventilating Office Buildings in a Tropical Climate. PLOS ONE 2015, 10, 1–14. [Google Scholar] [CrossRef] [PubMed]
  8. Frohn, D.B.; Dulle, H. BOB (balanced office building) denkt Bürogebäude neu—Für die Arbeitswelten der Zukunft. 2016. [Google Scholar]
  9. DIN EN ISO 7730, 2006-05. Ergonomie der Thermischen Umgebung—Analytische Bestimmung und Interpretation der Thermischen Behaglichkeit durch Berechnung des PMV-und des PPD-Indexes und Kriterien der Lokalen Thermischen Behaglichkeit. Available online: https://www.beuth.de/de/norm/din-en-iso-7730/89417255 (accessed on 20 December 2018).
  10. Kemle, A.; Manski, R.; Weinbrenner, M. Klimaanlagen mit erhöhter Energieeffizienz. ATZ Automobiltechnische Zeitschrift 2009, 111, 650–656. [Google Scholar] [CrossRef]
  11. Ritz, J. Elektromobilität: Was bremst den Erfolg elektrischer Fahrzeuge? In Mobilitätswende—Autonome Autos Erobern Unsere Straßen: Ressourcenverbrauch, Ökonomie und Sicherheit; Springer Fachmedien Wiesbaden: Wiesbaden, Germany, 2018; Chapter 3; pp. 9–20. [Google Scholar] [CrossRef]
  12. Schmidt, C.; Praster, M.; Wölki, D.; Wolf, S.; van Treeck, C. Rechnerische und probandengestützte Untersuchung des Einflusses der Kontaktwärmeübertragung in Fahrzeugsitzen auf die thermische Behaglichkeit. FAT-Schriftenreihe 2013, 261, 1–76. [Google Scholar]
  13. Schmidt, C.; Veselá, S.; Nabi Bidhendi, M.; Rudnick, J.; Treeck, C. Zusammenhang zwischen lokalem und globalem Behaglichkeitsempfinden: Untersuchung des Kombinationseffektes von Sitzheizung und Strahlungswärmeübertragung zur energieeffizienten Fahrzeugklimatisierung. FAT Schriftenreihe 2015, 272, 2015. [Google Scholar]
  14. Dammaß, G.; Wölki, D. Energieeffiziente und Automatisierte Klimatisierung von Elektrofahrzeugen unter Verwendung Innovativer Sensorik zur Bestimmung des Thermischen Komforts als Neuartige Regelgröße (EneffThermControl); AZ31078; Dallas Baptist University: Dallas, TX, USA, 2017. [Google Scholar]
  15. Metzmacher, H.; Wölki, D.; Schmidt, C.; Frisch, J.; van Treeck, C. Real-Time Assessment of Human Thermal Comfort Using Image Recognition in Conjunction with a Detailed Numerical Human Model. In Proceedings of the Conference of IBPSA, San Francisco, CA, USA, 7–9 August 2017. [Google Scholar]
  16. Melikov, A.; Pitchurov, G.; Naydenov, K.; Langkilde, G. Field study on occupant comfort and the office thermal environment in rooms with displacement ventilation. Indoor Air 2005, 15, 205–214. [Google Scholar] [CrossRef]
  17. Huizenga, C.; Abbaszadeh, S.; Zagreus, L.; Arens, E. Air quality and thermal comfort in office buildings: Results of a large indoor environmental quality survey. Healthy Build. 2006, III, 393–397. [Google Scholar]
  18. ANSI/ASHRAE Standard 55. Thermal Environmental Conditions for Human Occupancy; ASHRAE: Atlanta, GA, USA, 2017. [Google Scholar]
  19. Arens, E.A.; Zhang, H.; Huizenga, C. Partial- and Whole-Body Thermal Sensation and Comfort, Part I: Uniform Environmental Conditions; Technical Report; University of California: Berkeley, CA, USA, 2005. [Google Scholar]
  20. Zhang, H.; Arens, E.; Huizenga, C.; Han, T. Thermal Sensation and Comfort Models for Non-Uniform and Transient Environments, Part II: Local Comfort of Individual Body Parts; Technical Report; University of California: Berkeley, CA, USA, 2009. [Google Scholar]
  21. Brager, G.; Zhang, H.; Arens, E. Evolving opportunities for providing thermal comfort. Build. Res. Inf. 2015, 43, 274–287. [Google Scholar] [CrossRef] [Green Version]
  22. Pye, S.; Dobbins, A.; Baffert, C.; Brajkovic, J.; Miglio, R.; Deane, P. Energy Poverty and Vulnerable Consumers in the Energy Sector across the EU: Analysis of Policies and Measures; Technical Report; InsightE: Broomfield, CO, USA, 2015. [Google Scholar]
  23. Bouzarovski, S. Energy poverty in the European Union: landscapes of vulnerability. Wiley Int. Rev. Energy Environ. 2013, 3, 276–289. [Google Scholar] [CrossRef] [Green Version]
  24. Csiba, K.; Bajomi, A.; Gosztonyi, Á.; Jones, S.; Tod, A.; Thomson, H.; Groote, M.; Anagnostopoulos, F.; Bouzarovski, S.; Herrero, S.; et al. Energy Poverty Handbook; European Parliament: Bruxelles, Belgium, 2016. [Google Scholar] [CrossRef]
  25. Enomoto, H.; Kumamoto, T.; Tochihara, Y. Effects of lower body warming on physiological and psychological responses of humans. In Proceedings of the 3rd International Conference on Environmental Ergonomics, Boston, MA, USA, 2–7 August 2009. [Google Scholar]
  26. Bouzarovski, S.; Petrova, S.; Sarlamanov, R. Energy poverty policies in the EU: A critical perspective. Energy Policy 2012, 49, 76–82. [Google Scholar] [CrossRef]
  27. Liddell, C.; Morris, C. Fuel poverty and human health: A review of recent evidence. Energy Policy 2010, 38, 2987–2997. [Google Scholar] [CrossRef]
  28. Zhang, H.; Arens, E.; Zhai, Y. A review of the corrective power of personal comfort systems in non-neutral ambient environments. Build. Environ. 2015, 91, 15–41. [Google Scholar] [CrossRef] [Green Version]
  29. Bauman, F.; Baughman, A.; Carter, G.; Arens, E. A Field Study of PEM (Personal Environmental Module) Performance in Bank of America’s San Francisco Office Buildings; Technical Report; Center for Environmental Design Research, University of California: Berkeley, CA, USA, 1997. [Google Scholar]
  30. Leaman, A.; Bordass, B. Productivity in buildings: The “killer” variables. Build. Res. Inf. 1999, 27, 4–19. [Google Scholar] [CrossRef]
  31. Spengler, J.D.; Sexton, K. Indoor air pollution: A public health perspective. Science 1983, 221, 9–17. [Google Scholar] [CrossRef] [PubMed]
  32. Fanger, P.O. Thermal Comfort Analysis and Applications in Environmental Engineering. Ph.D. Thesis, Technical University of Danemark, Roskilde, Danemark, 1970. [Google Scholar]
  33. Bridger, R.S. Introduction to Ergonomics, 3rd ed.; CRC Press: Boca Raton, FL, USA, 2008. [Google Scholar]
  34. Gossauer, E. Nutzerzufriedenheit in Bürogebäuden—Eine Feldstudie. Ph.D. Thesis, Karlsruher Institut für Technologie (KIT), Karlsruhe, Germany, 2008. [Google Scholar]
  35. Brager, G.S.; de Dear, R.J. Historical and Cultural Influences on Comfort Expectations. In Buildings, Culture and Environment; Blackwell Publishing Ltd.: Ames, IA, USA, 2008; Chapter 11; pp. 177–201. [Google Scholar] [CrossRef]
  36. Nicol, J.F.; Humphreys, M.A. Thermal comfort as part of a self-regulating system. Build. Res. Pract. 1973, 1, 174–179. [Google Scholar] [CrossRef]
  37. Brager, G.S.; de Dear, R.J. A standard for natural ventilation. ASHRAE J. 2000, 42, 21–27. [Google Scholar]
  38. Liu, J.; Yao, R.; McCloy, R. A method to weight three categories of adaptive thermal comfort. Energy Build. 2012, 47, 312–320. [Google Scholar] [CrossRef]
  39. de Dear, R.J.; Brager, G.S.; Cooper, D. Developing an Adaptive Model of Thermal Comfort and Preference. ASHRAE Trans. 1998, 14, 27–49. [Google Scholar]
  40. ISSO-Publicatie 74. Thermische Behaaglijkheid; ISSO: New York, NY, USA, 2014. [Google Scholar]
  41. Parsons, K.C. The effects of gender, acclimation state, the opportunity to adjust clothing and physical disability on requirements for thermal comfort. Energy Build. 2002, 34, 593–599. [Google Scholar] [CrossRef]
  42. de Dear, R.J.; Fountain, M.E. Field experiments on occupant comfort and office thermal environment in a hot-humid climate. Indoor Environ. Qual. (IEQ) 1994, 100, 457–475. [Google Scholar]
  43. Humphreys, M.A. Outdoor temperature and comfort indoors. Batiment Int. Buil. Res. Pract. 1978, 6, 92–105. [Google Scholar] [CrossRef]
  44. Ku, K.; Liaw, J.; Tsai, M.; Liu, T. Automatic Control System for Thermal Comfort Based on Predicted Mean Vote and Energy Saving. IEEE Trans. Autom. Sci. Eng. 2015, 12, 378–383. [Google Scholar] [CrossRef] [Green Version]
  45. Hyesim, H.; Jinsook, L.; Jonghun, K.; Cheolyong, J.; Hakgeun, J. Thermal Comfort Control Based on a Simplified Predicted Mean Vote index. Energy Procedia 2014, 61, 970–974. [Google Scholar] [CrossRef]
  46. Brager, G.S.; de Dear, R.J. Thermal adaptation in the built environment: a literature review. Energy Build. 1998, 27, 83–96. [Google Scholar] [CrossRef] [Green Version]
  47. DIN EN 15251, 2012-12. Ergonomie des Umgebungsklimas—Beurteilung des Einflusses des Umgebungsklimas unter Anwendung Subjektiver Bewertungsskalen. Available online: https://www.lfe.mw.tum.de/fileadmin/w00bxz/www/ergonomie_aktuell/zeitung05.pdf (accessed on 20 December 2018).
  48. Fanger, P.O.; Toftum, J. Extension of the PMV model to non-air-conditioned building in warm climates. Energy Build. 2002, 34, 533–536. [Google Scholar] [CrossRef]
  49. Yao, R.; Li, B.; Liu, J. A theoretical adaptive model of thermal comfort - Adaptive Predicted Mean Vote (aPMV). Build. Environ. 2009, 44, 2089–2096. [Google Scholar] [CrossRef]
  50. Humphreys, M.A.; Nicol, J.F. The validity of ISO-PMV for predicting comfort votes in every-day thermal environments. Energy Build. 2002, 34, 667–684. [Google Scholar] [CrossRef]
  51. Kim, J.T.; Lim, J.H.; Cho, S.H.; Yun, G.Y. Development of the adaptive PMV model for improving prediction performances. Energy Build. 2015, 98, 100–105. [Google Scholar] [CrossRef]
  52. Schweiker, M.; Wagner, A. A framework for an adaptive thermal heat balance model (ATHB). Build. Environ. 2015, 94, 252–262. [Google Scholar] [CrossRef]
  53. Gagge, A.; Fobelets, A.; Berglund, L.G. A standard predictive index of human response to the thermal environment. ASHRAE Trans. 1986, 92, 6494216. [Google Scholar]
  54. DIN EN ISO 14505-2, 2007-4. Ergonomie der Thermischen Umgebung—Beurteilung der Thermischen Umgebung in Fahrzeugen—Teil 2: Bestimmung der Äquivalenttemperatur; ISO: Geneva, Switzerland, 2007. [Google Scholar]
  55. Nilsson, H. Comfort Climate Evaluation with Thermal Manikin Methods and Computer Simulation Models; National Institute for Working Life: Kathmandu, Nepal, 2004. [Google Scholar]
  56. DIN EN ISO 10551, 2002-01. Eingangsparameter für das Raumklima zur Auslegung und Bewertung der Energieeffizienz von Gebäuden—Raumluftqualität, Temperatur, Licht und Akustik. Available online: https://onlinelibrary.wiley.com/doi/pdf/10.1002/bapi.200810006 (accessed on 20 December 2018).
  57. Gagge, A.P.; Stolwijk, J.A.J.; Hardy, J.D. Comfort and thermal sensations and associated physiological responses at various ambient temperatures. Environ. Res. 1967, 1, 1–20. [Google Scholar] [CrossRef]
  58. Arens, E.; Zhang, H. The skin’s role in human thermoregulation and comfort. In Thermal and Moisture Transport in Fibrous Materials; Woodhead Publishing: Cambridge, UK, 2006; pp. 560–602. [Google Scholar] [CrossRef]
  59. Bulcao, C.F.; Frank, S.M.; Raja, S.N.; Tran, K.M.; Goldstein, D.S. Relative contribution of core and skin temperatures to thermal comfort in humans. J. Therm. Biol. 2000, 25, 147–150. [Google Scholar] [CrossRef]
  60. Liu, Y.; Wang, L.; Di, Y.; Liu, J.; Zhou, H. The effects of clothing thermal resistance and operative temperature on human skin temperature. J. Therm. Biol. 2013, 38, 233–239. [Google Scholar] [CrossRef]
  61. Zhang, H.; Arens, E.; Huizenga, C.; Han, T. Thermal sensation and comfort models for non-uniform and transient environments: Part III: whole-body sensation and comfort. Build. Environ. 2010, 45, 389–398. [Google Scholar] [CrossRef]
  62. Schmidt, C. Entwicklung Eines Modellansatzes zur Bewertung der Thermischen Behaglichkeit unter Inhomogenen Klimabedingungen. Ph.D. Thesis, RWTH Aachen, Aachen, Germany, 2016. [Google Scholar]
  63. Zhang, H.; Huizenga, C.; Arens, E.; Yu, T. Modeling Thermal Comfort in Stratified Environments. Indoor Air 2005. Available online: https://escholarship.org/uc/item/8q58k4hs (accessed on 20 December 2018).
  64. Zhang, H. Human Thermal Sensation and Comfort in Transient and Non-Uniform Thermal Environments. Ph.D. Thesis, University of California, Berkeley, CA, USA, 2003. [Google Scholar]
  65. Zhang, H.; Huizenga, C.; Arens, E.; Wang, D. Thermal sensation and comfort in transient non-uniform thermal environments. Eur. J. Appl. Physiol. 2004, 92, 728–733. [Google Scholar] [CrossRef] [PubMed] [Green Version]
  66. Sakoi, T.; Tsuzuki, K.; Kato, S.; Ooka, R.; Song, D.; Zhu, S. Thermal comfort, skin temperature distribution, and sensible heat loss distribution in the sitting posture in various asymmetric radiant fields. Build. Environ. 2007, 42, 3984–3999. [Google Scholar] [CrossRef]
  67. Hoyt, T.; Zhang, H.; Arens, E. Draft or breeze? Preferences for air movement in office buildings and schools from the ASHRAE database. Healthy Build. 2009. Available online: https://escholarship.org/uc/item/99q2f4cf (accessed on 22 December 2018).
  68. Toftum, J. Air movement—Good or bad? Indoor Air 2004, 14 (Suppl. 7). [Google Scholar] [CrossRef]
  69. Arens, E.; Turner, S.; Zhang, H.; Paliaga, G. Moving air for comfort. ASHRAE J. 2009, 18–28. Available online: https://escholarship.org/uc/item/6d94f90b (accessed on 22 December 2018).
  70. Kubo, H.; Isoda, N.; Enomoto-Koshimizu, H. Cooling effects of preferred air velocity in muggy conditions. Build. Environ. 1997, 32, 211–218. [Google Scholar] [CrossRef]
  71. Candido, C.; de Dear, R.; Lamberts, R.; Bittencourt, L. Air movement acceptability limits and thermal comfort in Brazil’s hot humid climate zone. Build. Environ. 2010, 45, 222–229. [Google Scholar] [CrossRef]
  72. Ghahramani, A.; Zhang, K.; Dutta, K.; Yang, Z.; Becerik-Gerber, B. Energy savings from temperature setpoints and deadband: Quantifying the influence of building and system properties on savings. Appl. Energy 2016, 165, 930–942. [Google Scholar] [CrossRef] [Green Version]
  73. Chakroun, W.; Ghaddar, N.; Ghali, K. Chilled ceiling and displacement ventilation aided with personalized evaporative cooler. Energy Build. 2011, 43, 3250–3257. [Google Scholar] [CrossRef]
  74. Schiavon, S.; Melikov, A.K.; Sekhar, C. Energy analysis of the personalized ventilation system in hot and humid climates. Energy Build. 2010, 42, 699–707. [Google Scholar] [CrossRef]
  75. Schiavon, S.; Melikov, A.K. Energy-saving strategies with personalized ventilation in cold climates. Energy Build. 2009, 41, 543–550. [Google Scholar] [CrossRef]
  76. Hua, J.; Ouyang, Q.; Wang, Y.; Li, H.; Zhu, Y. A dynamic air supply device used to produce simulated natural wind in an indoor environment. Build. Environ. 2012, 47, 349–356. [Google Scholar] [CrossRef]
  77. Shahzad, S.; Calautit, J.; Aquino, A.; Nasir, D.; Hughes, B. Neutral thermal sensation or dynamic thermal comfort? Numerical and field test analysis of a thermal chair. Energy Procedia 2017, 142, 2189–2194. [Google Scholar] [CrossRef]
  78. Shahzad, S.; Calautit, J.K.; Aquino, A.I.; Nasir, D.S.N.M.; Hughes, B.R. A user-controlled thermal chair for an open plan workplace: CFD and field studies of thermal comfort performance. Appl. Energy 2017, 207, 283–293. [Google Scholar] [CrossRef] [Green Version]
  79. Yang, B.; Sekhar, S.C.; Melikov, A.K. Ceiling-mounted personalized ventilation system integrated with a secondary air distribution system—A human response study in hot and humid climate. Indoor Air 2010, 20, 309–319. [Google Scholar] [CrossRef] [PubMed]
  80. Arens, E.; Zhang, H.; Pasut, W. Thermal Comfort and Perceived air Quality of a PEC System; Technical Report; University of California, Center for the Built Environment: Berkeley, CA, USA, 2011. [Google Scholar]
  81. Schiavon, S.; Melikov, A.K. Introduction of a Cooling-Fan Efficiency Index. HVAC&R Res. 2009, 15, 1121–1144. [Google Scholar] [CrossRef] [Green Version]
  82. Arens, E.; Zhang, H.; Pasut, W.; Zhai, Y.; Hoyt, T.; Huang, L. Air Movement as an Energy Efficient Means Toward Occupant Comfort; Technical Report; California Air Resources Board: Sacramento, CA, USA, 2013.
  83. Zhu, Y.; Luo, M.; Ouyang, Q.; Huang, L.; Cao, B. Dynamic characteristics and comfort assessment of airflows in indoor environments: A review. Build. Environ. 2015, 91, 5–14. [Google Scholar] [CrossRef]
  84. Cui, W.; Cao, G.; Ouyang, Q.; Zhu, Y. Influence of dynamic environment with different airflows on human performance. Build. Environ. 2013, 62, 124–132. [Google Scholar] [CrossRef]
  85. Uğursal, A.; Culp, C.H. The effect of temperature, metabolic rate and dynamic localized airflow on thermal comfort. Appl. Energy 2013, 111, 64–73. [Google Scholar] [CrossRef]
  86. Habchi, C.; Chakroun, W.; Alotaibi, S.; Ghali, K.; Ghaddar, N. Effect of shifts from occupant design position on performance of ceiling personalized ventilation assisted with desk fan or chair fans. Energy Build. 2016, 117, 20–32. [Google Scholar] [CrossRef]
  87. Junjing, Y.; Sekhar, C.; Cheong, D.; Raphael, B. Performance evaluation of an integrated Personalized Ventilation–Personalized Exhaust system in conjunction with two background ventilation systems. Build. Environ. 2014, 78, 103–110. [Google Scholar] [CrossRef]
  88. Atthajariyakul, S.; Lertsatittanakorn, C. Small fan assisted air conditioner for thermal comfort and energy saving in Thailand. Energy Convers. Manag. 2008, 49, 2499–2504. [Google Scholar] [CrossRef]
  89. He, M.; Li, N.; He, Y.; He, D.; Song, C. The influence of personally controlled desk fan on comfort and energy consumption in hot and humid environments. Build. Environ. 2017, 123, 378–389. [Google Scholar] [CrossRef]
  90. Assaad, D.A.; Ghali, K.; Ghaddar, N.; Habchi, C. Mixing ventilation coupled with personalized sinusoidal ventilation: Optimal frequency and flow rate for acceptable air quality. Energy Build. 2017, 154, 569–580. [Google Scholar] [CrossRef]
  91. Bauman, F.; Inkarojrit, V.; Hui, Z. Laboratory Test of the Argon Personal Air-Conditioning System (APACS); Technical Report; Center for Environmental Design Research, University of California: Berkeley, CA, USA, 2000. [Google Scholar]
  92. Watanabe, S.; Melikov, A.K.; Knudsen, G.L. Design of an individually controlled system for an optimal thermal microenvironment. Build. Environ. 2010, 45, 549–558. [Google Scholar] [CrossRef]
  93. Boerstra, A.C.; te Kulve, M.; Toftum, J.; Loomans, M.G.L.C.; Olesen, B.W.; Hensen, J.L.M. Comfort and performance impact of personal control over thermal environment in summer: Results from a laboratory study. Build. Environ. 2015, 87, 315–326. [Google Scholar] [CrossRef]
  94. He, Y.; Li, N.; He, M.; He, D. Using radiant cooling desk for maintaining comfort in hot environment. Energy Build. 2017, 145, 144–154. [Google Scholar] [CrossRef]
  95. Veselý, M.; Molenaar, P.; Vos, M.; Li, R.; Zeiler, W. Personalized heating—Comparison of heaters and control modes. Build. Environ. 2017, 112, 223–232. [Google Scholar] [CrossRef]
  96. Antoun, S.; Ghaddar, N.; Ghali, K. Coaxial personalized ventilation system and window performance for human thermal comfort in asymmetrical environment. Energy Build. 2016, 111, 253–266. [Google Scholar] [CrossRef]
  97. Pasut, W.; Arens, E.; Zhang, H.; Zhai, Y. Enabling energy-efficient approaches to thermal comfort using room air motion. Build. Environ. 2014, 79, 13–19. [Google Scholar] [CrossRef] [Green Version]
  98. Zhai, Y.; Zhang, Y.; Zhang, H.; Pasut, W.; Arens, E.; Meng, Q. Human comfort and perceived air quality in warm and humid environments with ceiling fans. Build. Environ. 2015, 90, 178–185. [Google Scholar] [CrossRef]
  99. Huang, L.; Ouyang, Q.; Zhu, Y.; Jiang, L. A study about the demand for air movement in warm environment. Build. Environ. 2013, 61, 27–33. [Google Scholar] [CrossRef]
  100. Zhai, Y.; Zhang, H.; Zhang, Y.; Pasut, W.; Arens, E.; Meng, Q. Comfort under personally controlled air movement in warm and humid environments. Build. Environ. 2013, 65, 109–117. [Google Scholar] [CrossRef] [Green Version]
  101. Arens, E.; Xu, T.; Miura, K.; Hui, Z.; Fountain, M.; Bauman, F. A study of occupant cooling by personally controlled air movement. Energy Build. 1998, 27, 45–59. [Google Scholar] [CrossRef] [Green Version]
  102. Karimi, G.; Chan, E.C.; Culham, J.R.; Linjacki, I.; Brennan, L. Thermal Comfort Analysis of an Automobile Driver with Heated and Ventilated Seat. In Proceedings of the SAE 2002 World Congress & Exhibition, Detroit, MI, USA, 4–7 March 2002. [Google Scholar] [CrossRef]
  103. Jacobs, P.; de Gids, W.F. Individual and collective climate control in aircraft cabins. Int. J. Veh. Des. 2006, 42, 57–66. [Google Scholar] [CrossRef]
  104. Pallubinsky, H.; Schellen, L.; Rieswijk, T.A.; Breukel, C.M.G.A.M.; Kingma, B.R.M.; van Marken Lichtenbelt, W.D. Local cooling in a warm environment. Energy Build. 2016, 113, 15–22. [Google Scholar] [CrossRef]
  105. Sun, W.; Cheong, K.W.D.; Melikov, A.K. Subjective study of thermal acceptability of novel enhanced displacement ventilation system and implication of occupants’ personal control. Build. Environ. 2012, 57, 49–57. [Google Scholar] [CrossRef]
  106. Watanabe, S.; Shimomura, T.; Miyazaki, H. Thermal evaluation of a chair with fans as an individually controlled system. Build. Environ. 2009, 44, 1392–1398. [Google Scholar] [CrossRef] [Green Version]
  107. Onga, A.; Nobe, T.; Kogawa, Y. Time Series Analysis of Cool Chair Operating Conditions. In Proceedings of the Clima—WellBeing Indoors, Helsinki, Finland, 10–14 June 2007. [Google Scholar]
  108. Washinosu, K.; Nobe, T.; Suzuki, I. Behavioral adjustment of Cool Chairs in Warm Offices. In Proceedings of the 7th Windsor Conference: The Changing Context of Comfort in an Unpredictable World, Windsor, UK, 12–15 April 2010. [Google Scholar]
  109. Brooks, J.E.; Parsons, K.C. An ergonomics investigation into human thermal comfort using an automobile seat heated with encapsulated carbonized fabric (ECF). Ergonomics 1999, 42, 661–673. [Google Scholar] [CrossRef] [PubMed]
  110. Zhang, Y.; Wyon, D.; Fang, L.; K Melikov, A. The influence of heated or cooled seats on the acceptable ambient temperature range. Ergonomics 2007, 50, 586–600. [Google Scholar] [CrossRef]
  111. Pasut, W.; Zhang, H.; Arens, E.; Kaam, S.; Yongchao, Z. Effect of a heated and cooled office chair on thermal comfort. HVAC&R Res. 2013, 19, 574–583. [Google Scholar] [CrossRef]
  112. Zhang, H.; Arens, E.; Taub, M.; Dickerhoff, D.; Bauman, F.; Fountain, M.; Pasut, W.; Fannon, D.; Zhai, Y.; Pigman, M. Using footwarmers in offices for thermal comfort and energy savings. Energy Build. 2015, 104, 233–243. [Google Scholar] [CrossRef] [Green Version]
  113. Foda, E.; Sirén, K. Design strategy for maximizing the energy-efficiency of a localized floor-heating system using a thermal manikin with human thermoregulatory control. Energy Build. 2012, 51, 111–121. [Google Scholar] [CrossRef]
  114. Melikov, A.; Langkilde, G.; Rasmussen, L.W. Human response to local heating for use in connection with low enthalpy ventilation. In Proceedings of the AIVC, Oslo, Norway, 28–30 September 1998. [Google Scholar]
  115. Knudsen, G.L.; Melikov, A.K. Human Response to an Individually Controlled Microenvironment. Indoor Air 2005, 421–425. [Google Scholar] [CrossRef]
  116. Pasut, W.; Zhang, H.; Arens, E.; Zhai, Y. Energy-efficient comfort with a heated/cooled chair: Results from human subject tests. Build. Environ. 2015, 84, 10–21. [Google Scholar] [CrossRef] [Green Version]
  117. Zhang, H.; Arens, E.; Kim, D.; Buchberger, E.; Bauman, F.; Huizenga, C. Comfort, perceived air quality, and work performance in a low-power task–ambient conditioning system. Build. Environ. 2010, 45, 29–39. [Google Scholar] [CrossRef] [Green Version]
  118. Arens, E.; Zhang, H.; Kim, D.; Buchberger, E.; Bauman, F.; Huizenga, C.; Higuchi, H. Impact of a taskambient ventilation system on perceived air quality. In Proceedings of the 11th International Conference on Indoor Air Quality and Climate (Indoor Air 2008), Copenhagen, Denmark, 17–22 August 2008. [Google Scholar]
  119. Faulkner, D.; Fisk, W.J.; Sullivan, D.P.; Wyon, D.P. Ventilation Efficiencies of Desk-Mounted Task/Ambient Conditioning Systems. Indoor Air 1999, 9, 273–281. [Google Scholar] [CrossRef] [PubMed]
  120. Lipczynska, A.; Kaczmarczyk, J.; Melikov, A.K. Thermal environment and air quality in office with personalized ventilation combined with chilled ceiling. Build. Environ. 2015, 92, 603–614. [Google Scholar] [CrossRef]
  121. Mirzai, S.; Ghaddar, N.; Ghali, K.; Keblawi, A. Design charts for sizing CC/DV system aided with personalized evaporative cooler to the desired thermal comfort. Energy Build. 2015, 86, 203–213. [Google Scholar] [CrossRef]
  122. Li, R.; Sekhar, S.C.; Melikov, A.K. Thermal comfort and IAQ assessment of under-floor air distribution system integrated with personalized ventilation in hot and humid climate. Build. Environ. 2010, 45, 1906–1913. [Google Scholar] [CrossRef]
  123. Kaczmarczyk, J.; Zeng, Q.; Melikov, A.; Fanger, P. The effect of a personalized ventilation system on perceived air quality and SBS symptoms. In Proceedings of the Indoor Air 2002, the 9th International Conference on Indoor Air Quality and Climate, Monterey, California, 30 June–5 July 2002. [Google Scholar]
  124. Kaczmarczyk, J.; Melikov, A.; Fanger, P.O. Human response to personalized ventilation and mixing ventilation. Indoor Air 2004, 14, 17–29. [Google Scholar] [CrossRef]
  125. Melikov, A.; Ivanova, T.; Stefanova, G. Seat headrest-incorporated personalized ventilation: Thermal comfort and inhaled air quality. Build. Environ. 2012, 47, 100–108. [Google Scholar] [CrossRef]
  126. Tsuzuki, K.; Arens, E.; Bauman, F.; Wyon, D. Individual Thermal Comfort Control with Desk-Mounted and Floor-Mounted Task/Ambient Conditioning (TAC) Systems. In Proceedings of the Indoor Air, Edinburgh, Scotland, UK, 8–13 August 1999; Volume 2. [Google Scholar]
  127. Verhaart, J.C.G.; Li, R.; Zeiler, W. Comfort of cooling by personal air movement. In Proceedings of the 14th International Conference on Indoor Air Quality and Climate, Ghent, Belgium, 3–8 July 2016. [Google Scholar]
  128. Kaczmarczyk, J.; Melikov, A.; Sliva, D. Effect of warm air supplied facially on occupants’ comfort. Build. Environ. 2010, 45, 848–855. [Google Scholar] [CrossRef]
  129. Faulkner, D.; Fisk, W.J.; Sullivan, D.P.; Lee, S.M. Ventilation Efficiencies of a Desk-Edge-Mounted Task Ventilation System; Technical Report; Lawrence Berkeley National Laboratory: Berkeley, CA, USA, 2002.
  130. Chen, Y.; Raphael, B.; Sekhar, C. Individual control of a personalized ventilation system integrated with an ambient mixing ventilation system. HVAC&R Res. 2012, 18, 1136–1152. [Google Scholar]
  131. Dalewski, M.; Veselý, M.; Melikov, A.K. Human response to ductless personalized ventilation coupled with displacement ventilation. In Proceedings of the 10th International Conference on Healthy Buildings, Brisbane, Australia, 8–12 July 2012; Volume 1. [Google Scholar]
  132. Dalewski, M.; Bivolarova, M.; Fillon, M.; Melikov, A. Human Response to Ductless Personalized Ventilation with Local Air Cleaning: Air Quality and Prevalence of SBS Symptoms. In Proceedings of the 11th REHVA World Congress and the 8th International Conference on Indoor Air Quality, Ventilation and Energy Conservation in Buildings, Prague, Czech Republic, 16–19 June 2013. [Google Scholar]
  133. Dalewski, M.; Melikov, A.K.; Vesely, M. Performance of ductless personalized ventilation in conjunction with displacement ventilation: Physical environment and human response. Build. Environ. 2014, 81, 354–364. [Google Scholar] [CrossRef]
  134. Halvoňová, B.; Melikov, A.K. Performance of “ductless” personalized ventilation in conjunction with displacement ventilation: Impact of intake height. Build. Environ. 2010, 45, 996–1005. [Google Scholar] [CrossRef]
  135. Amai, H.; ichi Tanabe, S.; Akimoto, T.; Genma, T. Thermal sensation and comfort with different task conditioning systems. Build. Environ. 2007, 42, 3955–3964. [Google Scholar] [CrossRef]
  136. Halvoňová, B.; Melikov, A.K. Performance of “ductless” personalized ventilation in conjunction with displacement ventilation: Impact of disturbances due to walking person(s). Build. Environ. 2010, 45, 427–436. [Google Scholar] [CrossRef]
  137. Liu, C.; Higuchi, H.; Arens, E.; Zhang, H. Study of a Personal Environmental Control System Using Opposing Airstreams. Indoor Air 2011. Available online: https://escholarship.org/uc/item/1jz8260r (accessed on 22 December 2018).
  138. Kalmár, F. An indoor environment evaluation by gender and age using an advanced personalized ventilation system. Build. Serv. Eng. Res. Technol.y 2017, 38, 505–521. [Google Scholar] [CrossRef] [Green Version]
  139. Kalmár, F.; Kalmár, T. Alternative personalized ventilation. Energy Build. 2013, 65, 37–44. [Google Scholar] [CrossRef]
  140. Bauman, F.S.; Arens, E.A.; Tanabe, S.; Zhang, H.; Baharlo, A. Testing and optimizing the performance of a floor-based task conditioning system. Energy Build. 1995, 22, 173–186. [Google Scholar] [CrossRef] [Green Version]
  141. Makhoul, A.; Ghali, K.; Ghaddar, N. Desk fans for the control of the convection flow around occupants using ceiling mounted personalized ventilation. Build. Environ. 2013, 59, 336–348. [Google Scholar] [CrossRef]
  142. Makhoul, A.; Ghali, K.; Ghaddar, N. Thermal comfort and energy performance of a low-mixing ceiling-mounted personalized ventilator system. Build. Environ. 2013, 60, 126–136. [Google Scholar] [CrossRef]
  143. Yang, B.; Melikov, A.; Sekhar, C. Performance evaluation of ceiling mounted personalized ventilation system. ASHRAE Trans. 2009, 115, 395–406. [Google Scholar]
  144. Clark, R.P.; Mullan, B.J.; Pugh, L.G. Skin temperature during running—A study using infra-red colour thermography. J. Physiol. 1977, 267, 53–62. [Google Scholar] [CrossRef] [PubMed]
  145. Nielsen, R.; Nielsen, B. Influence of skin temperature distribution on thermal sensation in a cool environment. Eur. J. Appl. Physiol. Occup. Physiol. 1984, 53, 225–230. [Google Scholar] [CrossRef] [PubMed]
  146. Ariyaratnam, S.; Rood, J. Measurement of facial skin temperature. J. Dentist. 1990, 18, 250–253. [Google Scholar] [CrossRef]
  147. Wang, D.; Zhang, H.; Arens, E.; Huizenga, C. Observations of upper-extremity skin temperature and corresponding overall-body thermal sensations and comfort. Build. Environ. 2007, 42, 3933–3943. [Google Scholar] [CrossRef] [Green Version]
  148. Ghahramani, A.; Castro, G.; Becerik-Gerber, B.; Yu, X. Infrared thermography of human face for monitoring thermoregulation performance and estimating personal thermal comfort. Build. Environ. 2016, 109, 1–11. [Google Scholar] [CrossRef] [Green Version]
  149. Tanabe, S.; Arens, E.A.; Bauman, F.; Zhang, H.; Madsen, T. Evaluating thermal environments by using a thermal manikin with controlled skin surface temperature. ASHRAE Trans. 1994, 100, 39–48. [Google Scholar]
  150. Webb, P. Temperatures of skin, subcutaneous tissue, muscle and core in resting men in cold, comfortable and hot conditions. Eur. J. Appl. Physiol. Occup. Physiol. 1992, 64, 471–476. [Google Scholar] [CrossRef]
  151. Vesely, M.; Zeiler, W.; Boxem, G.; Vissers, D.R. The human body as its own sensor for thermal comfort. In Proceedings of the International Conference on Cleantech for Smart Cities and Buildings, Lausanne, Switzerland, 4–6 September 2013; pp. 379–384. [Google Scholar]
  152. Vissers, D. The Human Body as Sensor for Thermal Comfort Control. Master’s Thesis, Eindhoven University of Technology, Eindhoven, The Netherlands, 2012. [Google Scholar]
  153. Metzmacher, H.; Wölki, D.; Schmidt, C.; Frisch, J.; van Treeck, C. Real-time human skin temperature analysis using thermal image recognition for thermal comfort assessment. Energy Build. 2018, 158, 1063–1078. [Google Scholar] [CrossRef]
  154. Wölki, D.; Metzmacher, H.; Schmidt, C.; Treeck, C. Thermal comfort-driven feedback control for electric vehicles based on thermal image recognition, passenger tracking and thermophysiological modelling. In Proceedings of the Windsor Conference—Rethinking Comfort, Vancouver, BC, Canada, 12–15 April 2018. [Google Scholar]
  155. Metzmacher, H.; Wölki, D.; Schmidt, C.; Frisch, J.; van Treeck, C. Energy-Efficient Climate Control in Electric Vehicles through Innovative Sensor Technology and Novel Methods for Thermal Comfort Evaluation. In Energy and Thermal Management, Air Conditioning, Waste Heat Recovery; Junior, C., Jänsch, D., Dingel, O., Eds.; Springer: Berlin, Germany, 2017; pp. 65–75. [Google Scholar]
  156. Wölki, D. MORPHEUS: Modelica-Based Implementation of a Numerical Human Model Involving Individual Human Aspects. Ph.D. Thesis, RWTH Aachen University, Aachen, Germany, 2017. [Google Scholar] [CrossRef]
  157. Ranjan, J.; Scott, J. ThermalSense: Determining Dynamic Thermal Comfort Preferences Using Thermographic Imaging. In Proceedings of the ACM International Joint Conference on Pervasive and Ubiquitous Computing, Heidelberg, Germany, 12–16 September 2016; pp. 1212–1222. [Google Scholar] [CrossRef]
  158. Zhang, Z. A flexible new technique for camera calibration. IEEE Trans. Pattern Anal. Mach. Intell. 2000, 22, 1330–1334. [Google Scholar] [CrossRef] [Green Version]
  159. Hartley, R.I. Theory and Practice of Projective Rectification. Int. J. Comput. Vis. 1999, 35, 115–127. [Google Scholar] [CrossRef]
  160. Hirschmuller, H. Stereo Processing by Semiglobal Matching and Mutual Information. IEEE Trans. Pattern Anal. Mach. Intell. 2008, 30, 328–341. [Google Scholar] [CrossRef] [PubMed] [Green Version]
  161. Smolyanskiy, N.; Huitema, C.; Liang, L.; Anderson, S.E. Real-time 3D face tracking based on active appearance model constrained by depth data. Image Vis. Comput. 2014, 32, 860–869. [Google Scholar] [CrossRef]
  162. P+Z Engineering. Theory Manual; P+Z Engineering: Munich, Germany, 2012. [Google Scholar]
  163. Nicol, F.; Humphreys, M.; Roaf, S. Adaptive Thermal Comfort: Principles and Practice; Routledge: London, UK, 2012; pp. 1–175. [Google Scholar]
  164. Hoyt, T.; Lee, K.; Zhang, H.; Arens, E.; Webster, T. Energy savings from extended air temperature setpoints and reductions in room air mixing. In Proceedings of the International Conference on Environmental Ergonomics, Ystad, Sweden, 22–26 May 2005. [Google Scholar]
  165. Hoyt, T.; Arens, E.; Zhang, H. Extending air temperature setpoints: Simulated energy savings and design considerations for new and retrofit buildings. Build. Environ. 2015, 88, 89–96. [Google Scholar] [CrossRef] [Green Version]
  166. Schiavon, S.; Melikov, A.K. Energy saving and improved comfort by increased air movement. Energy Build. 2008, 40, 1954–1960. [Google Scholar] [CrossRef]
  167. Yang, B.; Sekhar, C.; Melikov, A.K. Ceiling mounted personalized ventilation system in hot and humid climate—An energy analysis. Energy Build. 2010, 42, 2304–2308. [Google Scholar] [CrossRef]
  168. Pan, C.S.; Chiang, H.C.; Yen, M.C.; Wang, C.C. Thermal comfort and energy saving of a personalized PFCU air-conditioning system. Energy Build. 2005, 37, 443–449. [Google Scholar] [CrossRef]
  169. Bordass, B.; Bromley, K.; Leaman, A. User and Occupant Controls in Office Buildings. In Proceedings of the International Conference on Building Design, Technology and Occupant Well-Being in Temperate Climates, Brussels, Belgium, 17–19 February 1993. [Google Scholar]
  170. Shahzad, S.S.; Brennan, J.; Theodossopoulos, D.; Hughes, B.; Calautit, J.K. Energy Efficiency and User Comfort in the Workplace: Norwegian Cellular vs. British Open Plan Workplaces. Energy Procedia 2015, 75, 807–812. [Google Scholar] [CrossRef]
  171. Vesely, M.; Zhao, Y.; Vos, M.; Zeiler, W. Process control of personalized heating. In Proceedings of the Windsor Conference, Windsor Great Park, UK, 7–10 April 2016; pp. 1–9. [Google Scholar]
  172. Wölki, D.; van Treeck, C. Real-time monitor for the assessment of human thermal comfort based on PyFMI, Modelica and OpenGL. In Proceedings of the IAQVEC, 9th International Conference on Indoor Air Quality and Energy Conservation in Buildings, Seoul, Korea, 23–26 October 2016. [Google Scholar]
  173. Akimoto, T.; ichi Tanabe, S.; Yanai, T.; Sasaki, M. Thermal comfort and productivity - Evaluation of workplace environment in a task conditioned office. Build. Environ. 2010, 45, 45–50. [Google Scholar] [CrossRef]
  174. Zhang, Y.; Zhao, R. Effect of local exposure on human responses. Build. Environ. 2007, 42, 2737–2745. [Google Scholar] [CrossRef]
  175. Zhang, Y.; Zhao, R. Relationship between thermal sensation and comfort in non-uniform and dynamic environments. Build. Environ. 2009, 44, 1386–1391. [Google Scholar] [CrossRef]
  176. Kogawa, Y.; Nobe, T.; Onga, A. Practical Investigation of Cool Chair in Warm Offices. In Proceedings of the Clima—WellBeing Indoors, Helsinki, Finland, 10–14 June 2007. [Google Scholar]
  177. Ghaddar, N.; Ghali, K.; Chakroun, W. Evaporative cooler improves transient thermal comfort in chilled ceiling displacement ventilation conditioned space. Energy Build. 2013, 61, 51–60. [Google Scholar] [CrossRef]
  178. Melikov, A.; Kaczmarczyk, J.; Sliva, D. Impact of air movement on perceived air quality at different level of relative humidity. In Proceedings of the 11th International Conference on Indoor Air Quality and Climate (Indoor Air 2008), Copenhagen, Denmark, 17–22 August 2008. [Google Scholar]
Figure 1. Face and pose tracking; left: depth image of face, right: thermal image of body and face, redrawn from [15,153,154,155].
Applsci 09 00035 g001
Figure 2. Schematic of the numerical human model MORPHEUS, which consists of an Ambient model, an Active System (AS) and a Passive System (PS) component [156].
Applsci 09 00035 g002
Figure 3. Schematic of the experimental setup [154].
Applsci 09 00035 g003
Figure 4. Percentage of dissatisfied individuals with respect to indoor temperature; each depicted point corresponds to a single study extracted from the literature.
Applsci 09 00035 g004

