Article

Early Therapeutic Prediction Based on Tumor Hemodynamic Response Imaging: Clinical Studies in Breast Cancer with Time-Resolved Diffuse Optical Spectroscopy

Department of Breast Oncology, Saitama Medical University International Medical Center, 1397-1 Yamane, Hidaka, Saitama 350-1298, Japan
*
Author to whom correspondence should be addressed.
Appl. Sci. 2019, 9(1), 3; https://doi.org/10.3390/app9010003
Submission received: 22 October 2018 / Revised: 27 November 2018 / Accepted: 12 December 2018 / Published: 20 December 2018
(This article belongs to the Special Issue New Horizons in Time-Domain Diffuse Optical Spectroscopy and Imaging)

Abstract

:
This study reports data from three clinical studies using the time-resolved diffuse optical spectroscopy (TRS) system among breast cancer patients. The parameters of oxy-hemoglobin (O2Hb), deoxy-hemoglobin (HHb), total hemoglobin (tHb), and oxygen saturation (SO2) were evaluated using TRS, and its efficacy was tested in three trials. In trial 1, we recruited 118 patients with primary breast cancer to estimate the tumor detection rate. The cumulative detection rate was 62.7%, while that in T stage 0 was 31.3% and in T stage 1 was 44.7%. These were lower than those of T stage 2 (78.9%) and T stage 3 (100%). Next, we used TRS to monitor tumor hemodynamic response to neoadjuvant chemotherapy (n = 100) and found that pathological complete response (pCR) tumors had significantly lower tumor tHb than non-pCR tumors; a similar result was observed in estrogen receptor (ER)-negative tumors, but not in ER-positive tumors. The third trial monitored hemodynamic response to antiangiogenic therapy, bevacizumab (n = 28), and we demonstrated that sequential optical measurement of tumor SO2 might be useful for detecting acute hypoxia 1–3 days after bevacizumab initiation. Next, response monitoring of neoadjuvant endocrine therapy (n = 30) suggested that changes in tumor tHb during treatment can predict and distinguish between responsive and non-responsive tumors early in letrozole therapy. In conclusion, our results show that hemodynamic monitoring of tumors by TRS could pair the unique features of tumor physiology to drug therapy and contribute to patient-tailored medicine. We recently established a platform for performing TRS in patients with breast cancer.

1. Introduction

Breast cancer is one of the most common causes of death worldwide. Screening and recent advances in adjuvant therapy for primary breast cancer have reduced its mortality rate by approximately 10–16% in Japan [1]. As data suggest that one in fourteen Japanese women will develop breast cancer in their lifetimes, screening, diagnosis, and adjuvant therapy are essential strategies. X-ray mammography is the current gold standard screening modality, and ultrasonography is considered an adjunct therapy to mammography in premenopausal women [2]. Diffuse optical spectroscopic imaging (DOSI) is an emerging modality with potential applications in oncology. DOSI uses near-infrared light, in the 600–1000 nm wavelength range, to measure the concentrations of oxy-hemoglobin (O2Hb), deoxy-hemoglobin (HHb), water (water), lipid (lipid), and oxygen saturation (SO2) in breast tissue [3]. DOSI is a non-invasive, non-ionizing, cost-effective modality that also provides functional quantification of tumor angiogenesis, hypoxia, edema, and adipose tissue [4,5,6]. However, DOSI in breast cancer surveillance is not expected to provide precise anatomical information, but only to contribute towards providing evidence of tumor physiological activity. This makes DOSI an adjunct tool to conventional modalities for the early detection of breast cancer.
Neoadjuvant chemotherapy (NAC) before surgery is the standard procedure for patients with advanced breast cancer [7]. Clinical studies have shown that disease-free survival after NAC is equal to that after adjuvant chemotherapy, and the advantage of NAC is that a greater number of patients undergo breast-conserving surgery after tumor shrinkage. Patients with pathological complete response (pCR) after NAC experience longer survival compared to those with non-pCR, and prediction of pCR before NAC or early during chemotherapy can improve patient outcomes [8]. Additionally, as more effective therapies in patients with low response to chemotherapy are needed, functional imaging technologies such as positron emission tomography (PET) and magnetic resonance imaging (MRI) play a definite role in determining whether to continue, change, or abandon treatment [9]. DOSI has substantial advantages during longitudinal monitoring as it captures physiological changes in breast tumors, especially in the vasculature and the microenvironment.
Many optical imaging methods for diagnosis and treatment monitoring have been reported [10,11,12,13], and we have established a two-dimensional optical imaging system with time-resolved spectroscopy (TRS) for breast cancer surveillance, as previously reported [14]. TRS is a technique that measures the time of flight, in addition to the light intensity, at the boundary of a medium. This method uses a short light pulse as a light source, and measures the time point spread function of the light passing through the tissue. Although TRS has the disadvantages of being complicated, expensive and having a long measuring time, the short pulsed light used in the time domain contains all the frequency components, and the measurement is stabilized compared to the measurement using the limited frequency component of the frequency domain. In this report, we present findings obtained from three clinical studies and discuss the usefulness and limitations of TRS in breast cancer treatment.

2. Materials and Methods

2.1. Patients, Settings, and Study Design

We conducted three clinical studies in breast cancer patients between July 2012 and March 2018 using the TRS system, and recruited 436 patients for all three studies. Using this system, we acquired 1474 measurements from these subjects. All three were prospective clinical studies: (1) clinical study of in vivo optical imaging of breast cancer using diffuse optical spectroscopy (UMIN000011888); (2) value of usefulness of diffuse optical spectroscopic imaging for monitoring the efficacy of bevacizumab followed by paclitaxel in breast cancer patients (UMIN000015837); (3) early prediction of tumor response using imaging and molecular biomarkers of hormone sensitive breast cancer in a neoadjuvant hormonal therapy setting (UMIN000013815), and were registered at the UMIN Clinical trials registry.

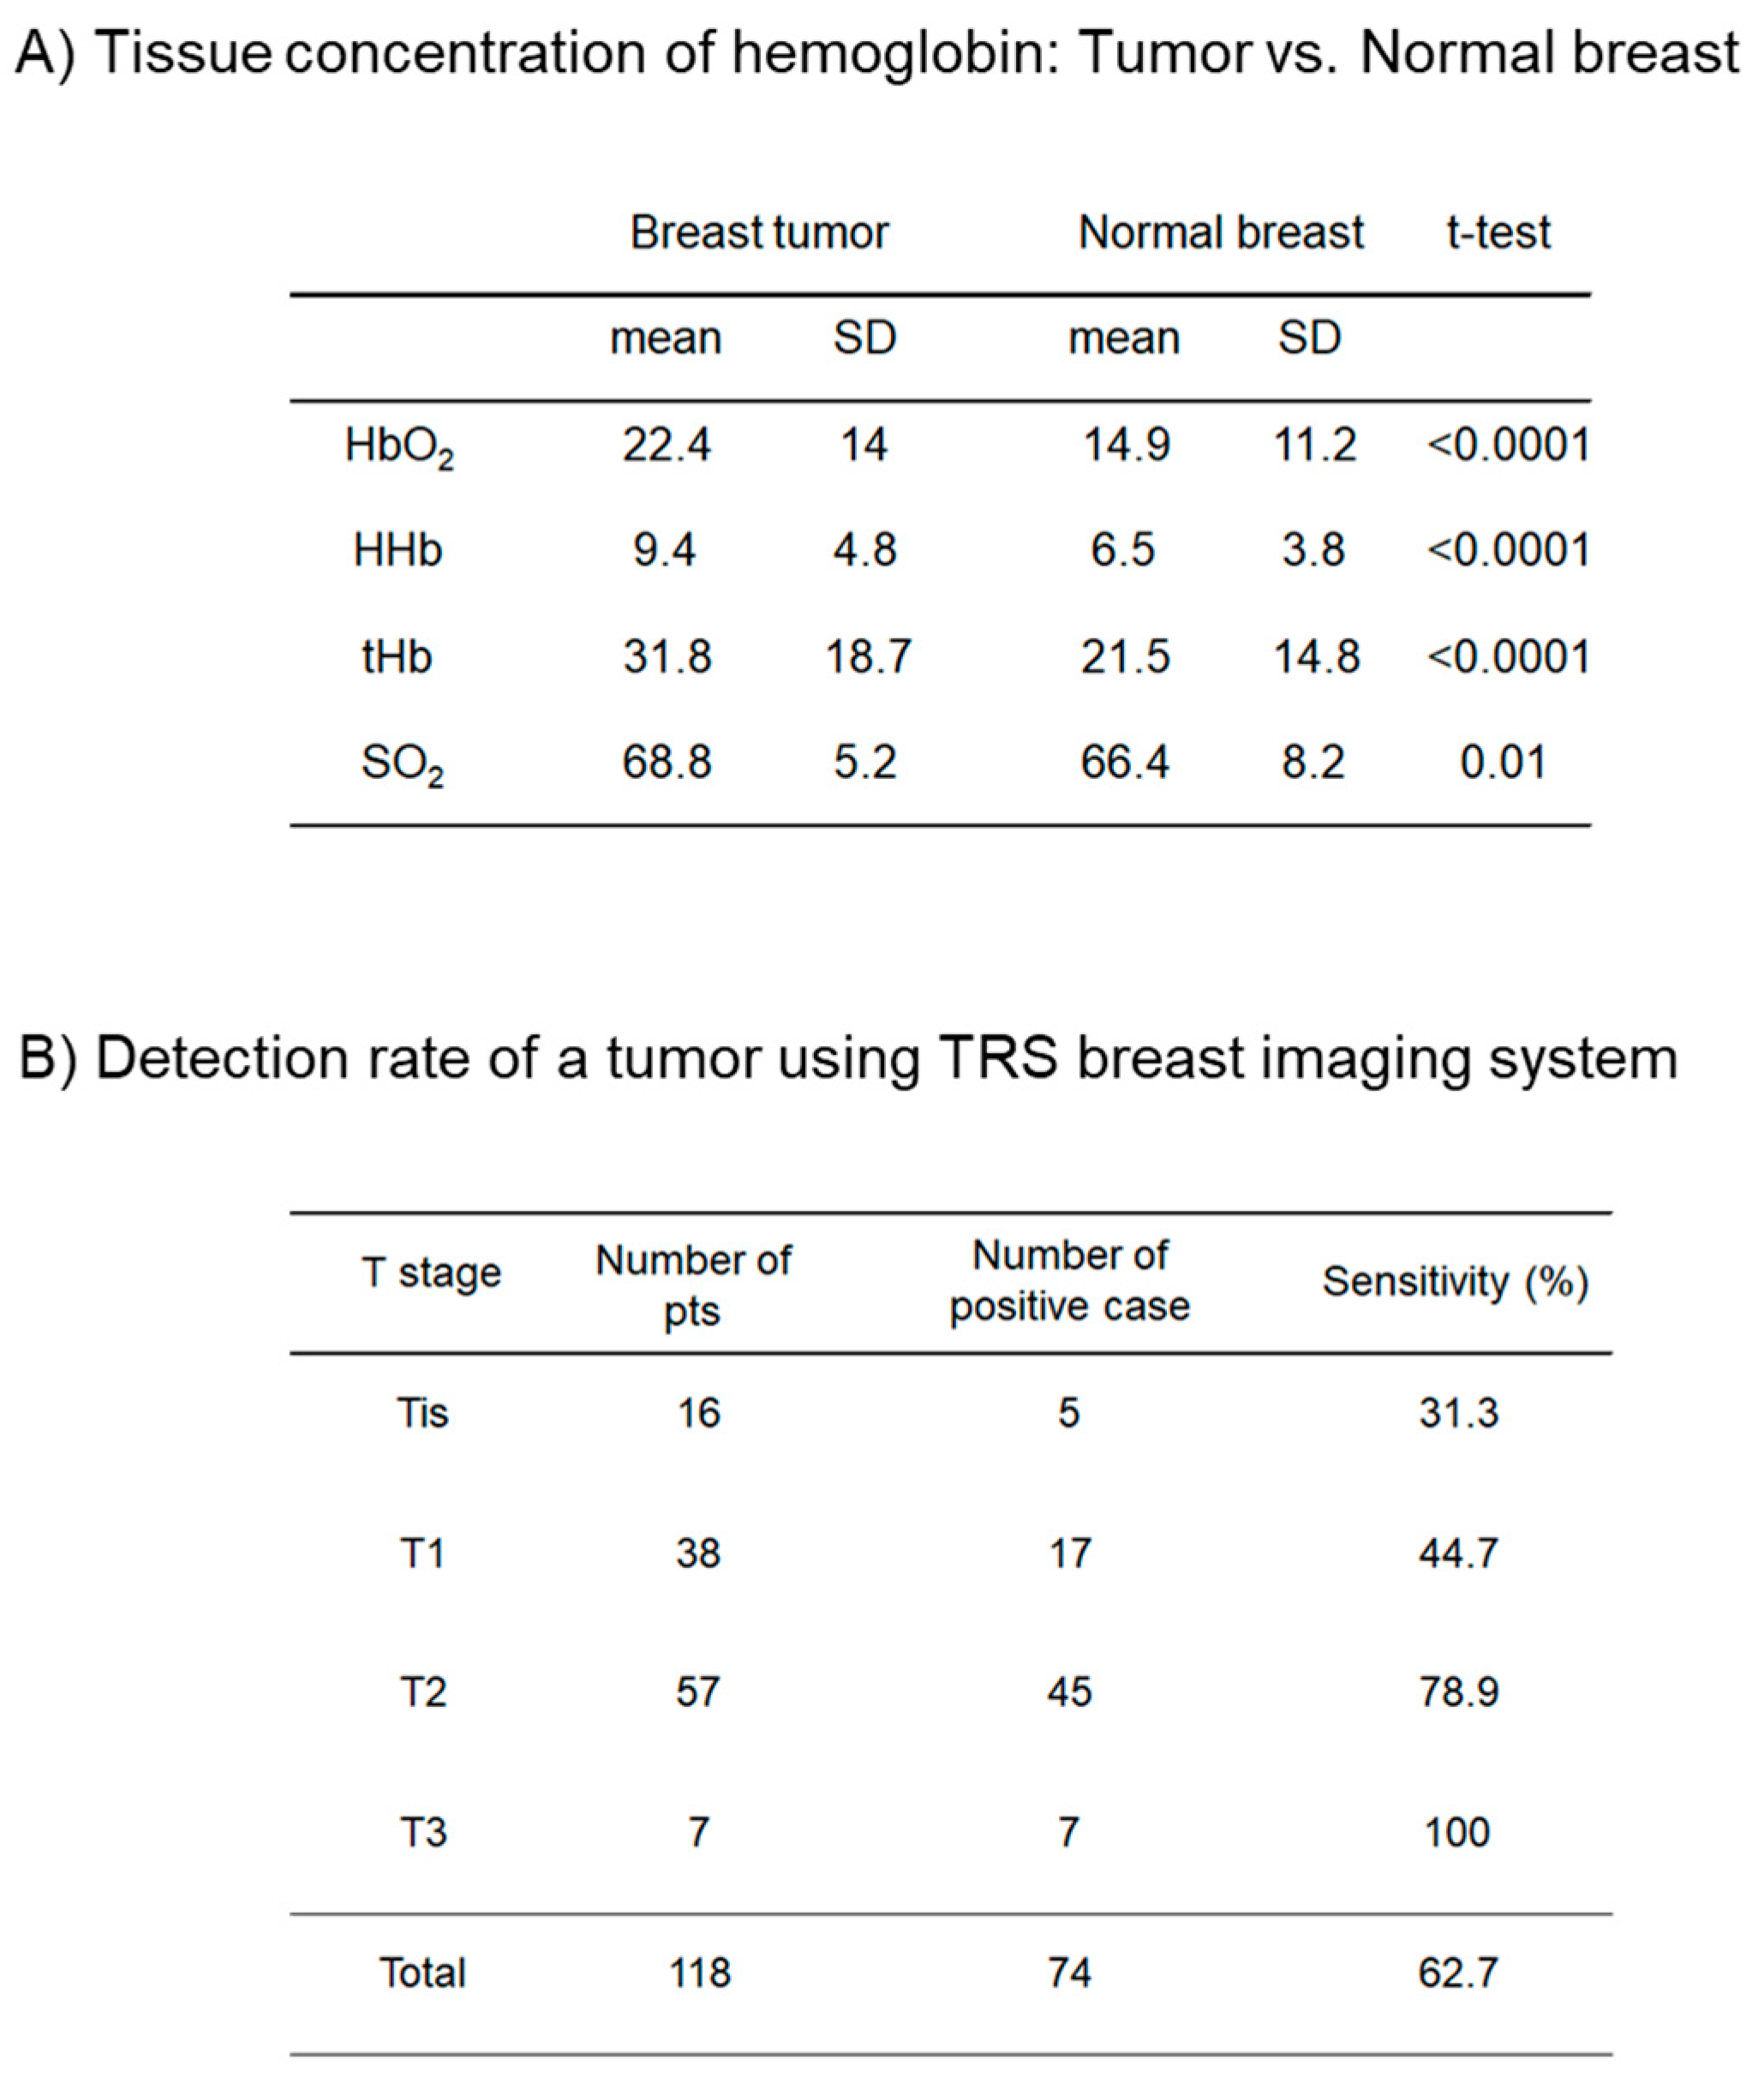
2.2. Establishment of the TRS Breast Imaging System

A dual-channel three-wavelength time-resolved spectroscopy system (TRS-20, Hamamatsu Photonics K.K., Hamamatsu, Japan) was used to measure optical breast tissue parameters. The TRS-20 consists of two pulsed light sources, photomultiplier tubes (GaAs PMT, Hamamatsu Photonics K.K., Hamamatsu, Japan), a single photon counting (SPC) unit, and optical fibers. Each pulsed light source, called Picosecond Light Pulses (PLPs, Hamamatsu Photonics K.K., Hamamatsu, Japan), is composed of three laser diodes (760 nm, 800 nm, and 834 nm) which generate a light pulse with full-width at half-maximum (FWHM) of 70–100 ps at repetition frequency of 5 MHz, and has an average output power at the irradiation optical fiber end of ~100 μW. The SPC unit (custom-designed, Hamamatsu Photonics K.K., Hamamatsu, Japan), based on the time-correlated single-photon counting method (TCSPC) for measuring the temporal point spread functions (TPSFs) of tissue, is composed of a constant fraction discriminator (CFD), a time-to-amplitude converter (TAC), an analog-to-digital (A/D) converter, and a histogram memory. The irradiation fiber is a single fiber with a numerical aperture (NA) of 0.25 (GC.200/250L, FUJIKURA, Tokyo, Japan), and a fiber bundle 3 mm in diameter with NA of 0.29 (Sumita Opcical Glass, Inc., Saitama, Japan) is applied to the optical detection fiber. To estimate the absorption and reduced scattering coefficients, TPSF is first derived from analytical solution of the diffusion equation, on the assumption that the breast is a semi-infinite homogeneous medium. Then, the TPSF, which is convoluted with the instrumental response function, is fitted to the observed temporal profile. In the fitting procedure, the non-linear least-squares method is used [15,16]. Oxy- and deoxy-hemoglobin concentrations are determined using an expression in which the absorption coefficient consists of a linear combination of the extinction coefficients and concentrations of hemoglobin. The TRS imaging system is shown in Figure 1.

2.3. Procedure of TRS Measurements

All patients were histologically diagnosed with mammary carcinoma from a core biopsy sample before optical measurement. The average optical measurement time for each patient was about 20 min. A handheld TRS probe with a 2.8 cm source-detection distance was used to measure absorption and scattering of the breasts with patients in the supine position. After ultrasonography (US)-based tumor detection, an optical probe was placed on the skin surface corresponding to tumor location and its surrounding breast tissues, and point sensing was initiated. The grid maps of the tissue with the tumors comprised 7 × 7 points with a 10-mm interval between two points in the xy dimension, resulting in a minimum of 49 measurement points in each map [14]. Acquisitions were made such that the tumor was located at the center of the grid map. A lesion region of interest (ROI) was used for 2D image reconstruction for Hb distribution. In the contralateral, normal breast, a grid map with 5 × 5 points was obtained and used as a mirror image. The average concentration of Hb and percentage of SO2 were recorded as representative parameters.

2.4. Monitoring Tumor Response to Neoadjuvant Chemotherapy

Functional imaging can predict tumor response to chemotherapy. Further, as changes in tumor metabolism precede tumor shrinkage, fluorodeoxyglucose-positron emission tomography (FDG-PET) imaging and dynamic-enhanced MRI are widely accepted as noninvasive modalities for monitoring tumor response during NAC [17,18]. However, these modalities are expensive, and their cost precludes integration into routine clinical practice. Many clinical studies have reported that DOSI has great potential for early assessment of tumor hemoglobin response to NAC, which serves as a predictor of pathological outcome [19,20,21]. Therefore, between September 2013 and February 2015, we prospectively enrolled 100 patients who were eligible for NAC at two centers (Saitama Medical University International Medical Center and Hamamatsu University Medical School) [22]; of these, 84 patients completed the full course of NAC and underwent definitive surgery (Figure 2A). The average tumor size was 37.5 mm (SD, 16.8 mm). Hormonal receptor-positive breast cancer was present in 47 patients (55.9%), and HER2-positive breast cancer was present in 19 patients (21.4%). The pathological outcome after surgery was determined to be pCR in 16 (19%) and non-pCR in 68 (81%) patients, where pCR was defined as the absence of invasive cancer cells in the breast irrespective of axillary status (ypT0/is). The chemotherapy regimen varied among patients and was at the treating physician’s discretion; however, the majority (70.2%, n = 59) received anthracycline- and taxane-based regimens, 17.9% (n = 15) received carboplatin- and docetaxel-based regimens, and 11.9% (n = 10) of the patients were administered bevacizumab- and paclitaxel-based regimens. All patients with HER2-positive breast cancer received chemotherapy combined with trastuzumab. TRS measurement was performed before initiation of chemotherapy (at day 2 to day 1 before initial infusion of the drug), and at day 2 to day 1 before the second or third infusion. The ROI of the tumor, corresponding to peak tumor tHb, was monitored during the early courses of NAC, and percentage change in average tHb between the baseline and after chemotherapy was calculated using the formula: (interim tHb – baseline tHb)/baseline tHb × 100 (%).

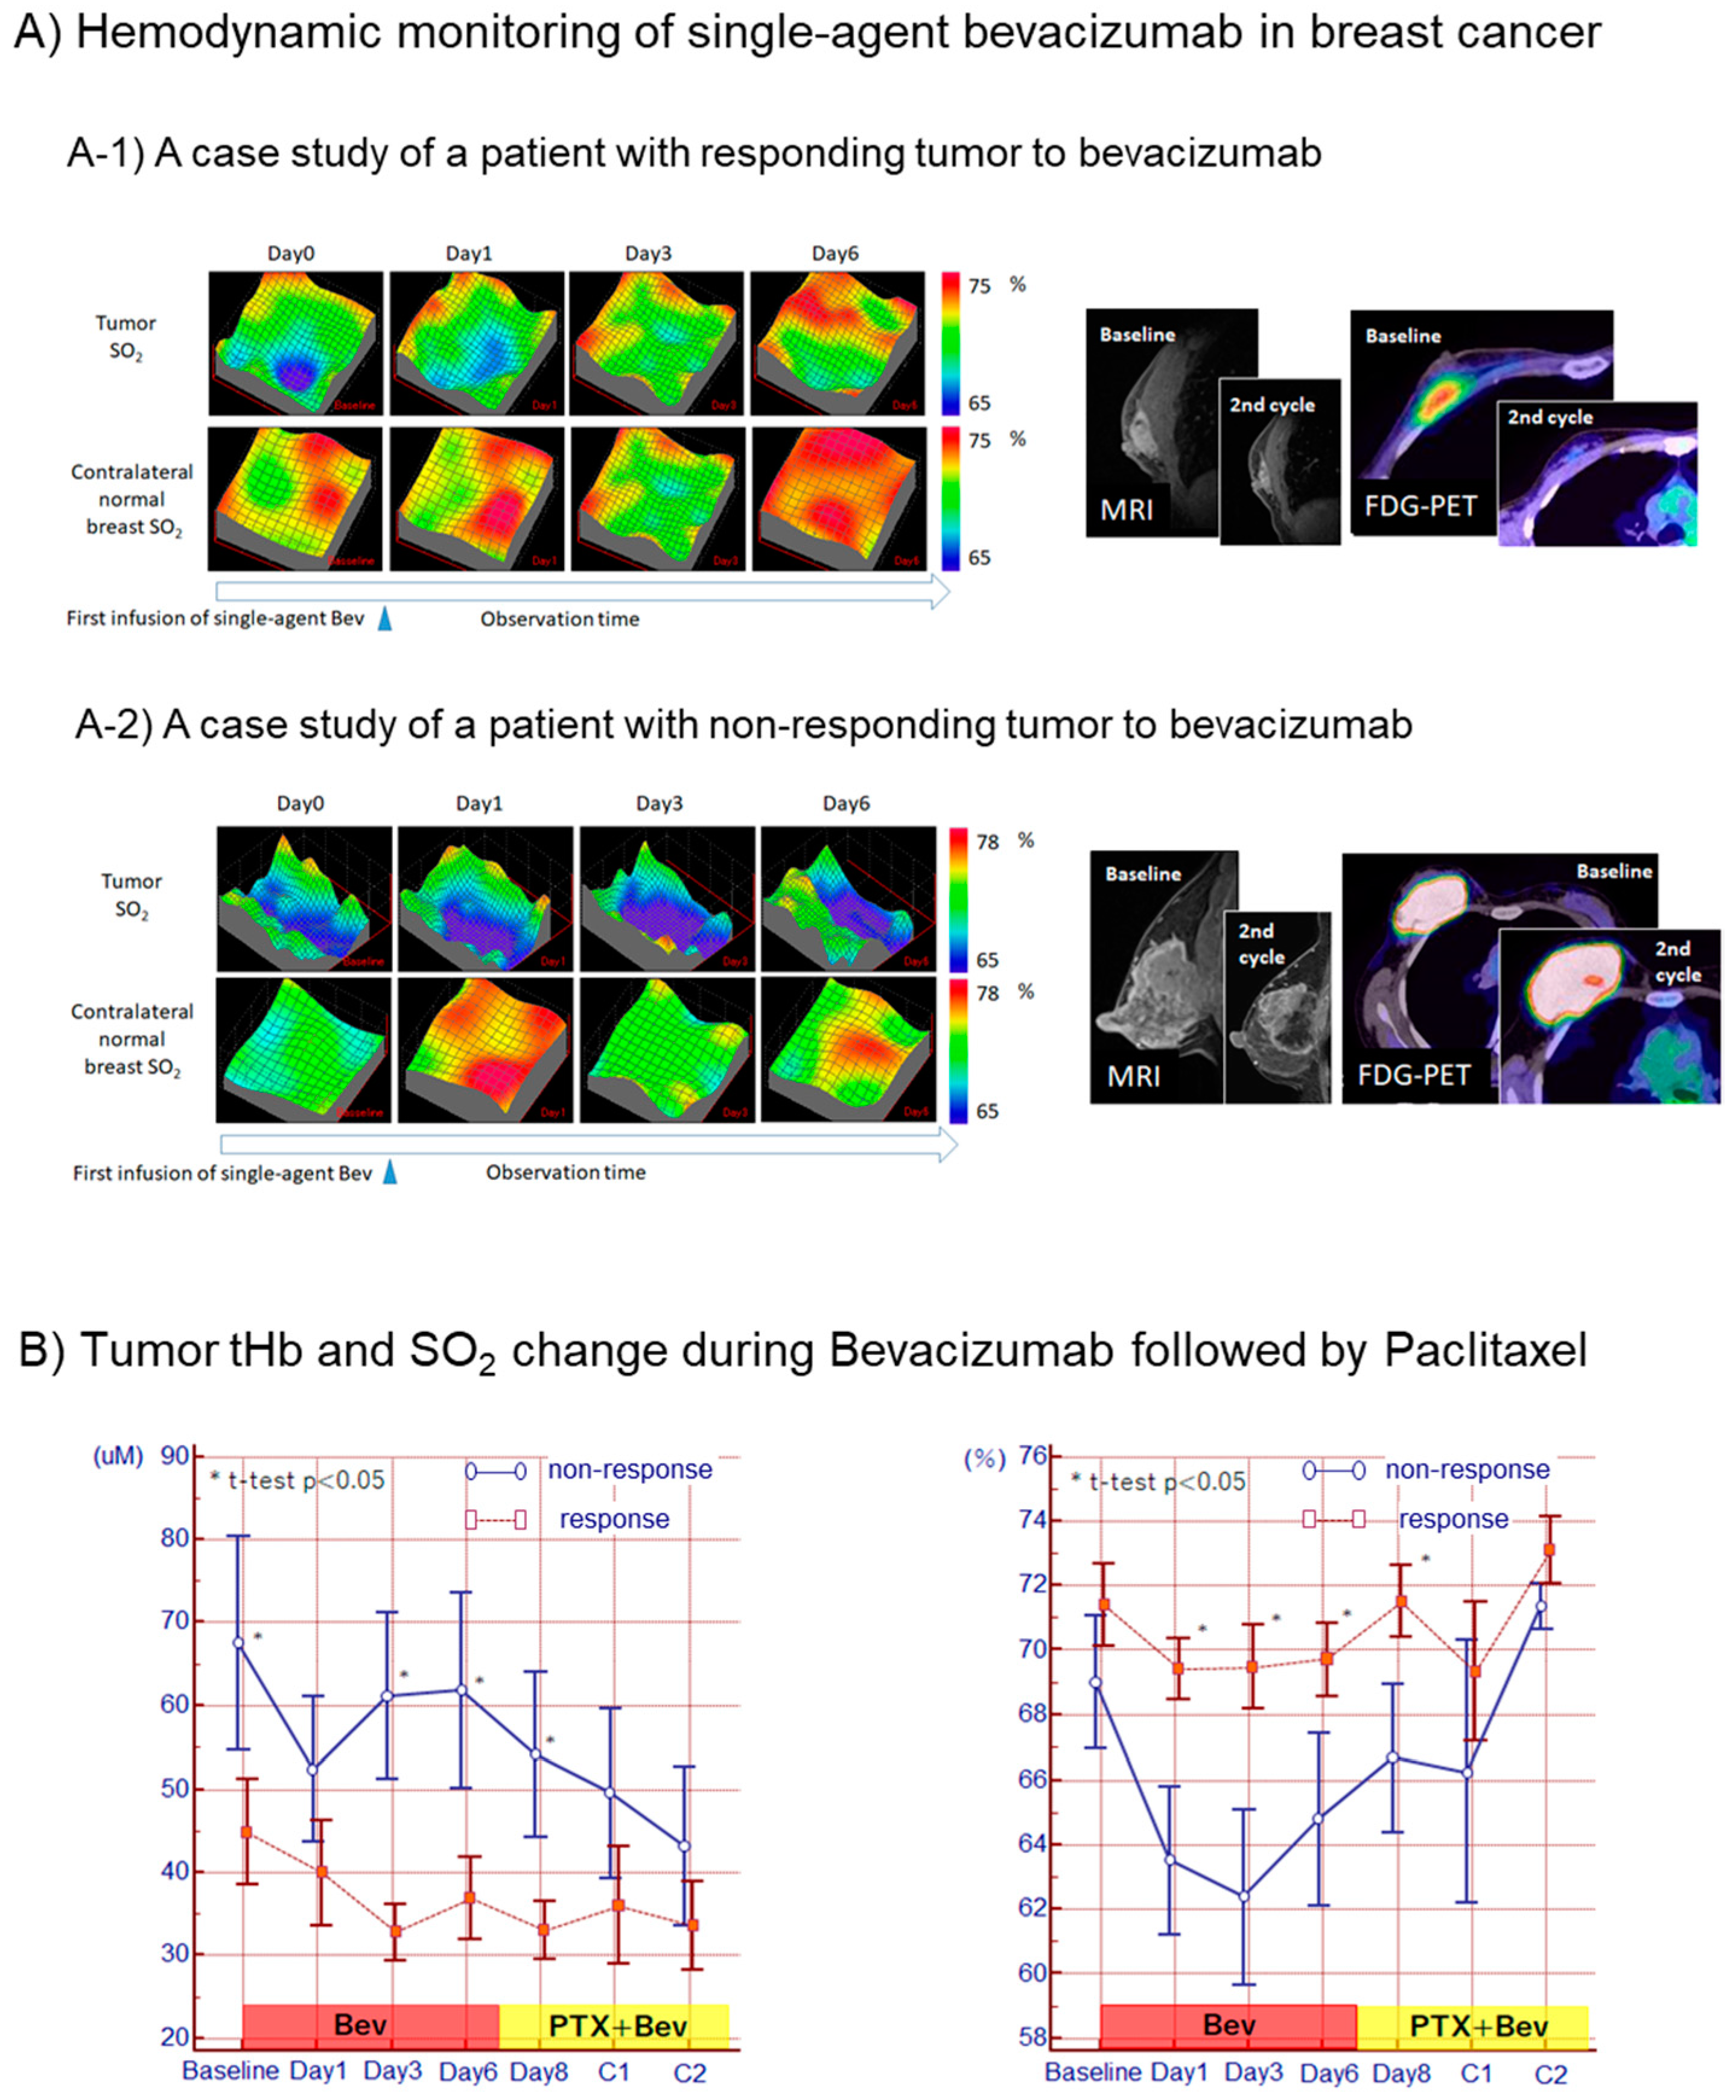
2.5. Optical Visualization of Cancer Vascular Remodeling after Antiangiogenic Therapy

Angiogenesis is a key driver of growth and metastatic cancer spread [23]. However, the anti-angiogenic concept of cancer therapy posits that anti-angiogenic drugs should restore oxygenation in the presence of proper vascular remodeling [24]. Visualization of vascular remodeling and oxygenation is, therefore, an intriguing approach for exploring normalization in the cancer microenvironment after initiation of antiangiogenic drugs [25]. TRS can be a powerful tool to monitor vascular remodeling, since visualization of breast cancer hemodynamics can help elucidate the mechanisms underlying changes in vascularity and tissue oxygenation [26]. Bevacizumab, an antibody against endothelial growth factor, is well-known as a key drug in patients with advanced and/or metastatic breast cancer [27,28]. Thus, we conducted a clinical study in 28 patients with advanced stage 3/4 breast cancer using the standard regimen of bevacizumab (10 mg/kg body weight), administered intravenously on days 0 and 14, in combination with paclitaxel (90 mg/m2 body surface area), administered on days 0, 7, and 14 in every cycle (Figure 2B) [29]. To evaluate the physiological effect of bevacizumab alone, paclitaxel was omitted on the first day of the first cycle. Patients continued the regimen for six cycles unless disease progression or unacceptable toxicity precluded chemotherapy continuation. Patients underwent serial FDG-PET/CT scans at baseline and after two cycles of chemotherapy. Then, the change in tumor maximal standard uptake value (SUVmax) was evaluated. The tumor metabolic response was classified based on the change in SUVmax, with a cutoff value of −20% used to categorize patients as either responders (change in SUVmax > 20%; n = 18) or non-responders (change in SUVmax < 20%; n = 10). Patients also underwent repeat TRS measurements every day during single-agent bevacizumab, and we observed changes in Hb and SO2 in the tumor at baseline, and on days 1, 3, 6, 8, and 13. For the clinical study, we hypothesized that if vascular normalization occurs after successful remodeling, tumor tHb should decrease with a simultaneous increase in SO2 levels.

2.6. Monitoring Tumor Response to Neoadjuvant Endocrine Therapy

Although neoadjuvant endocrine therapy is not the standard treatment for breast cancer, it has been widely used among postmenopausal women with hormone receptor (HR)-positive breast cancer, because neoadjuvant endocrine therapy has reportedly contributed to tumor shrinkage in 30–75% of the patients and because it can increase the conversion rate from mastectomy to breast-conserving surgery [30,31,32]. Therefore, early identification of responding and non-responding tumors allows patients with resistant tumors to receive alternative treatments such as surgery, molecular-targeting agents, or chemotherapy.
We have previously assessed whether the early PET response, evaluated by FDG PET/CT, could predict morphological and pathological responses to neoadjuvant endocrine therapy in patients with hormone receptor-positive breast cancer [33]. The pilot study enrolled 12 patients who received a daily dose of 2.5 mg of letrozole for 12 weeks, followed by surgery. When serial FDG-PET scans were acquired at baseline and after 4 weeks of letrozole therapy, metabolic responders showed a 40% or greater reduction in FDG uptake, as evidenced by SUVmax changes, and a significant decrease in the Ki67 proliferative index; these were not observed in non-responders. A large randomized clinical trial (Intermediate Marker Project: anastrozole, combination or tamoxifen; IMPACT) also reported that a low Ki67 index following endocrine therapy was significantly correlated with relapse-free survival among patients after surgery [31]. Similarly, our findings reveal that an FDG-PET/CT-guided therapeutic strategy could be promising during neoadjuvant endocrine therapy [33]. Recently, we conducted a feasibility study using TRS to monitor hemodynamic response during neoadjuvant endocrine therapy (Figure 2C). We enrolled 30 patients with HR-positive primary breast cancer, and categorized PET responders (n = 20) and PET non-responders (n = 8) based on a 25% reduction in tumor SUVmax between serial scans of FDG-PET/CT, obtained before therapy and at 3 months after initiation letrozole therapy.

3. Results

In the initial study, we recruited 118 patients with an established histological diagnosis of breast carcinoma, and TRS-based values such as HbO2, HHb, tHb, and SO2 of breast tumors were found to be significantly higher than those of the contralateral normal tissue (Figure 3A) [34]. There were no significant differences in average rtHb levels among the various histological types such as ductal carcinoma in situ, invasive ductal carcinoma, invasive lobular carcinoma, or mucinous carcinoma. On the other hand, higher tumor rtHb was significantly and positively correlated with tumor size, nuclear grade, and lymphatic vascular invasion. The overall detection rate for breast tumors using TRS was 62.7%, while its sensitivity according to tumors stratified by T stage was: T0, 31.3%; T1, 44.7%; T2, 78.9%; and T3, 100% (Figure 3B). These results imply that our approach using TRS is not suitable for early detection of breast cancer; however, Hb parameters measured by TRS may be useful for assessing tumor aggressiveness.
Regarding neoadjuvant chemotherapy, we found that pCR tumors showed a significantly greater reduction in percentage tHb change after the first course of chemotherapy compared to non-pCR tumors (average, −23.4% ± 4.3 SE vs. −14.1% ± 1.7 SE; p = 0.02), which increased after the second course of chemotherapy (average, −33.9% ± 3.8 SE vs. −20.2% ± 1.7 SE; p = 0.001, Figure 4A-1,A-2). Receiver-operating-characteristic (ROC) curve analysis yielded an Area under the curve (AUC) of 0.69 for the first chemotherapy infusion, and of 0.75 for the second chemotherapy infusion. Thus, we considered that tHb measurement alone may be insufficient for monitoring tumor response to NAC and for precisely predicting histological outcome, as many neoadjuvant studies using FDG-PET/CT have reported a diagnostic performance of 75–90% when serial scans of FDG-PET/CT were administered at baseline and during the initial stages of 1–3 courses of chemotherapy. Next, patients were categorized into a hormonal-receptor-dependent sub-group and a hormonal-independent sub-group based on ER status. A total of 47 patients had ER-positive breast cancer, including eight patients with pCR (Figure 4B-1), while 36 patients had ER-negative breast cancer, including seven patients with pCR (Figure 4B-2). When ER-positive tumors and ER-negative tumors were separately evaluated, the ROC curve analysis yielded AUC values of 0.6 (0.15 SE) and 0.5 (0.13 SE) for ER-positive breast cancer, and 0.81 (0.08 SE) and 0.82 (0.07 SE) for ER-negative breast cancer after the first and the second courses of chemotherapy, respectively. When stratified by intrinsic subtypes, 40 patients had luminal breast cancer, including three with pCR (Figure 4C-1). Importantly, tHb in pCR tumors did not decrease after the first chemotherapy infusion, and showed no difference after the second infusion compared to non-pCR. Among 27 patients with triple-negative breast cancer (TNBC), three patients had pCR. The decrease in tHb in pCR tumors was higher compared to that of non-pCR tumors (Figure 4C-2), and among 19 HER2-positive patients, nine achieved pCR (Figure 4C-3). Thus, it appears that pCR tumors show a trend of greater reduction in tHb than non-pCR tumors, but these differences were smaller than those seen in TNBC patients.
Regarding antiangiogenic therapy, non-responders to bevacizumab, determined based on FDG-PET/CT, showed both lower tumor shrinkage (mean ± SE; −11.9 ± 10.5%) than responders (−38.7 ± 8.8%; p = 0.07) and poorer survival than the responders (p = 0.1, Kaplan–Meier method, data not shown). Representative case studies of a patient with a tumor responsive to bevacizumab and a patient with a non-responsive tumor to bevacizumab are shown in Figure 5A-1,A-2. Non-responders also showed markedly lower tumor SO2 immediately after bevacizumab infusion compared to responders, and the SO2 level in non-responders was significantly lower than that of the responders from days 1 to 3 (Figure 5B). Tumor Hb (tHb) of non-responders transiently decreased on day 1 after bevacizumab infusion, but recovered to baseline between days 3 and 6. In contrast, tHb among responders showed a sustained decrease during the observation period. Specifically, tHb levels on days 3 and 6 were significantly higher in non-responders compared to responders. The findings imply that tumors that are non-responsive to bevacizumab display acute hypoxia and further angiogenesis after drug infusion.
Regarding neoadjuvant endocrine therapy, PET non-responders represented PD (n = 0), SD (n = 1), PR (n = 18), and CR (n = 1), while PET non-responders represented PD (n = 2), SD (n = 3), PR (n = 2), and CR (n = 0). There were significant differences between the two responder groups regarding clinical response (p = 0.003, data not shown). Although PET responders and non-responders did not differ regarding invasive size at post-surgical histological evaluation, the Ki67 proliferative index among PET responders was significantly lower than that of non-responders. TRS was performed before and after 2 weeks, 1 month, 2 months, and 3 months of letrozole therapy initiation. Representative case studies of a patient with PET response and a patient with PET non-response are shown in Figure 6A-1,A-2. Among some patients with PET-responsive tumors, peak tHb disappeared immediately after letrozole therapy initiation, while tHb values increased in some patients with non-responsive tumors despite continued letrozole therapy. The decline in tHb value at 1 and 3 months after letrozole therapy among PET responders was significantly larger than that seen among PET non-responders (p = 0.01) (Figure 6B). Our findings reveal a close relationship between glycolysis and the hemodynamics of malignant tumors, implying that hemodynamic response monitoring using TRS is a feasible approach even in patients who receive endocrine therapy.

4. Discussion

Our initial clinical studies conveyed important information on breast cancer imaging using TRS. The first was that the TRS imaging system is not useful for screening during early breast cancer as the overall detection rate of 62.7% is unacceptably low, with even lower rates for T stages 0 and 1. Nonetheless, it was useful for monitoring neoadjuvant therapy in patients with advanced breast cancer, because detection rates were acceptable among patients with T-stages 2 and 3 tumors. During neoadjuvant chemotherapy monitoring, pCR tumors showed a significantly greater decrease in tHb compared to non-pCR tumors. However, when we compared the diagnostic performance of TRS to FDG-PET/CT for predicting pCR during neoadjuvant chemotherapy, DOSI showed a lower diagnostic performance than FDG-PET/CT. Interestingly, we found that the responsiveness of ER-positive tumors and ER-negative tumors was different in patients who received cytotoxic chemotherapy. Specifically, in patients with ER-negative tumors, TNBC was an excellent predictor of pCR based on the AUC; however, it was completely unacceptable among patients with ER-positive tumors. These findings imply that tumor hemodynamics depend on breast cancer’s hormonal status. Since ER-negative tumors are characterized by higher metabolic and angiogenic activities, chemotherapy monitoring using TRS could be useful in patients with ER-negative tumors, especially among TNBC patients. Thus, attention to differential response of tHb stratified by breast cancer subtypes may be essential.
TRS is feasible among patients with HR-positive tumors who receive endocrine therapy. Further, while letrozole therapy (neoadjuvant endocrine therapy using aromatase inhibitor) can distinguish between metabolic responders and non-responders based on serial FDG-PET, metabolic responders had significantly lower tHb than non-responders.
A recent clinical trial (JFMC34-0601) among 107 patients treated with 25 mg/day exemestane for 16 weeks, followed by a further 8 weeks depending on the clinical response, reported that eight patients with progressive disease had markedly poorer disease-free survival and overall survival compared to patients with partial response or stable disease [34].
The discrepancy in clinical results between cytotoxic chemotherapy and endocrine therapy indicates that hemodynamic response is dependent on drug pharmacology. In our trial using the antiangiogenic drug bevacizumab, tumor SO2 among non-responders, but not responders, decreased dramatically after bevacizumab administration. Thus, TRS could be useful for monitoring the dynamics of the hypoxic tumor microenvironment in breast tissue. These observations may help explain the negative impact of bevacizumab, wherein the drug fails to promote vascular remodeling and destroys the tumor microenvironment in some patients. In fact, published data demonstrate that circulating angiogenic biomarker levels, such as vascular endothelial growth factor (VEGF), basic fibroblast growth factor (FGF), and Transforming Growth Factor Beta (TGFβ), markedly increase on days 3 and 4 after infusion of bevacizumab in non-responders, but not in responders [30]. Thus, our TRS study with bevacizumab has provided physiological insight into drug-induced hypoxia and cancer progression, and may be useful for in vivo biomarker imaging in the future for assessing the effects of antiangiogenic therapy.
There are several limitations to the TRS technology. First, TRS can only be used for primary tumors and the surrounding normal tissue, not on axillary nodes. Further, we cannot precisely evaluate pCR status, including axillary node status. Optical absorption is limited to the reach of the photons, which corresponds to a few centimeters of depth from the skin. In addition, as chest wall thickness varies at different angles, it can compromise measurements when the distance between the skin and the muscle is too low. The relatively low sensitivity and poor spatial resolution of TRS can affect the reproducibility of the results, although MRI or US-guided measurement combined with TRS can improve measurement quality. Third, larger datasets on the water and lipid content of tissue were required to precisely assess tHb values, as tissue water and lipid concentrations are known to change during drug therapy drastically.
Despite these limitations, TRS, which does not use either ionizing radiation or extra contrast agents, has the advantage of being safe and painless even if multiple measurements need to be acquired from the same patient. Vascular and hypoxia imaging measured by TRS is an intriguing approach, with demonstrable implications for functional diagnosis in breast cancer. Although TRS is not suitable for early detection of primary breast cancer, hemodynamic stratification can identify unique alterations in tumor angiogenesis and hypoxia during treatment. Further studies will be required to explore optical phenotypes associated with molecular profiles of breast cancer, and to develop patient-tailored medicine.

Author Contributions

S.U. and T.S. conducted the clinical studies, and S.U. wrote the manuscript.

Acknowledgments

The authors acknowledge funding from KAKEN 16K10293 and 17H03591 [Grant-in-Aid for Scientific Research C and B, JSPS]. We are grateful to all patients who participated in the clinical studies and thank Yukio Ueda, Yutaka Yamashita, Hiroyuki Suzuki, and Kenji Yoshimoto for their technical support with TRS20 (Hamamatsu K.K.); Noriko Wakui and Midori Nakajima for their help with optical measurement and all the medical doctors, Akihiko Osaki, Hideki Takeuchi, Takashi Shigekawa, Eiko Hirokawa, Ikuko Sugitani, Hiroko Shimada, and Aya Asano, who recruited eligible patients for the studies.

Conflicts of Interest

The authors declare no conflict of interest.

References

  1. Machida, Y.; Tozaki, M.; Shimauchi, A.; Yoshida, T. Breast density: The trend in breast cancer screening. Breast Cancer 2015, 22, 253–261. [Google Scholar] [CrossRef] [PubMed]
  2. Suzuki, A.; Ishida, T.; Ohuchi, N. Controversies in breast cancer screening for women aged 40–49 years. Jpn. J. Clin. Oncol. 2014, 44, 613–618. [Google Scholar] [CrossRef] [PubMed]
  3. Tromberg, B.J.; Cerussi, A.E. Imaging breast cancer chemotherapy response with light. Commentary on soliman et al., p. 2605. Clin. Cancer Res. 2010, 16, 2486–2488. [Google Scholar] [CrossRef] [PubMed]
  4. Tromberg, B.J.; Cerussi, A.; Shah, N.; Compton, M.; Durkin, A.; Hsiang, D.; Butler, J.; Mehta, R. Imaging in breast cancer: Diffuse optics in breast cancer: Detecting tumors in pre-menopausal women and monitoring neoadjuvant chemotherapy. Breast Cancer Res. 2005, 7, 279–285. [Google Scholar] [CrossRef] [PubMed]
  5. Chung, S.H.; Cerussi, A.E.; Klifa, C.; Baek, H.M.; Birgul, O.; Gulsen, G.; Merritt, S.I.; Hsiang, D.; Tromberg, B.J. In vivo water state measurements in breast cancer using broadband diffuse optical spectroscopy. Phys. Med. Biol. 2008, 53, 6713–6727. [Google Scholar] [CrossRef] [Green Version]
  6. Taroni, P.; Quarto, G.; Pifferi, A.; Abbate, F.; Balestreri, N.; Menna, S.; Cassano, E.; Cubeddu, R. Breast tissue composition and its dependence on demographic risk factors for breast cancer: Non-invasive assessment by time domain diffuse optical spectroscopy. PLoS ONE 2015, 10, e0128941. [Google Scholar] [CrossRef] [PubMed]
  7. Kaufmann, M.; Morrow, M.; von Minckwitz, G.; Harris, J.R.; Biedenkopf Expert Panel, M. Locoregional treatment of primary breast cancer: Consensus recommendations from an international expert panel. Cancer 2010, 116, 1184–1191. [Google Scholar] [CrossRef]
  8. Von Minckwitz, G.; Untch, M.; Blohmer, J.U.; Costa, S.D.; Eidtmann, H.; Fasching, P.A.; Gerber, B.; Eiermann, W.; Hilfrich, J.; Huober, J.; et al. Definition and impact of pathologic complete response on prognosis after neoadjuvant chemotherapy in various intrinsic breast cancer subtypes. J. Clin. Oncol. 2012, 30, 1796–1804. [Google Scholar] [CrossRef]
  9. Li, H.; Yao, L.; Jin, P.; Hu, L.; Li, X.; Guo, T.; Yang, K. Mri and pet/ct for evaluation of the pathological response to neoadjuvant chemotherapy in breast cancer: A systematic review and meta-analysis. Breast 2018, 40, 106–115. [Google Scholar] [CrossRef]
  10. Zhu, Q.; Ricci, A., Jr.; Hegde, P.; Kane, M.; Cronin, E.; Merkulov, A.; Xu, Y.; Tavakoli, B.; Tannenbaum, S. Assessment of functional differences in malignant and benign breast lesions and improvement of diagnostic accuracy by using us-guided diffuse optical tomography in conjunction with conventional us. Radiology 2016, 280, 387–397. [Google Scholar] [CrossRef]
  11. Zhao, Y.; Mastanduno, M.A.; Jiang, S.; Ei-Ghussein, F.; Gui, J.; Pogue, B.W.; Paulsen, K.D. Optimization of image reconstruction for magnetic resonance imaging-guided near-infrared diffuse optical spectroscopy in breast. J. Biomed. Opt. 2015, 20, 56009. [Google Scholar] [CrossRef] [PubMed]
  12. Leproux, A.; O’Sullivan, T.D.; Cerussi, A.; Durkin, A.; Hill, B.; Hylton, N.; Yodh, A.G.; Carp, S.A.; Boas, D.; Jiang, S.; et al. Performance assessment of diffuse optical spectroscopic imaging instruments in a 2-year multicenter breast cancer trial. J. Biomed. Opt. 2017, 22, 121604. [Google Scholar] [CrossRef] [PubMed]
  13. Lee, S.; Kim, J.G. Breast tumor hemodynamic response during a breath-hold as a biomarker to predict chemotherapeutic efficacy: Preclinical study. J. Biomed. Opt. 2018, 23. [Google Scholar] [CrossRef] [PubMed]
  14. Ueda, S.; Nakamiya, N.; Matsuura, K.; Shigekawa, T.; Sano, H.; Hirokawa, E.; Shimada, H.; Suzuki, H.; Oda, M.; Yamashita, Y.; et al. Optical imaging of tumor vascularity associated with proliferation and glucose metabolism in early breast cancer: Clinical application of total hemoglobin measurements in the breast. BMC Cancer 2013, 13, 514. [Google Scholar] [CrossRef] [PubMed]
  15. Patterson, M.S.; Chance, B.; Wilson, B.C. Time resolved reflectance and transmittance for the non-invasive measurement of tissue optical properties. Appl. Opt. 1989, 28, 2331–2336. [Google Scholar] [CrossRef] [PubMed]
  16. Ijichi, S.; Kusaka, T.; Isobe, K.; Okubo, K.; Kawada, K.; Namba, M.; Okada, H.; Nishida, T.; Imai, T.; Itoh, S. Developmental changes of optical properties in neonates determined by near-infrared time-resolved spectroscopy. Pediatr. Res. 2005, 58, 568–573. [Google Scholar] [CrossRef] [PubMed]
  17. Wahl, R.L.; Jacene, H.; Kasamon, Y.; Lodge, M.A. From recist to percist: Evolving considerations for pet response criteria in solid tumors. J. Nucl. Med. 2009, 50 (Suppl. 1), S122–S150. [Google Scholar] [CrossRef] [PubMed]
  18. Drisis, S.; Metens, T.; Ignatiadis, M.; Stathopoulos, K.; Chao, S.L.; Lemort, M. Quantitative dce-mri for prediction of pathological complete response following neoadjuvant treatment for locally advanced breast cancer: The impact of breast cancer subtypes on the diagnostic accuracy. Eur. Radiol. 2016, 26, 1474–1484. [Google Scholar] [CrossRef]
  19. Xu, C.; Vavadi, H.; Merkulov, A.; Li, H.; Erfanzadeh, M.; Mostafa, A.; Gong, Y.; Salehi, H.; Tannenbaum, S.; Zhu, Q. Ultrasound-guided diffuse optical tomography for predicting and monitoring neoadjuvant chemotherapy of breast cancers: Recent progress. Ultrason. Imaging 2016, 38, 5–18. [Google Scholar] [CrossRef] [PubMed]
  20. Tromberg, B.J.; Zhang, Z.; Leproux, A.; O’Sullivan, T.D.; Cerussi, A.E.; Carpenter, P.M.; Mehta, R.S.; Roblyer, D.; Yang, W.; Paulsen, K.D.; et al. Predicting responses to neoadjuvant chemotherapy in breast cancer: Acrin 6691 trial of diffuse optical spectroscopic imaging. Cancer Res. 2016, 76, 5933–5944. [Google Scholar] [CrossRef]
  21. Roblyer, D.; Ueda, S.; Cerussi, A.; Tanamai, W.; Durkin, A.; Mehta, R.; Hsiang, D.; Butler, J.A.; McLaren, C.; Chen, W.P.; et al. Optical imaging of breast cancer oxyhemoglobin flare correlates with neoadjuvant chemotherapy response one day after starting treatment. Proc. Natl. Acad. Sci. USA 2011, 108, 14626–14631. [Google Scholar] [CrossRef] [PubMed] [Green Version]
  22. Ueda, S.; Saeki, T.; Takeuchi, H.; Shigekawa, T.; Yamane, T.; Kuji, I.; Osaki, A. In vivo imaging of eribulin-induced reoxygenation in advanced breast cancer patients: A comparison to bevacizumab. Br. J. Cancer 2016, 114, 1212–1218. [Google Scholar] [CrossRef] [PubMed]
  23. Folkman, J. Tumor angiogenesis: Therapeutic implications. N. Engl. J. Med. 1971, 285, 1182–1186. [Google Scholar] [PubMed]
  24. Jain, R.K. Normalization of tumor vasculature: An emerging concept in antiangiogenic therapy. Science 2005, 307, 58–62. [Google Scholar] [CrossRef]
  25. Jain, R.K. Antiangiogenesis strategies revisited: From starving tumors to alleviating hypoxia. Cancer Cell 2014, 26, 605–622. [Google Scholar] [CrossRef] [PubMed]
  26. Ueda, S.; Kuji, I.; Shigekawa, T.; Takeuchi, H.; Sano, H.; Hirokawa, E.; Shimada, H.; Suzuki, H.; Oda, M.; Osaki, A.; et al. Optical imaging for monitoring tumor oxygenation response after initiation of single-agent bevacizumab followed by cytotoxic chemotherapy in breast cancer patients. PLoS ONE 2014, 9, e98715. [Google Scholar] [CrossRef]
  27. Miller, K.; Wang, M.; Gralow, J.; Dickler, M.; Cobleigh, M.; Perez, E.A.; Shenkier, T.; Cella, D.; Davidson, N.E. Paclitaxel plus bevacizumab versus paclitaxel alone for metastatic breast cancer. N. Engl. J. Med. 2007, 357, 2666–2676. [Google Scholar] [CrossRef]
  28. Robert, N.J.; Dieras, V.; Glaspy, J.; Brufsky, A.M.; Bondarenko, I.; Lipatov, O.N.; Perez, E.A.; Yardley, D.A.; Chan, S.Y.; Zhou, X.; et al. Ribbon-1: Randomized, double-blind, placebo-controlled, phase iii trial of chemotherapy with or without bevacizumab for first-line treatment of human epidermal growth factor receptor 2-negative, locally recurrent or metastatic breast cancer. J. Clin. Oncol. 2011, 29, 1252–1260. [Google Scholar] [CrossRef]
  29. Ueda, S.; Saeki, T.; Osaki, A.; Yamane, T.; Kuji, I. Bevacizumab induces acute hypoxia and cancer progression in patients with refractory breast cancer: Multimodal functional imaging and multiplex cytokine analysis. Clin. Cancer Res. 2017. [Google Scholar] [CrossRef]
  30. Cataliotti, L.; Buzdar, A.U.; Noguchi, S.; Bines, J.; Takatsuka, Y.; Petrakova, K.; Dube, P.; de Oliveira, C.T. Comparison of anastrozole versus tamoxifen as preoperative therapy in postmenopausal women with hormone receptor-positive breast cancer: The pre-operative “arimidex” compared to tamoxifen (proact) trial. Cancer 2006, 106, 2095–2103. [Google Scholar] [CrossRef]
  31. Smith, I.E.; Dowsett, M.; Ebbs, S.R.; Dixon, J.M.; Skene, A.; Blohmer, J.U.; Ashley, S.E.; Francis, S.; Boeddinghaus, I.; Walsh, G.; et al. Neoadjuvant treatment of postmenopausal breast cancer with anastrozole, tamoxifen, or both in combination: The immediate preoperative anastrozole, tamoxifen, or combined with tamoxifen (impact) multicenter double-blind randomized trial. J. Clin. Oncol. 2005, 23, 5108–5116. [Google Scholar] [CrossRef] [PubMed]
  32. Chia, Y.H.; Ellis, M.J.; Ma, C.X. Neoadjuvant endocrine therapy in primary breast cancer: Indications and use as a research tool. Br. J. Cancer 2010, 103, 759–764. [Google Scholar] [CrossRef] [PubMed]
  33. Ueda, S.; Tsuda, H.; Saeki, T.; Omata, J.; Osaki, A.; Shigekawa, T.; Ishida, J.; Tamura, K.; Abe, Y.; Moriya, T.; et al. Early metabolic response to neoadjuvant letrozole, measured by fdg pet/ct, is correlated with a decrease in the ki67 labeling index in patients with hormone receptor-positive primary breast cancer: A pilot study. Breast Cancer 2011, 18, 299–308. [Google Scholar] [CrossRef] [PubMed]
  34. Nakamiya, N.; Ueda, S.; Shigekawa, T.; Takeuchi, H.; Sano, H.; Hirokawa, E.; Shimada, H.; Suzuki, H.; Oda, M.; Osaki, A.; et al. Clinicopathological and prognostic impact of imaging of breast cancer angiogenesis and hypoxia using diffuse optical spectroscopy. Cancer Sci. 2014, 105, 833–839. [Google Scholar] [CrossRef] [PubMed] [Green Version]
Figure 1. Time-resolved spectroscopy (TRS) breast imaging system.
Applsci 09 00003 g001
Figure 2. (A) Study protocol of hemodynamic monitoring of tumor response during neoadjuvant chemotherapy. (B) Study protocol of hemodynamic monitoring of tumor response to single-agent bevacizumab in patients with advanced breast cancer. (C) Study protocol for fluorodeoxyglucose-positron emission tomography-guided (FDG-PET-guided) neoadjuvant endocrine therapy and hemodynamic monitoring of tumor response.
Applsci 09 00003 g002
Figure 3. (A) Tissue concentration of hemoglobin: tumor vs. normal breast. (B) Tumor detection rate using the TRS breast imaging system. Tis: in situ carcinoma; T1: tumor size of 2 cm or less; T2: tumor size of 2–5 cm; T3: tumor size of 5 cm or more, or tumor with skin invasion, or tumor with muscle invasion. SD: standard deviation.
Applsci 09 00003 g003
Figure 4. (A) Hemodynamic monitoring of breast tHb during neoadjuvant chemotherapy. C1, the first cycle of chemotherapy; C2, the second cycle of chemotherapy; pCR, pathological complete response. (B) Diagnostic performance of pCR stratified by ER status. ER, estrogen receptor; BC, breast cancer; (C) Percent change in tHb among pCR and non-pCR patients stratified by breast cancer subtypes. TNBC: triple-negative breast cancer.
Applsci 09 00003 g004
Figure 5. (A) Hemodynamic monitoring of single-agent bevacizumab in breast cancer. (B) Tumor tHb and SO2 change during bevacizumab followed by paclitaxel. Bev: bevacizumab; PTX: paclitaxel; MRI: magnetic resonance imaging.
Applsci 09 00003 g005
Figure 6. (A) Tumor tHb change during neoadjuvant endocrine therapy; (B) Differential response of tumor tHb change between PET responders and non-responders.
Applsci 09 00003 g006

