Review

Brillouin Optical Correlation-Domain Technologies Based on Synthesis of Optical Coherence Function as Fiber Optic Nerve Systems for Structural Health Monitoring

Toyota Technological Institute, 2-12-1 Hisakata, Tempaku-ku, Nagoya 468-8511, Japan
Appl. Sci. 2019, 9(1), 187; https://doi.org/10.3390/app9010187
Submission received: 5 November 2018 / Revised: 16 December 2018 / Accepted: 16 December 2018 / Published: 7 January 2019
(This article belongs to the Special Issue Optical Correlation-domain Distributed Fiber Sensors)

Abstract

:
Brillouin optical correlation-domain technologies are reviewed as “fiber optic nerve systems” for the health monitoring of large structures such as buildings, bridges, and aircraft bodies. The Brillouin scattering property is used as a sensing mechanism for strain and/or temperature. Continuous lightwaves are used in the technologies, and their optical coherence properties are synthesized to realize position-selective measurement. This coherence manipulation technology is called the “synthesis of optical coherence function (SOCF)”. By utilizing SOCF technologies, stimulated Brillouin scattering is generated position-selectively along the fiber, which is named “Brillouin optical correlation domain analysis (BOCDA)”. Spontaneous Brillouin scattering, which takes place at any portion along the fiber, can also be measured position-selectively by the SOCF technology. This is called “Brillouin optical correlation domain reflectometry (BOCDR)”. When we use pulsed lightwaves that have the position information, sensing performances, such as the spatial resolution, are inherently restricted due to the Brillouin scattering nature. However, in the correlation-domain technologies, such difficulties can be reduced. Superior performances have been demonstrated as distribution-sensing mechanisms, such as a 1.6-mm high spatial resolution, a fast measurement speed of 5000 points/s, and a 7000-με strain dynamic range, individually. The total performance of the technologies is also discussed in this paper. A significant feature of the technologies is their random accessibility to discrete multiple points that are selected arbitrarily along the fiber, which is not realized by the time domain pulsed-lightwave technologies. Discriminative and distributed strain/temperature measurements have also been realized using both the BOCDA technology and Brillouin dynamic grating (BDG) phenomenon, which are associated with the stimulated Brillouin scattering process. In this paper, the principles, functions, and applications of the SOCF, BOCDA, BOCDR, and BDG-BOCDA systems are reviewed, and their historical aspects are also discussed.

1. Introduction

To realize a sustainable society, one important technology is “structural health monitoring (SHM)” for social infrastructures such as buildings, bridges, highways, pipelines, and so on. For the SHM, distributed and multiplexed fiber optic sensing technologies are an important and effective method of having distributed information of strain and/or temperature along the large structures. Varieties of fiber optic sensing technologies have already been proposed and developed, as “fiber optic nerve systems” [1,2,3,4,5,6,7,8,9]. In most of the technologies, time-domain techniques are a familiar method of having the distributed information along the sensing fiber, which utilizes pulsed lightwaves to measure the reflection and backscattering caused along the fiber as a function of time [4,5,10,11,12]. However, the time-domain techniques have inherent difficulties. To have a high spatial resolution, a high-speed data acquisition system is necessary. Especially, when we use fiber Brillouin scattering as a sensing mechanism for strain and/or temperature, the time-domain technologies show trade-off between the spatial resolution and the measurement accuracy.
On the contrary, our group proposed and developed other ways of distributed measurement that can reduce the above-mentioned difficulties. These are called “Brillouin optical correlation-domain technologies” [8,9]. In the technologies, continuous lightwaves are utilized, whose interference or optical-coherence properties are synthesized to realize position selective measurement along the sensing fiber. This coherence manipulation technology was also proposed and developed in our group, which is called the “synthesis of optical coherence function (SOCF)” [13,14]
In this paper, Brillouin optical correlation-domain technologies based on the synthesis of optical coherence function are reviewed, as are the fiber optic nerve systems, and the historical aspects are also described.

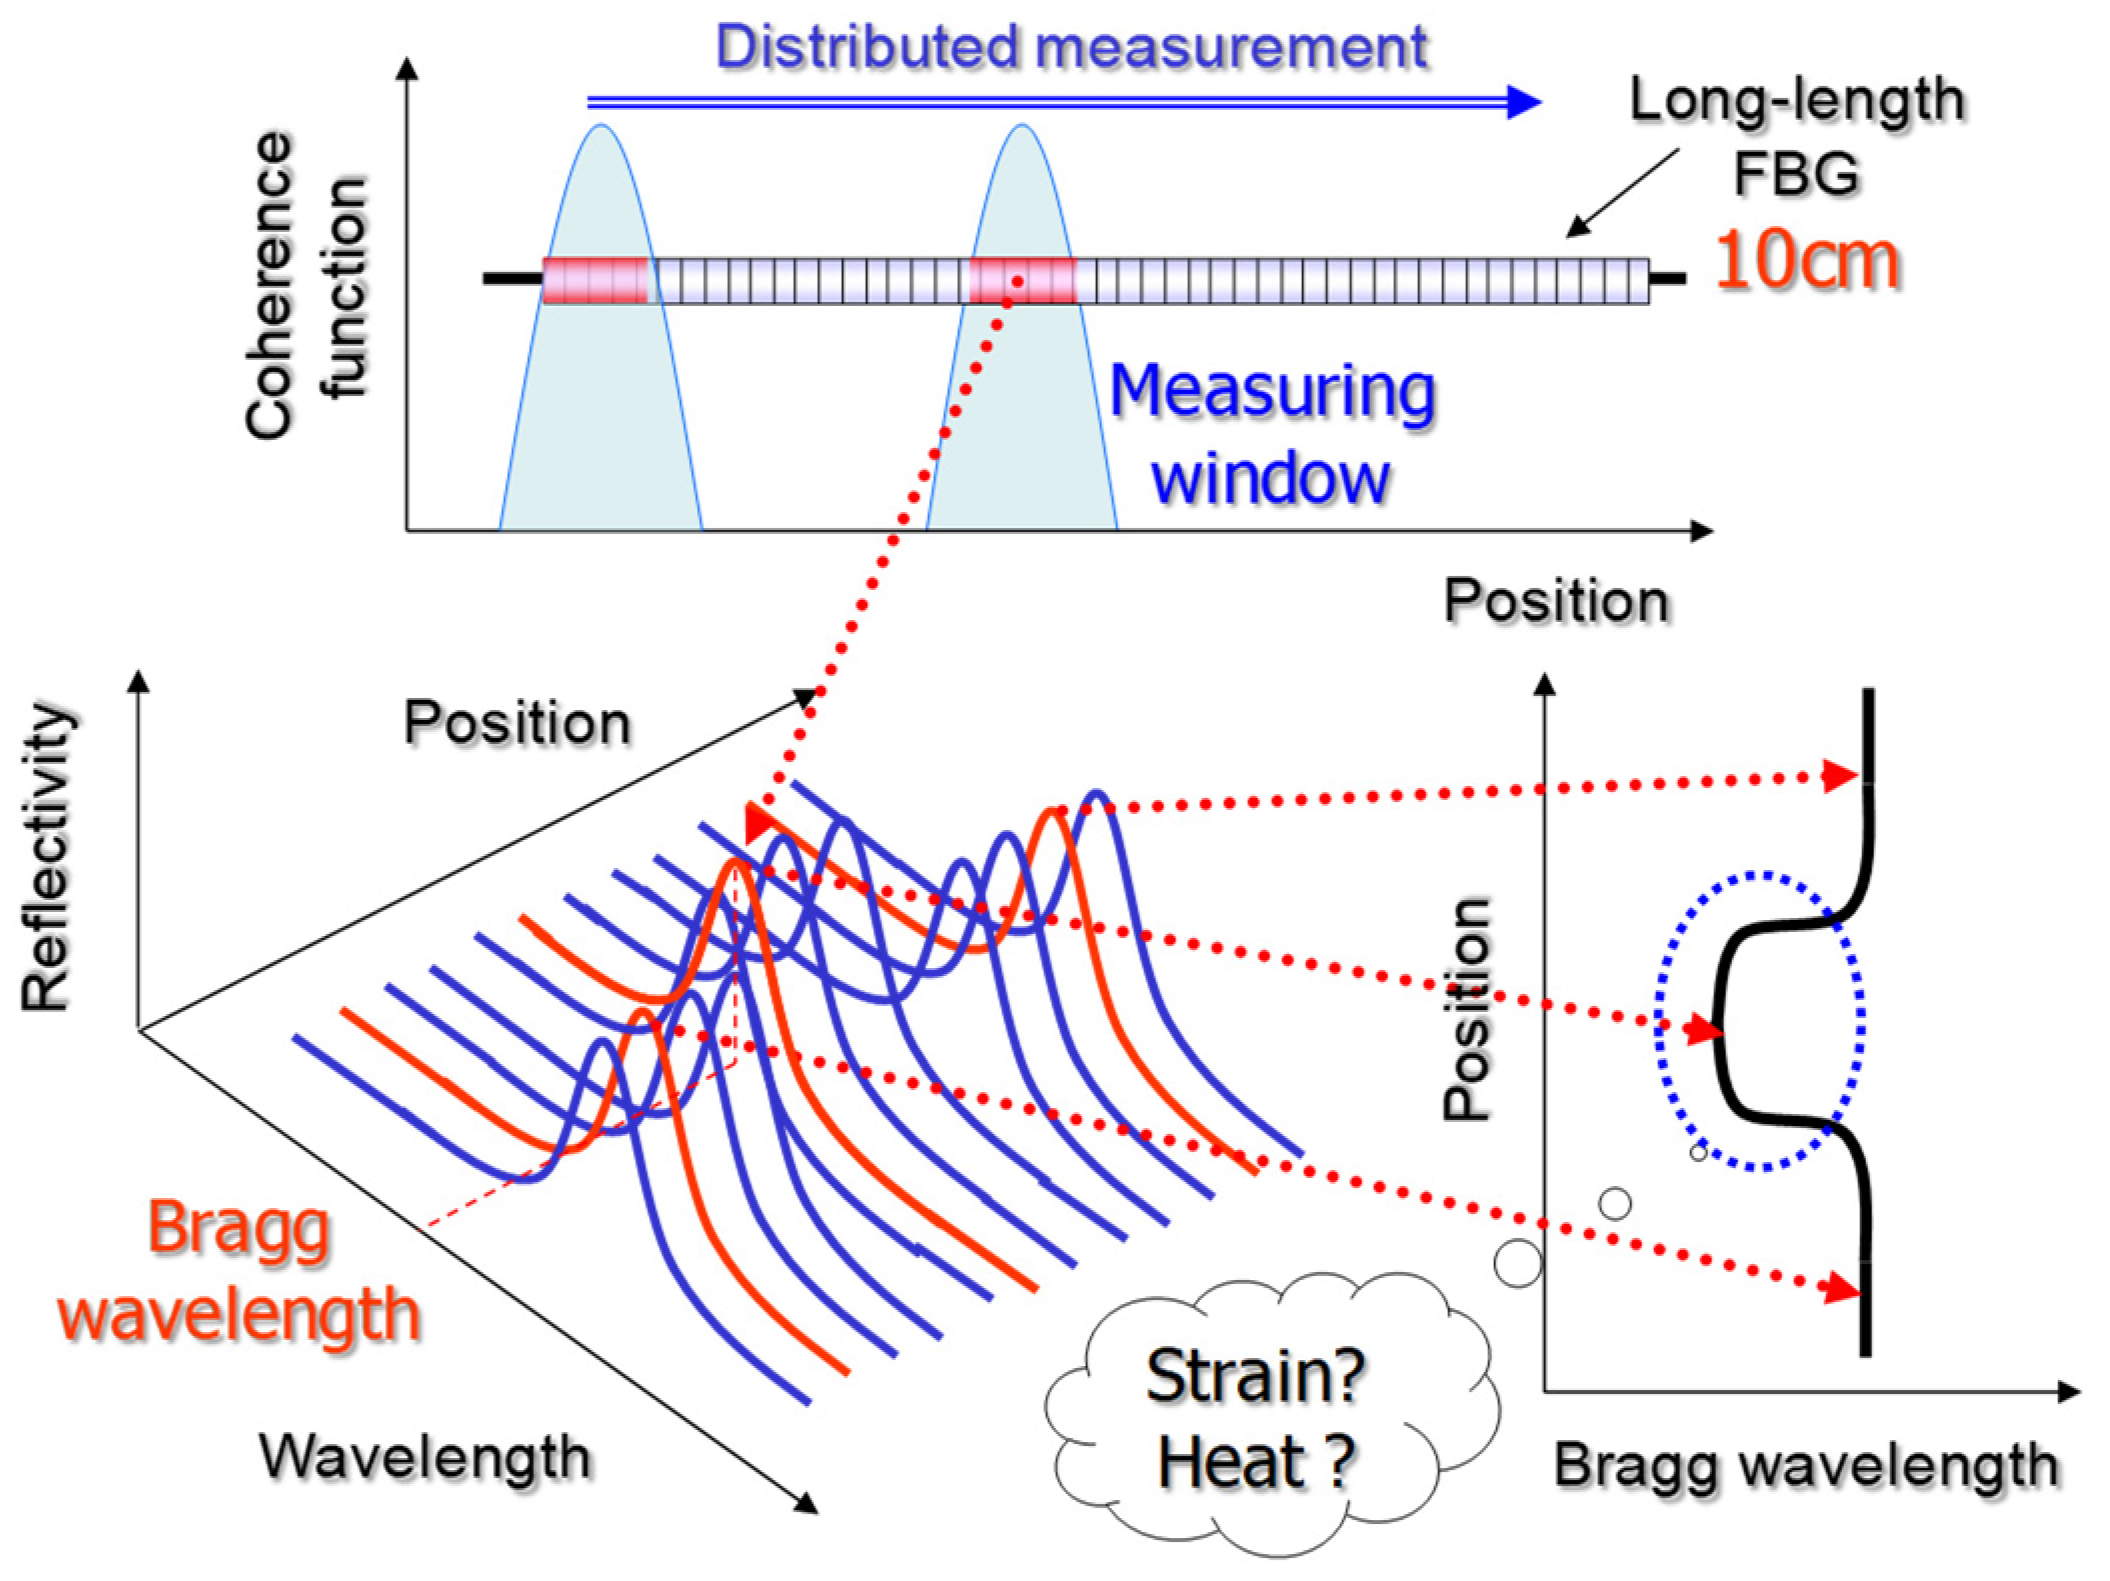
2. Fiber Optic Nerve Systems for Structural Health Monitoring

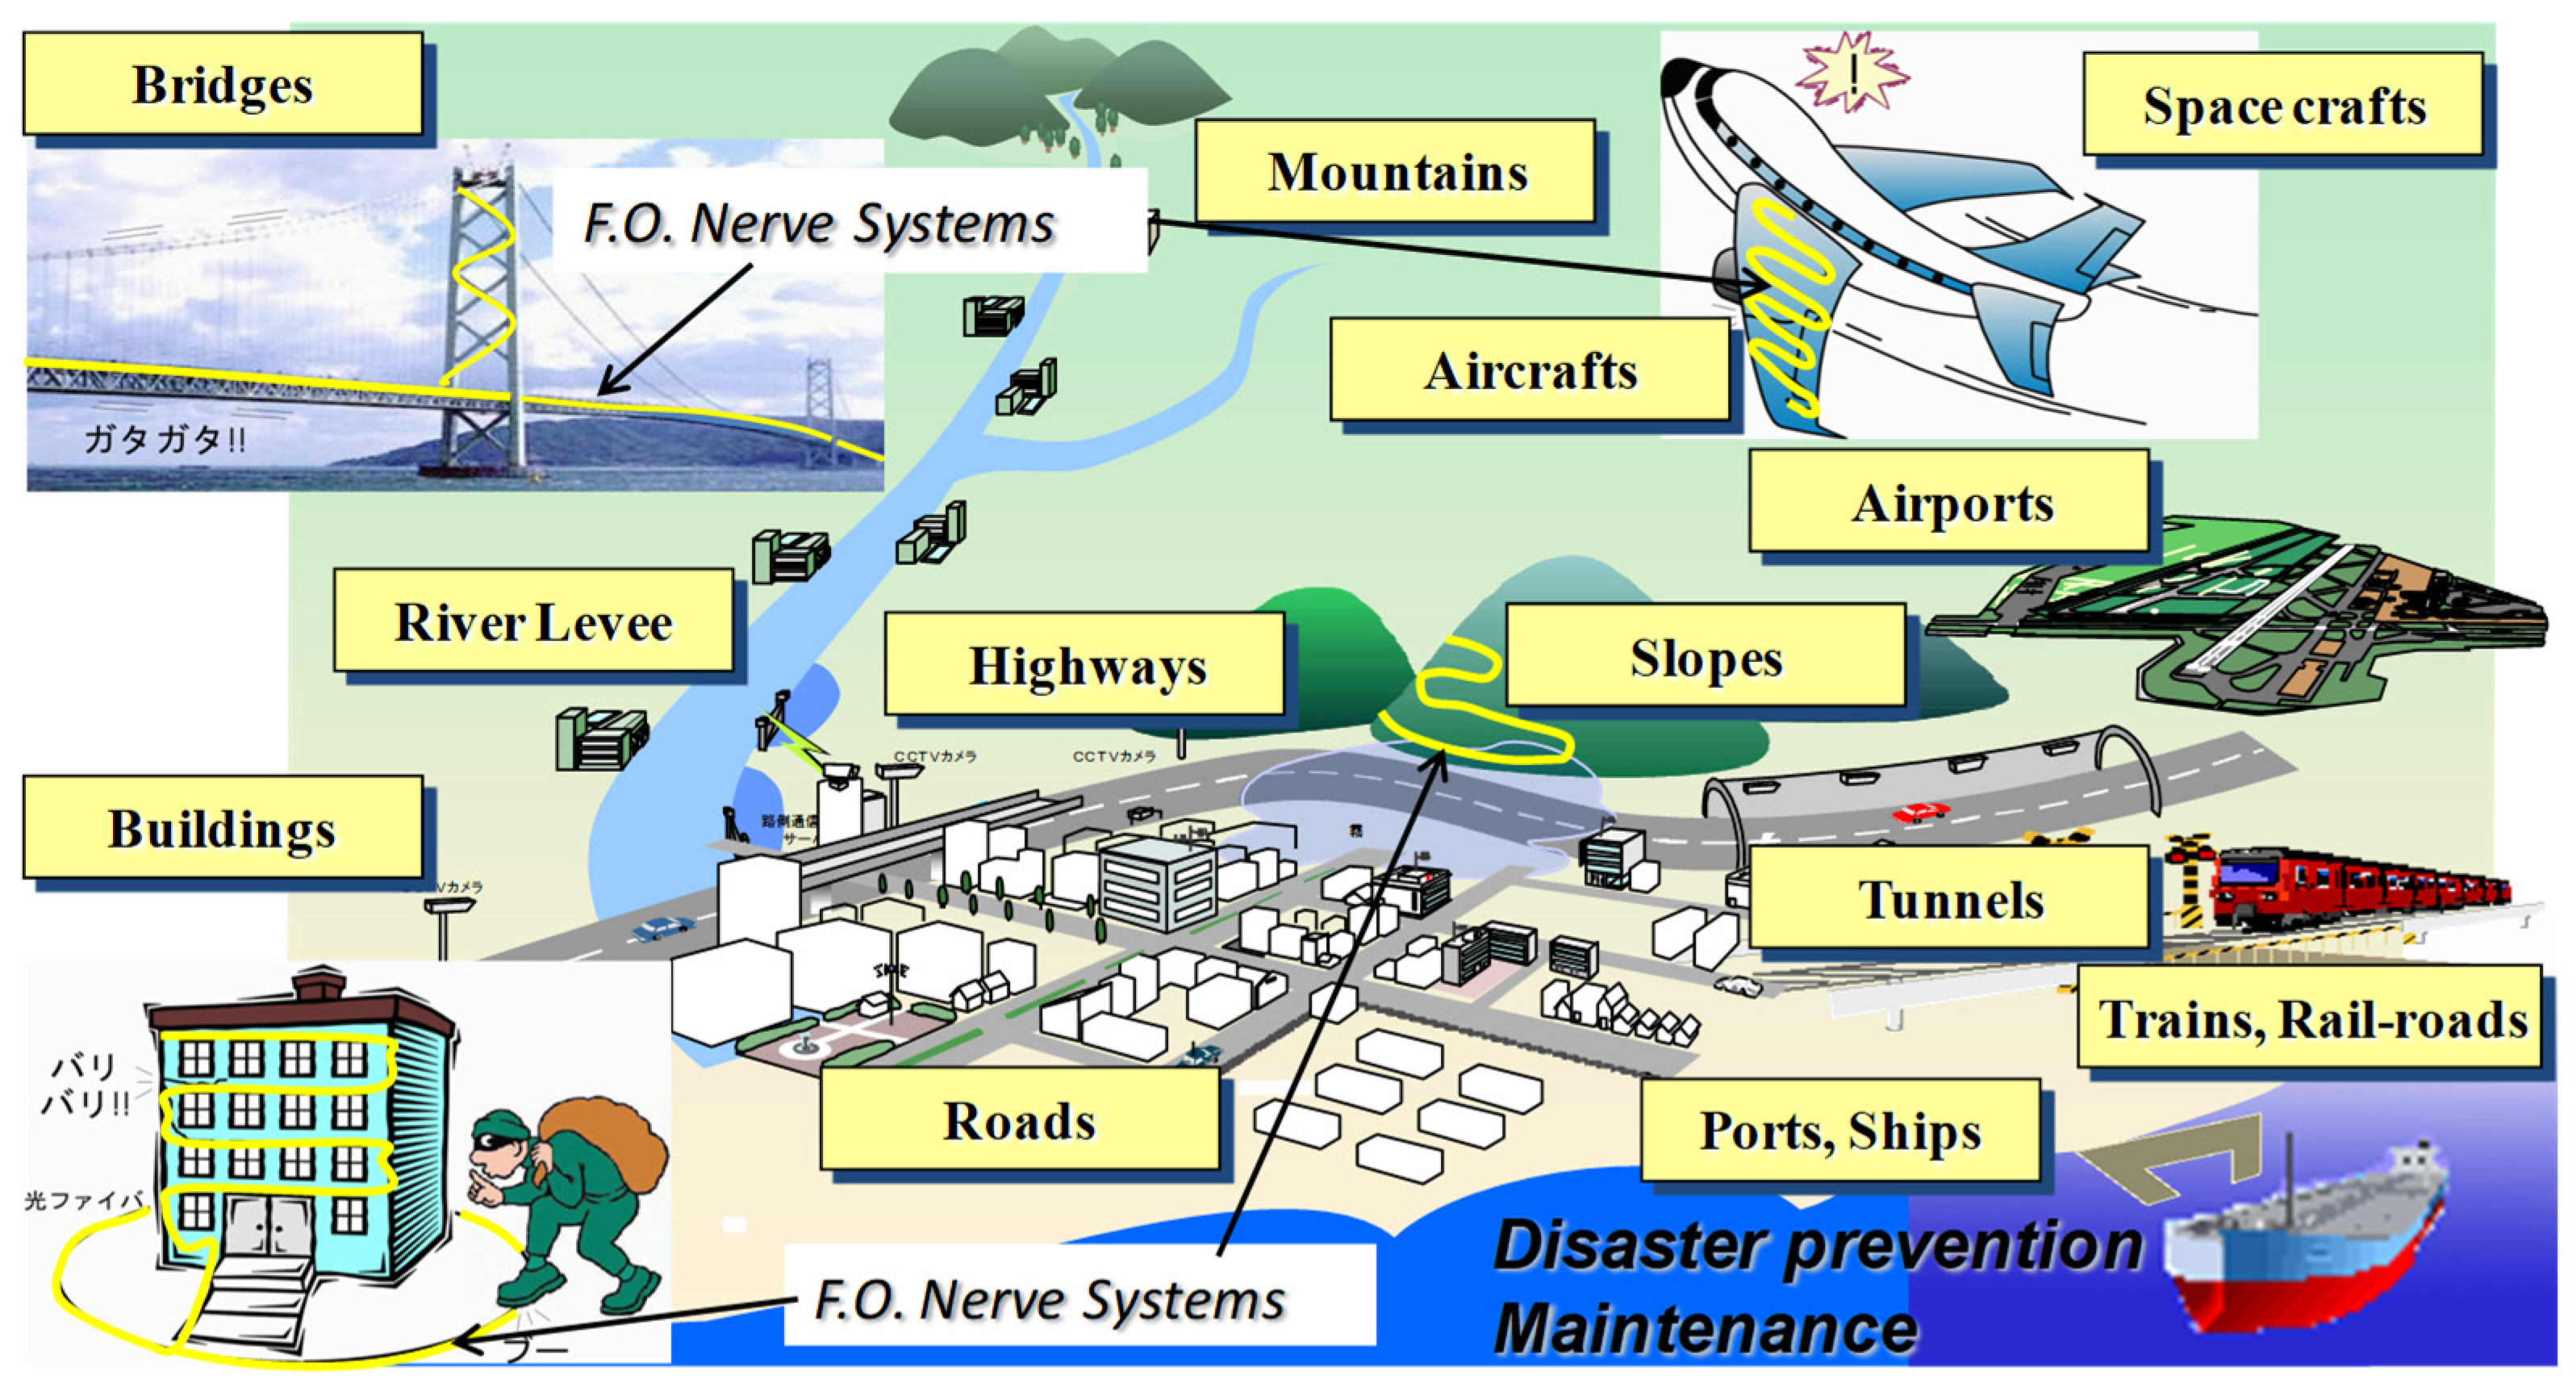
Figure 1 shows schematically smart structures and smart materials that can feel their pain, based on the fiber optic nerve systems. The fiber optic nerve systems can also be used, besides the social infrastructures, for airplane bodies, trains, ships, and natural structures, as shown in Figure 1.
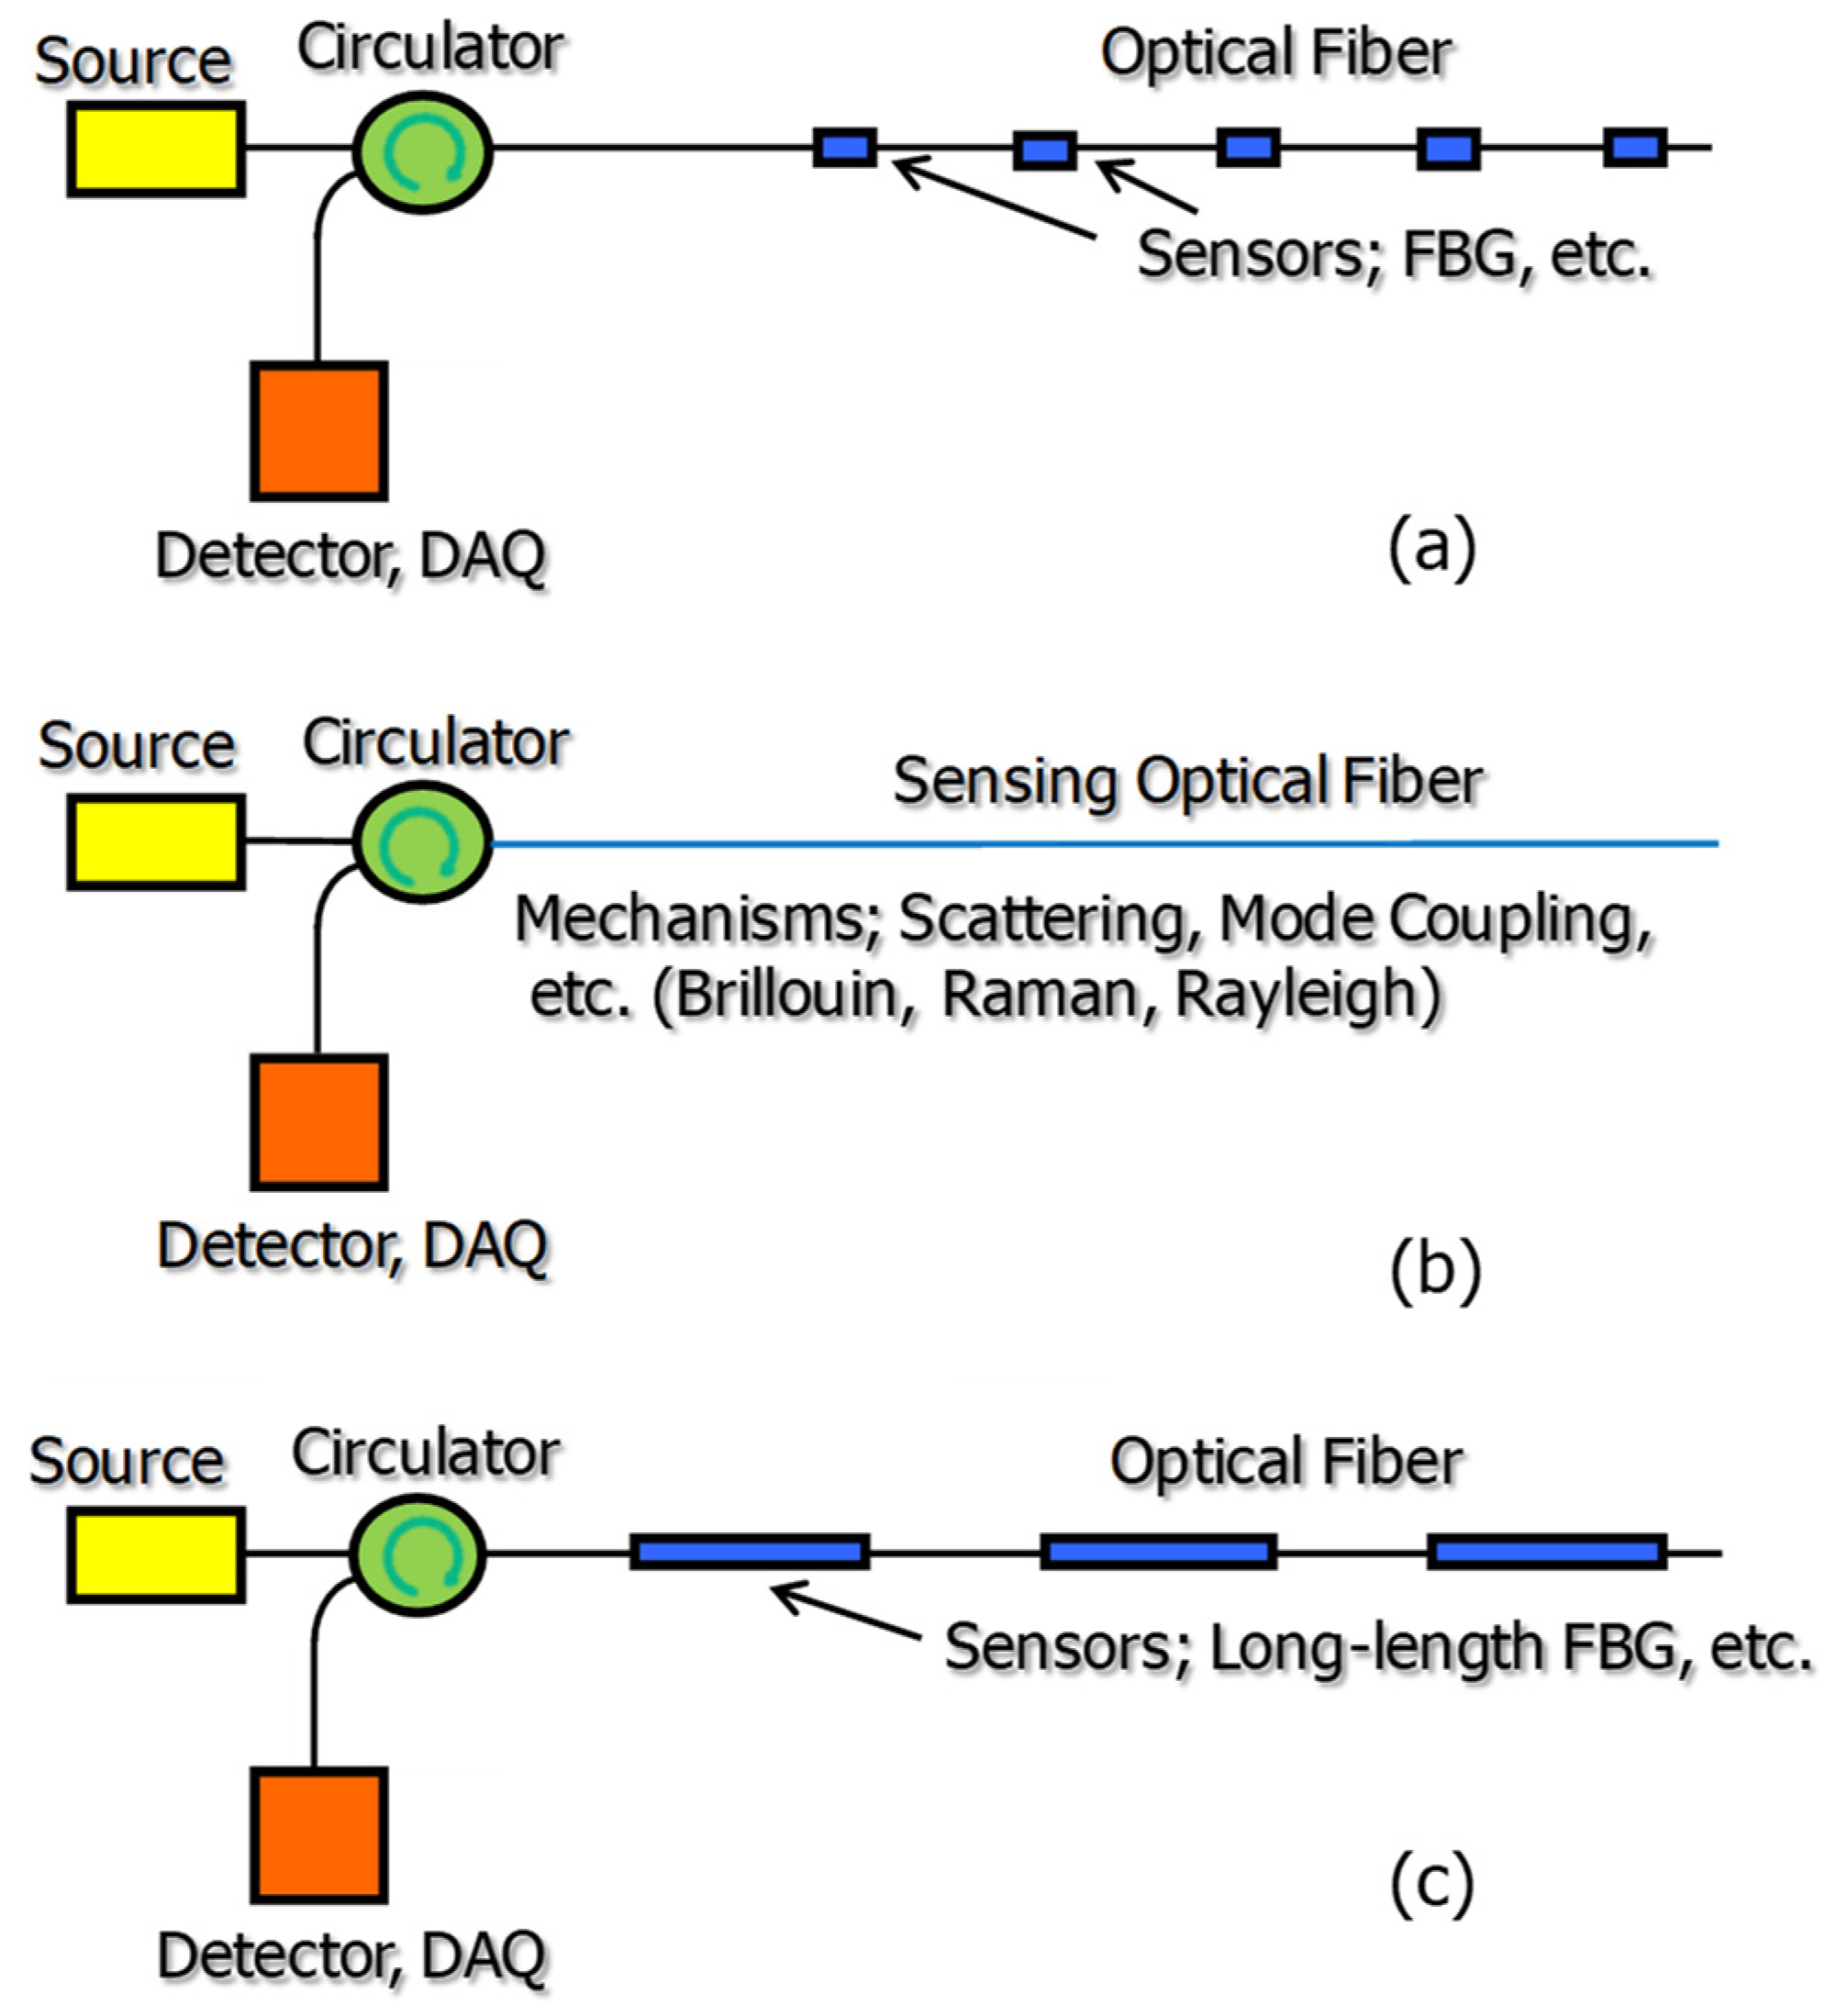
Figure 2 shows fiber sensing systems that can act as the fiber optic nerve systems. Figure 2a–c show, respectively, multiplexed, distributed, and quasi-distributed fiber optic sensing systems. In the multiplexed one, a number of point sensors are set along an optical fiber, which sense, for example, the strain and/or temperature applied to the fiber. As the sensing element, fiber Bragg gratings (FBGs) are mainly used [1]. However, in this technology, we cannot have any information regarding when events take place at the fiber portion without setting the sensing element. From such a point of view, the distributed sensing systems shown in 
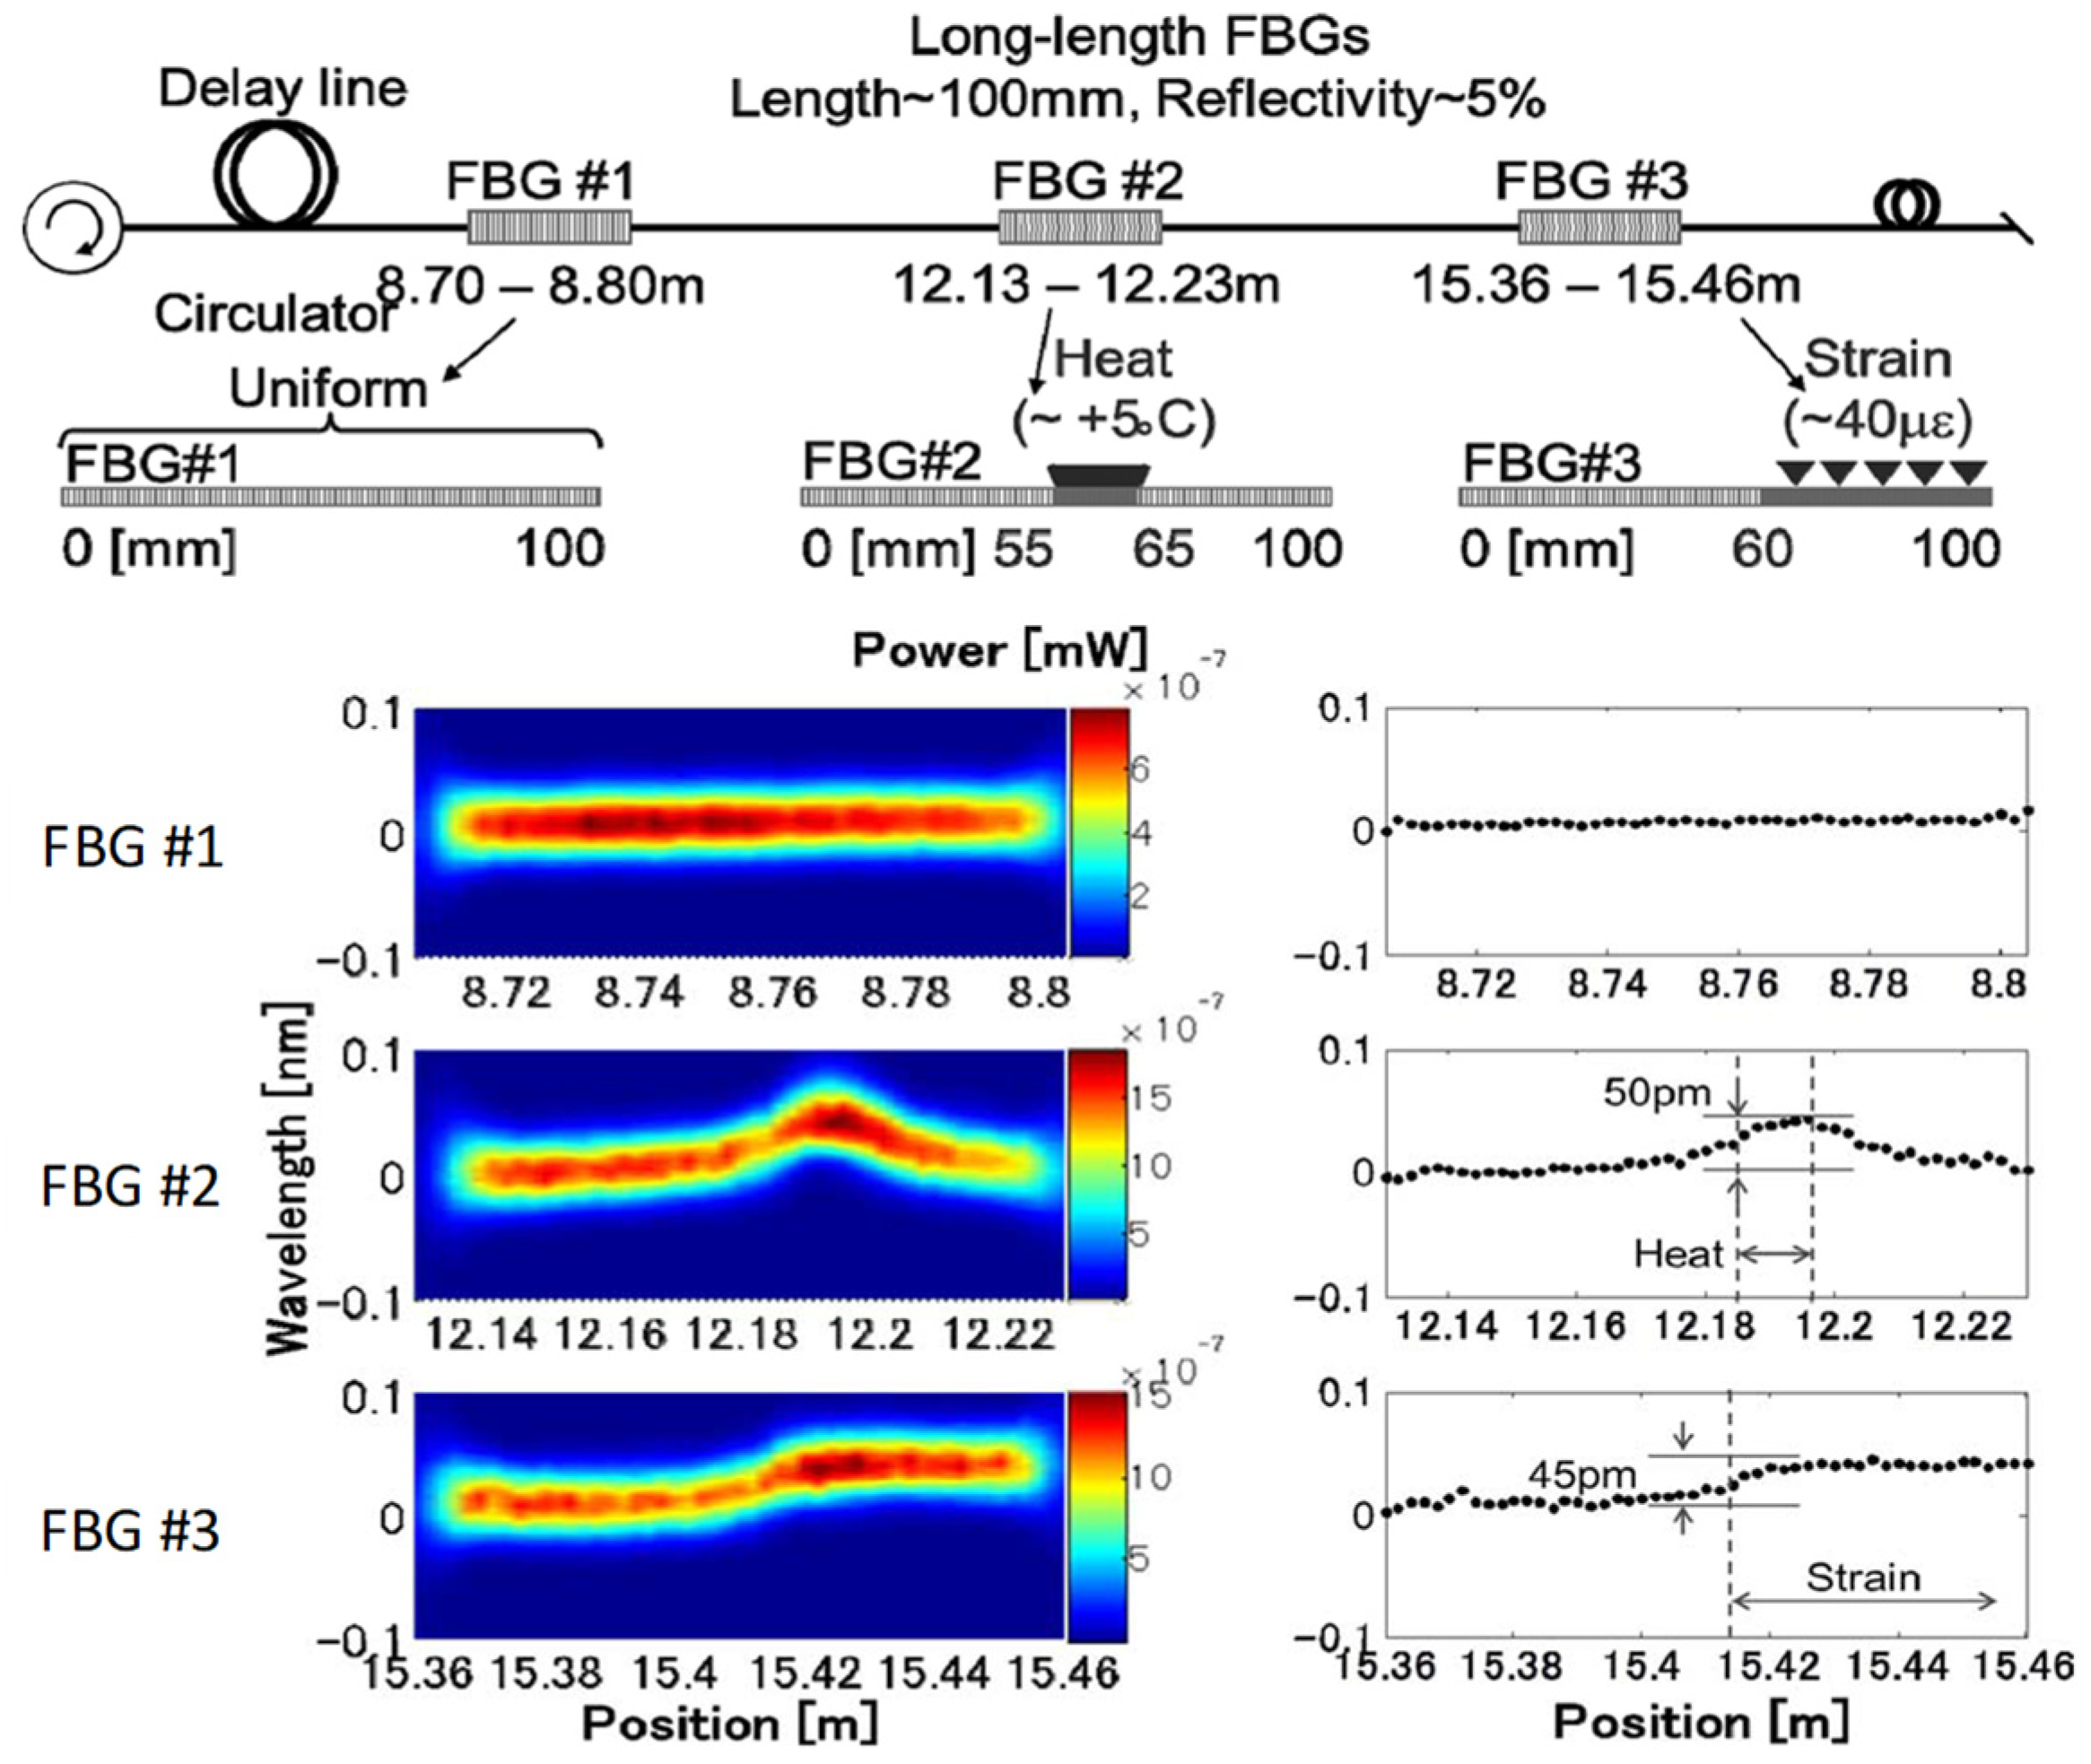
Figure 2b are more suitable. In the technology, the scattering phenomena caused in the fiber are mainly utilized as the sensing mechanism, such as Brillouin, Raman, and Rayleigh scattering. In the case where we do not need to have fully distributed information along the fiber, but we cannot expect the points to be measured exactly, quasi-distributed sensing technologies make sense. In this technology, for example, long-length FBGs are used as distributed sensing elements, which are set along the fiber as shown in Figure 2c.
In this paper, the distributed sensing technologies using Brillouin scattering are mainly discussed, where the correlation-domain technologies are used as the distributed sensing mechanism. The multiplexed and the quasi-distributed sensing technologies, which utilize the same distributed sensing mechanism, are also discussed.
As distributed sensing ways for the backscattering and reflections caused in fibers, time-domain pulsed lightwave technologies have been proposed and mainly used historically, which are called optical time domain reflectometry, or OTDR for short [1]. The main application of the technology was the diagnosis of fibers in telecommunication systems. Other ways, such as a frequency modulation (FM)-radar like technology, had also been studied as methods of distributed sensing [1].
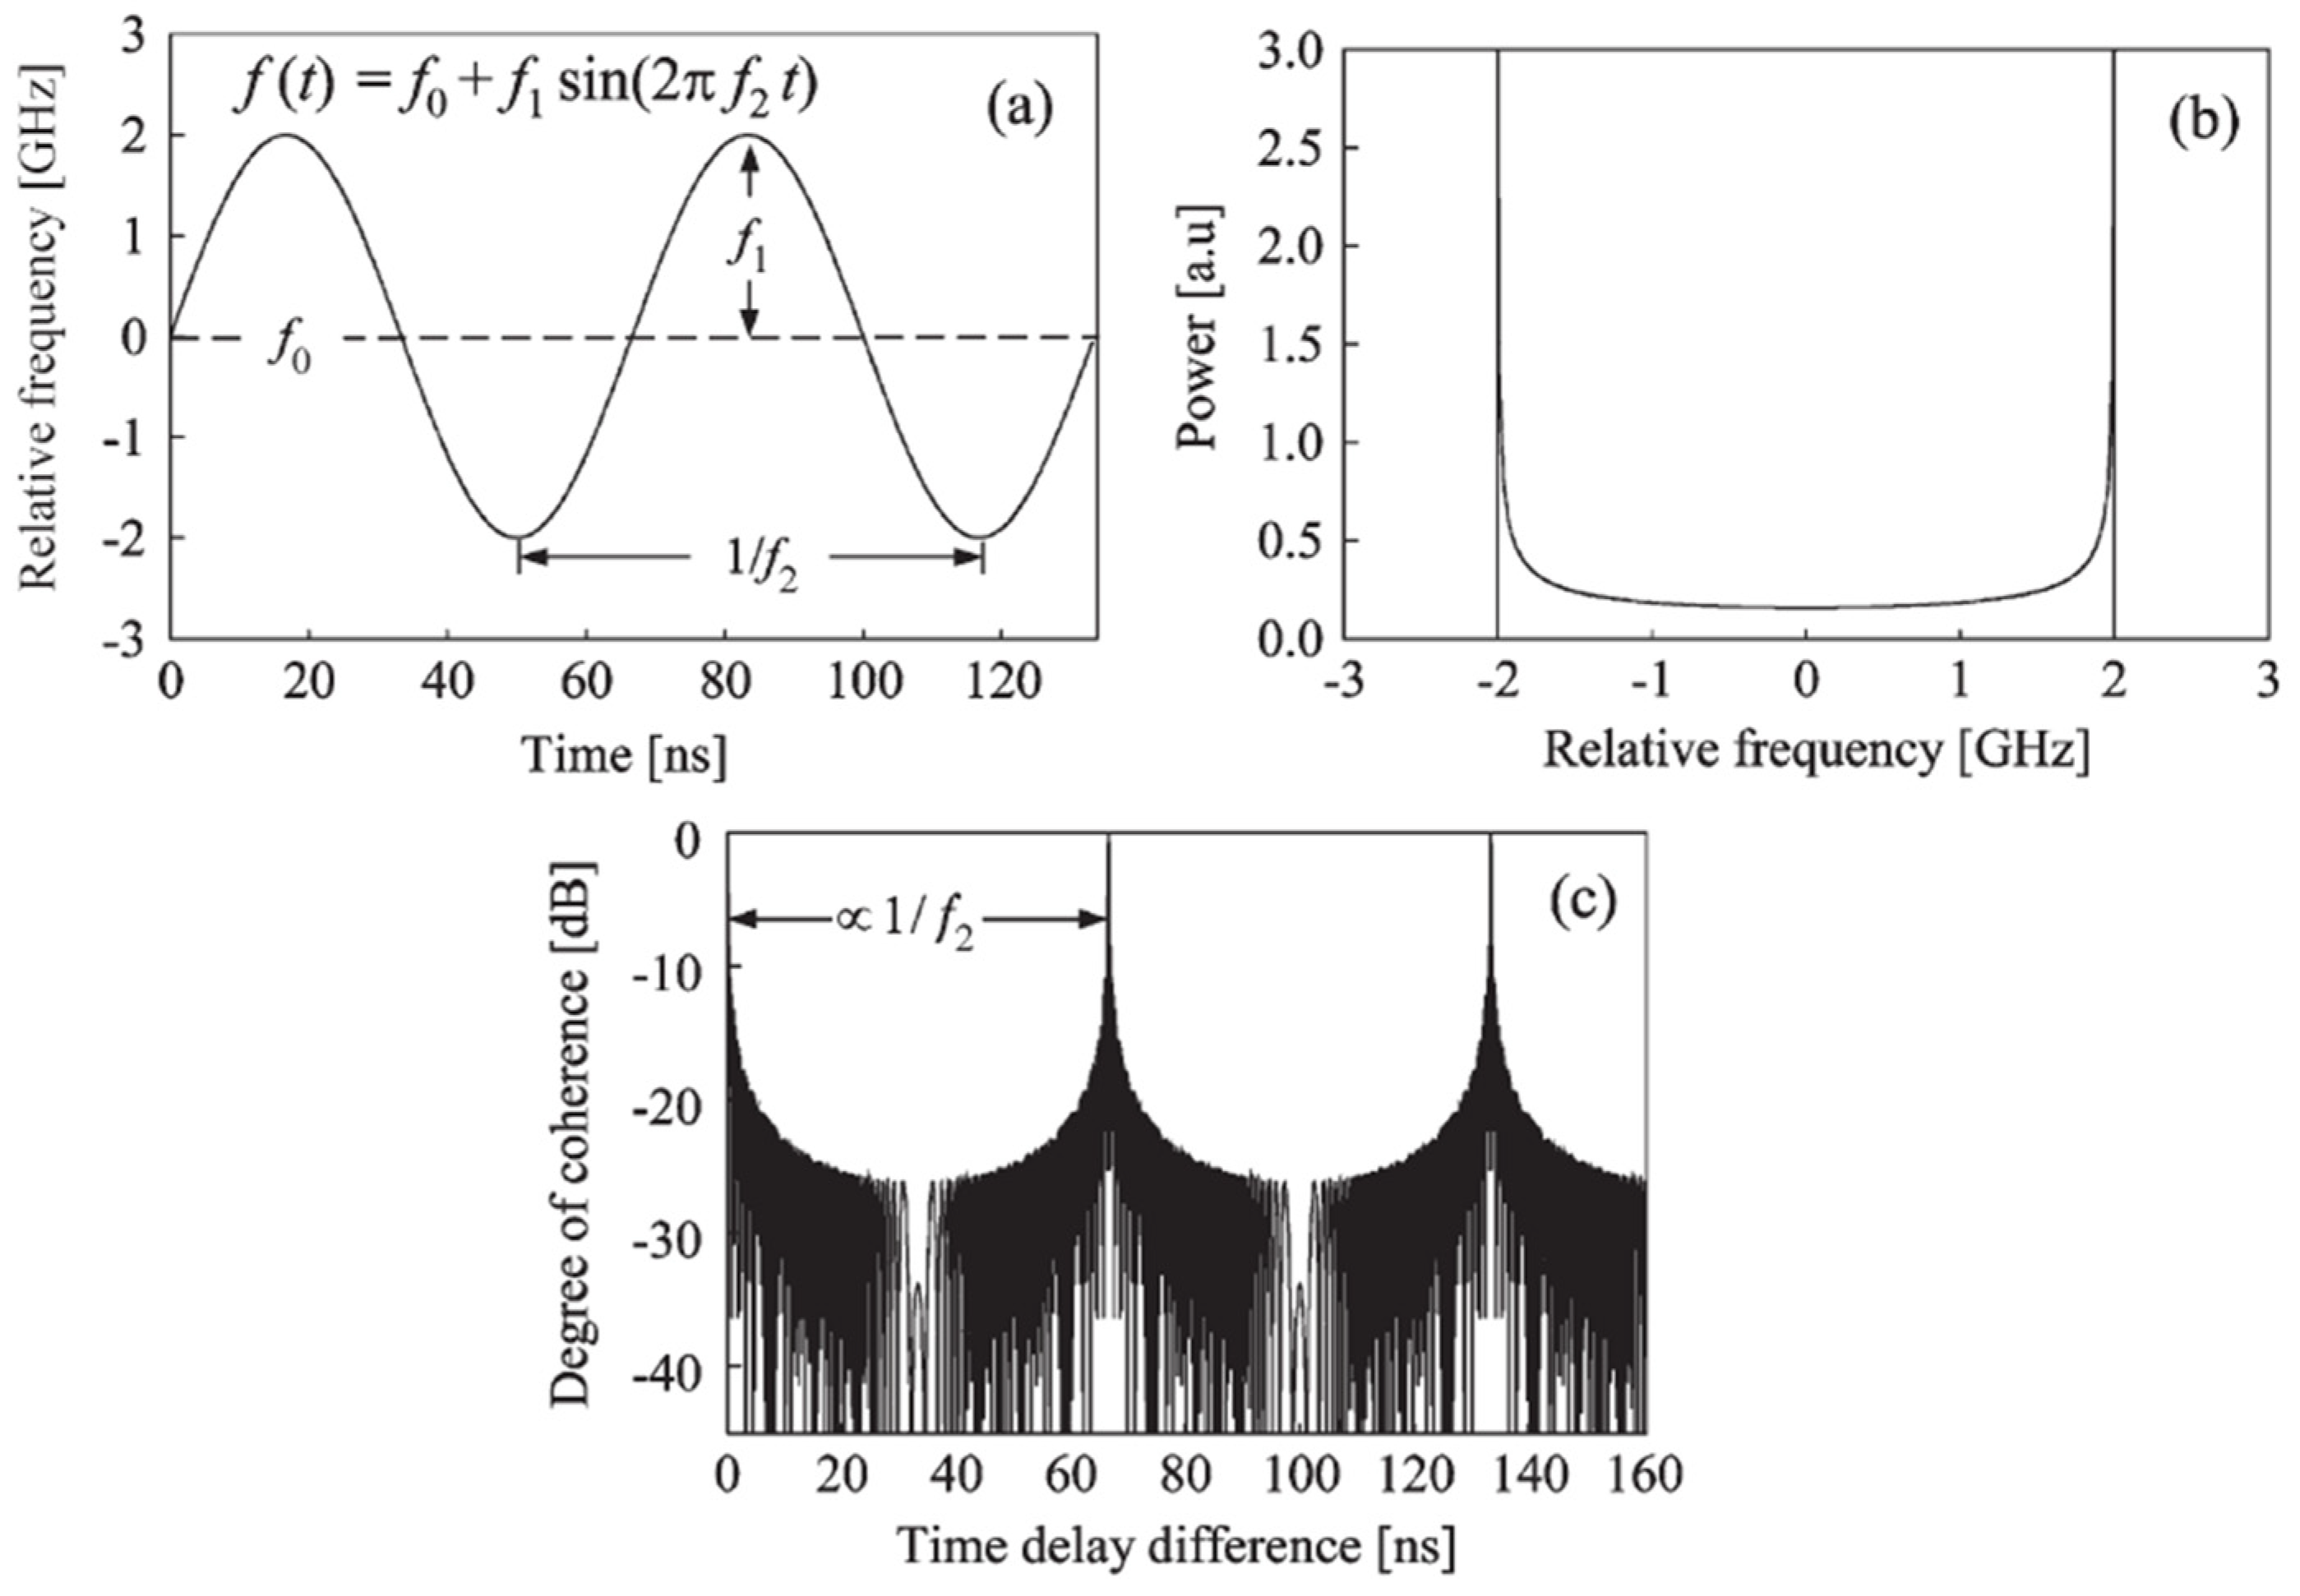
In 1989, we proposed the “synthesis of optical coherence function (SOCF)” technology, as another way for distributed measurement [15,16,17]. In this technology, the optical frequency of a continuous lightwave is modulated, for example, with an appropriate periodical waveform, so that a periodical delta function-like optical coherence function is synthesized. When the sensing fiber length is shorter than the period of the synthesized optical coherence peaks, position selective measurement along the fiber can be realized. By additionally applying intensity modulation and phase modulation onto the lightwave, a periodically but arbitrarily-shaped optical coherence function can be synthesized by the SOCF technology [14]. Distributed measurement of, for example, Rayleigh scattering and Bragg reflection frequency along long-length FBGs have also been demonstrated with the SOCF technology. This technology requires neither short pulses nor post-data calculations.
Next, we proposed “Brillouin optical correlation domain analysis,” or BOCDA for short, in 1999, in which stimulated Brillouin scattering was excited position-selectively along the fiber, by applying the SOCF to the continuous pump and the proven lightwave, which travel in opposite directions in the fiber [8]. Basically, the BOCDA output shows the Brillouin gain spectrum (BGS) which was caused at a selected position along the fiber, and the position can easily be changed by the FM frequency. Therefore, “random accessibility” to multiple points that are selected arbitrarily along the fiber can also be realized in BOCDA. This function provides us with simultaneous dynamic strain measurements at the arbitrarily selected multiple points. The “random accessibility” is the unique feature that cannot be realized by the time-domain technologies. Performance enhancement schemes have been proposed and demonstrated for—for example—a longer measurement range, shorter spatial resolution, larger strain measurement dynamic range, and higher measurement speed [3]. Superior performances, such as a spatial resolution of 1.6 mm, a measurement speed of 5000 points/s with random accessibility, and a strain dynamic range of 7000 με, have already been demonstrated individually. Of course, these superior performances cannot be realized at the same time. These have mutual relations, which restrict the total performance of the sensing system. In this paper, such an aspect is also discussed briefly. Application trials have already been performed using the BOCDA systems for the SHM of—for example—aircraft bodies, civil structures, and so on.
In 2008, we also proposed and demonstrated “Brillouin optical correlation domain reflectometry”, BOCDR for short, in which the spontaneous Brillouin scattering that is caused along the sensing fiber is measured position-selectively [9]. In BOCDR, the random accessibility can also be realized. The performance enhancement schemes for BOCDR have been developed, which are similar to those for BOCDA. The ratio between the measurement fiber length and the spatial resolution of 134,000 has recently been demonstrated in a BOCDR system with the performance enhancement schemes.
In 2010, a discriminative and distributed strain/temperature measurement scheme was also proposed and demonstrated [18], using both the BOCDA scheme and “Brillouin dynamic grating (BDG)”, which is a phenomenon that is associated with the stimulated Brillouin scattering process [19,20]. Ways to improve the measurement performances have also been proposed and demonstrated, including the spatial resolution improvement in the distributed BDG measurement by the BOCDA scheme.
In this paper, the principles, functions, and applications of SOCF, BOCDA, BOCDR, and BDG- BOCDA technologies are reviewed, including these historical aspects. Recently, varieties of research studies and developments related to optical correlation-domain distributed fiber sensors have been accumulated in various institutions, and these examples are also shown briefly.

3. Synthesis of Optical Coherence Function

The visibility of interference fringes caused by a signal and reference lightwave in an interferometer is changed as a function of the optical path-length difference between the two waves. The visibility change just corresponds to the absolute value of the “optical coherence function”, which inherently has a complex value [21]. The complex optical coherence function is calculated as the Fourier transform of the power spectrum shape of the light source [21].
Then, we thought that the shape of the optical coherence function might be synthesized by manipulating the time-averaged shape of the light source power spectrum. This has lead to the “synthesis of optical coherence function (SOCF)” technology [15,16,17]. When a delta function-like optical coherence function is synthesized, we can measure the reflected or backscattered lightwave that is caused at a coherence peak position along an optical fiber position-selectively. By shifting the position of the coherence peak, distributed measurement can be realized without using any mechanical moving parts nor any data calculations. In practice, varieties of distributed/multiplexed sensing and related schemes have been proposed and demonstrated by the SOCF technology [13,14].
In this chapter, the principle of the SOCF is explained, as well as a description of its historical aspects. SOCF applications to the fiber optic nerve systems are also shown.

3.1. Principle of Synthesis of Optical Coherence Function

References [15,16] describes the proposal of the SOCF technology as a way to realize distributed sensing. Figure 3 shows basic setup of the SOCF [16]. The light source is a laser diode (LD), which modulates the lightwave frequency directly through simply changing the injection current. Namely, the lasering frequency of LDs is easily changed. This setup is a heterodyne interferometer with an intermediate frequency f setting by an acoustic optical modulator (AOM). The interference component is selectively acquired by a band-pass filter (BPF) of the center frequency f and a square low detector.
Figure 4 shows early trials to synthesize optical coherence functions [16]. Figure 4a shows the line-width manipulation that occurs from injecting a noise current into the LD. By changing the noise current amplitude, the LD line width Δf is changed, which corresponds to changing the coherence length of the LD. The reflectometry function can be realized by solving a set of linear simultaneous equations by using the data obtained from changing the coherence length. When the current is modulated with a square waveform as shown in on the left-hand side of Figure 4b, the spectrum of the two lines is synthesized in a time-averaging manner, as shown in the center of Figure 4b. This corresponds to the synthesis of a sinusoidal-shaped optical coherence function, as shown on the right-hand side of Figure 4b. With changing the line spacing fs, which corresponds to changing the period of the sinusoidal optical coherence function, datasets are acquired. By applying inverse Fourier transform to the data, the distribution of the reflected lightwave can be calculated. In this case, the spatial resolution Δz is expressed as the equation shown in Figure 4b, where fm is the maximum line spacing, and c is the lightwave velocity in vacuum. Another way to have the distributed measurement function is to modulate the LD current by the waveform shown on the left-hand side of Figure 4c. A multi-line spectrum with identical separation can be obtained as shown in the center of Figure 4c. This modulation realizes a series of delta function-like optical coherence functions, as shown on the right-hand side of Figure 4c. When the measurement range is restricted within the coherence peak separation, the position selective measurement at the coherence peak position can be realized. Therefore, distributed measurement of the lightwave reflection can be done by changing the coherence peak position through changing the line spacing fs. Here, the spatial resolution Δz is expressed as the equation shown in Figure 4c, where fm is the frequency spacing between the two lines at both edges of the multi-line spectrum. The interval between the delta function-like coherence peaks is expressed as zs = c/fs, where fs is the line spacing shown in Figure 4c.
Figure 5 shows the experimental results that demonstrate the distributed measurement by the SOCF technology. Figure 5a–c corresponds to the case shown in Figure 4a–c, respectively. In Figure 5a, reflections at two half mirrors are measured. In Figure 5(b-i),(c-i), reflection at a half mirror set at a 50-cm position is measured. In Figure 5(b-ii),(c-ii), reflection at a half mirror set at a 60-cm position is measured. In Figure 5(b-iii),(c-iii), reflections at the two half mirrors are measured. All three cases worked well as the distributed measurement scheme [16].

3.2. Synthesis of Arbitrary-Shaped Optical Coherence Function with SOCF

An arbitrary-shaped optical coherence function can be synthesized by additionally using intensity modulation and phase modulation to the lightwave, besides using the frequency modulation. Figure 6 shows an experimental setup that has all three modulations [22]. In this setup, a specific LD that has a superior frequency modulation function is used, which is a superstructured grating distributed Bragg reflector laser diode (SSG-DBR-LD) [23]. A multiple-line spectrum is generated, in a time-averaging manner, through modulating the LD frequency by a multiple-step function, as shown in Figure 6i. Then, a periodical delta function-like coherence function is synthesized, as shown in Figure 7a. Since the envelope shape of the synthesized multiple-line spectrum is rectangular, the delta function-like coherence function has relatively large side lobes, as shown in Figure 7a.
When using additionally the phase modulation, which must be the same waveform as the FM waveform (see Figure 6ii), we can shift the whole coherence function along the lightwave propagation axis [24], for example, as shown in Figure 7b [22]. The phase modulation (PM) waveform is basically the same shape as the FM. In practice, the PM waveform is folded within +π and −π, as shown in Figure 6ii. When we change the PM amplitude, the synthesized optical coherence function can be shifted. Theoretically, the function to shift the synthesized optical coherence function corresponds to a formula in the Fourier transform theory. In Figure 7b, it is shown that the synthesized optical coherence function can realize the reduced or zero degree of coherence, even in the case of the zero optical path-length difference [22]. This situation cannot take place in the natural interferences.
By additionally using the intensity modulation, which is done by a semiconductor optical amplifier (SOA), as shown in Figure 6, the power of each line spectrum can arbitrarily be set by using a waveform, as shown in Figure 6iii [22]. With the intensity modulation, the envelope of the multi-line spectrum can be manipulated. This technique is also familiar in the Fourier transform theory, which is called the “window” or the “apodization”. By the intensity modulation (IM), the side lobes can be reduced, which is shown in Figure 8a as an experimental result [22].
By totally using FM, IM, and PM, an almost arbitrary-shaped optical coherence function can be synthesized [22]. Examples are shown in Figure 8b,c. A periodical triangle-shaped coherence function is synthesized in Figure 8b. A trapezoid-shaped one is shown in Figure 8c.
The multi-line-shaped spectrum, which was shown in Figure 4 and Figure 6, is useful to synthesize an arbitrary-shaped coherence function. However, it is not easy to make a fine multi-stairs-shaped frequency modulation, because of the non-ideal response of the LD and the driving circuit. For synthesizing the periodical delta function-like optical coherence function, a sinusoidal FM is simple but effective [14,25]. In Figure 9, the time-averaged light source power spectrum and the synthesized coherence function are shown [14]. Since both edges of the power spectrum have a high energy, the side lobes are relatively large. However, this problem can be solved by an analogue intensity modulation synchronized to the FM waveform. Additionally, the shift of the whole coherence function shape can also be realized, even in the case of the sinusoidal FM, by applying an analogue PM whose modulation waveform is similar to the FM waveform [26].

3.3. FBG-Based Multiplexed Fiber Optic Sensing with SOCF

Fiber Bragg grating (FBG) is a useful point sensor for strain and/or temperature measurement. As for FBG multiplexing schemes, wavelength division techniques have been mainly developed and used [1]. However, in the techniques, FBGs should have different Bragg wavelengths from each other [1]. On the contrary, the SOCF technology provides a multiplexing system of FBGs with identical Bragg wavelengths [25,27,28]. Figure 10 is an example of proposed systems, in which a SOCF with simple sinusoidal FM is used [28]. The Bragg wavelengths of the FBGs are identical, but their reflectivity is small. By changing the SOCF frequency f2, we can select one FBG along the fiber. Additionally, the LD frequency is scanned with a saw-tooth waveform, which gives us an FBG reflection spectrum shape that has the applied strain or temperature from the spectral peak. In this system, the LD intensity modulation associated with the FM is compensated by an intensity modulator driven by another saw-tooth waveform, as shown in Figure 10.
When the FBGs are set along a long-length fiber, for example, of 1000-m length, as shown in Figure 10, an optical path-length difference (OPD) takes place between the sensing lightwave reflected at the FBG and the reference lightwave. In this case, the LD frequency scan with the saw-tooth waveform makes an additional frequency difference between the two lightwaves due to the OPD. Therefore, the beat frequency between the two lightwaves, which is the heterodyne output frequency of the interferometer system, changes for each FBG to be measured. Therefore, we need to add some scheme to manage the heterodyne frequency change. In Figure 10, the amount of the frequency shift set at the acoustic optical modulator (AOM), which is an optical frequency shifter, is changed for each FBG, so that the heterodyne frequency at the system output becomes constant.
Figure 11a shows the experimental results of the detection of reflection spectra for the three FBGs with adopting the random accessibility function [28] Here, FBG1 and FBG2 are set after a delay fiber with a length of 1010 m, which have a meter-order separation from each other, and FBG3 is set after another delay fiber with a length of 1000 m, as shown in Figure 10. In this case, the AOM driving frequency, which corresponds to the optical frequency shift by this device, is 66.98 MHz for FBG1 and FBG2, and 99.84 MHz for FBG3, respectively. This makes the heterodyne frequency of the system constant: that is, 135 MHz. In this experiment, the total random access speed was 60 Hz with a sequence of FBG1, FBG2, FBG3, FBG1, FGB2, FBG3, etc. Then, each FBG spectral shape was measured 20 times/s, as shown in Figure 11a. A time-division multiplexed measurement of the dynamic strain change at the three FBGs can be realized. In this experimental setup, the number of the FBGs can be increased more, while keeping the total measurement speed.
The random access speed in this experiment was restricted, in practice, by the limitation in the driving frequency change of the AOM. The additional heterodyne frequency change due to the OPD is proportional to the OPD length and the saw-tooth frequency for the LD frequency sweep. In this experiment, a measurement fiber length of 1000 m and a width of the AOM driving frequency change of 60–120 MHz restricted the measurement speed to 60 Hz. This is not the inherent limitation. If a wider frequency change could be applied to the AOM and/or to the center frequency of the BPF, we have the possibility of enhancing the random access measurement speed to a greater degree. As for the function generators to change the measurement position (SOCF) and the AOM frequency, these output frequencies can be changed, in practice, in a higher speed beyond 10 kHz. Figure 11b shows another random access measurement for three FBGs, which are located around a fiber length of 10 m length. In this case, the OPD difference is rather short; then, the measurement speed could be enhanced to be 10 kHz with the random access function.
The inherent limitation of the random access speed is decided by the FM waveform period for the SOCF, because the integration of the system output, at least for the SOCF period, is required to realize the position-selective measurement function in the SOCF technology. As for this aspect, a brief discussion will be done in Section 4.4.3, which is related to the random accessibility of BOCDA.

3.4. Quasi-Distributed Sensing with SOCF Based on Long-Length FBGs

Distributed measurement of the Bragg wavelength in a long-length FBG can be done with the SOCF technology, as shown in Figure 12 [29,30,31]. For example, the distributed measurement in a 10-cm long-length FBG with a two-cm spatial resolution was demonstrated. The SOCF spatial resolution was set by adjusting the FM modulation amplitude. Moreover, a quasi-distributed measurement system with multiplexed long-length FBGs was also demonstrated, as shown in Figure 13 [31]. To measure the FBG spectral shape, the lasering frequency has to be swept with a saw-tooth waveform. Then, this modulation creates the additional frequency difference between the sensing lightwave and the reference lightwave, because the FBG reflection and the reference have the OPD, as shown in Figure 10. This makes the intermediate frequency shift in the heterodyne interferometer. To compensate for the frequency shift, the AOM driving frequency is changed, as shown in Figure 13 [31]. This system is an example of the quasi-distributed measurement that is shown in Figure 2c.
Figure 14 demonstrates the quasi-distributed measurement function of the system [31].

3.5. Distributed Lateral Force Sensing along a Polarization-Maintaining Optical Fiber with SOCF

When a polarization-maintaining fiber has a lateral force, the two eigen-polarization modes are coupled with each other. With this phenomenon, a distributed lateral force sensing system can be realized, as shown in Figure 15 [32]. In this system, only one linear polarization mode is launched at a fiber end. By applying lateral force or stress, the other orthogonal polarization mode takes place at the force-applied point. The two modes have a difference in their propagation speeds; then, the orthogonal polarized lightwave has a delay time corresponding to the coupling position. Through making an interference between the original polarization mode and the orthogonal one, as shown in Figure 15, and by additionally synthesizing a delta function-like coherence peak, the distributed measurement of the lateral force can be done. In Figure 15, a multiple-steps FM is used to synthesize the coherence peak, and then, phase modulation with the same waveform as that for the FM is used to sweep the coherence peak position along the fiber. The waveform is folded within +π and −π. Figure 16 shows the measurement results, for which the SSG-DBR-LD was used to enlarge the FM amplitude [33]. Then, the spatial resolution was improved to be 20 cm [33]. By synthesizing the other shapes of the coherence functions, varieties of distributed lateral force sensing were performed [34,35].

3.6. Various Applications of SOCF Technologies

Besides the SOCF applications to the distributed, quasi-distributed, and multiplexed optical fiber sensing for structural health monitoring, which have been shown above, a variety of sensing applications have also been accumulated [36,37,38,39,40,41,42]. These include, for example, diagnoses of optical devices and fiber subscriber networks [36,37,38], optical tomography with a synthesized delta function-like coherence function [39], multilayer surface-shape analysis [40], optical image processing [41,42], and so on.

4. Brillouin Optical Correlation Domain Analysis: BOCDA

4.1. Brillouin Scattering-Based Distributed Fiber Sensing

Before describing the BOCDA technology, Brillouin scattering-based distributed optical fiber sensing is briefly discussed, which clarifies the features of BOCDA technology.
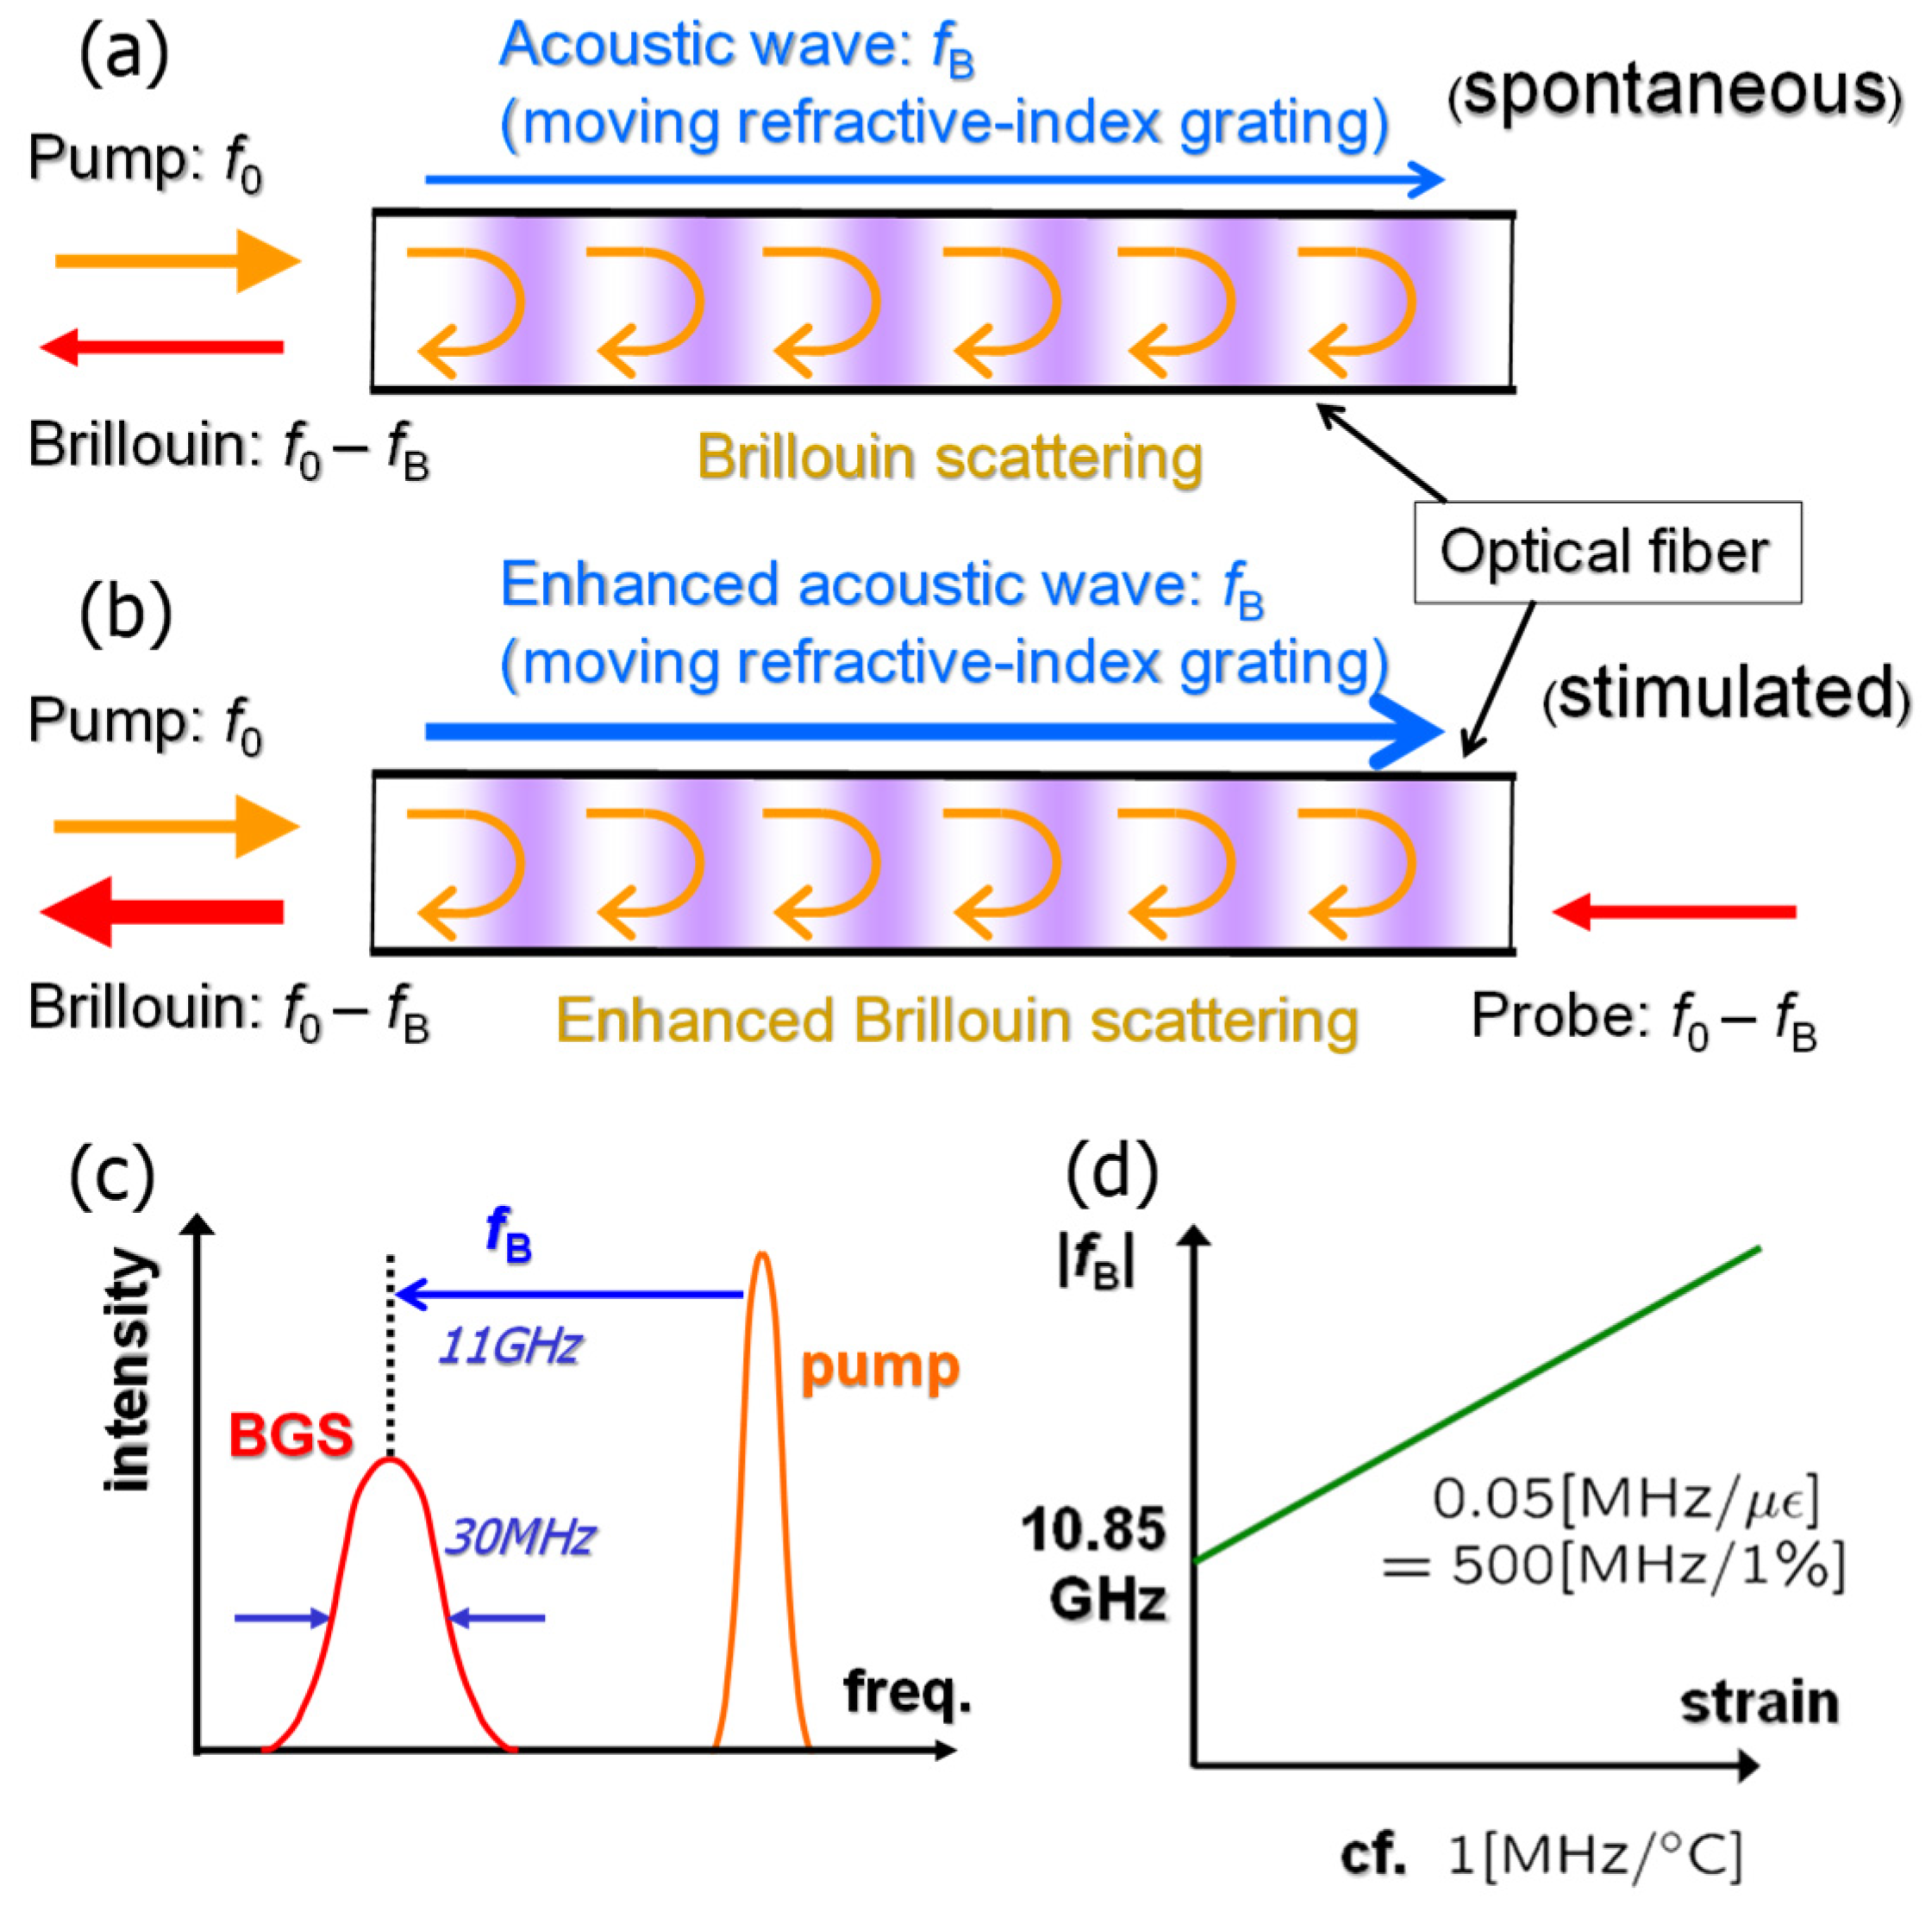
Figure 17 shows a schematic description of the Brillouin scattering in an optical fiber. The scattering is acoustic phonon-related. In a schematic description, thermal vibration of the material molecules creates an ultrasonic wave that propagates along the fiber, which creates periodical refractive index change. This can act as a grating for the incident lightwave. When the wavelength of the lightwave λ in the fiber and the period of the grating d meet the Bragg condition with respect to each other, that is d = λ/2, the incident lightwave makes a so-called Bragg reflection. As the grating is a moving one, the Brillouin scattering has a down-shifted and an up-shifted frequency, due to the Doppler shift. The former scattering is called the Stokes wave, and the latter is called the anti-Stokes wave, respectively. The Stokes wave is used mainly for the measurement. In silica optical fibers, the Bragg condition is satisfied when the ultrasonic frequency is around 11 GHz for an incident wavelength of 1.5 μm.
Then, the spectral relation shown in Figure 17c is obtained. The spectral broadening of around 30 MHz is observed in the Brillouin gain spectrum (BGS), which corresponds to the phonon lifetime. The down-shifted frequency fB is called the Brillouin frequency shift (BFS). The BFS shows a linear relationship to the strain change and/or temperature change that are introduced to the fiber. This is the sensing mechanism of the Brillouin scattering for strain and/or temperature.
As shown in Figure 17a, spontaneous Brillouin scattering takes place by simply launching the pump lightwave at one end of the fiber. On the contrary, by additionally launching the probe lightwave at the opposite fiber end, which has the frequency difference of −fB from the pump, stimulated Brillouin scattering can be induced. The former setup is simple, but the scattering power is tiny. On the other hand, the latter setup is rather complicated, but the scattering power is enhanced by several orders.
Figure 18a shows a setup for the distributed sensing with using a pulsed lightwave as the pump. When the spontaneous scattering is used with the one-end access configuration, the setup is called “reflectometry” in this field. Then, this configuration is called “Brillouin optical time-domain reflectometry (BOTDR)” [5]. When the stimulated Brillouin scattering is used with the two-end access configuration, the setup is called “Brillouin optical time-domain analysis (BOTDA)” [4].
In the time-domain technologies, there is an inherent limitation for the spatial resolution. When the launched pump pulse width is, for example, one meter, the spatial resolution is one meter. In this case, the pulsed lightwave has a broadened spectrum width of around 200 MHz, which is calculated in a simple Fourier analysis. On the other hand, the intrinsic BGS linewidth is around 30 MHz, as shown in Figure 17. This means that the accuracy in measuring the BFS shift is reduced, even when only the one-meter spatial resolution is required. Then, the time-domain configuration originally has the trade-off between the spatial resolution and the strain or temperature measurement accuracy.
Many studies have been accumulated to provide solution techniques to this trade-off problem in the time-domain configurations [43,44,45,46,47,48]. Examples are pulse pre-pump (PPP) BOTDA [43], differential pulse-width pair BOTDA [44], dark-pulse BOTDA [45], Brillouin echoes BOTDA [46], and double-pulse BOTDR [47]. By using the Brillouin dynamic grating phenomenon, which is discussed in Section 6, with a time-domain configuration, the spatial resolution has been greatly improved to be in the order of centimeters [48]. However, these systems still have difficulties. Quite fast speed data acquisition electronics are required in all of the systems. Some systems require post-calculation of the system’s output data or specialty fibers such as polarization-maintaining fibers.
On the contrary, the time-domain technologies are suitable to elongate the measurement range. By using amplification techniques for the signal wave intensity and/or some coded pulse train techniques, such as pseudo-random sequence pulses, distributed measurements with measurement ranges longer than 100 km have already been demonstrated [12,49].
On the other hand, the correlation-domain technologies can reduce the trade-off difficulty between the spatial resolution and the measurement accuracy, which is one of the advantages of the technologies. Of course, the BGS spectral shape, which is obtained with the position-selective measurement function of the technologies, shows a slightly broadened width compared with the natural BGS. However, it is not serious, compared with the time-domain technologies. In a higher spatial resolution case, such as in the order of centimeters, the Brillouin scattering power, which corresponds to the selected short section of the fiber, should be reduced. This results in the reduced signal to noise ratio (SNR), which deteriorates the measurement accuracy or elongates the measurement time, even in the correlation-domain technologies. However, the SNR reduction due to the enhancement of the spatial resolution takes place also in the time-domain technologies, because the pulse width should be reduced. On the contrary, in the correlation-domain technologies, the continuous lightwave is used instead of the pulsed one. Therefore, as for the SNR aspect under the same spatial resolution condition, it is thought that the correlation-domain technologies are superior to the time domain ones.
Roughly compared, it would be said that the time-domain technologies are rather suitable for the applications with requirement of a longer measurement range and a moderate spatial resolution, and that the correlation-domain technologies are rather suitable for applications that require a moderate measurement range and higher spatial resolution.

4.2. Basic BOCDA System

A BOCDA configuration was proposed in 1999, in which the stimulated Brillouin scattering was excited position-selectively at one specific position along a sensing optical fiber, by synthesizing the delta function-like optical coherence peak between the pump and the probe lightwave in the system. This is not the configuration using the pulsed lightwave, but rather that with continuous lightwaves. By manipulating the correlation, or the interference between the pump and the probe lightwave through applying the SOCF technology [14], position-selective measurement can be realized.
So far, superior functions have been realized with the BOCDA configurations, such as 1.6-mm spatial resolution, a BGS shaping speed of 5000 times/s, a 7000-με strain dynamic range, and so on, individually. Of course, these superior measurement characteristics cannot be realized at the same time. These factors have relationships with each other, which creates limitations regarding the total performance of the BOCDA systems. This will be briefly discussed later.
BOCDA has another specific feature called “random accessibility”. On the contrary, in the time-domain configurations, the measurement is sequentially done from one fiber end to the other. That means that only the distributed measurement mode can be provided. In BOCDA configurations, the measurement is done at a specific position, which is the basic measurement mode of the BOCDA. Therefore, we can select multiple points arbitrarily along the sensing fiber and perform the measurements at only the selected multiple points. Of course, the ordinary distributed measurement mode can also be realized. The random accessibility is the most specific feature of the BOCDA, which cannot be done by the time-domain configurations. In the random access mode, the measurement parameters, such as the spatial resolution, measurement range, measurement speed, and measurement accuracy, are restricted in relation to each other. As for the total limitation, we shall discuss that later in Section 4.4.3.
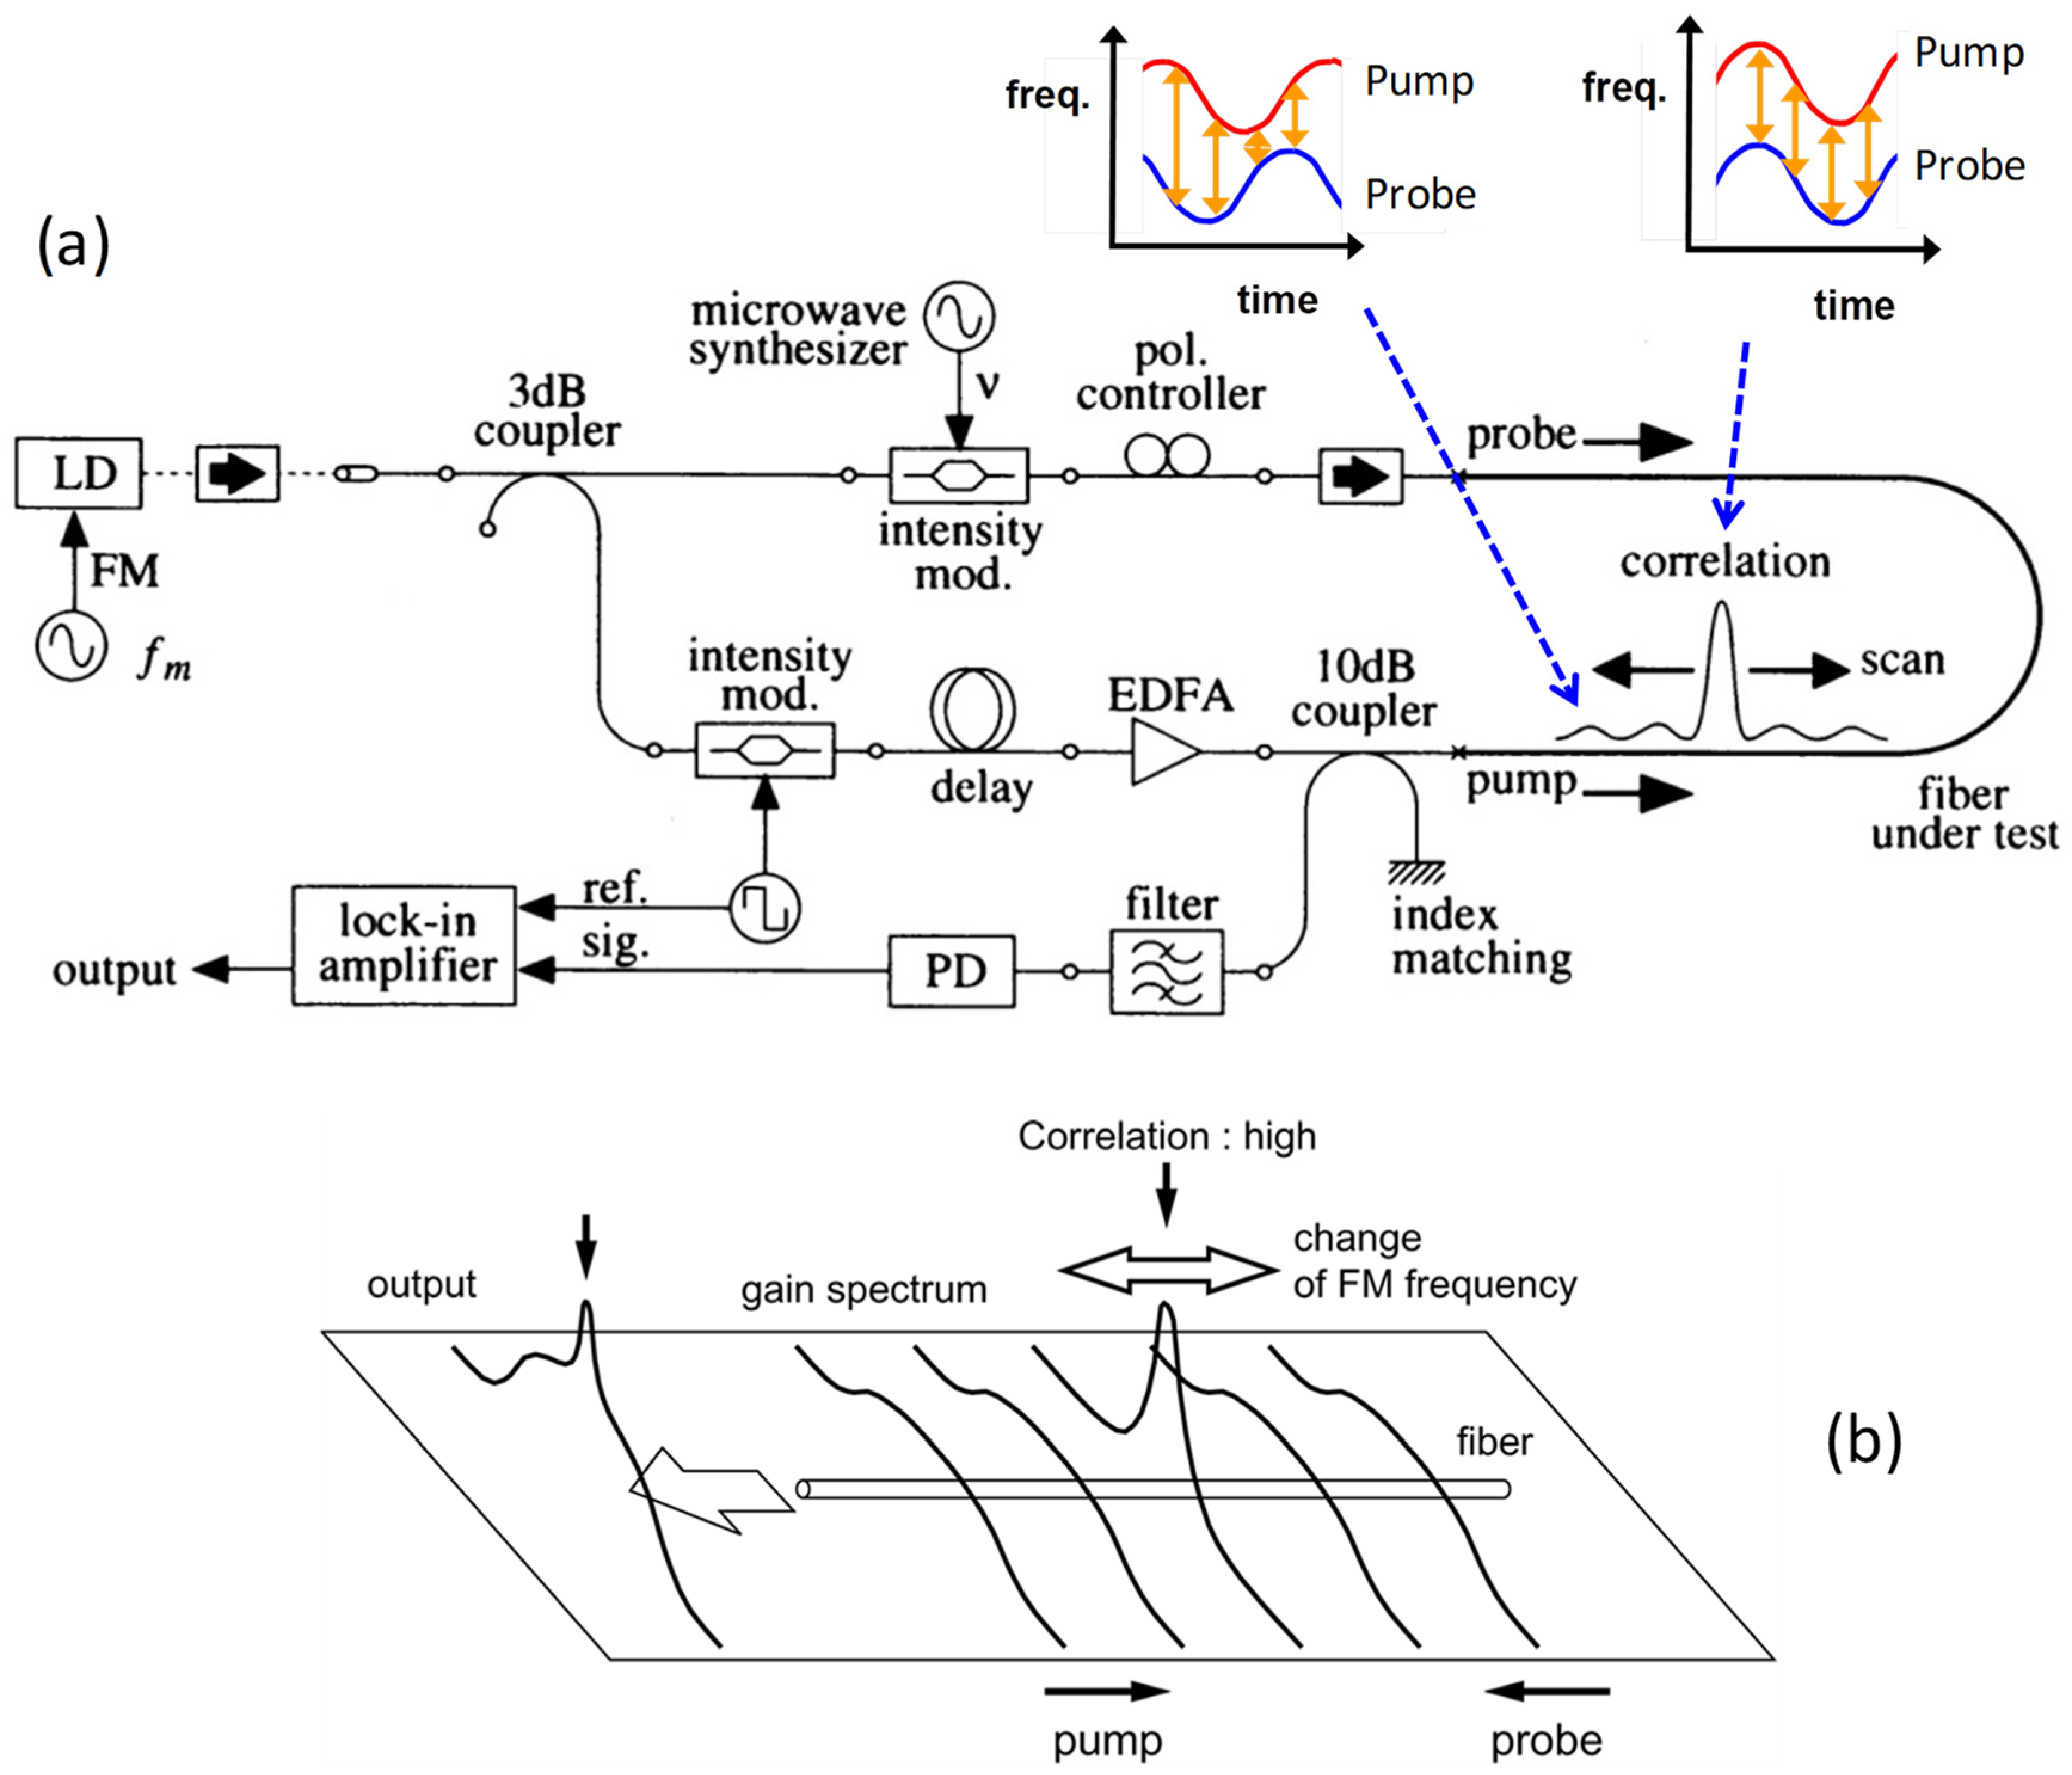
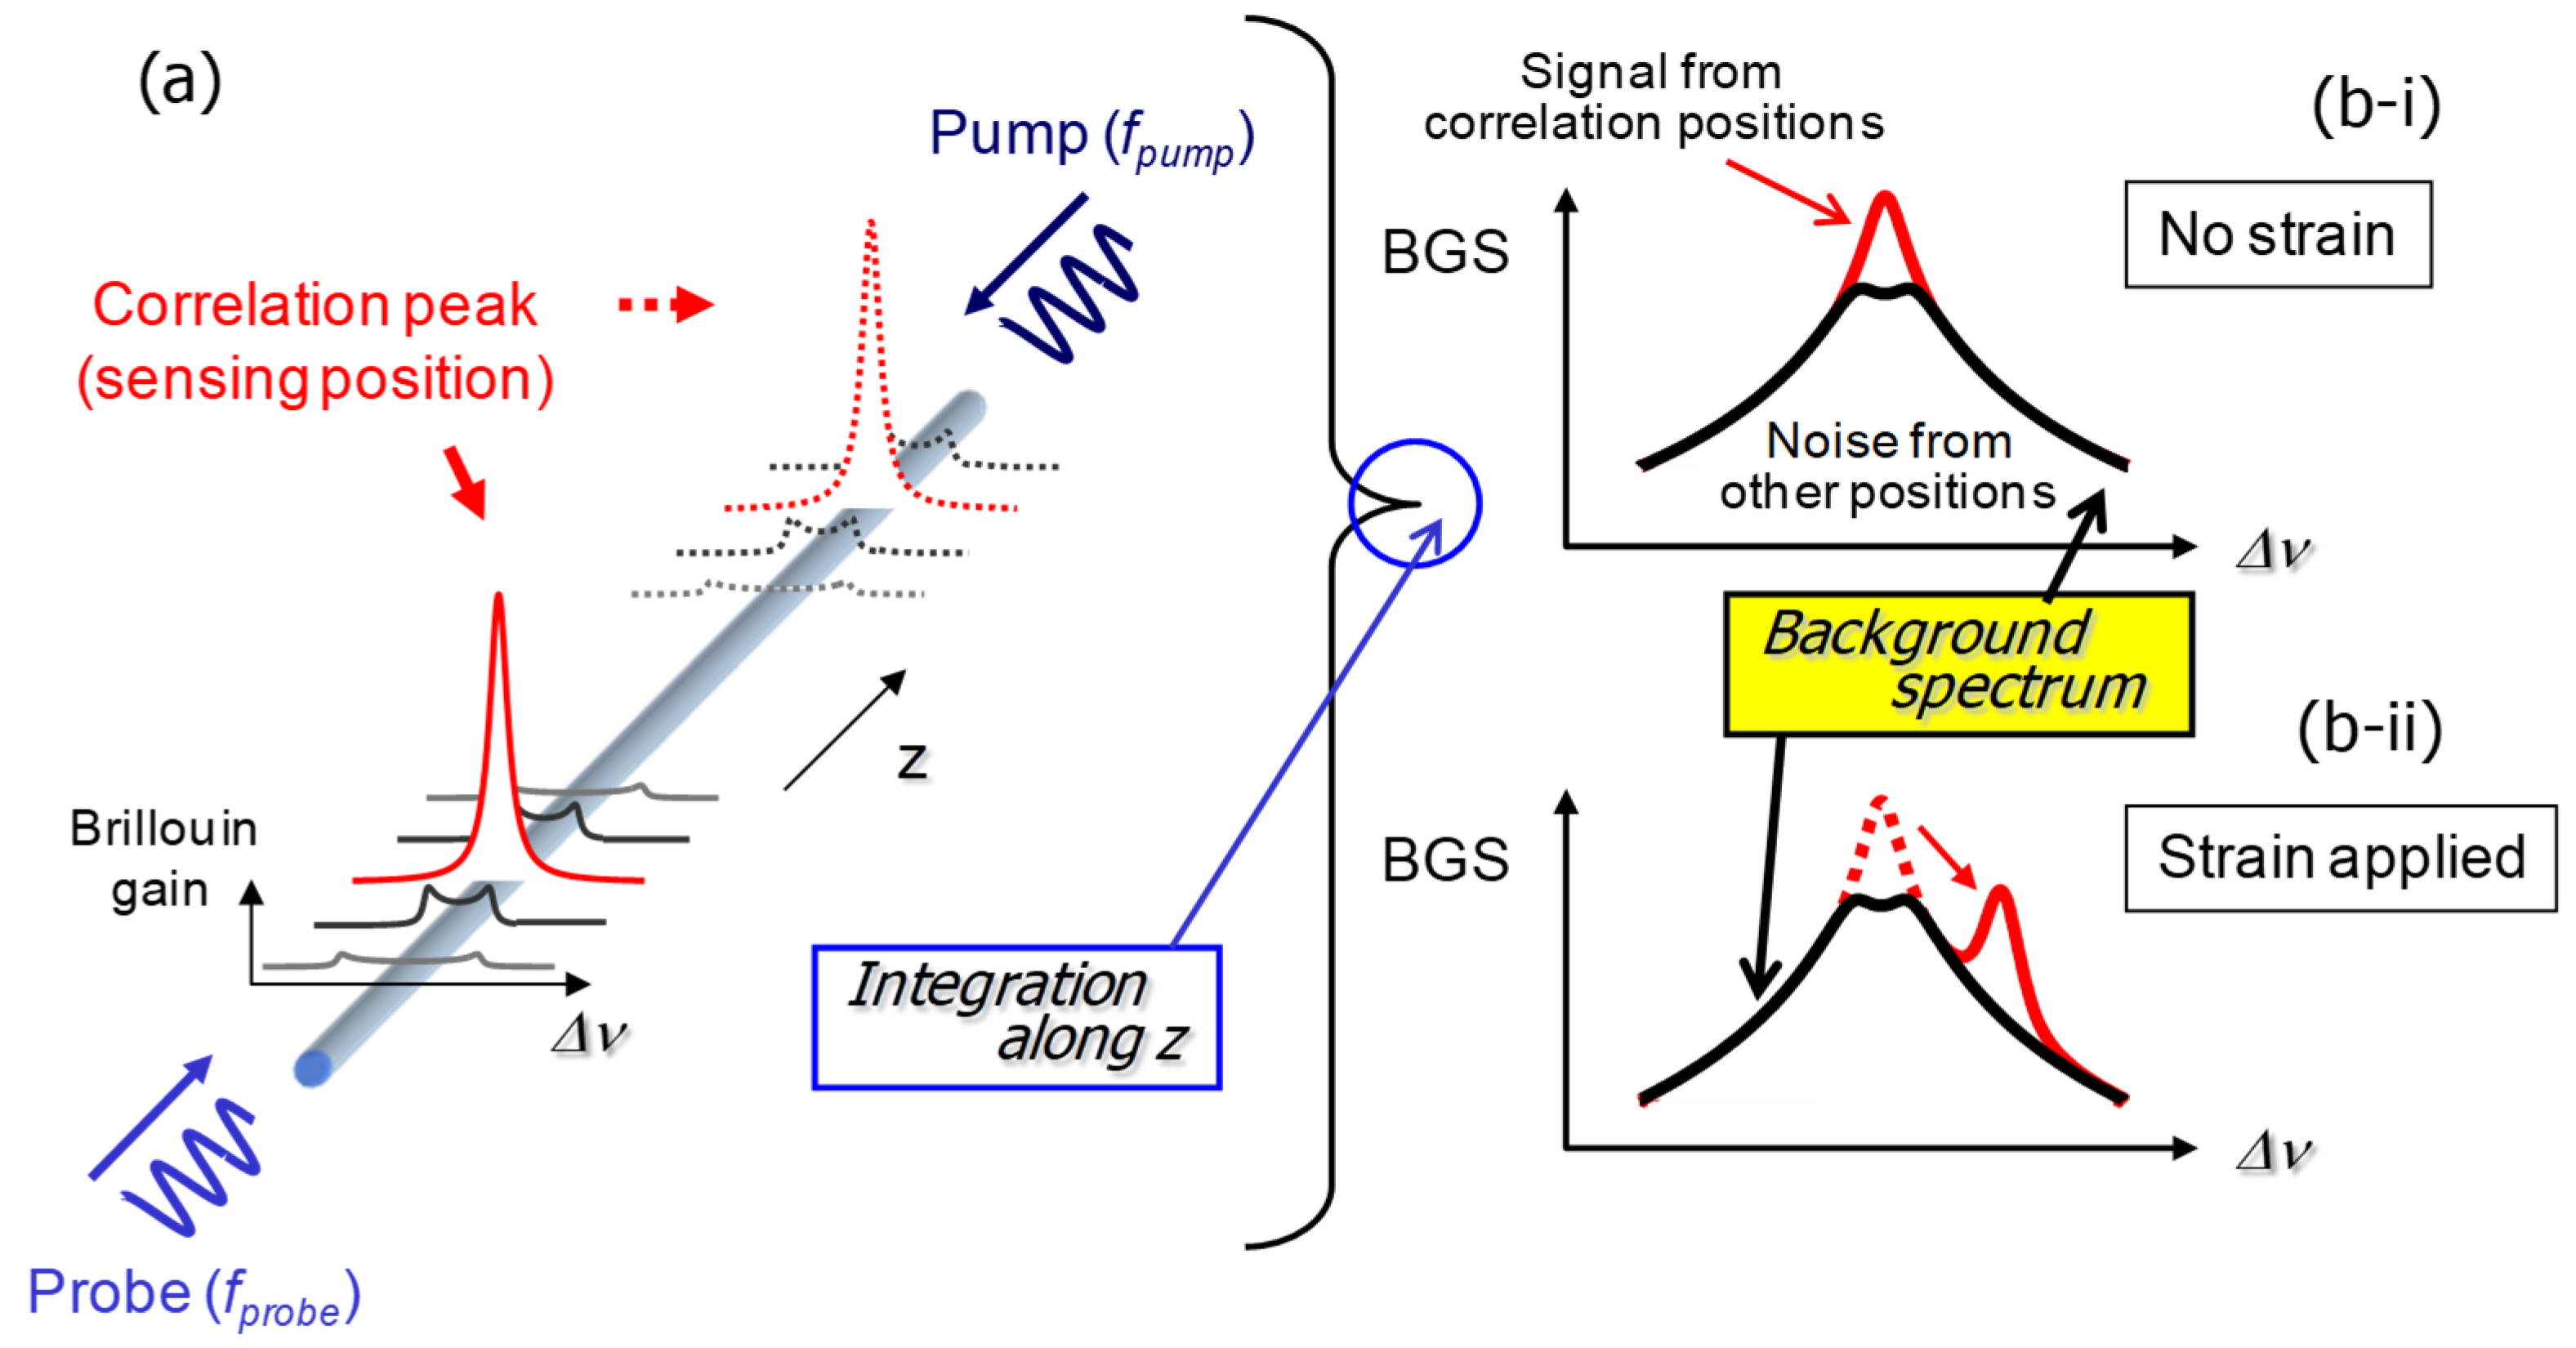
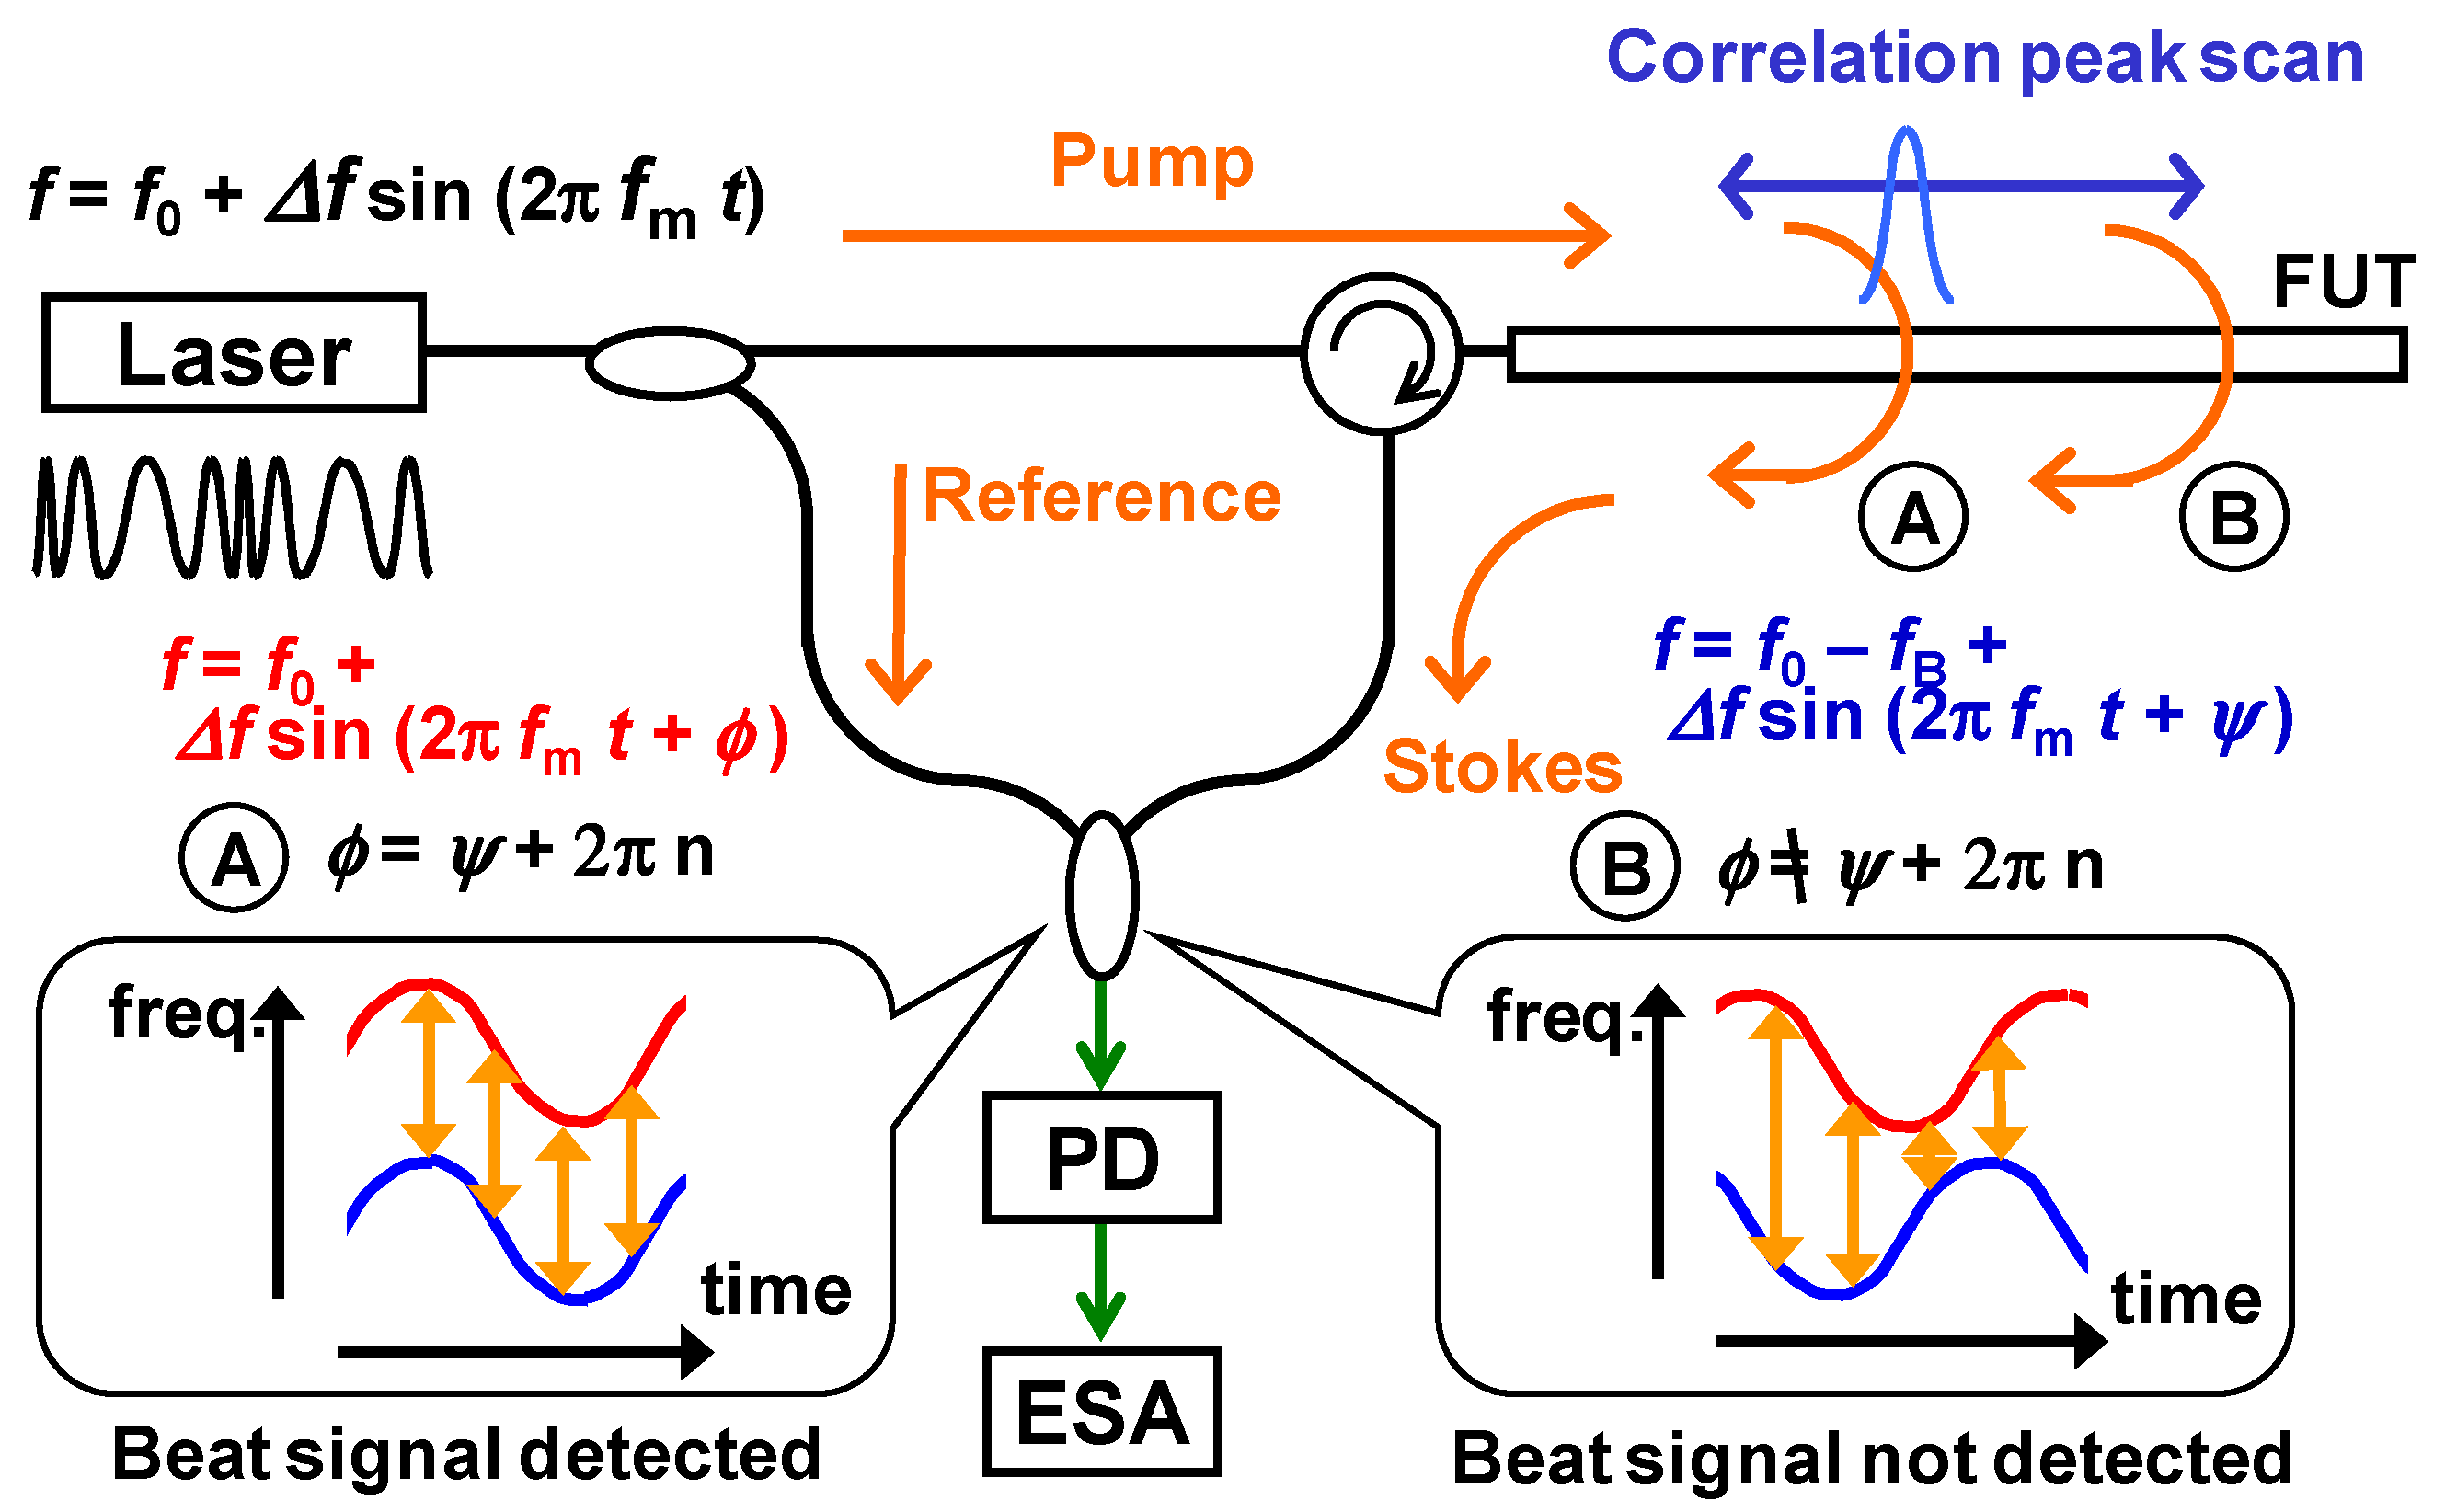
Figure 19a shows the first setup of the BOCDA [8]. The frequency difference between the pump and the probe is generated by an optical intensity modulator driven by a microwave with around 11 GHz of frequency. The carrier-suppressed condition is satisfied, and the first lower sideband is used as the probe wave. The SOCF was performed simply with a sinusoidal frequency modulation to the LD by utilizing its direct frequency modulation nature with the input current modulation. By adjusting the FM frequency and the sensing fiber length, which is the fiber length between the isolator and the 10-dB fiber coupler in Figure 19, only one correlation peak position appears within the sensing fiber portion. Then, the position-selective measurement can be realized. The measurement position, or the correlation peak position, can easily be changed with the FM frequency change. Both the distributed measurement and the random-access measurement can easily be selected.
As schematically shown in Figure 19b, the BOCDA output spectrum that is obtained at the end of the fiber has the total shape of a hill-like background and a tower-like signal spectrum. The tower-shaped component at the top of the hill corresponds to the BGS at the correlation peak position.
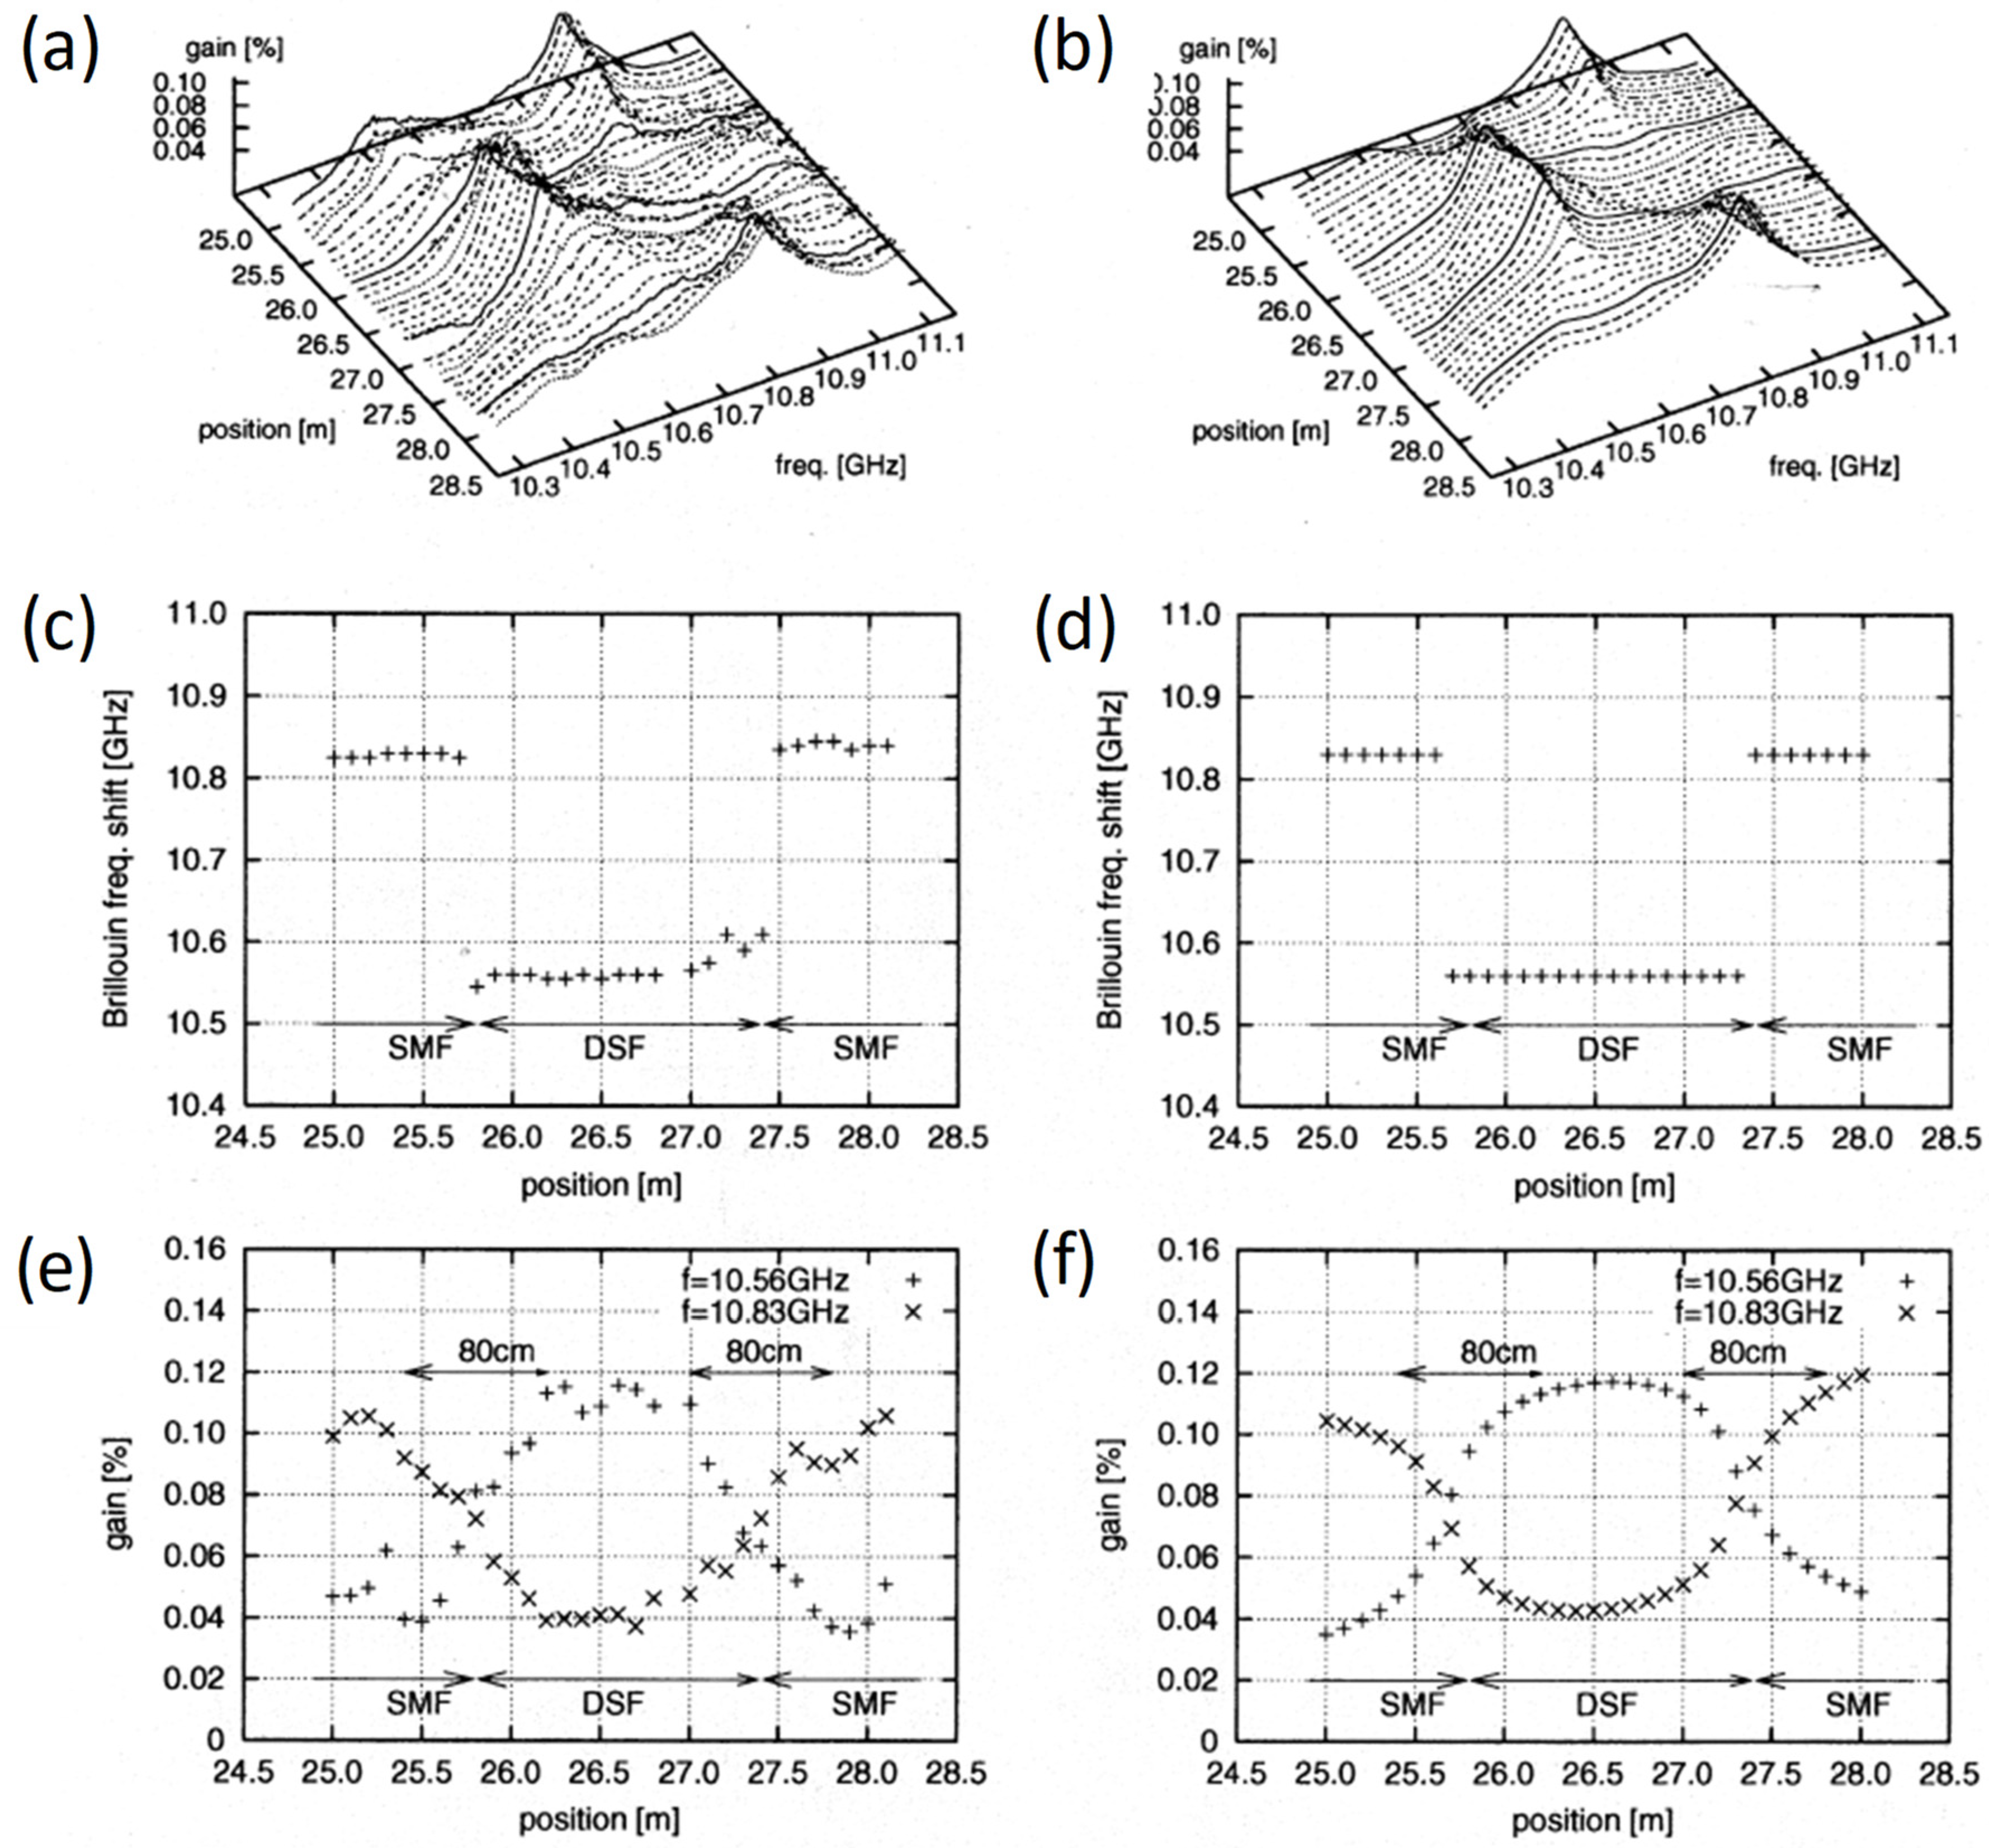
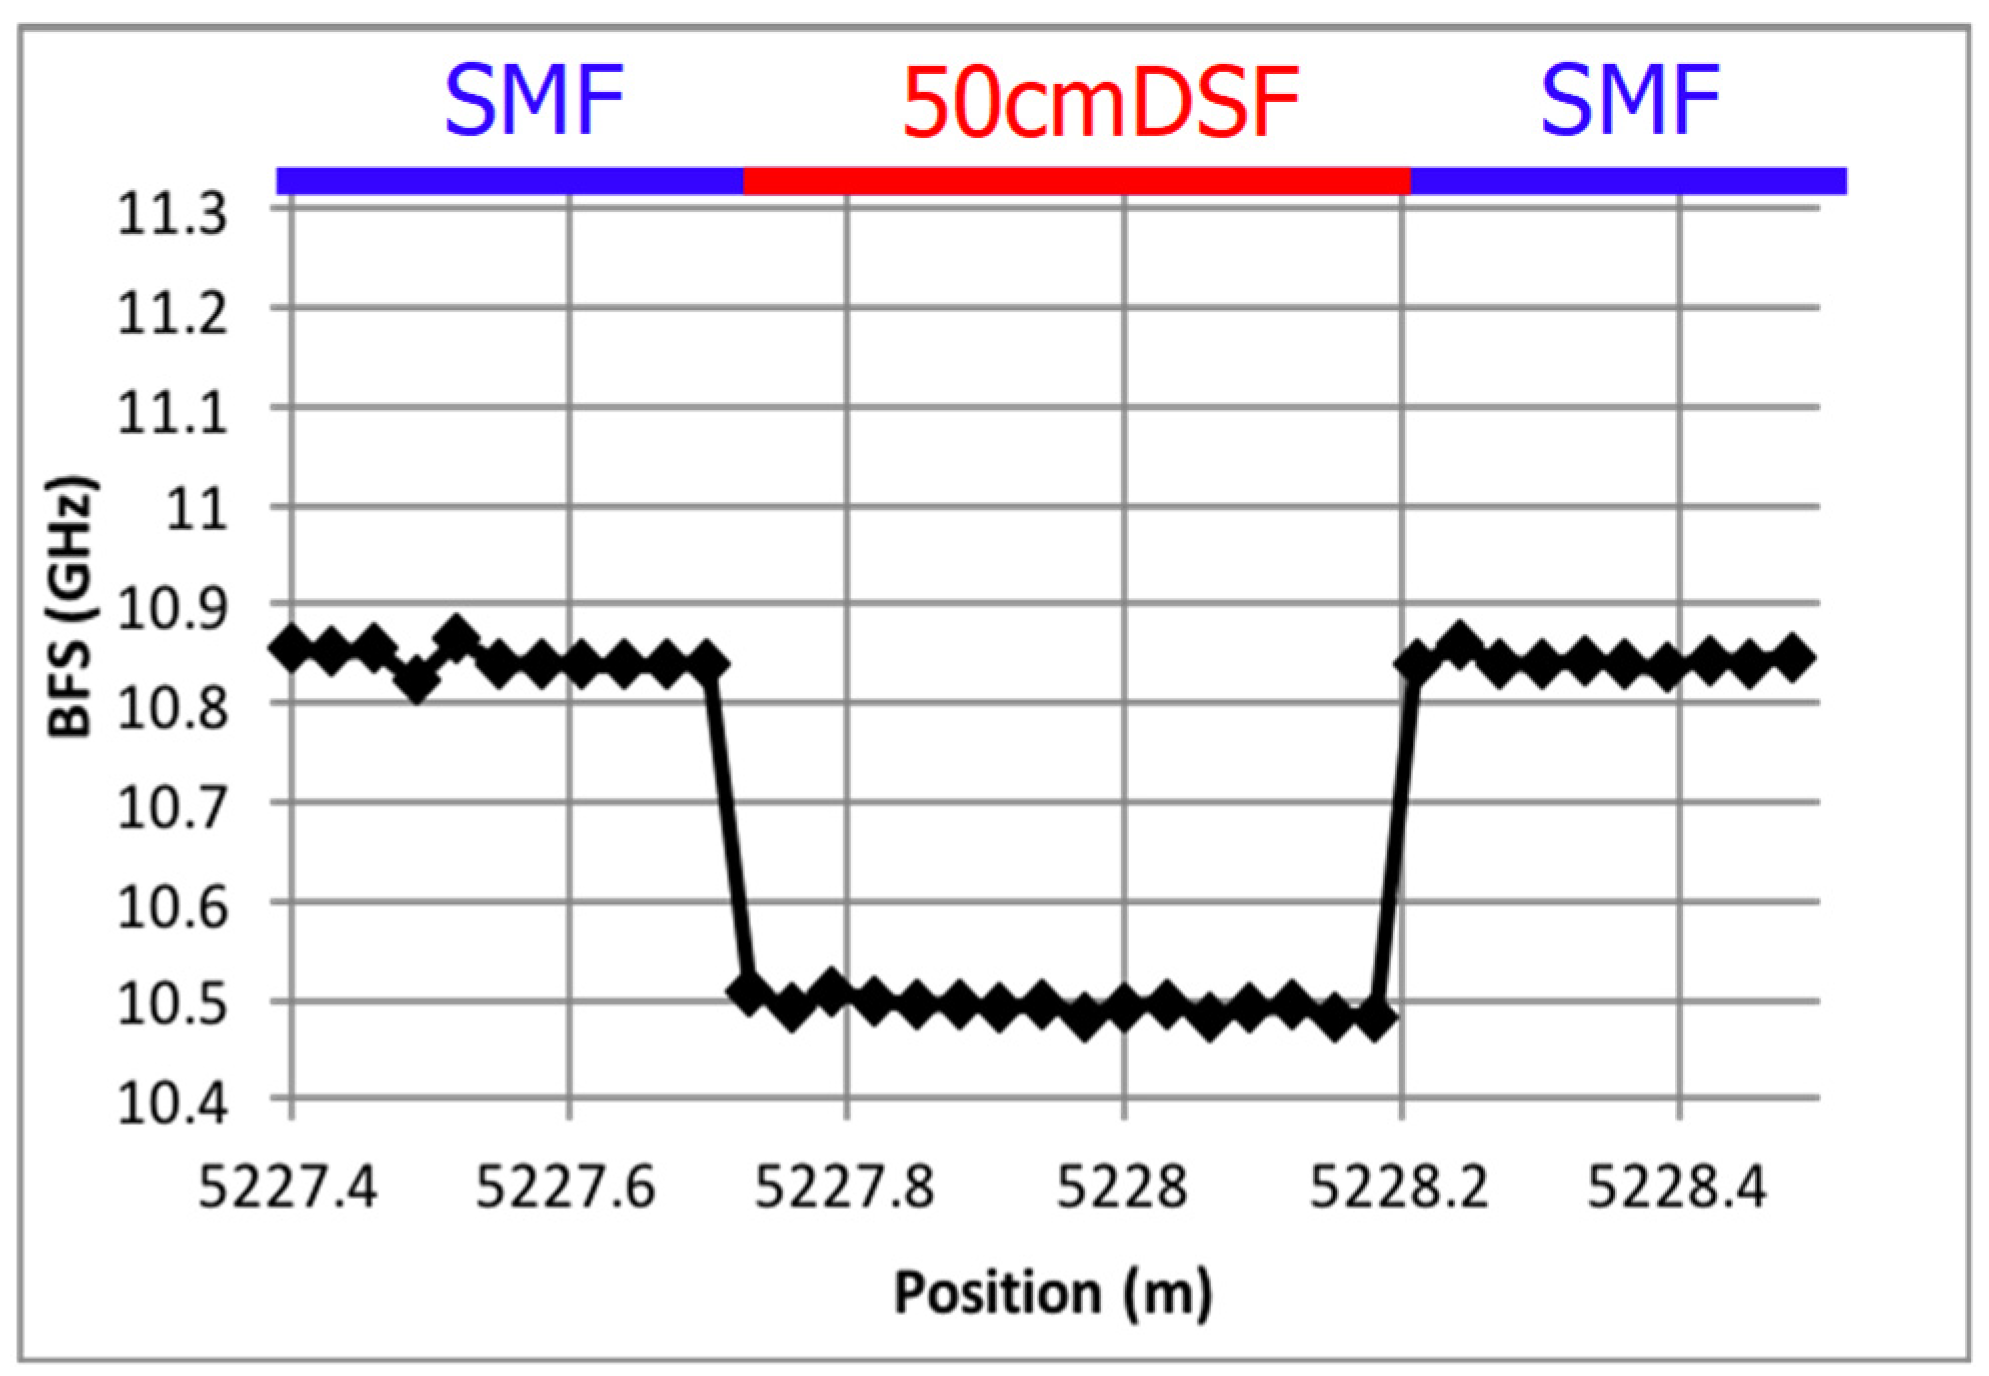
In Figure 20, the experimental results and simulation results are compared in a distributed measurement of BGS [8]. The fiber under test is composed of an ordinary single mode fiber with 10.83 GHz BFS and a 150-cm section with 10.56 GHz BFS. Figure 20a,c,e are for the experiments, and Figure 20b,d,f are for the simulation. Figure 20a,b show the BGS distribution, while Figure 20c,d show the BFS distribution. Figure 20e,f show the intensity distributions for the two BFS of 10.83 GHz and 10.56 GHz, respectively [8].
In theoretical investigations, the basic formula describing the distributed measurement mechanism of the BOCDA is derived [8,50], which is expressed as:
g ( t m , ω d ) = v g P 1 ¯ A e f f d ζ d ω 2 π g B ( ζ , ω ) S b p 0 ( ε τ ζ , ω d ω )
where gB is the intrinsic Brillouin gain spectrum as a function of frequency ω and the position along the fiber ζ, and Sbp0 is the beat spectrum that has the delta function-like shape, which is generated by the FM on the lasering frequency. In Equation (1), ωd represents the pump-probe frequency difference, vg represents the group velocity of the lightwave, P1 the time-averaged power, and Aeff is the effective fiber core area, respectively. We denote the modulation period as tm, which corresponds to the position along the fiber in this approximation [8,50], and its relative variation from a certain standard tm0 as ε= (tm0tm)/tm0. We assume that the delay τ at the correlation peak that is used for the measurement is N times as large as the modulation period; that is, τ = Ntm0/2. The explanation of Equation (1) is seen in Ref. [50] in detail, but the equation means that the BOCDA output spectrum is the two-dimensional convolution integral between the intrinsic BGS and the beat spectrum.
The spatial resolution is also derived in the theory as [8,50]:
Δ z = c Δ ν B 2 π n f m Δ f   for   Δ ν B > f m
Δ z = 1.52 c 2 π n Δ f   for   Δ ν B < f m
where c is the light speed in vacuum, n is the refractive index of the fiber, fm is the laser modulation frequency, ΔνB is the Brillouin spectrum width, and Δf is the FM amplitude.
Due to the periodical sinusoidal modulation for the FM, the correlation peaks are generated periodically, whose interval d is also derived as [8,49]:
d = c 2 n f m
The peak interval decides the basic measurement range in the basic BOCDA system. Schemes to elongate the measurement range have already been developed, which are shown in this paper later.

4.3. Overview of Performance Improvement Schemes for BOCDA

Besides the basic configuration of the BOCDA shown in Figure 19a, various schemes for performance improvement are proposed and developed. Before describing examples of the setups with the schemes, an overview for the performance improvement schemes is shown here.

4.3.1. Intensity Modulation Scheme to Reduce Background Spectrum
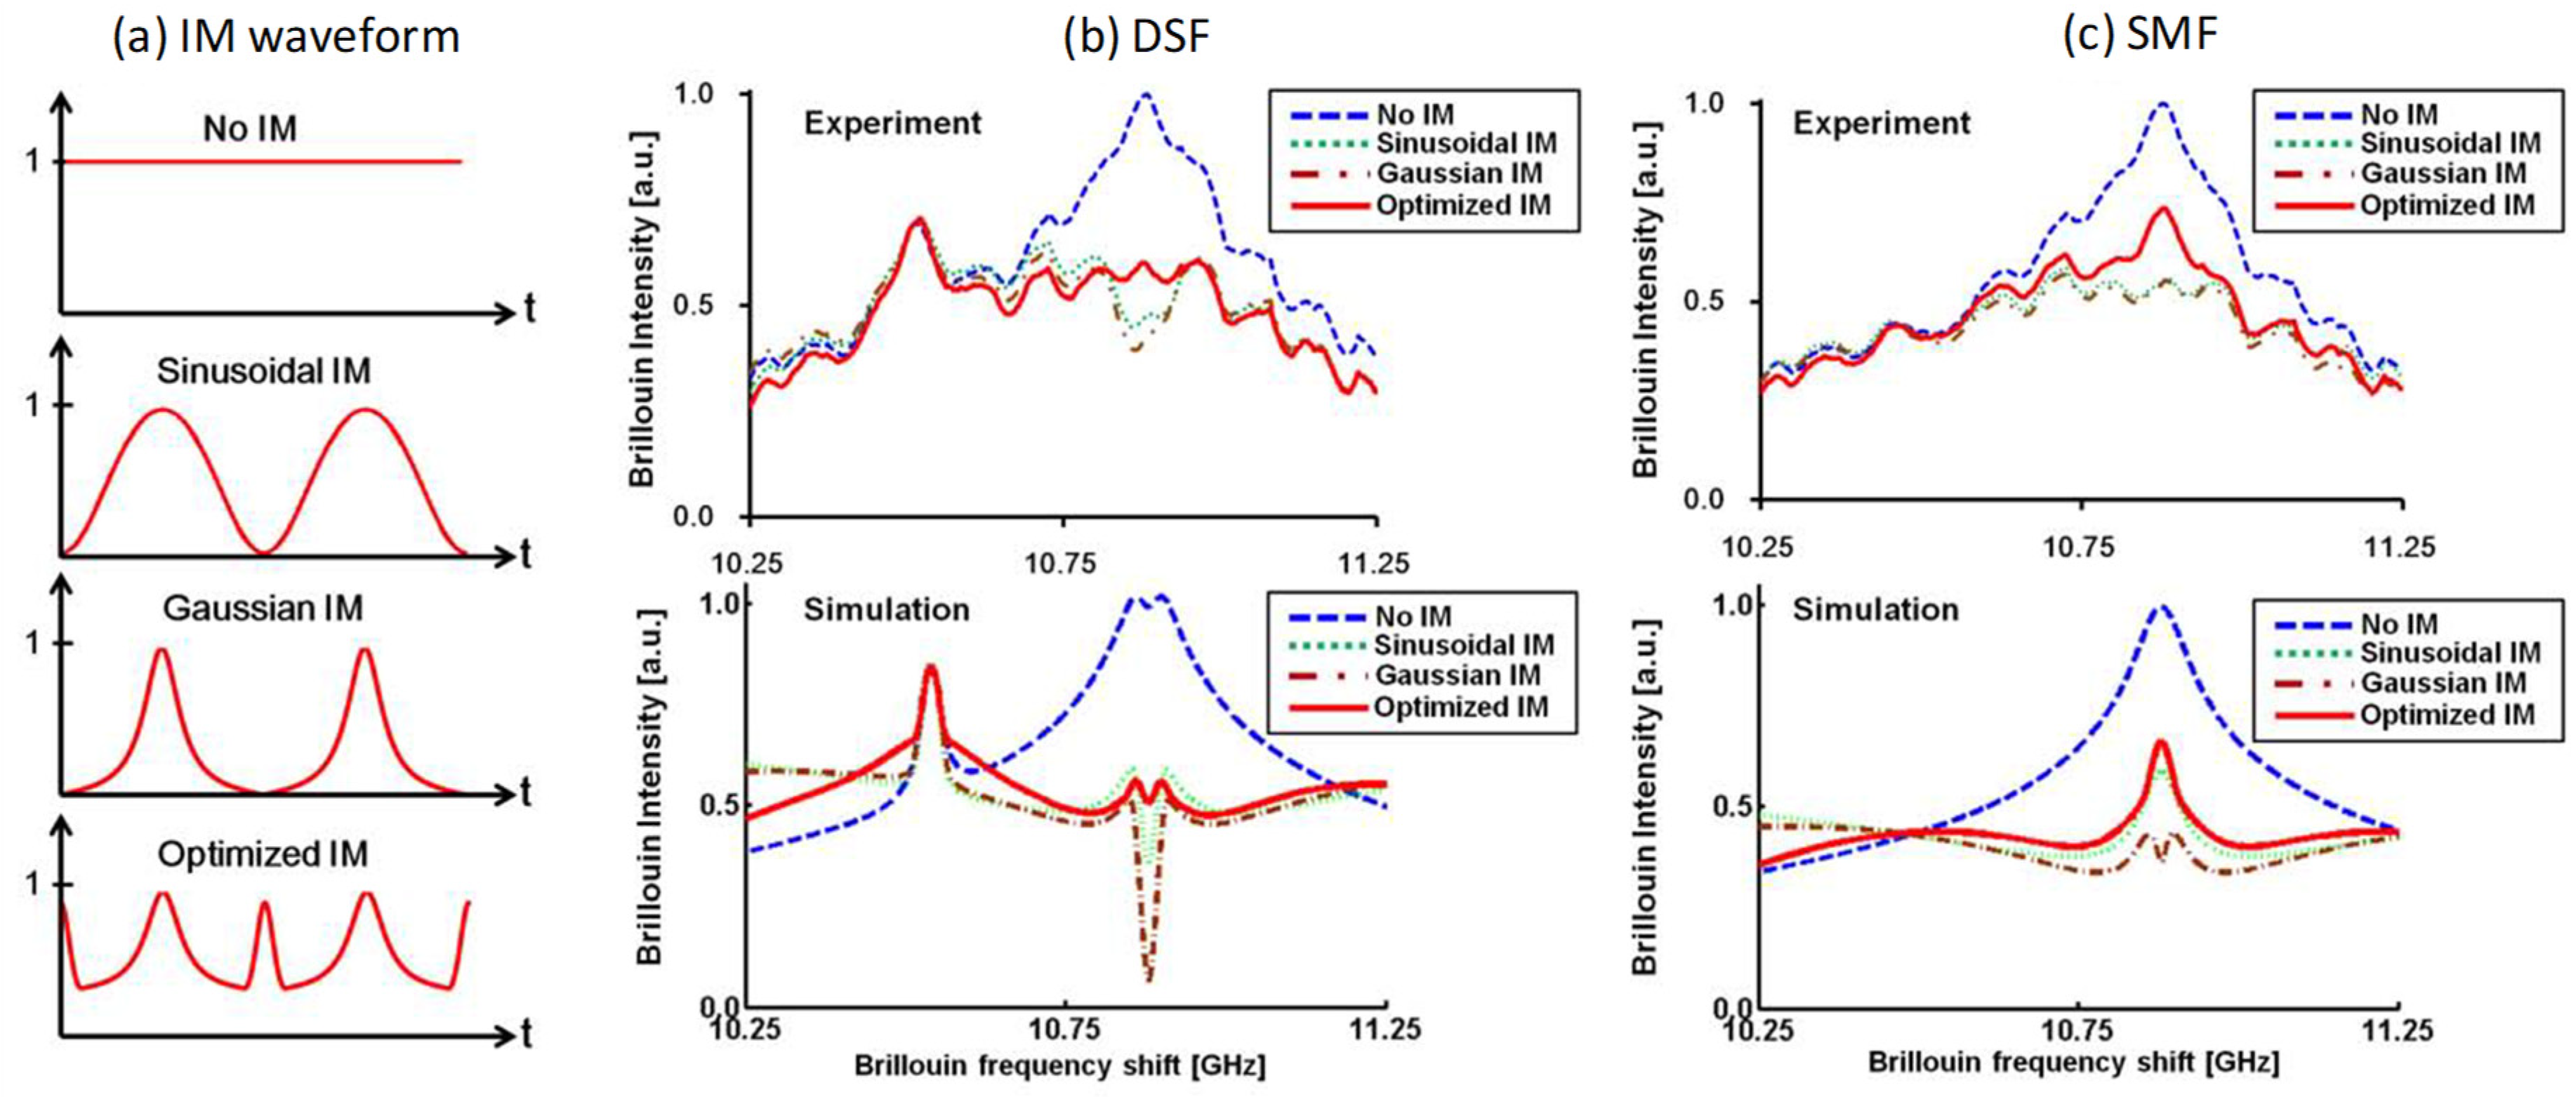
As shown in Figure 19b, the BOCDA output spectrum includes the hill-like or the mountain-like background spectrum, besides the signal spectrum corresponding to the correlation peak position. The origin of the background spectrum is caused at both sides of the correlation peak position, where the side lobes are generated by the LD FM modulation. Considering the SOCF technology, we proposed and studied a way that was named the “intensity modulation scheme” to reduce the side lobes [51]. By the FM modulation on the LD with a sinusoidal waveform, the time-averaged LD power spectrum has peaks at both sides of the spectrum shape, as shown in Figure 9b. The shape of the time-averaged LD power spectrum and the coherence function shape is also roughly related by a Fourier transform in the BOCDA case. Then, the side lobes could be reduced by manipulating the time-averaged LD power spectrum shape, so that the power at both edges of the spectrum is reduced. We have successfully reduced the mountain-like background by the intensity modulation scheme. A detailed description is shown in the next section.

4.3.2. Differential Measurement Scheme to Reduce Background Spectrum

Another way to reduce the background spectrum was invented by Professor K. Y. Song et al. [52], which is called the “differential measurement scheme” [
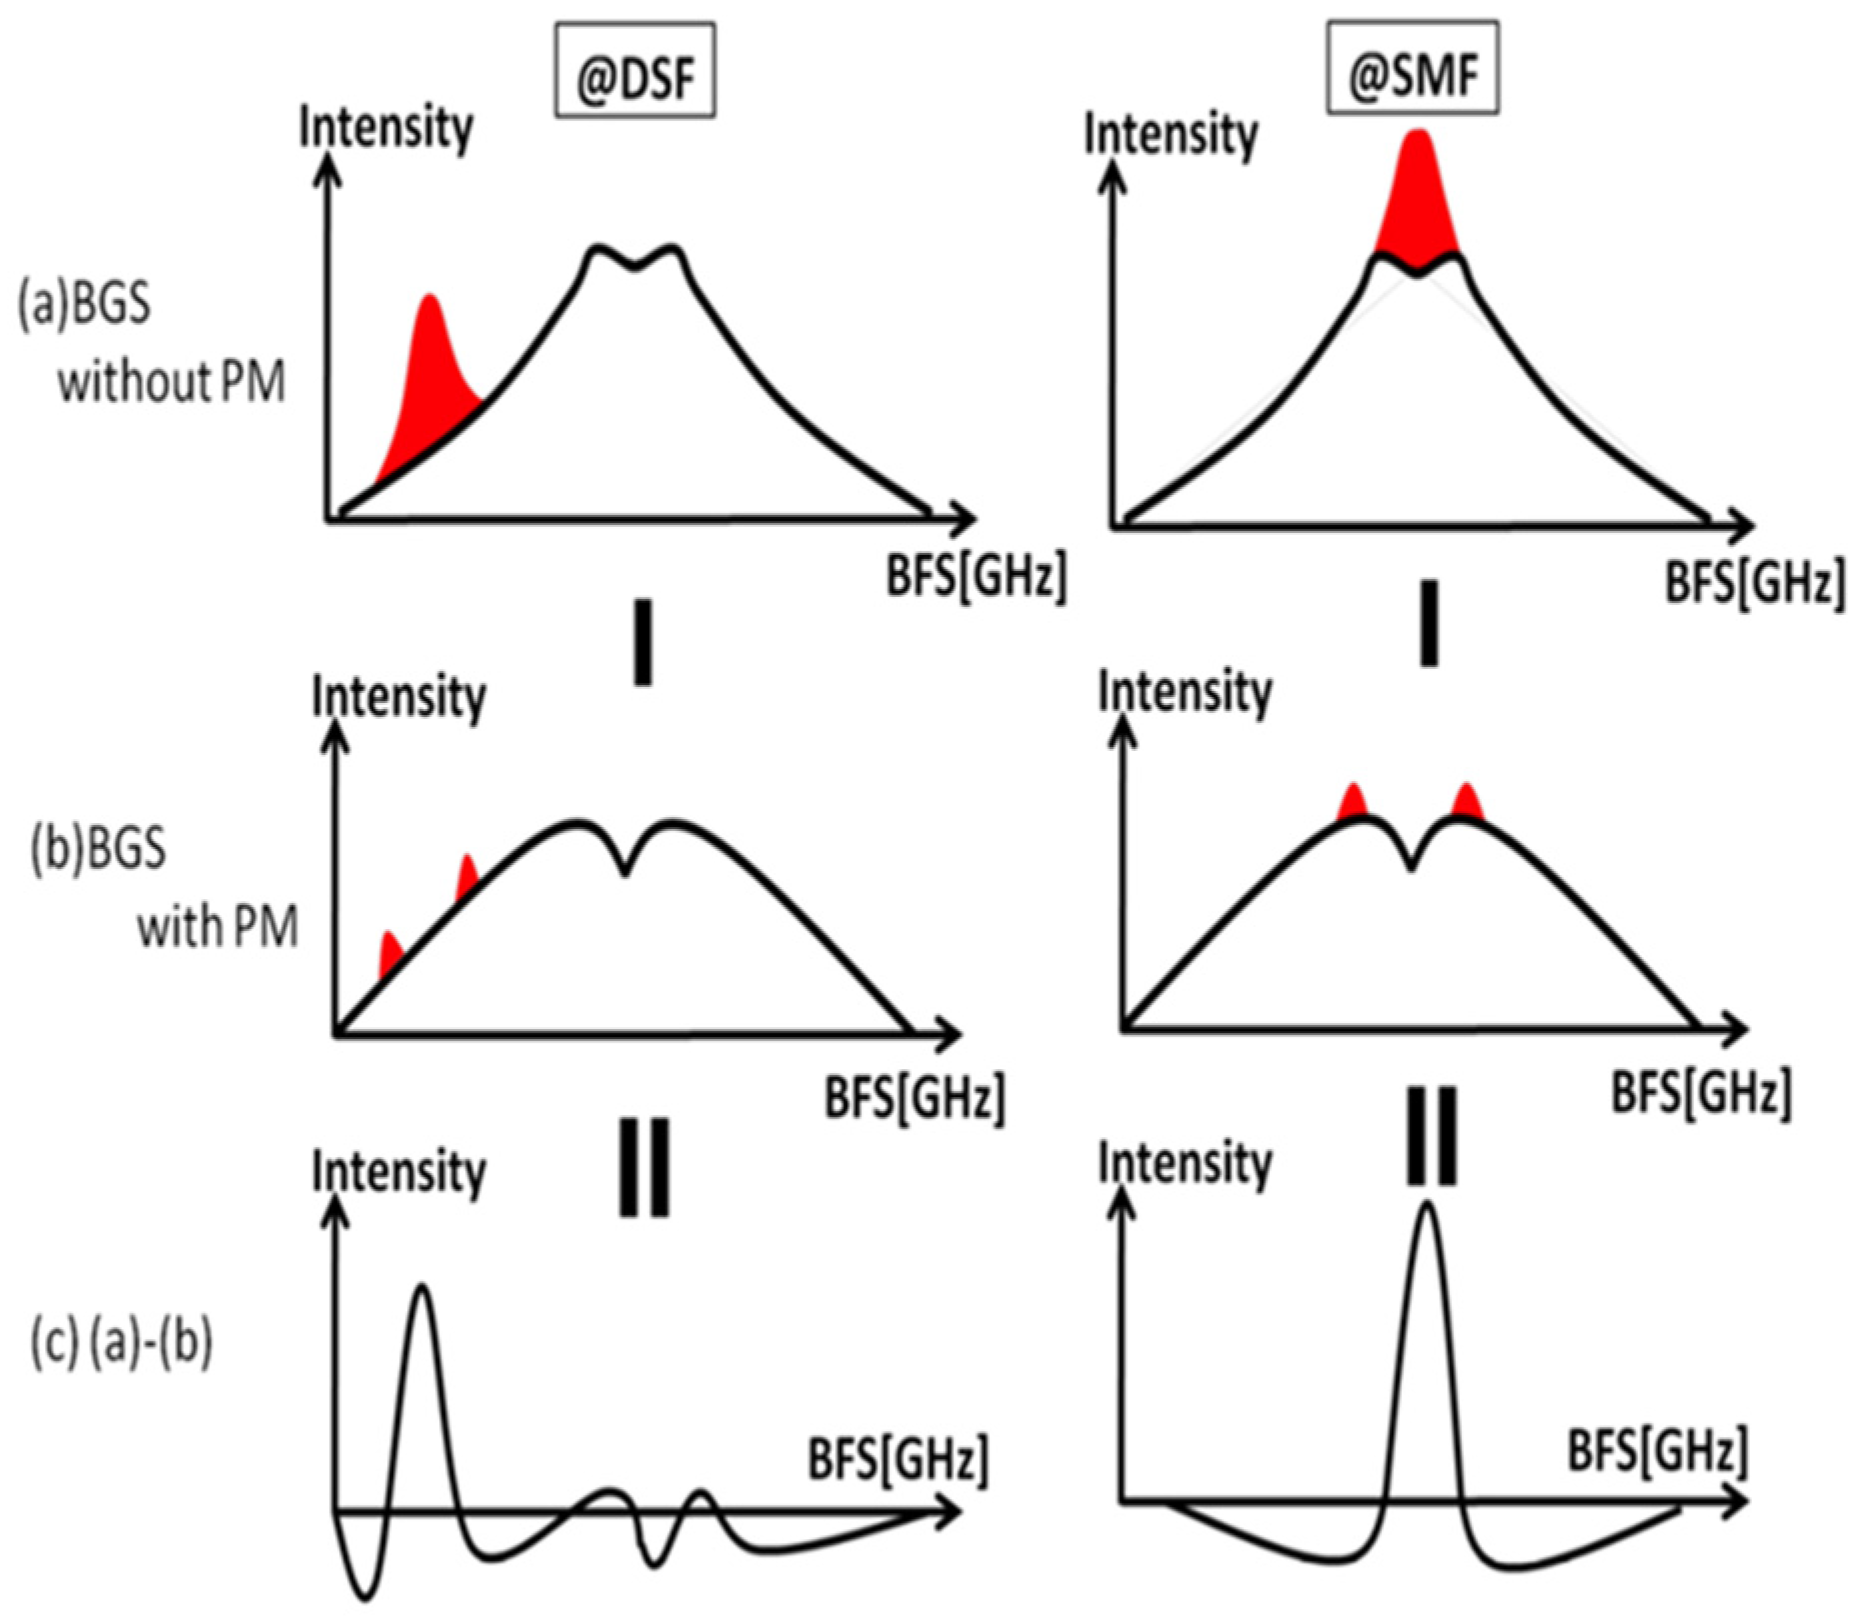
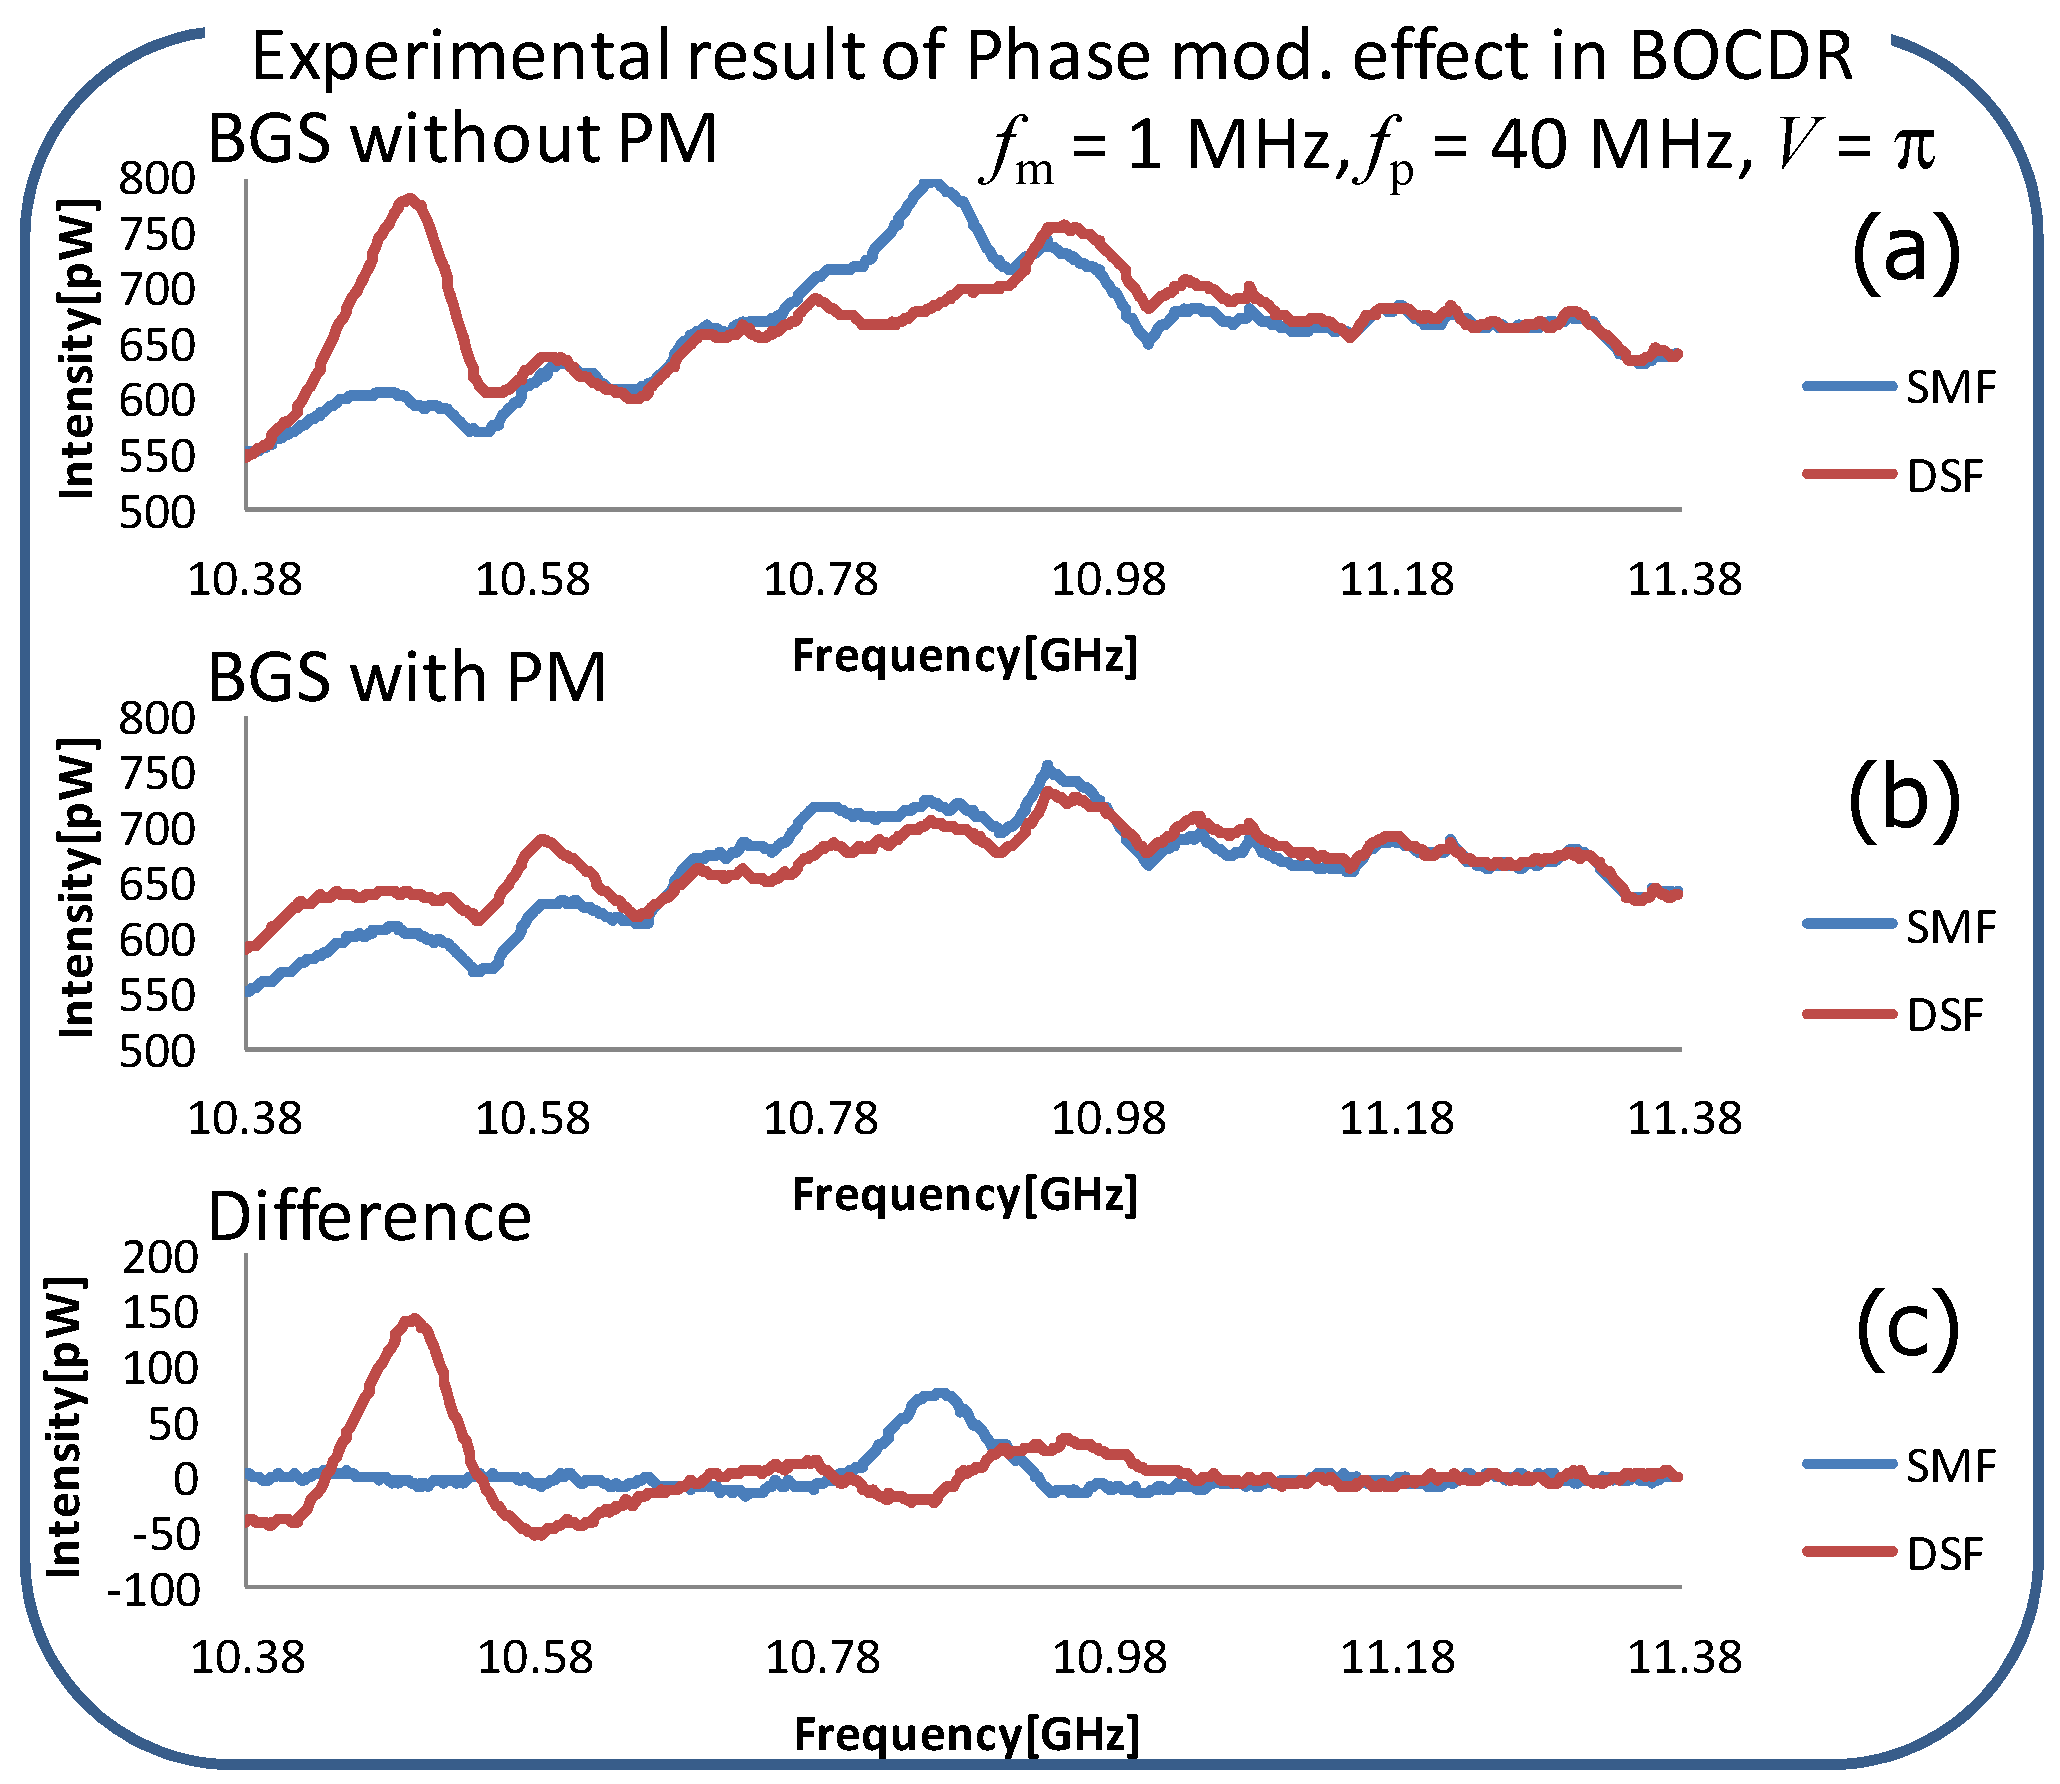
52]. In this scheme, a phase modulator is introduced in either the pump or probe path. By the PM modulation, the shape of the signal that was spectrum caused at the correlation peak position was much deteriorated, but the background spectrum shape was not so affected. Then, by calculating the difference between the BOCDA spectra of the two cases with and without the PM, the background spectrum is reduced to clearly show the signal spectrum peak. This scheme is also effective for the BOCDR. The detail of the scheme is shown in the chapter for the BOCDR.

4.3.3. Temporal Gating Scheme to Elongate Measurement Range

Multiple correlation peaks are generated by the FM along the sensing fiber periodically; then, the sensing fiber length is inherently limited to the interval between the neighbor correlation peak positions in the basic BOCDA system. By using a rather low FM frequency, the range can be elongated. However, the spatial resolution has to be limited in this case, which is indicated by equations (2) and (3). Then, to elongate the measurement length of the fiber, a “temporal gating scheme” has been proposed and developed, in which the pump lightwave is modulated in its intensity to have the pulsed shape with the width equal to the correlation peaks’ interval [53,54]. The BOCDA output is also gated with the same width to select only one correlation peak position. Then, the total measurement range is elongated. This scheme is shown in the next section in detail.

4.3.4. Double Modulation Scheme to Elongate Measurement Range

Another scheme for the elongation of the measurement range is called the “double modulation scheme”. When the LD FM is done with the two FM frequencies, whose frequencies ratio is just an integer, the lower frequency creates a longer measurement range, and the higher frequency creates a higher spatial resolution. Then, the measurement range can be elongated while keeping the higher spatial resolution. The detail of the scheme is explained in the BOCDR section [55]. Even when the ratio between the two frequencies is not an integer, we can also elongate the total measurement range [56].

4.3.5. Time Division Polarization Diversity Scheme to Reduce Polarization-Induced Noise

When the sensing fiber is an ordinary single mode fiber, the state of the polarization (SOP) can easily be changed under the lightwave propagation along the fiber, which creates a rather large fluctuation in the BOCDA output. To reduce the difficulty, a scheme named the “time-division polarization diversity scheme” is proposed [57]. In the scheme, the probe lightwave polarization is switched between the orthogonal SOPs, such as the two orthogonal linear polarizations. The two BOCDA outputs that correspond to the two SOPs are measured, and these are then squared and added together. This calculated value is stabilized against the SOP fluctuation. The stabilization is guaranteed by the optical fiber’s “unitary” nature, in which the two orthogonal SOPs are always orthogonal with each other, even when the shapes of the SOP are changed by the perturbation in the fiber.

4.3.6. Double Lock-In and Beat Lock-In Scheme to Enhance Spatial Resolution and Reduce Reflection-Induced Noise

In the basic BOCDA system, only the pump lightwave is modulated in its intensity for the lock-in detection to enhance the S/N ratio. In the system, there are several fiber connection points or splicing points, which have the possibility of making the back reflection. These reflections act as noise, which cannot be eliminated by the lock-in detection, because the reflected waves are also modulated by the IM for the lock-in detection. To overcome the difficulty, a “double lock-in and beat lock-in scheme” [58] has been proposed. In these schemes, the probe lightwave is additionally modulated for the additional lock-in detection. In the double lock-in scheme, two synchronous detections are done in tandem, with the two intensity modulation frequencies. In the beat lock-in scheme, only one synchronous detection is done with the beat frequency between the two IM frequencies. The influence of non-desired back reflection and Rayleigh backscattering is dramatically reduced. An example of the scheme is shown in the next section. This scheme is also effective when we enhance the spatial resolution by applying a large FM amplitude.

4.3.7. Time-Division Pump and Prove Generation Scheme to Simplify the System

The pump and the probe lightwave must have a frequency difference around the BFS to induce the stimulated Brillouin scattering. Additionally, the difference should be swept to have the shape of the BGS. To do so, in the basic BOCDA setup, a lightwave frequency shifter or a single side-band modulator (SSBM) is set and used in the system. However, the SSBM is an expensive device. To overcome the difficulty, a “time division pump and probe generation scheme” has been proposed and developed [59]. In this scheme, the LD driving current waveform consists of the sinusoidal waveform to realize the SOCF function, and the square-like waveform for the “time-division pump and probe generation”. In the latter waveform, the amplitude corresponds to the frequency difference between the pump and the probe lightwave. In practice, a modification of the shape of the square-like waveform is required, because of the frequency response of both the LD itself and the current driving circuit. The manipulation way for the shape of the square-like waveform has been proposed and used. The details are described in the next section.

4.3.8. Longitudinal Sweeping Scheme to Enhance the Speed for Entire Distribution Measurement

The specific BOCDA feature is the random accessibility. However, some applications simply require a high-speed measurement of the entire distributed information. For this requirement, modified BOCDA schemes have been proposed. In these schemes, the correlation peak is swept at first along the fiber axis while keeping the frequency difference between the pump and probe; then, the frequency difference is changed. This sequence is repeated to have all of the BGS at any positions along the fiber [60]. In these schemes, the random accessibility cannot be realized, but the measurement speed that has the entire distribution can be enhanced. This scheme is called the longitudinal sweeping scheme. We have demonstrated a system to realize a high-speed measurement of the entire distribution with 12 traces/s [61].
Another BOCDA system for this purpose has been demonstrated, in which the time-division pump–probe generation scheme is adopted. The point in the system is that the sinusoidal frequency modulation for the correlation peak generation is performed with different frequencies between the pump and the probe portion, by which the correlation peak can be automatically swept [62]. By additionally changing the lightwave frequency difference between the pump and the probe through simply changing the amplitude of the square-like LD injection current waveform, a longitudinal sweeping scheme can be realized. This scheme is called the “differential frequency modulation” scheme [62]. A high-speed measurement of the entire distributed information with 20 traces/s has been demonstrated [62]. This work was done with collaboration between our group and Professor K. Y. Song of Chung Ang University, Korea.

4.3.9. One-End Access Schemes

The basic system of the BOCDA basically has access configuration involving both ends to propagate the pump and the probe lightwave in opposite directions in the sensing fiber in relation to each other. On the contrary, one-end access BOCDA configurations have also been proposed and demonstrated. In some proposals, a reflection mirror or a fiber loop is set at the far end of the fiber to make the probe lightwave [63,64]. These configurations have the possibility of simplifying the sensing-fiber installation procedure. Recently, new works have also been presented [65].

4.4. Examples of Performance-Improved BOCDA Systems

In this section, examples of BOCDA systems with performance-improvement schemes are shown.

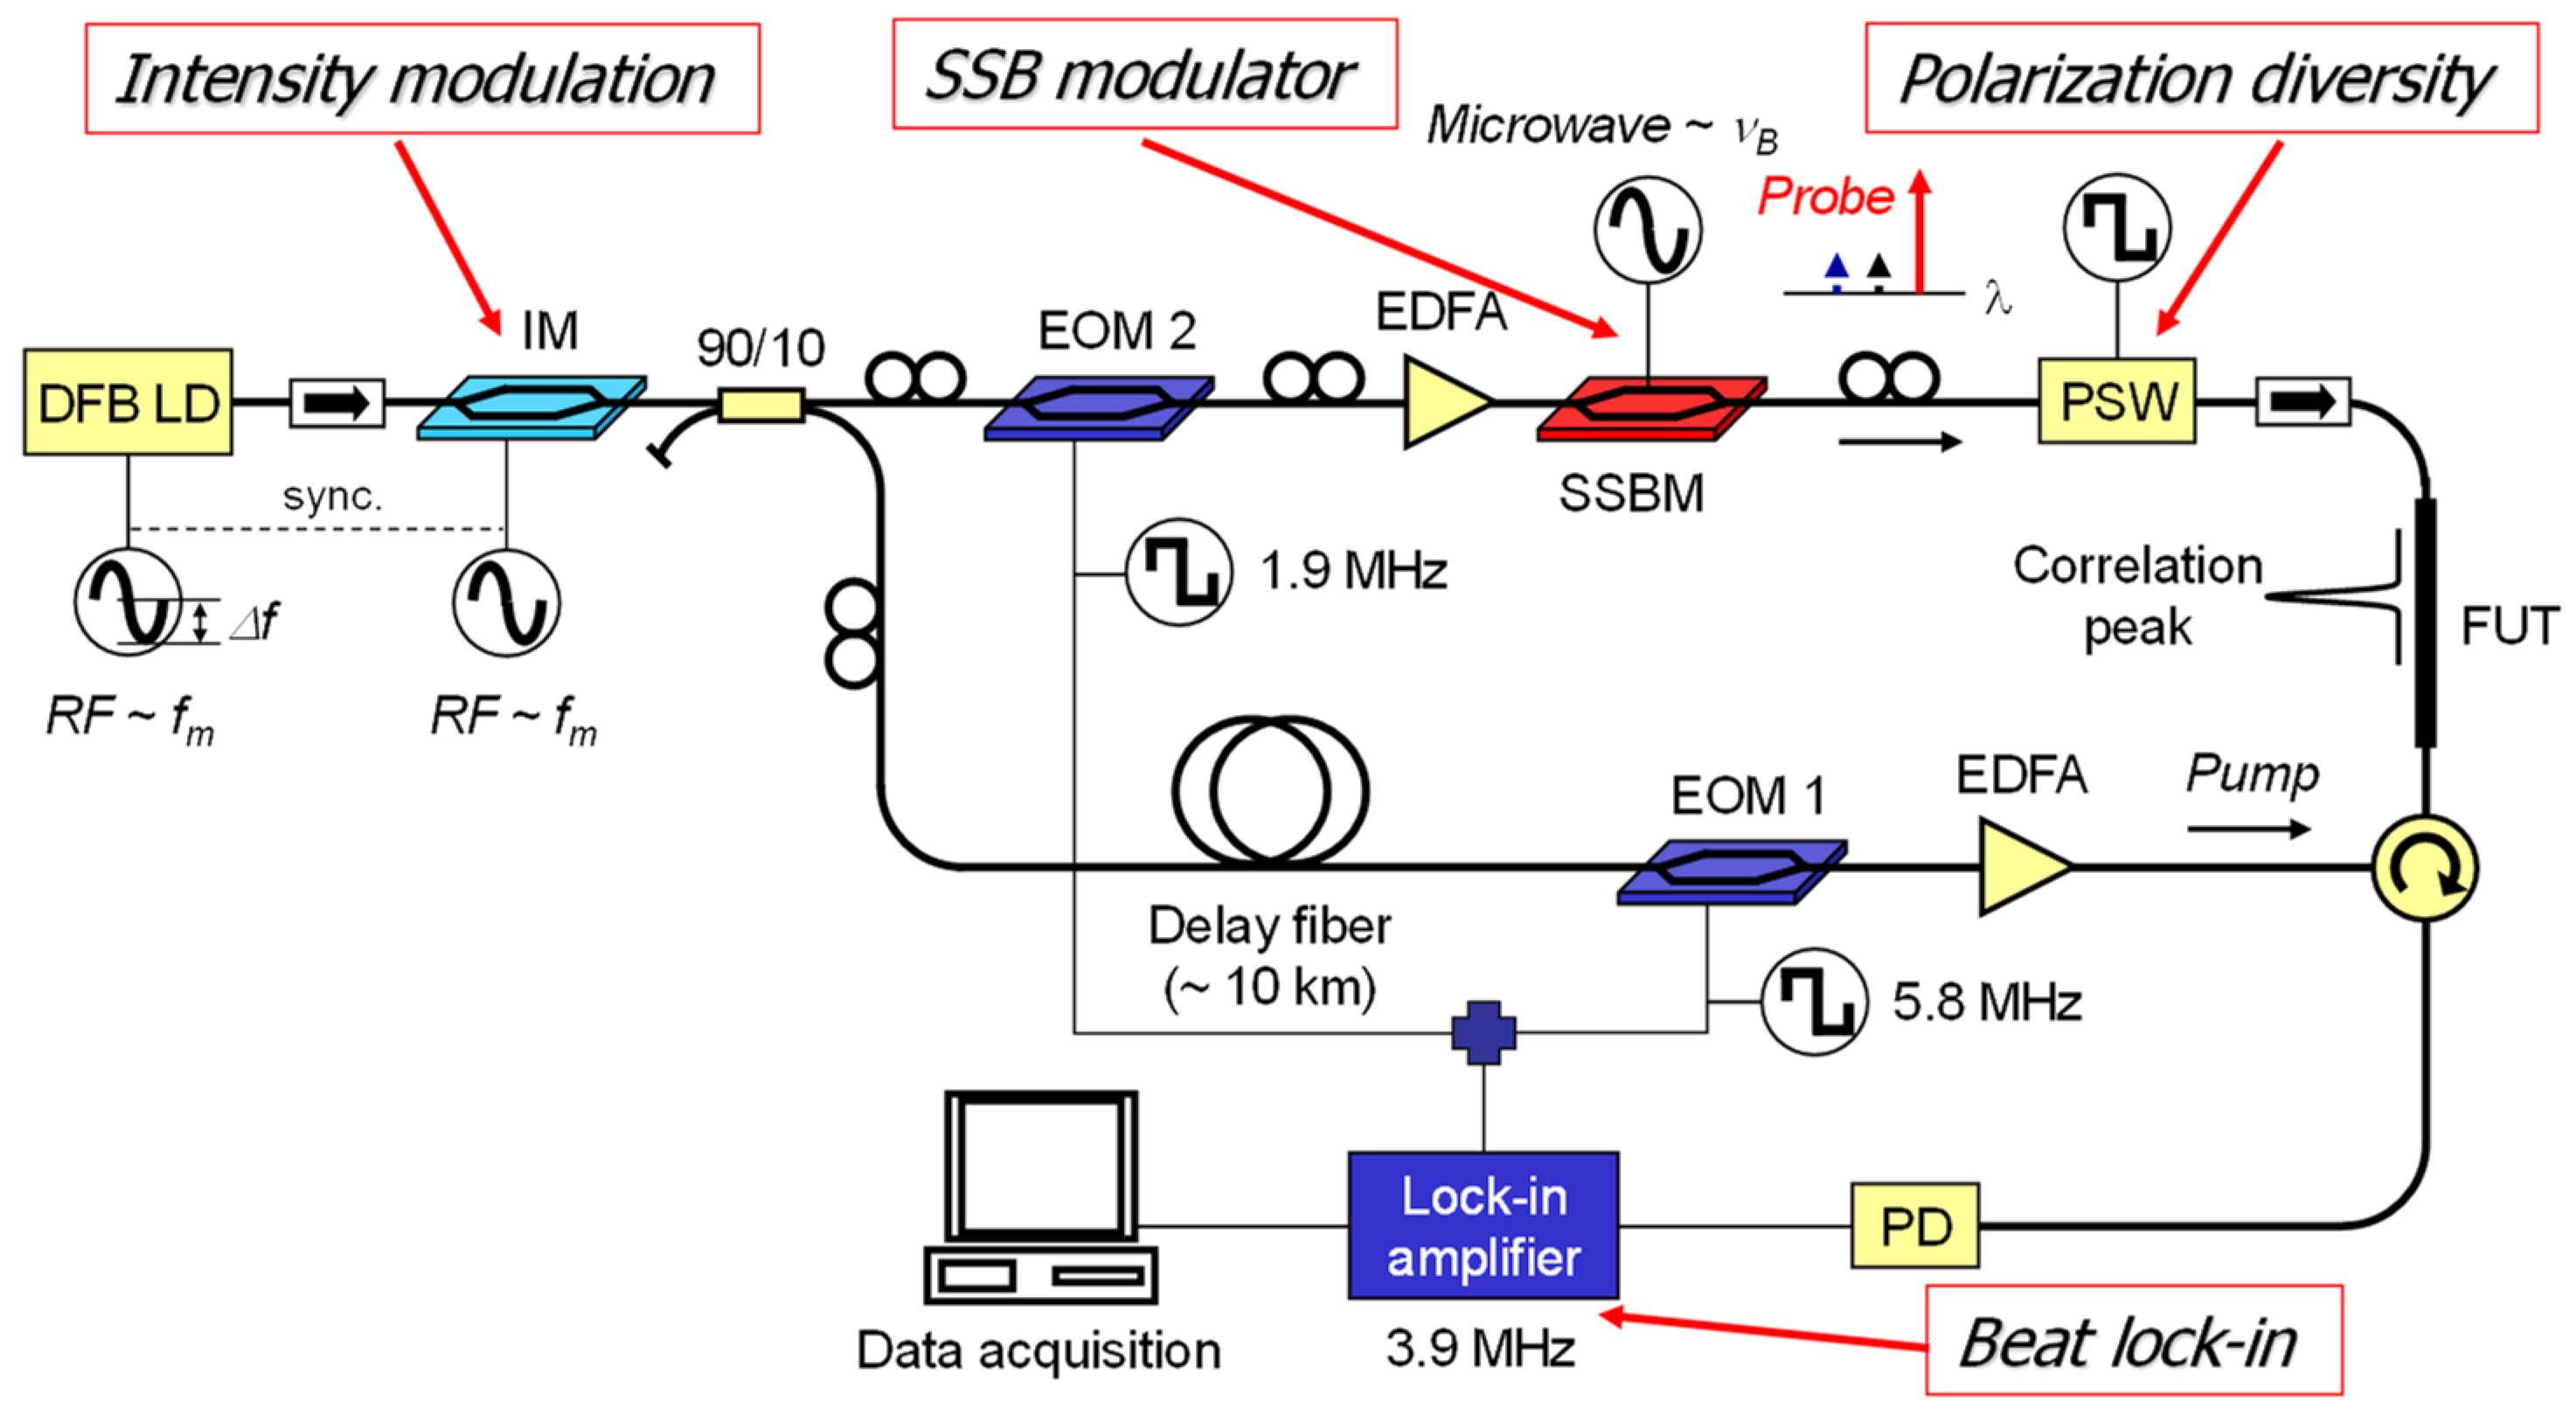
4.4.1. BOCDA System with Intensity Modulation Scheme

Figure 21 shows a BOCDA system that includes the three performance improvement schemes: the “intensity modulation scheme” [51], the “time-division polarization diversity scheme” [57], and the “beat lock-in scheme” [66]. Here, the IM scheme is explained in detail.
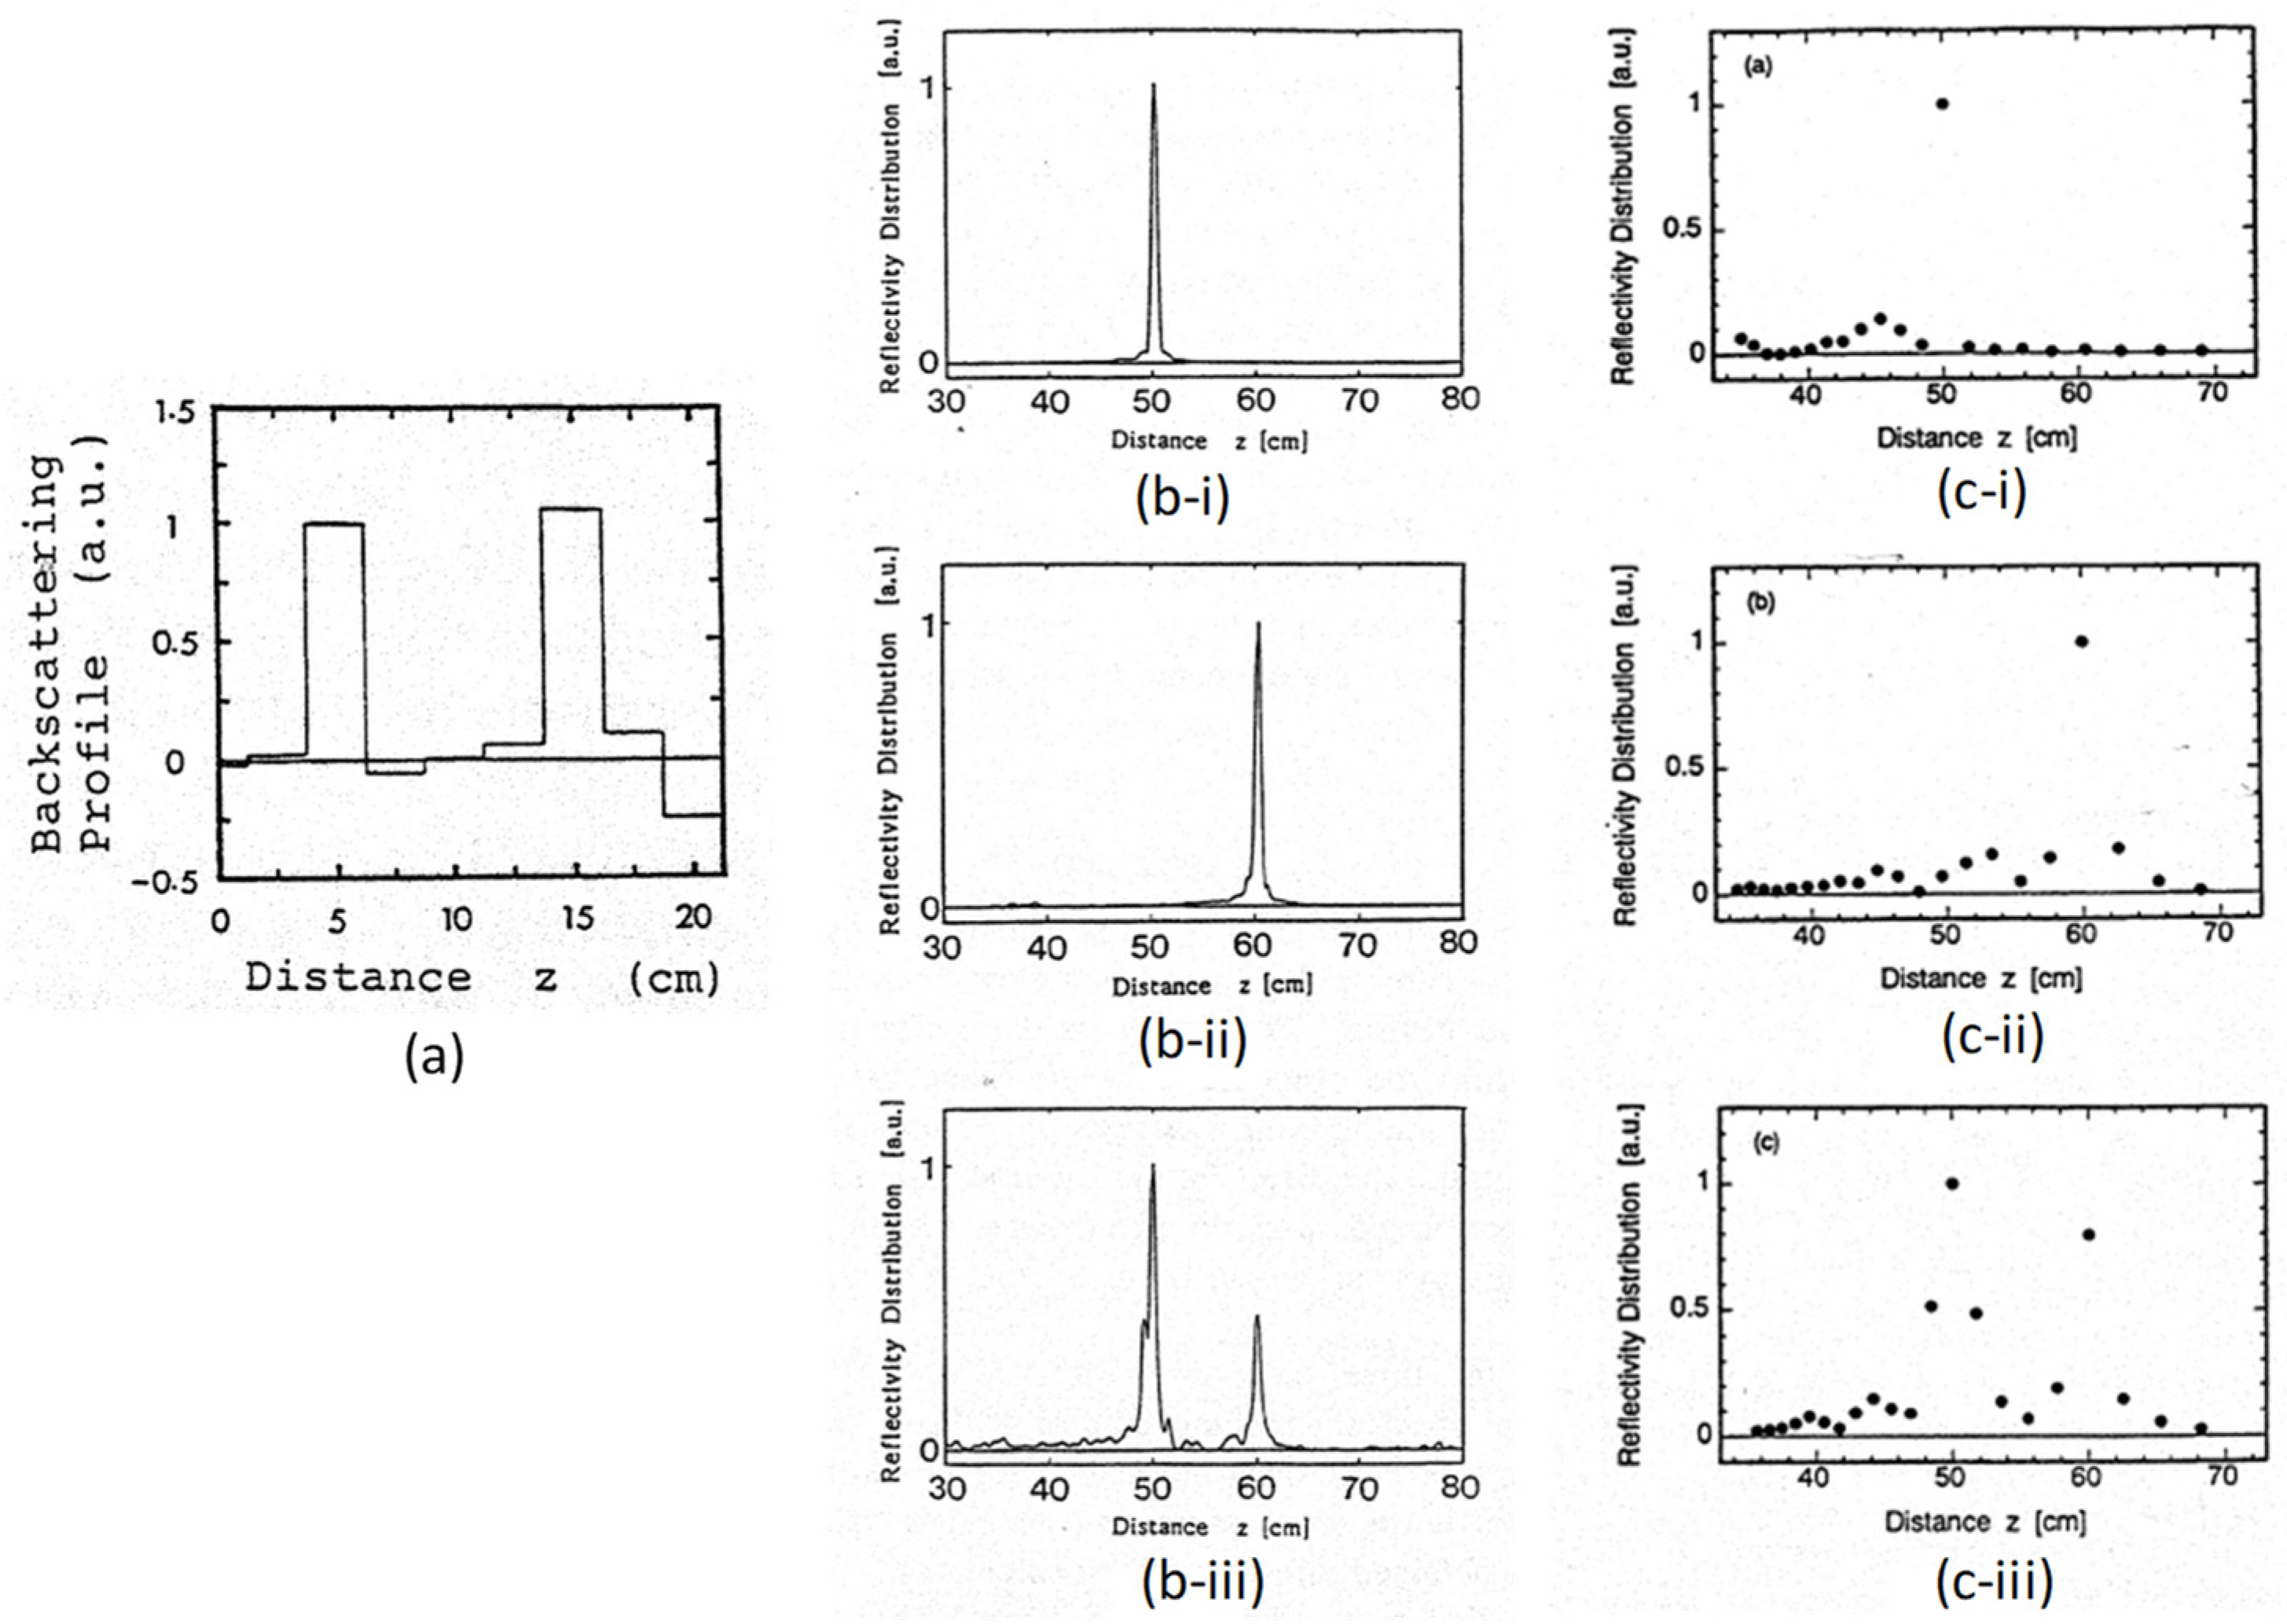
Figure 22a schematically shows the Brillouin gain shape that is generated at each location by the BOCDA principle of the position-selective excitation of the Brillouin gain. At the correlation peak position, the Lorentz-shaped Brillouin signal spectrum is generated. On the contrary, at both sides of the peak position, a broadened spectrum is generated that has large power portions at both edges of the spectrum shape, as shown in Figure 22a. The BOCDA system output is obtained by the integration of all the spectra that are generated at each position along the fiber. Then, the total shape becomes as shown in Figure 22(b-i). The total BOCDA output spectrum consists of two components; one is the signal component corresponding to the correlation peak position, and the other corresponds to the non-correlation portions besides the peak position. When a strain is applied to a short-length fiber portion, whose length is almost the same as the spatial resolution given by Equation (2) or Equation (3), the Lorentz-shaped signal spectrum is slipped down along the skirt of the mountain-shaped background spectrum, as shown in Figure 22(b-ii).
When a large strain is applied, the top of the signal spectrum is lower than the top of the mountain-shaped background. This means that a large strain might not be measured correctly. Then, a scheme to reduce the height of the background spectrum was proposed, which is the “intensity modulation scheme”.
In the SOCF research, it has been known that the synthesized coherence function shape is given by the Fourier transform of the time-averaged light source power spectrum shape. In that sense, the amount of the Brillouin gain that is induced as a function of the fiber axis z is thought to be calculated roughly by the Fourier transform of the light source power spectrum shape. Of course, the gain shape is also the function of the frequency difference between the pump and the probe, as shown in Figure 22a. This means that the Brillouin gain distribution is plotted in the two dimensions; one is the frequency difference Δν, and the other is the fiber position z. When the LD power spectrum has high power portions at both edges, the Fourier transform theorem shows that relatively large side lobes are generated. Then, the mountain-shaped non-desired background spectrum is thought to be generated by the large side lobes. The side lobes have the possibility of being reduced by the so-called “apodization” or “window” in the Fourier transform theorem, which was exactly true in the case of the simple SOCF.
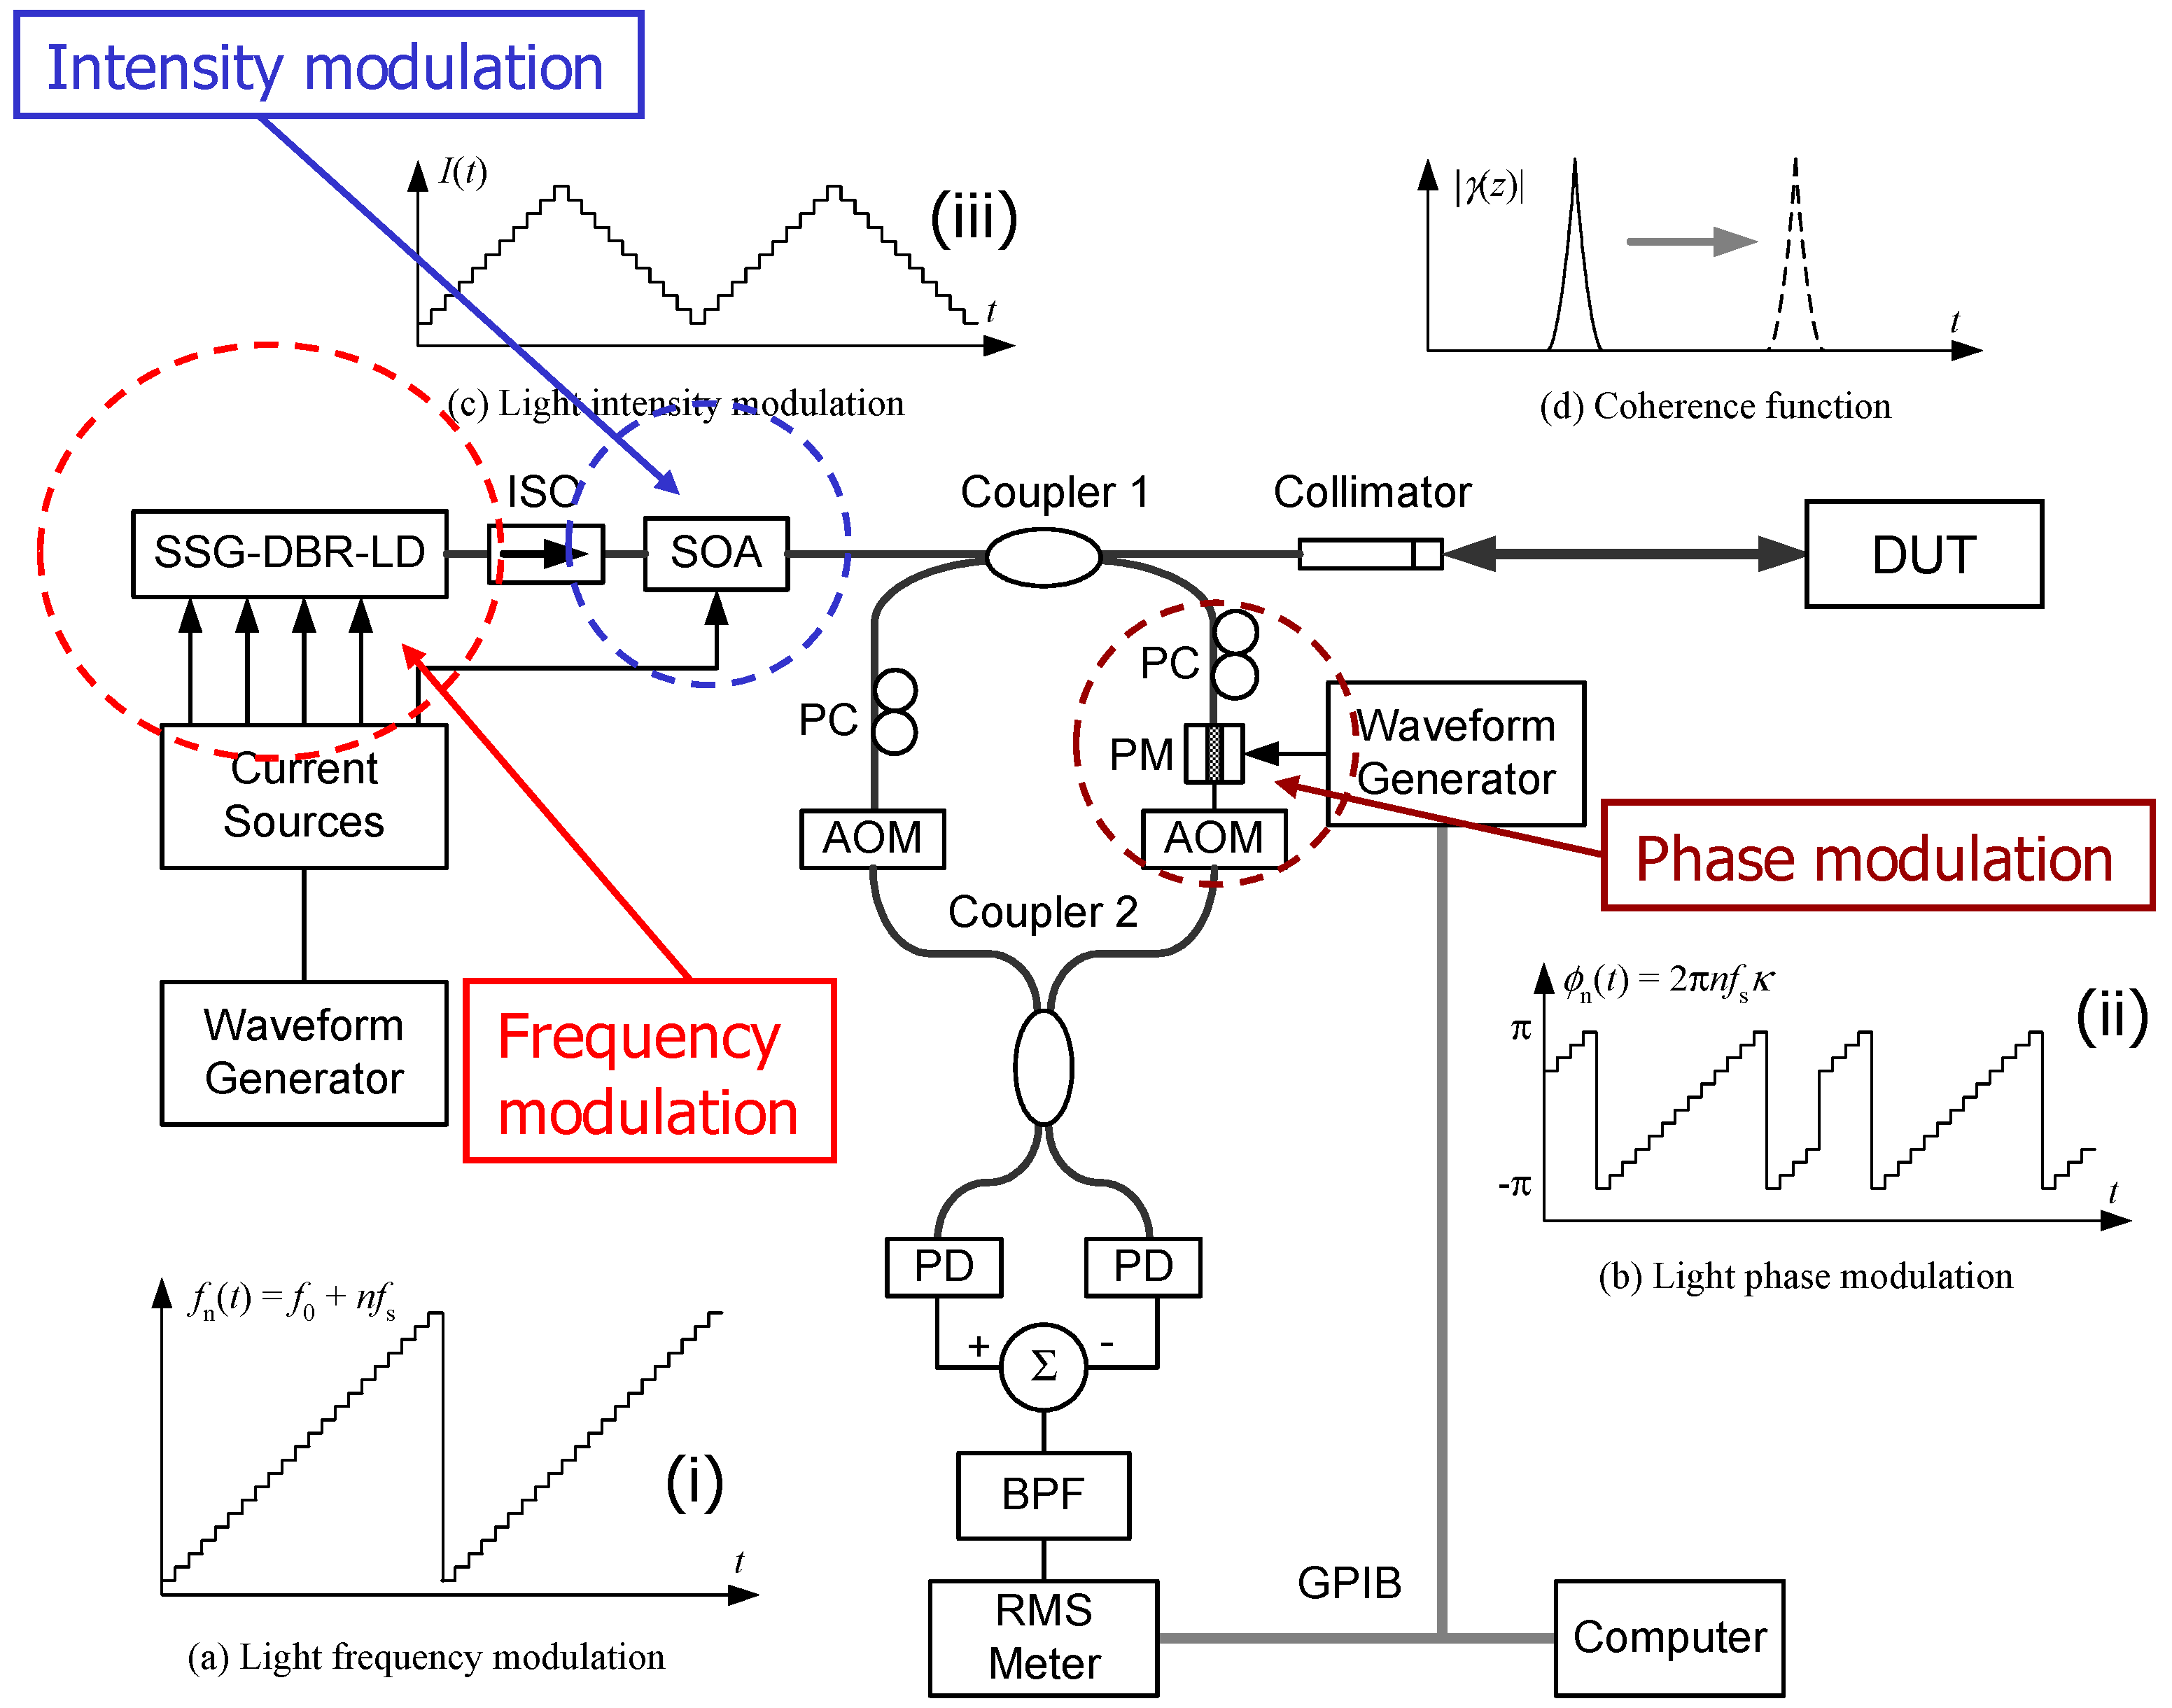
We proposed the “intensity modulation scheme” for the BOCDA system, in which the IM modulation is applied by an IM modulator, as shown in Figure 21, which is synchronized to the FM modulation [51]. By the IM modulation, the time-averaged light source power spectrum is manipulated, so that both edges of the spectrum shape are reduced to zero. In 
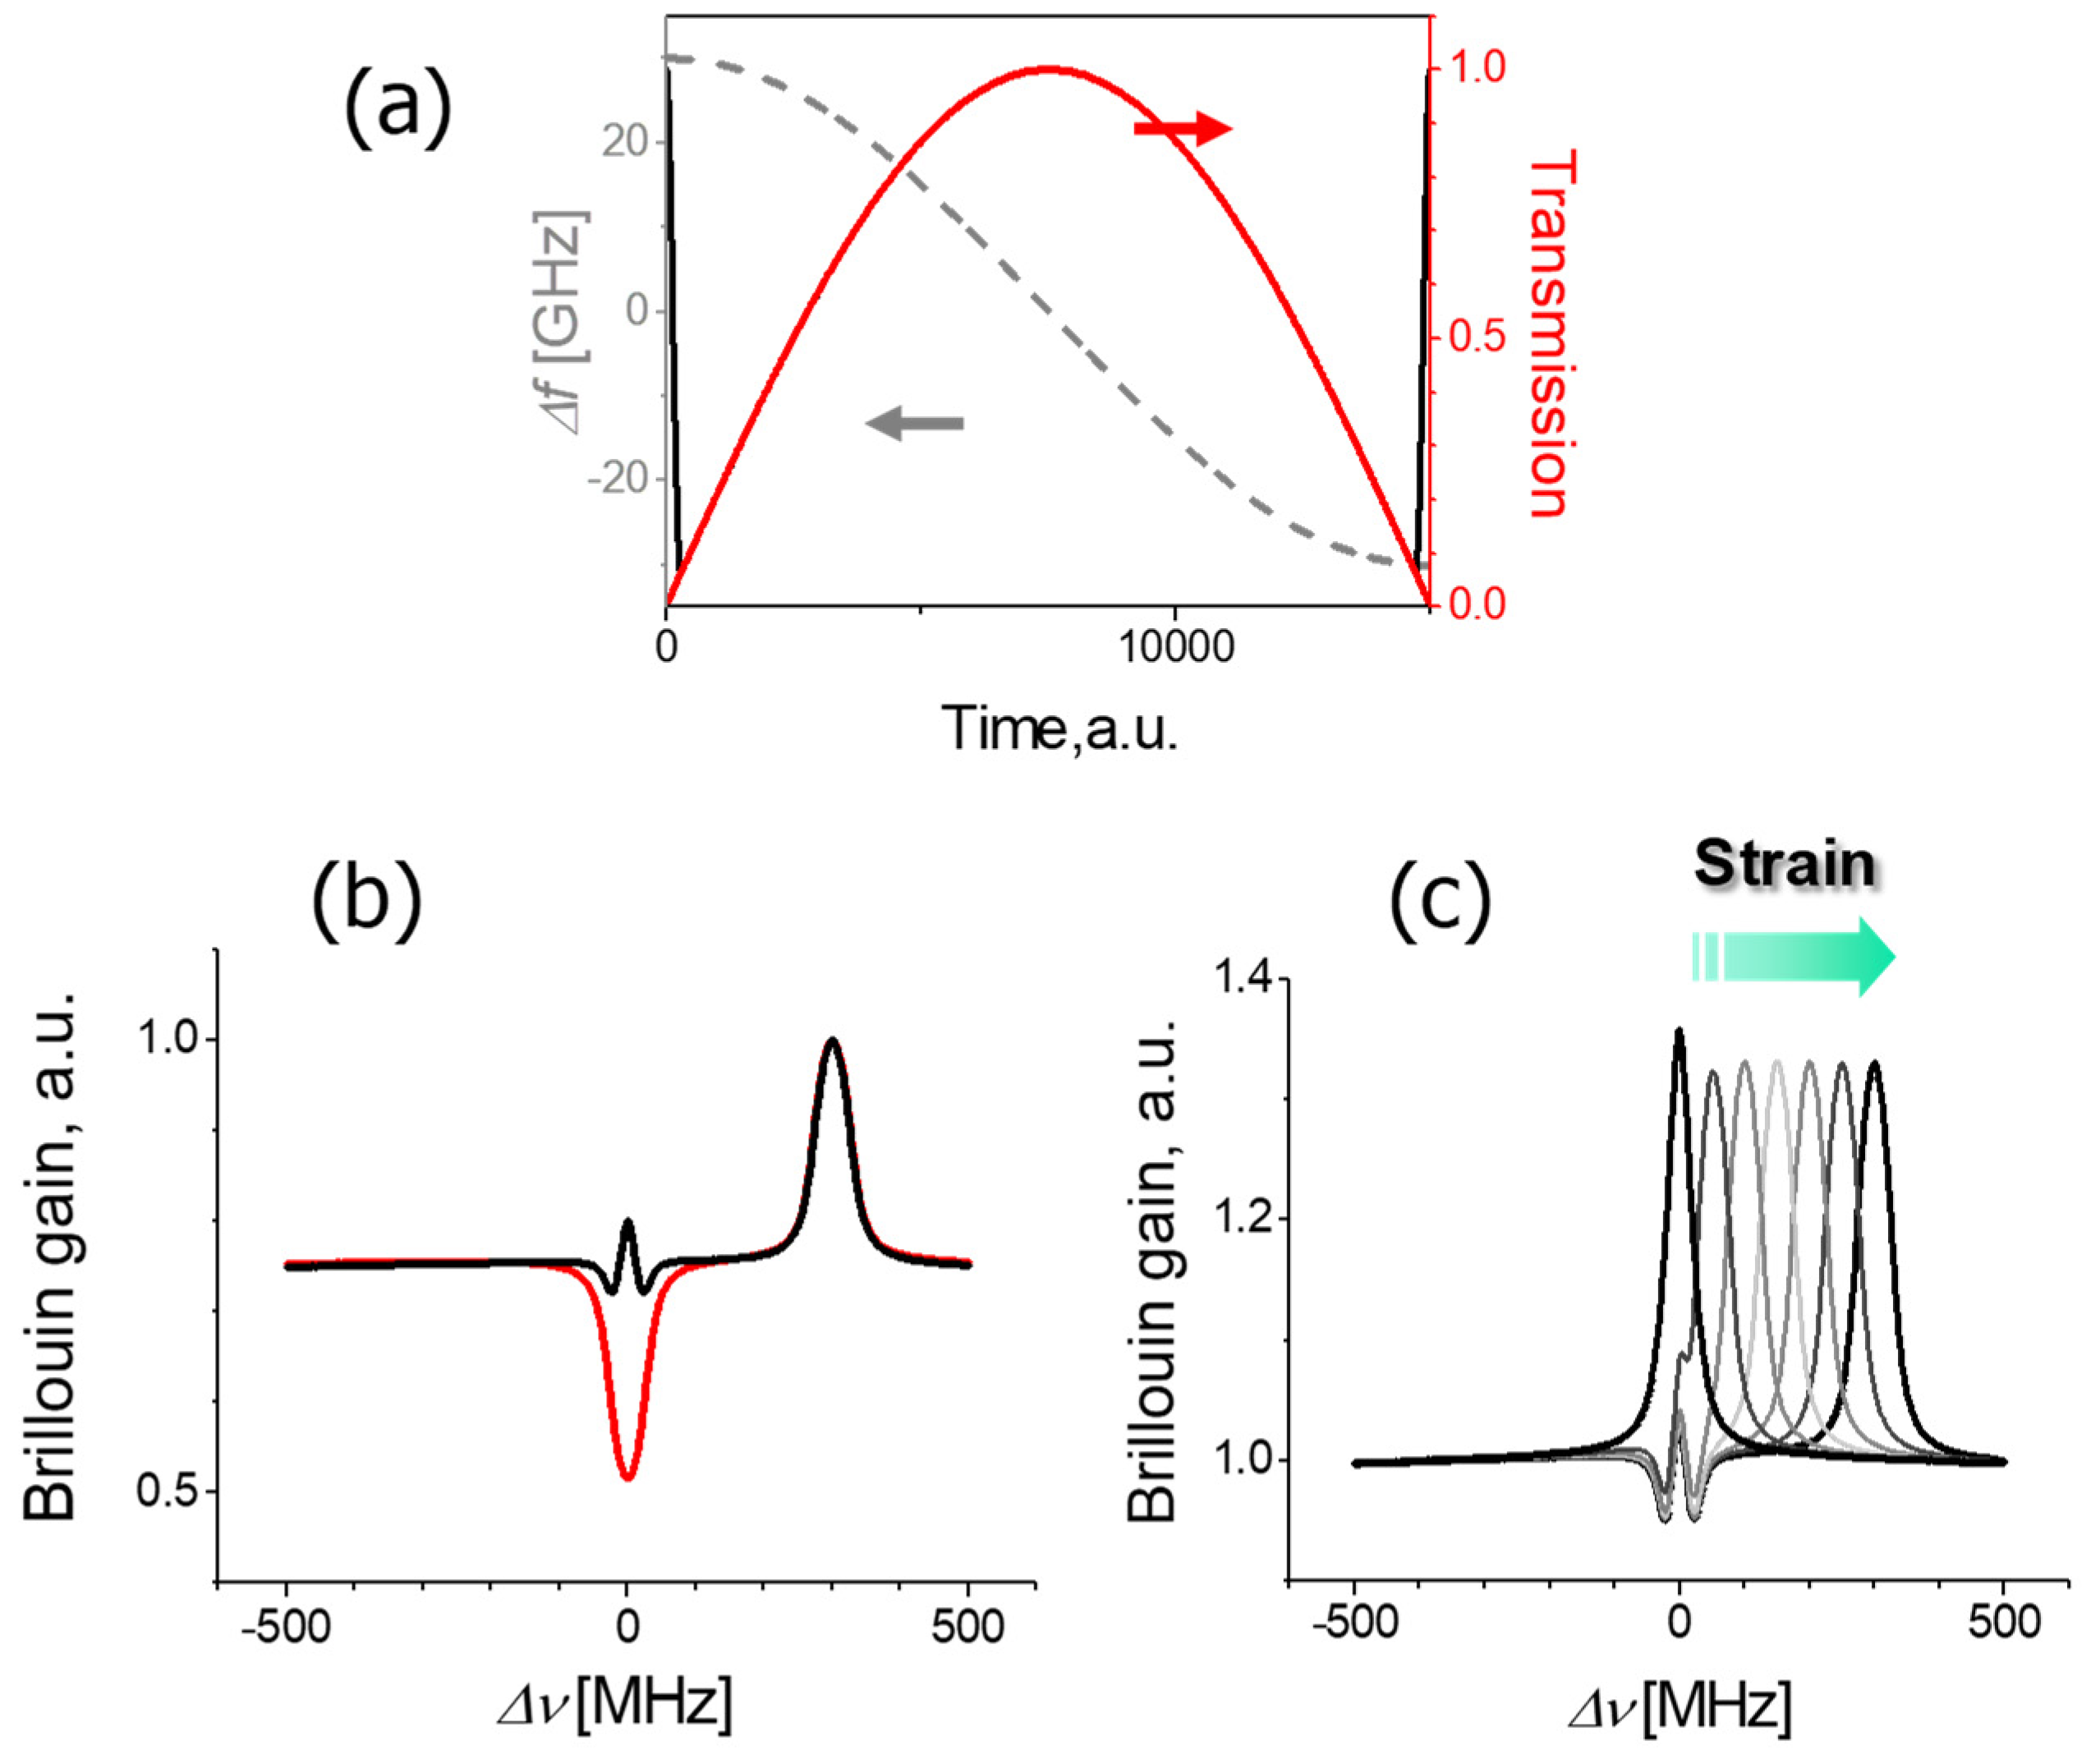
Figure 23a, the dashed curve shows half the period of the sinusoidal FM, and the red curve shows a trial intensity modulation waveform for the apodization [51]. In Figure 23b, the red curve shows the simulation result, in which the reduced mountain-shaped background spectrum is seen. In this simulation, a 6000-με strained short length of fiber portion is located at the correlation peak position. The Lorentz-shaped signal spectrum is clearly shown at the Δν= 300 MHz portion, without any background spectrum. However, at the non-strained portion, where Δν = 0, a large dip is shown [51]. This means that the apodization is too effective for the Brillouin gain spectrum, which is spread into the two dimensions.
To compensate for the dip at the non-strained portion in the BOCDA system output spectrum, the IM waveform is modified as shown by the black peaks in Figure 23a. The two black peaks recover the power at both edges of the light source power spectrum. With this recovery, the dip is compensated for, as shown by the black line in Figure 23b. As shown in Figure 23c, any amount of strain applied at the correlation peak position can be clearly shown in the BOCDA output without any background spectrum. This is the function of the “intensity modulation scheme”.
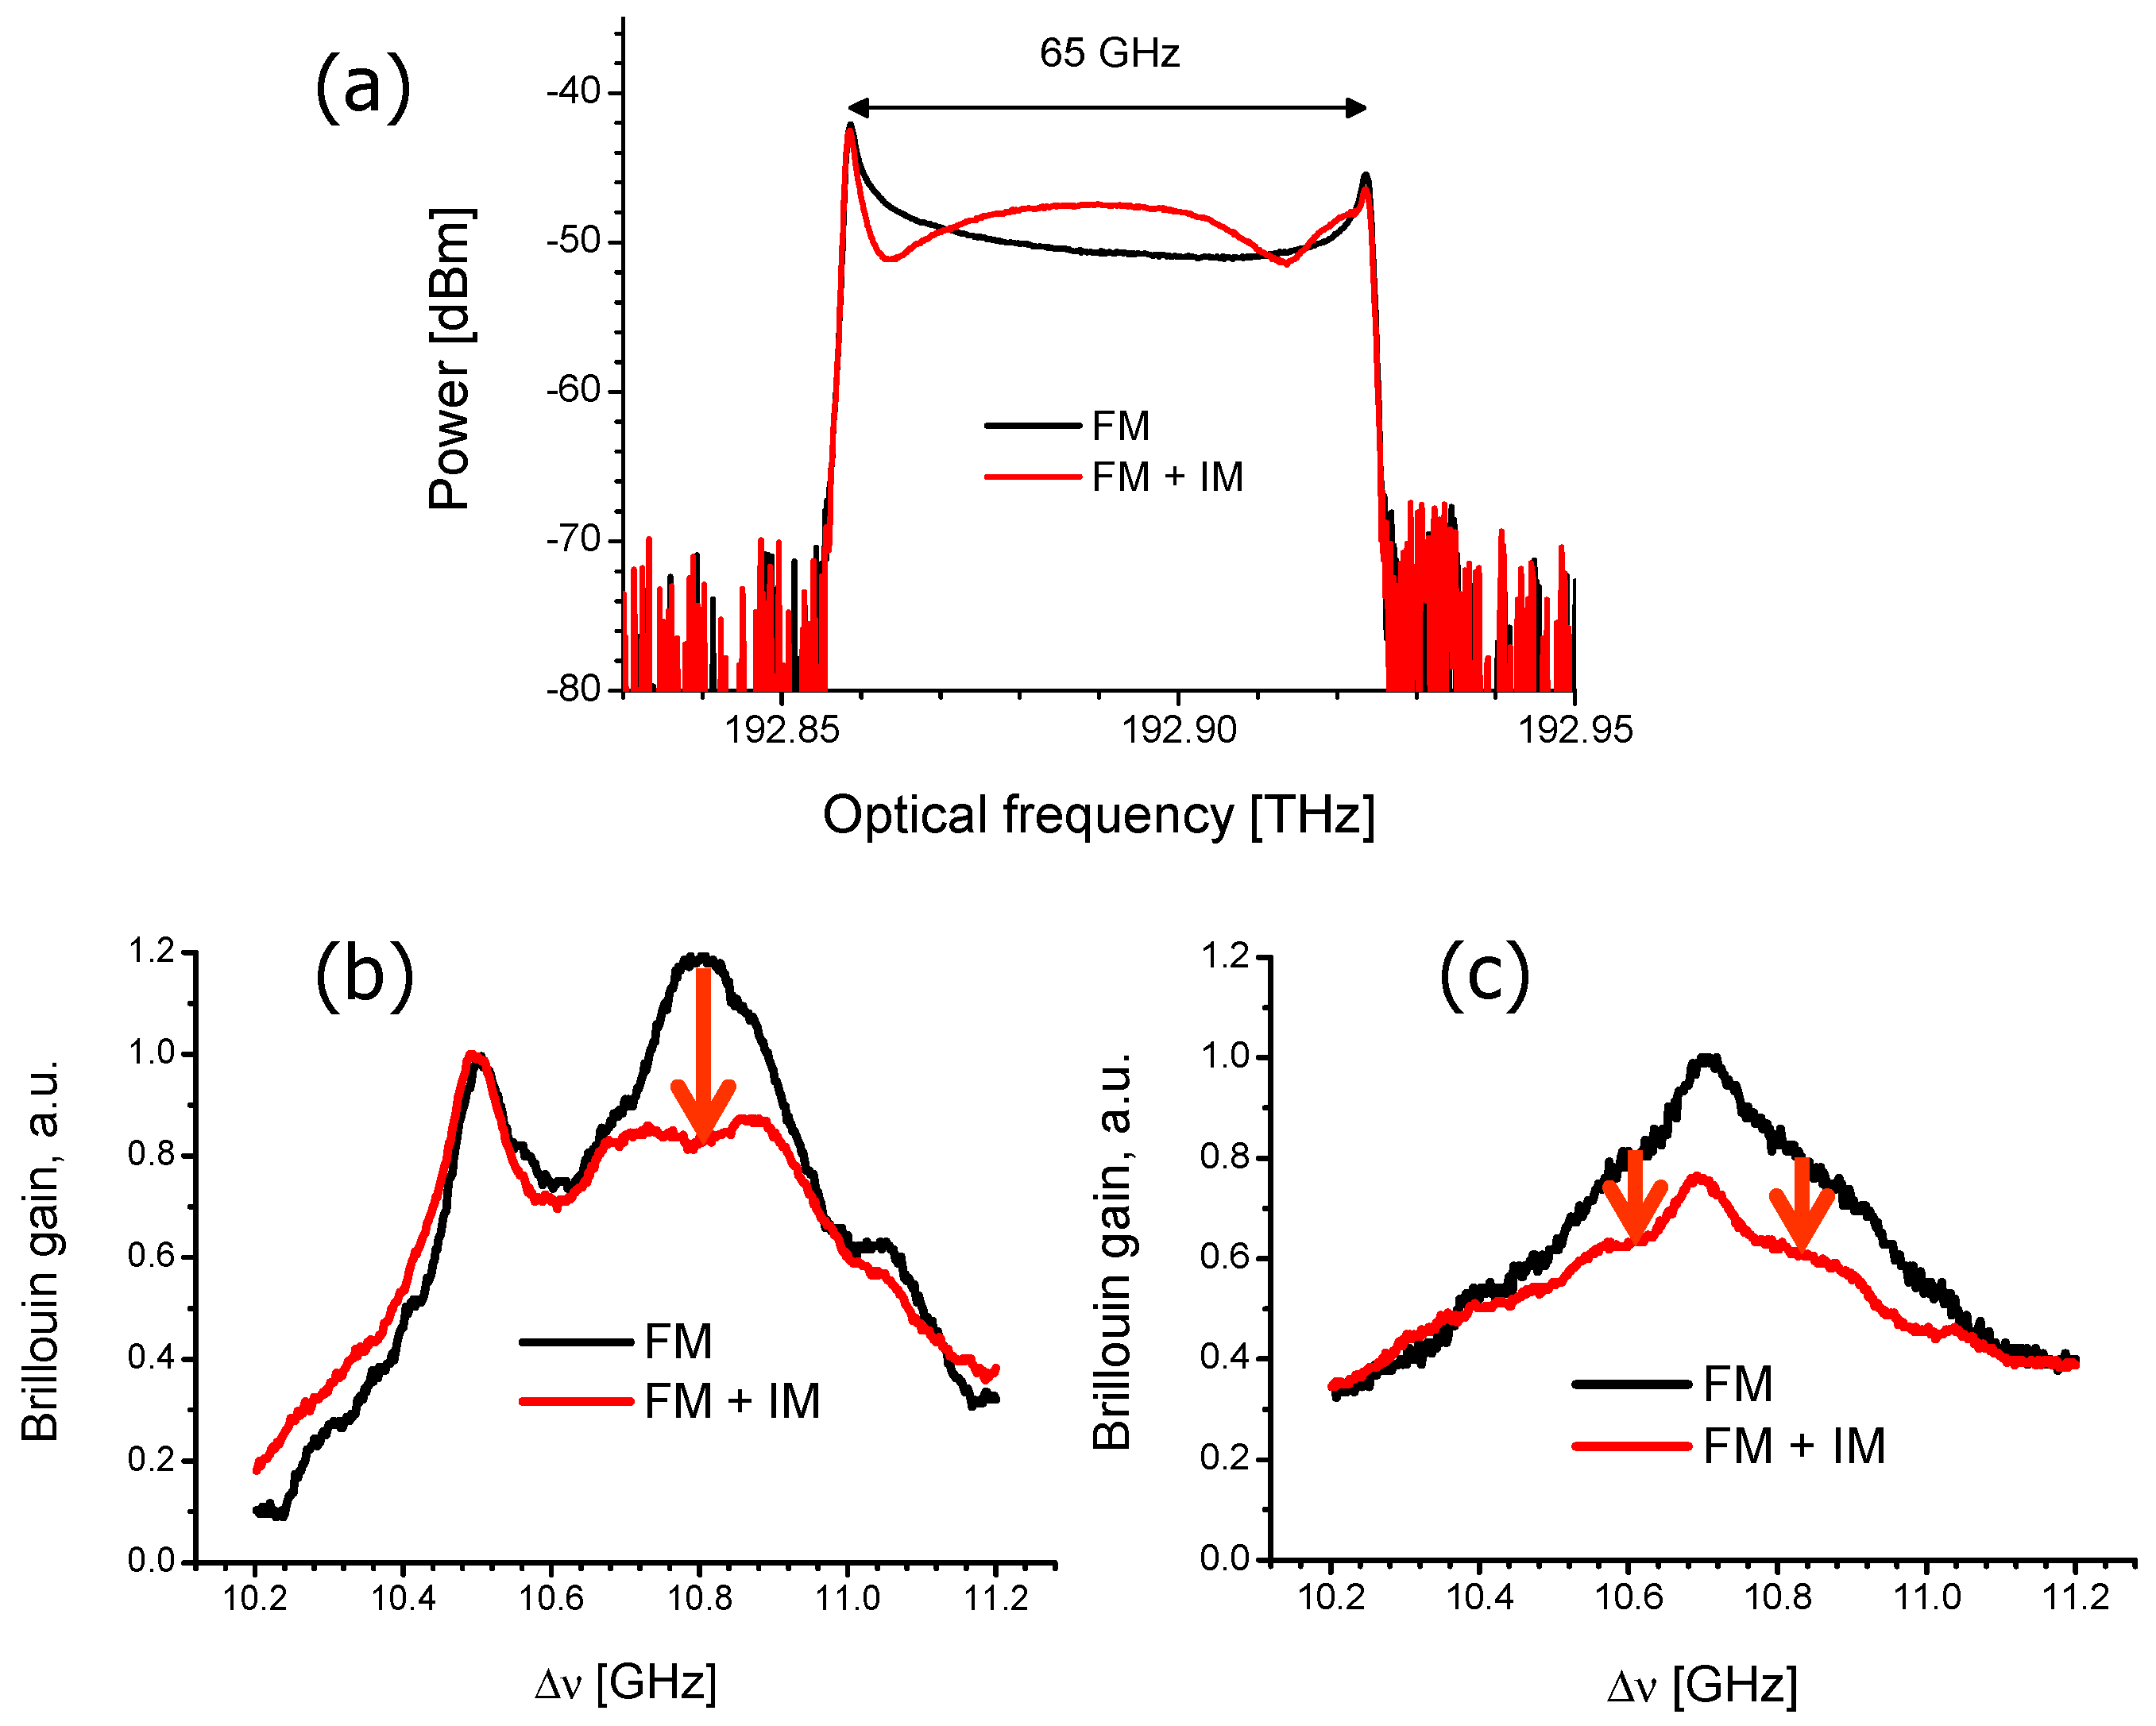
Figure 24a shows the time-averaged LD power spectra without (black) and with (red) the IM modulation, respectively [51]. In Figure 24b,c, the red and black curves show the experimental results of the BOCDA output spectrum for the cases with and without the IM modulation, respectively. Figure 24b,c correspond to the BGS measurements at a strained and a non-strained position, respectively. By the IM scheme, the background spectrum is clearly reduced in the experiments.
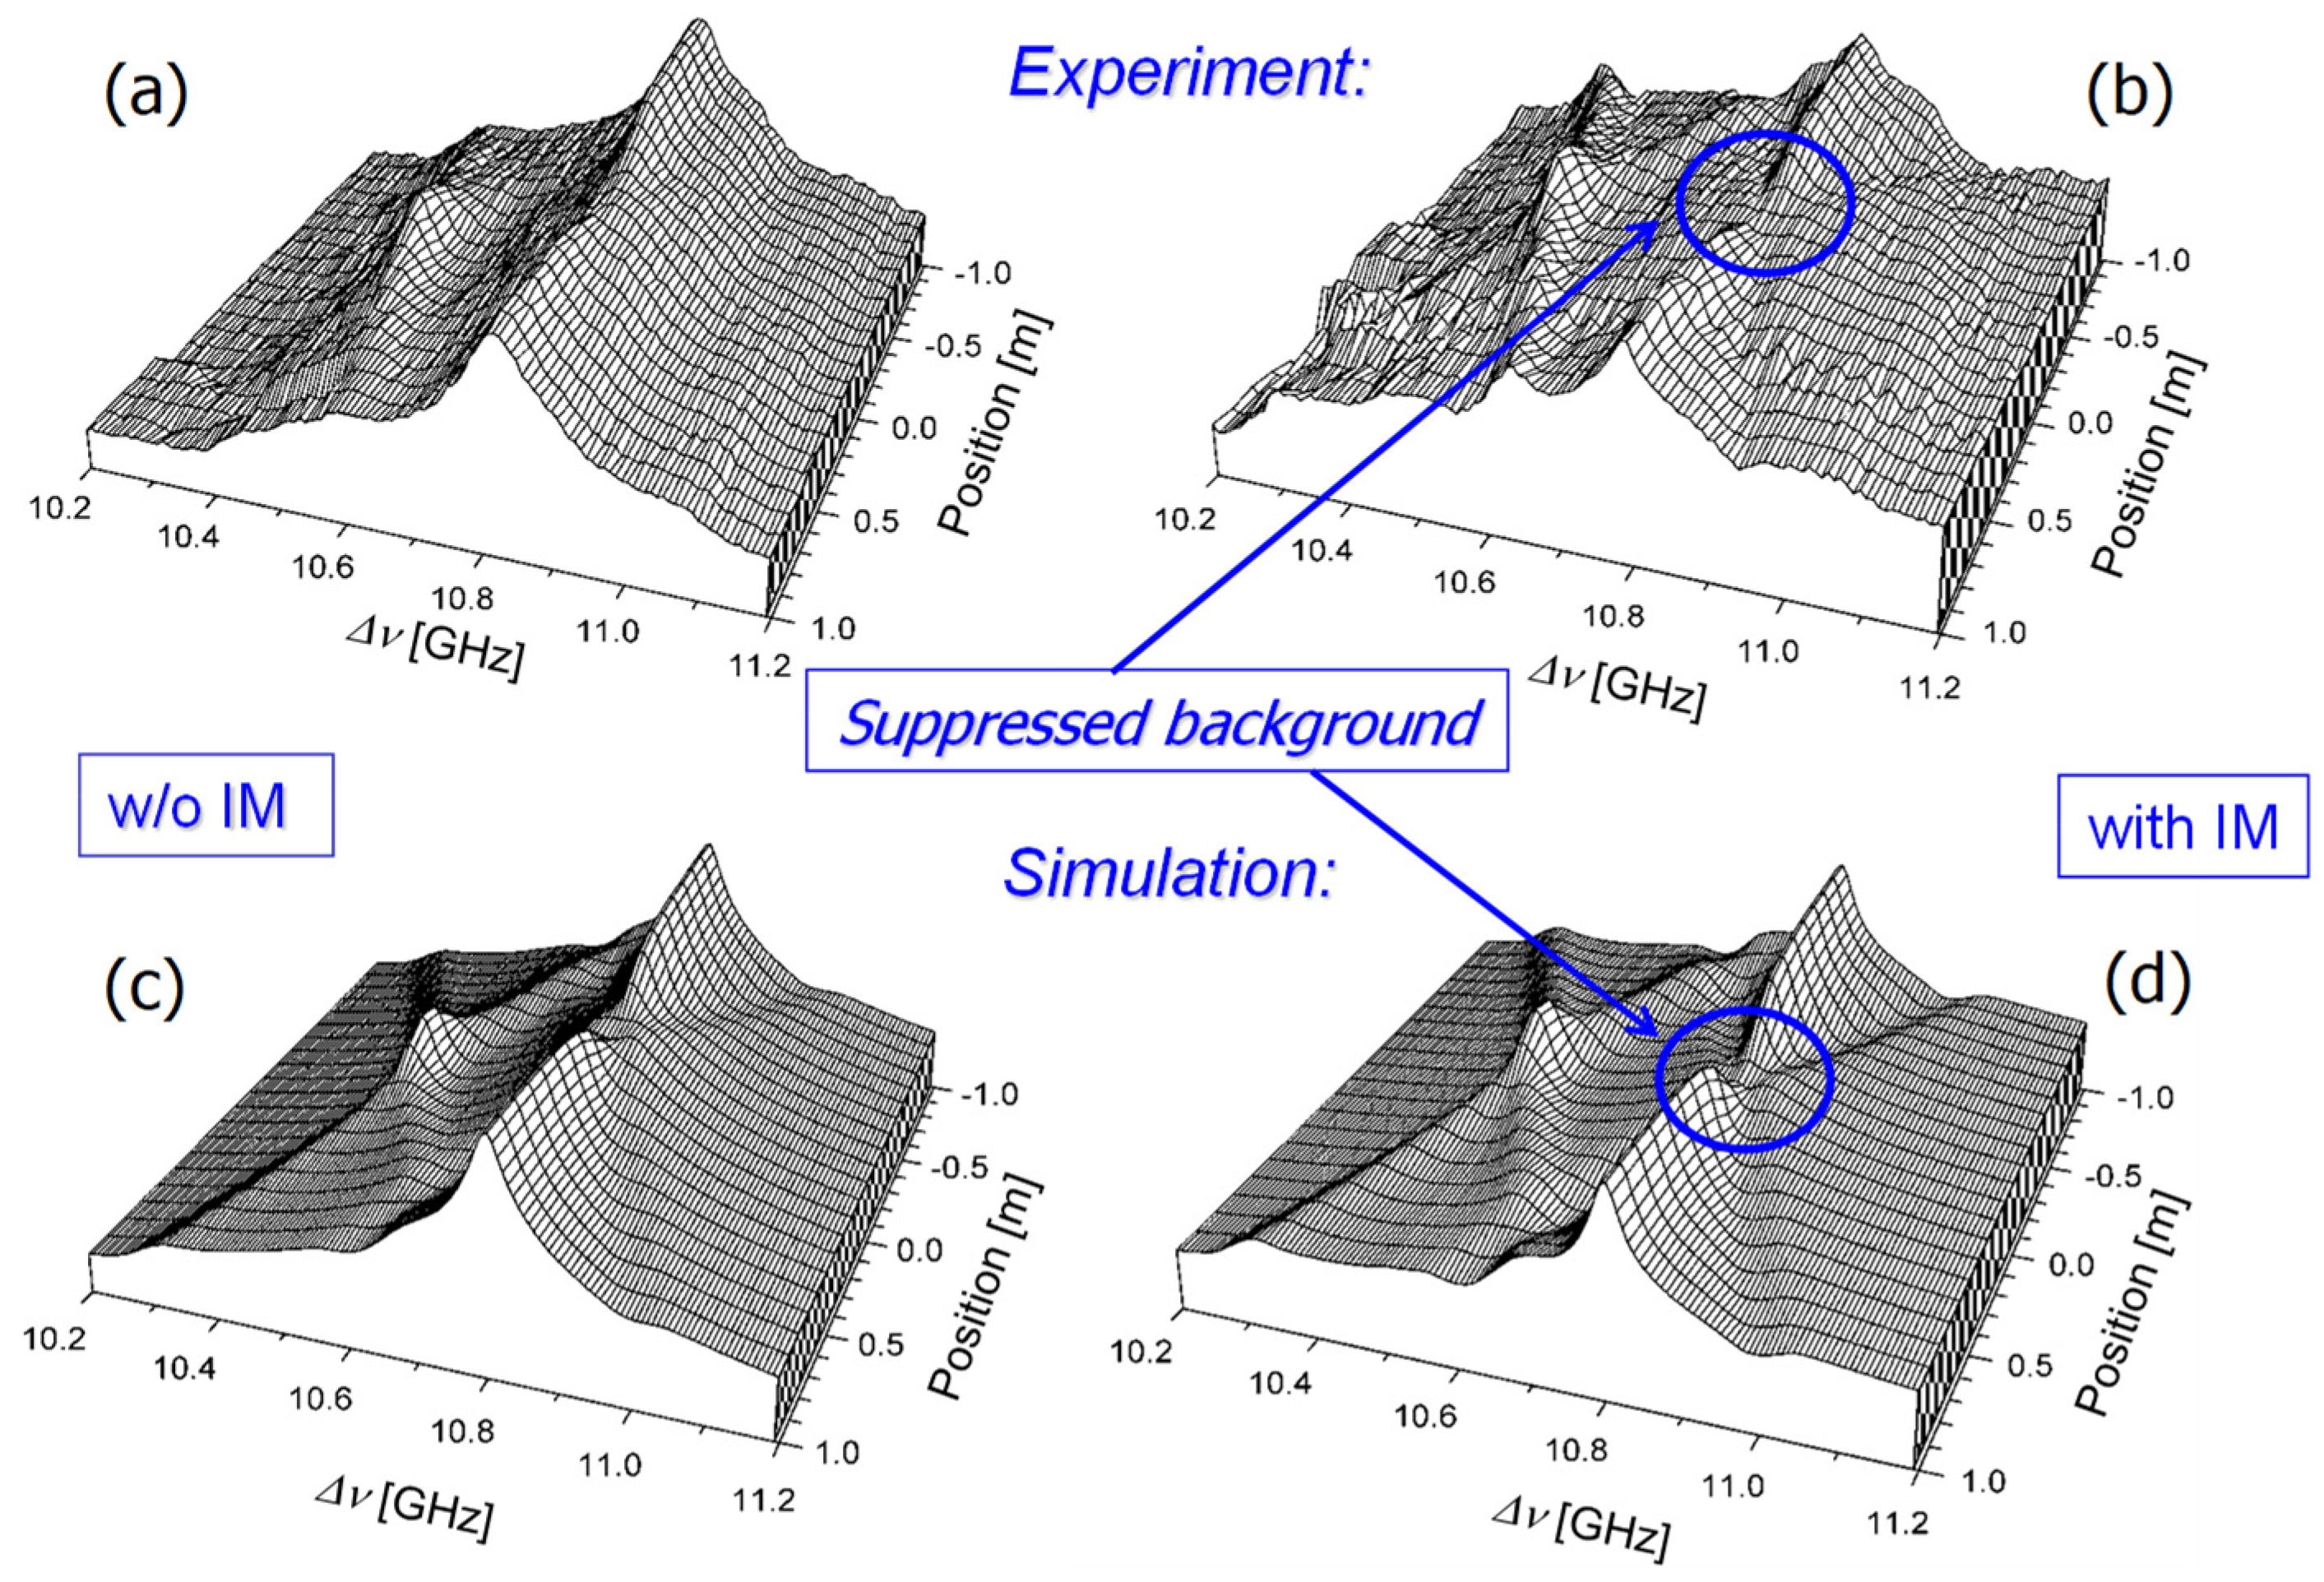
Figure 25 shows the distribution of the BGS along the fiber that was obtained in experiments and simulations to show the effectiveness of the IM scheme [51]. The experimental results are shown in Figure 25a,b, and the simulation results are shown in Figure 25c,d. Figure 25a,c are for the case without the IM modulation, and Figure 25b,d are for the case with the IM modulation. The suppressed background is clearly shown at the blue circled portions in Figure 25b,d.
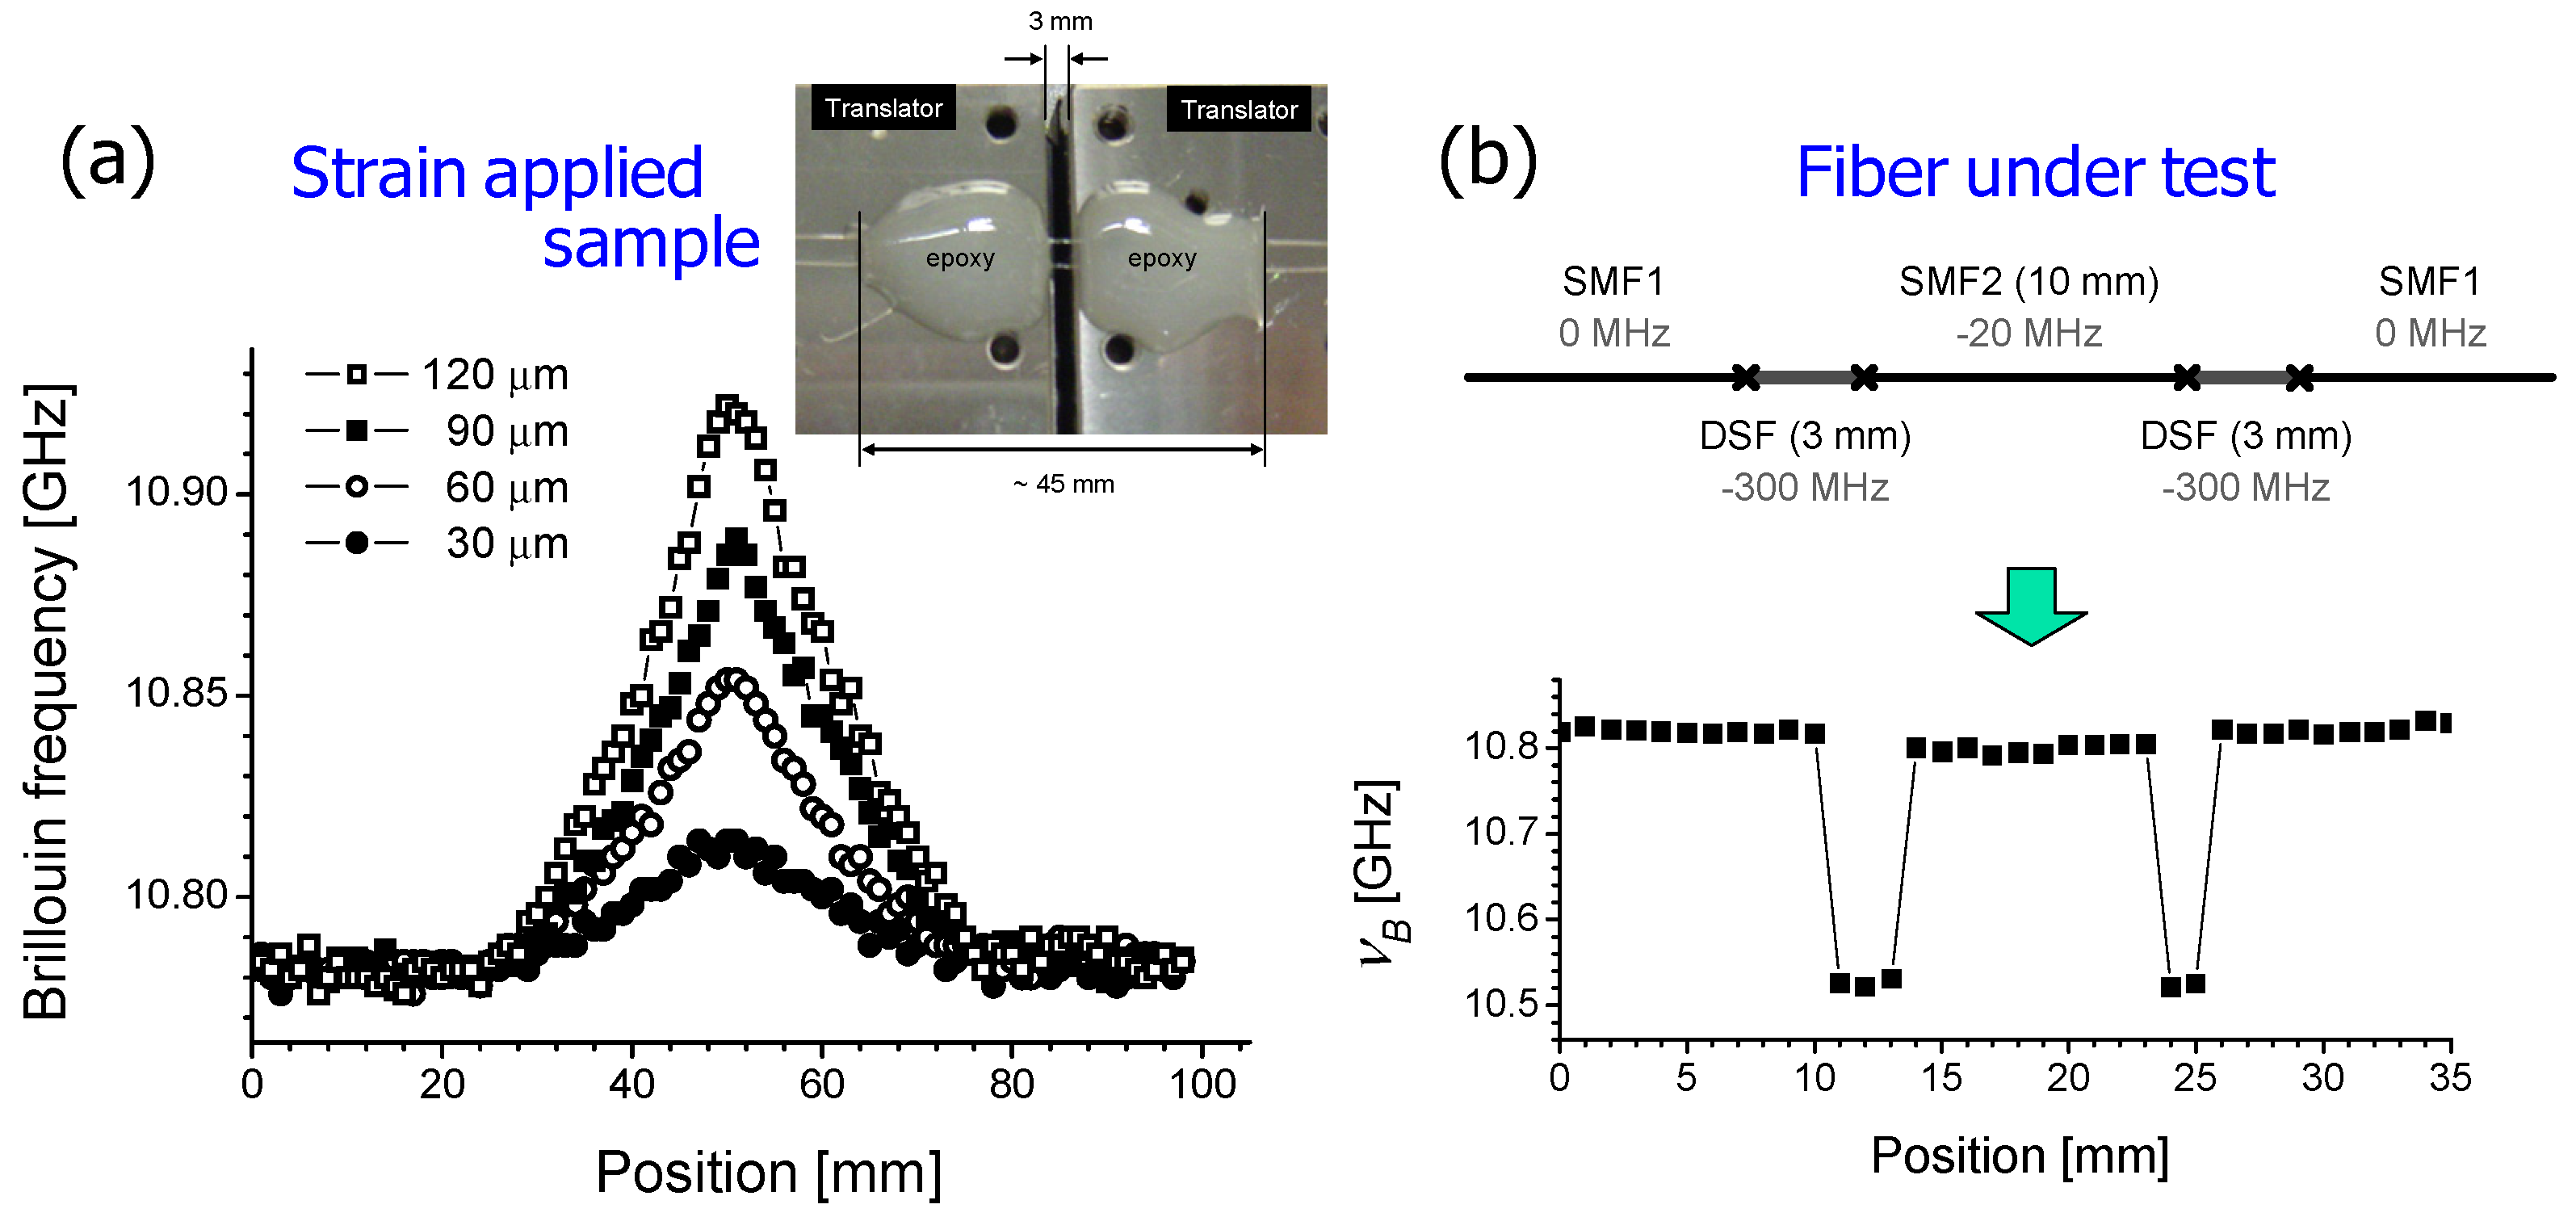
Quite a high spatial resolution is demonstrated in the distributed BFS measurement by a BOCDA system, as shown in Figure 26 [
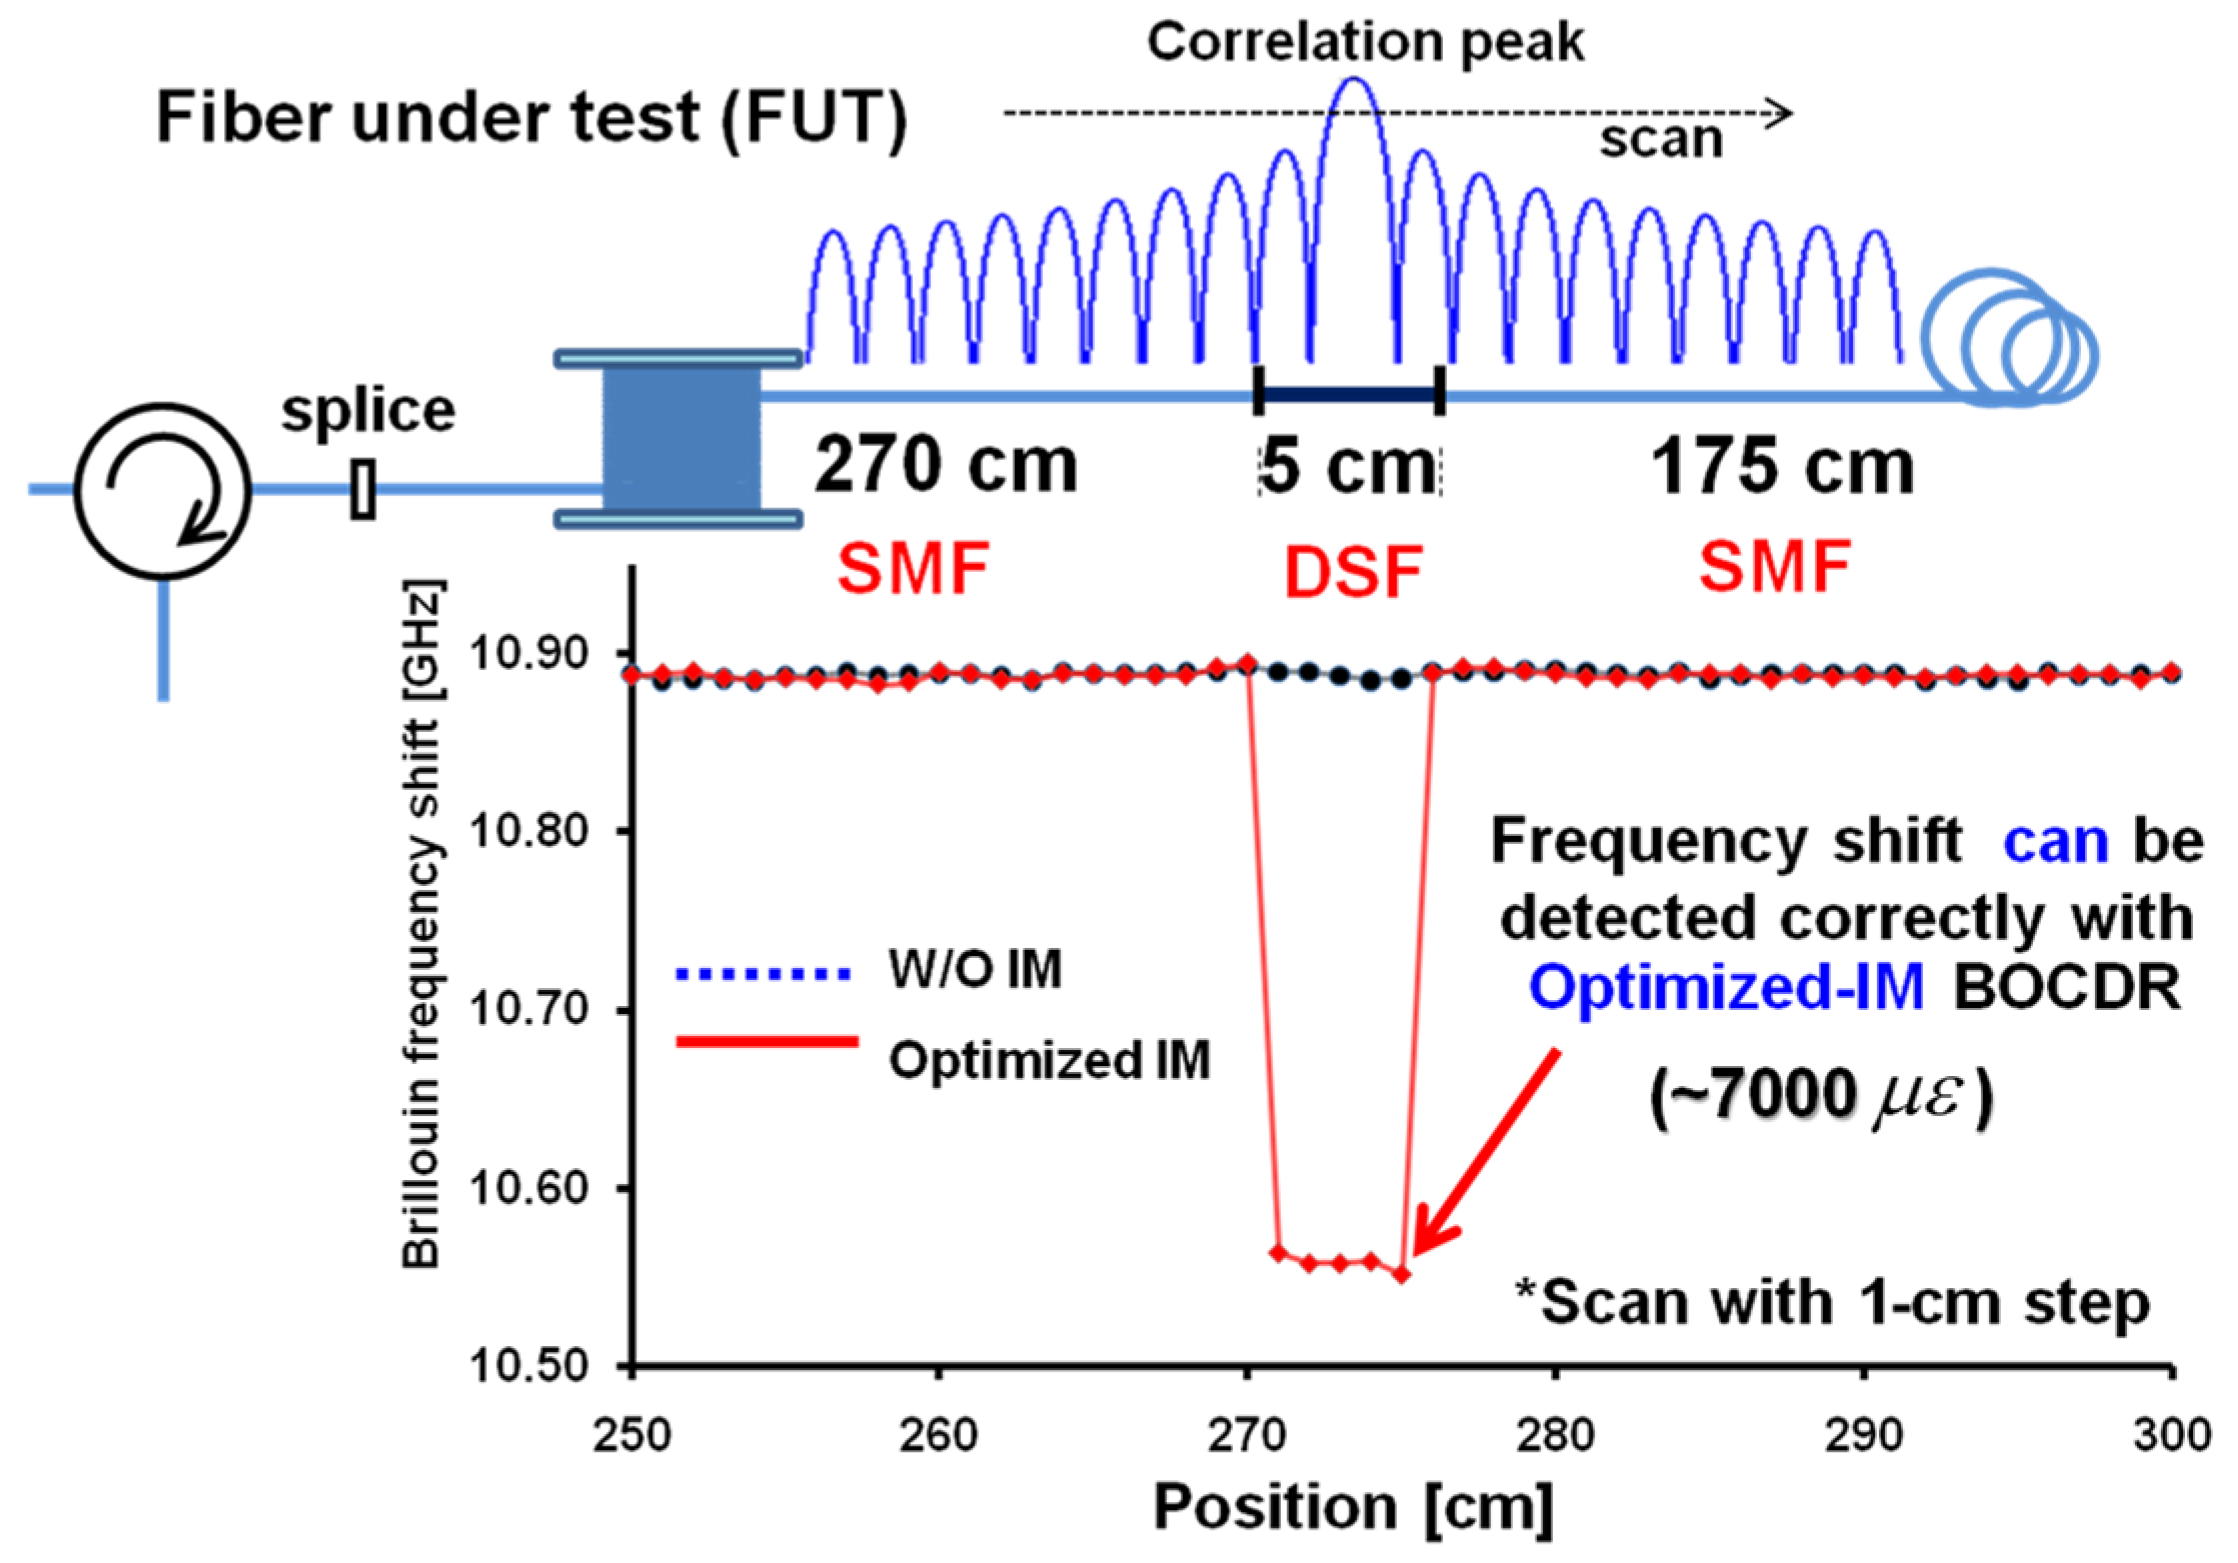
66]. In this experiment, the IM scheme is also introduced. A short fiber section with a length of three mm is elongated by the micrometer head, as shown in a photograph in 
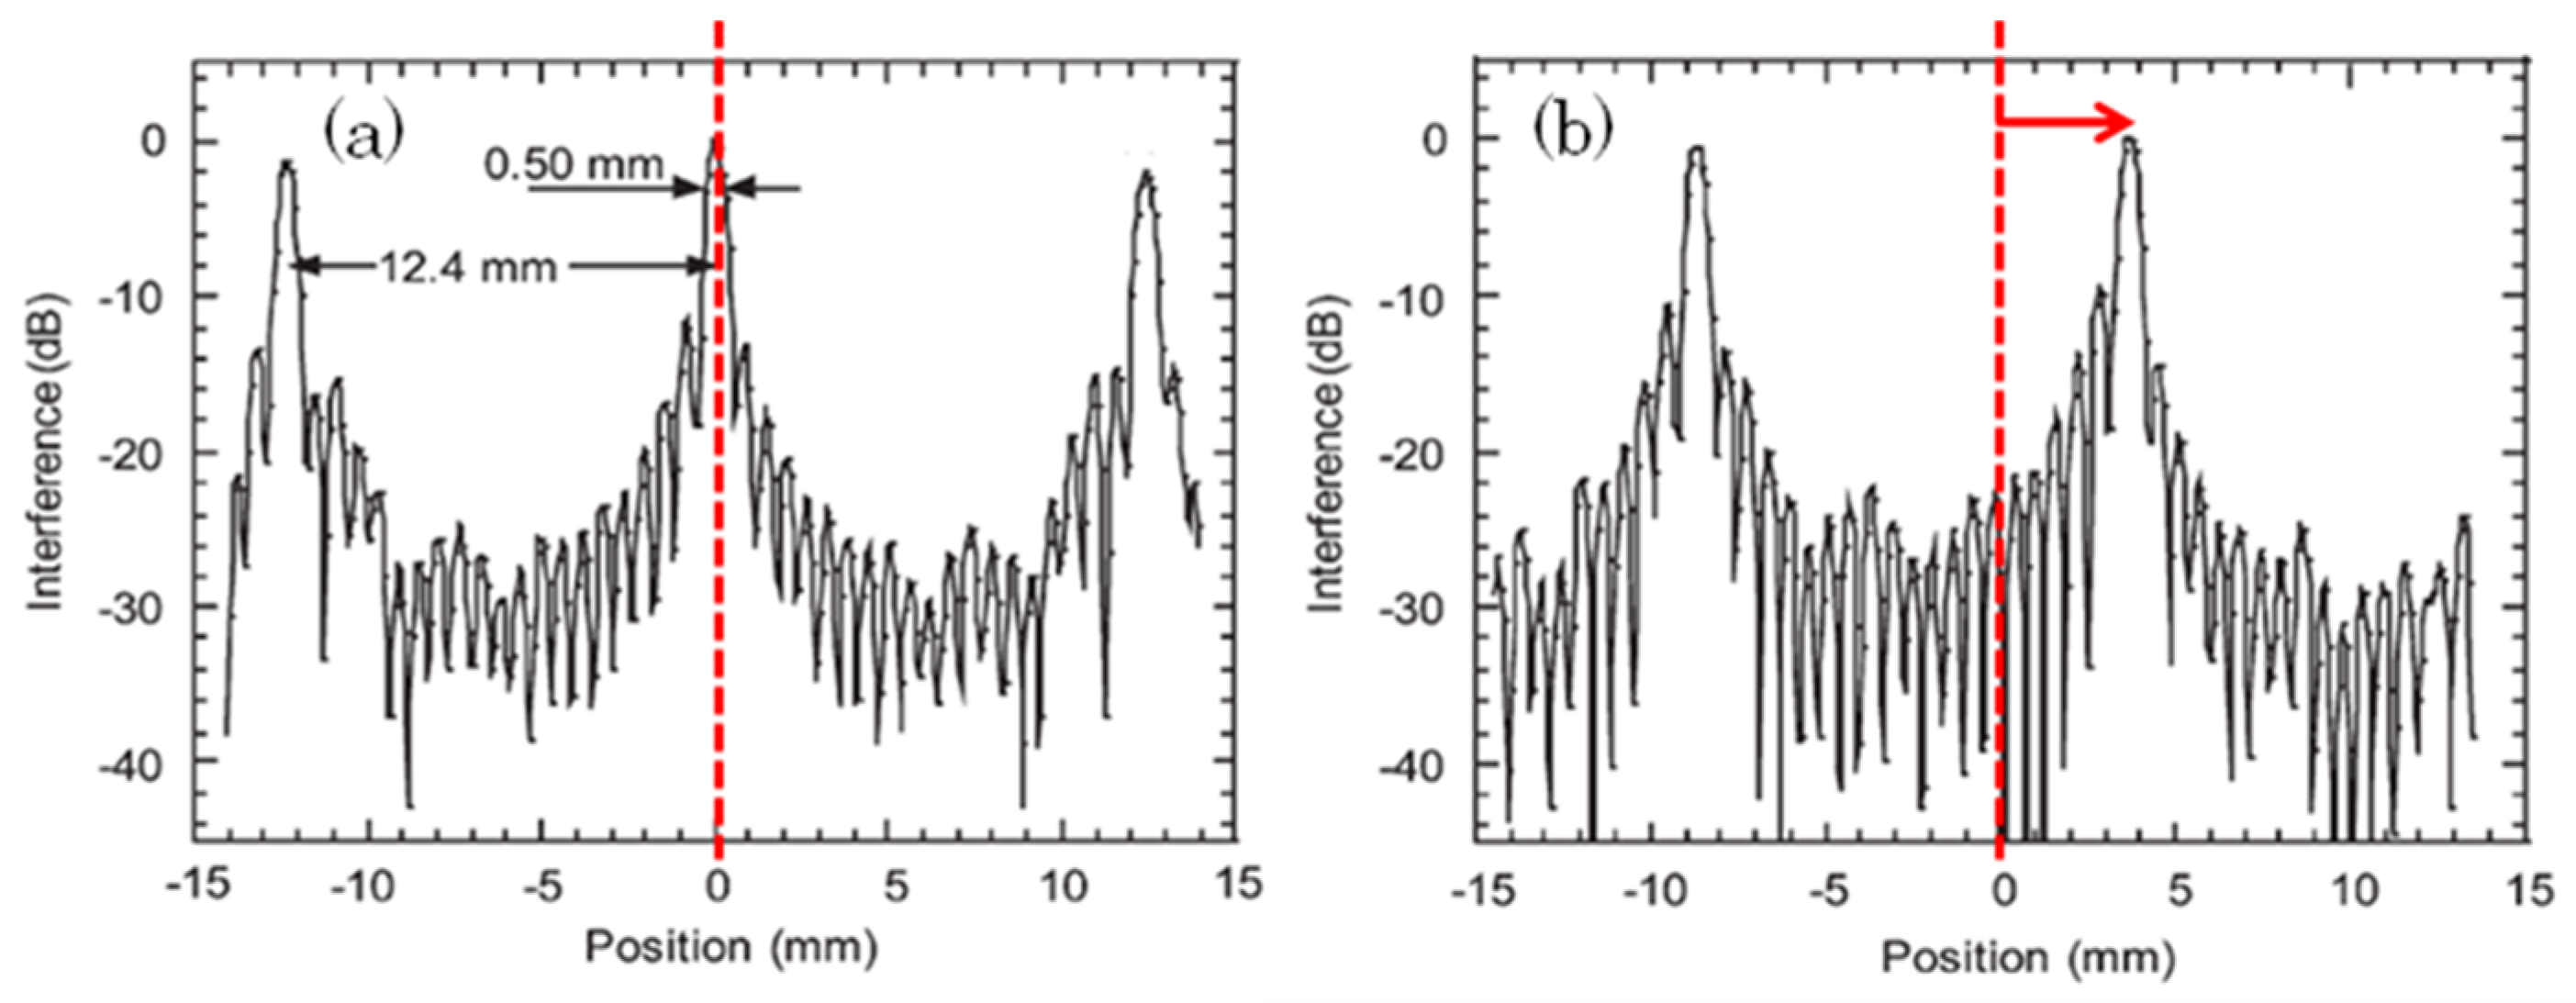
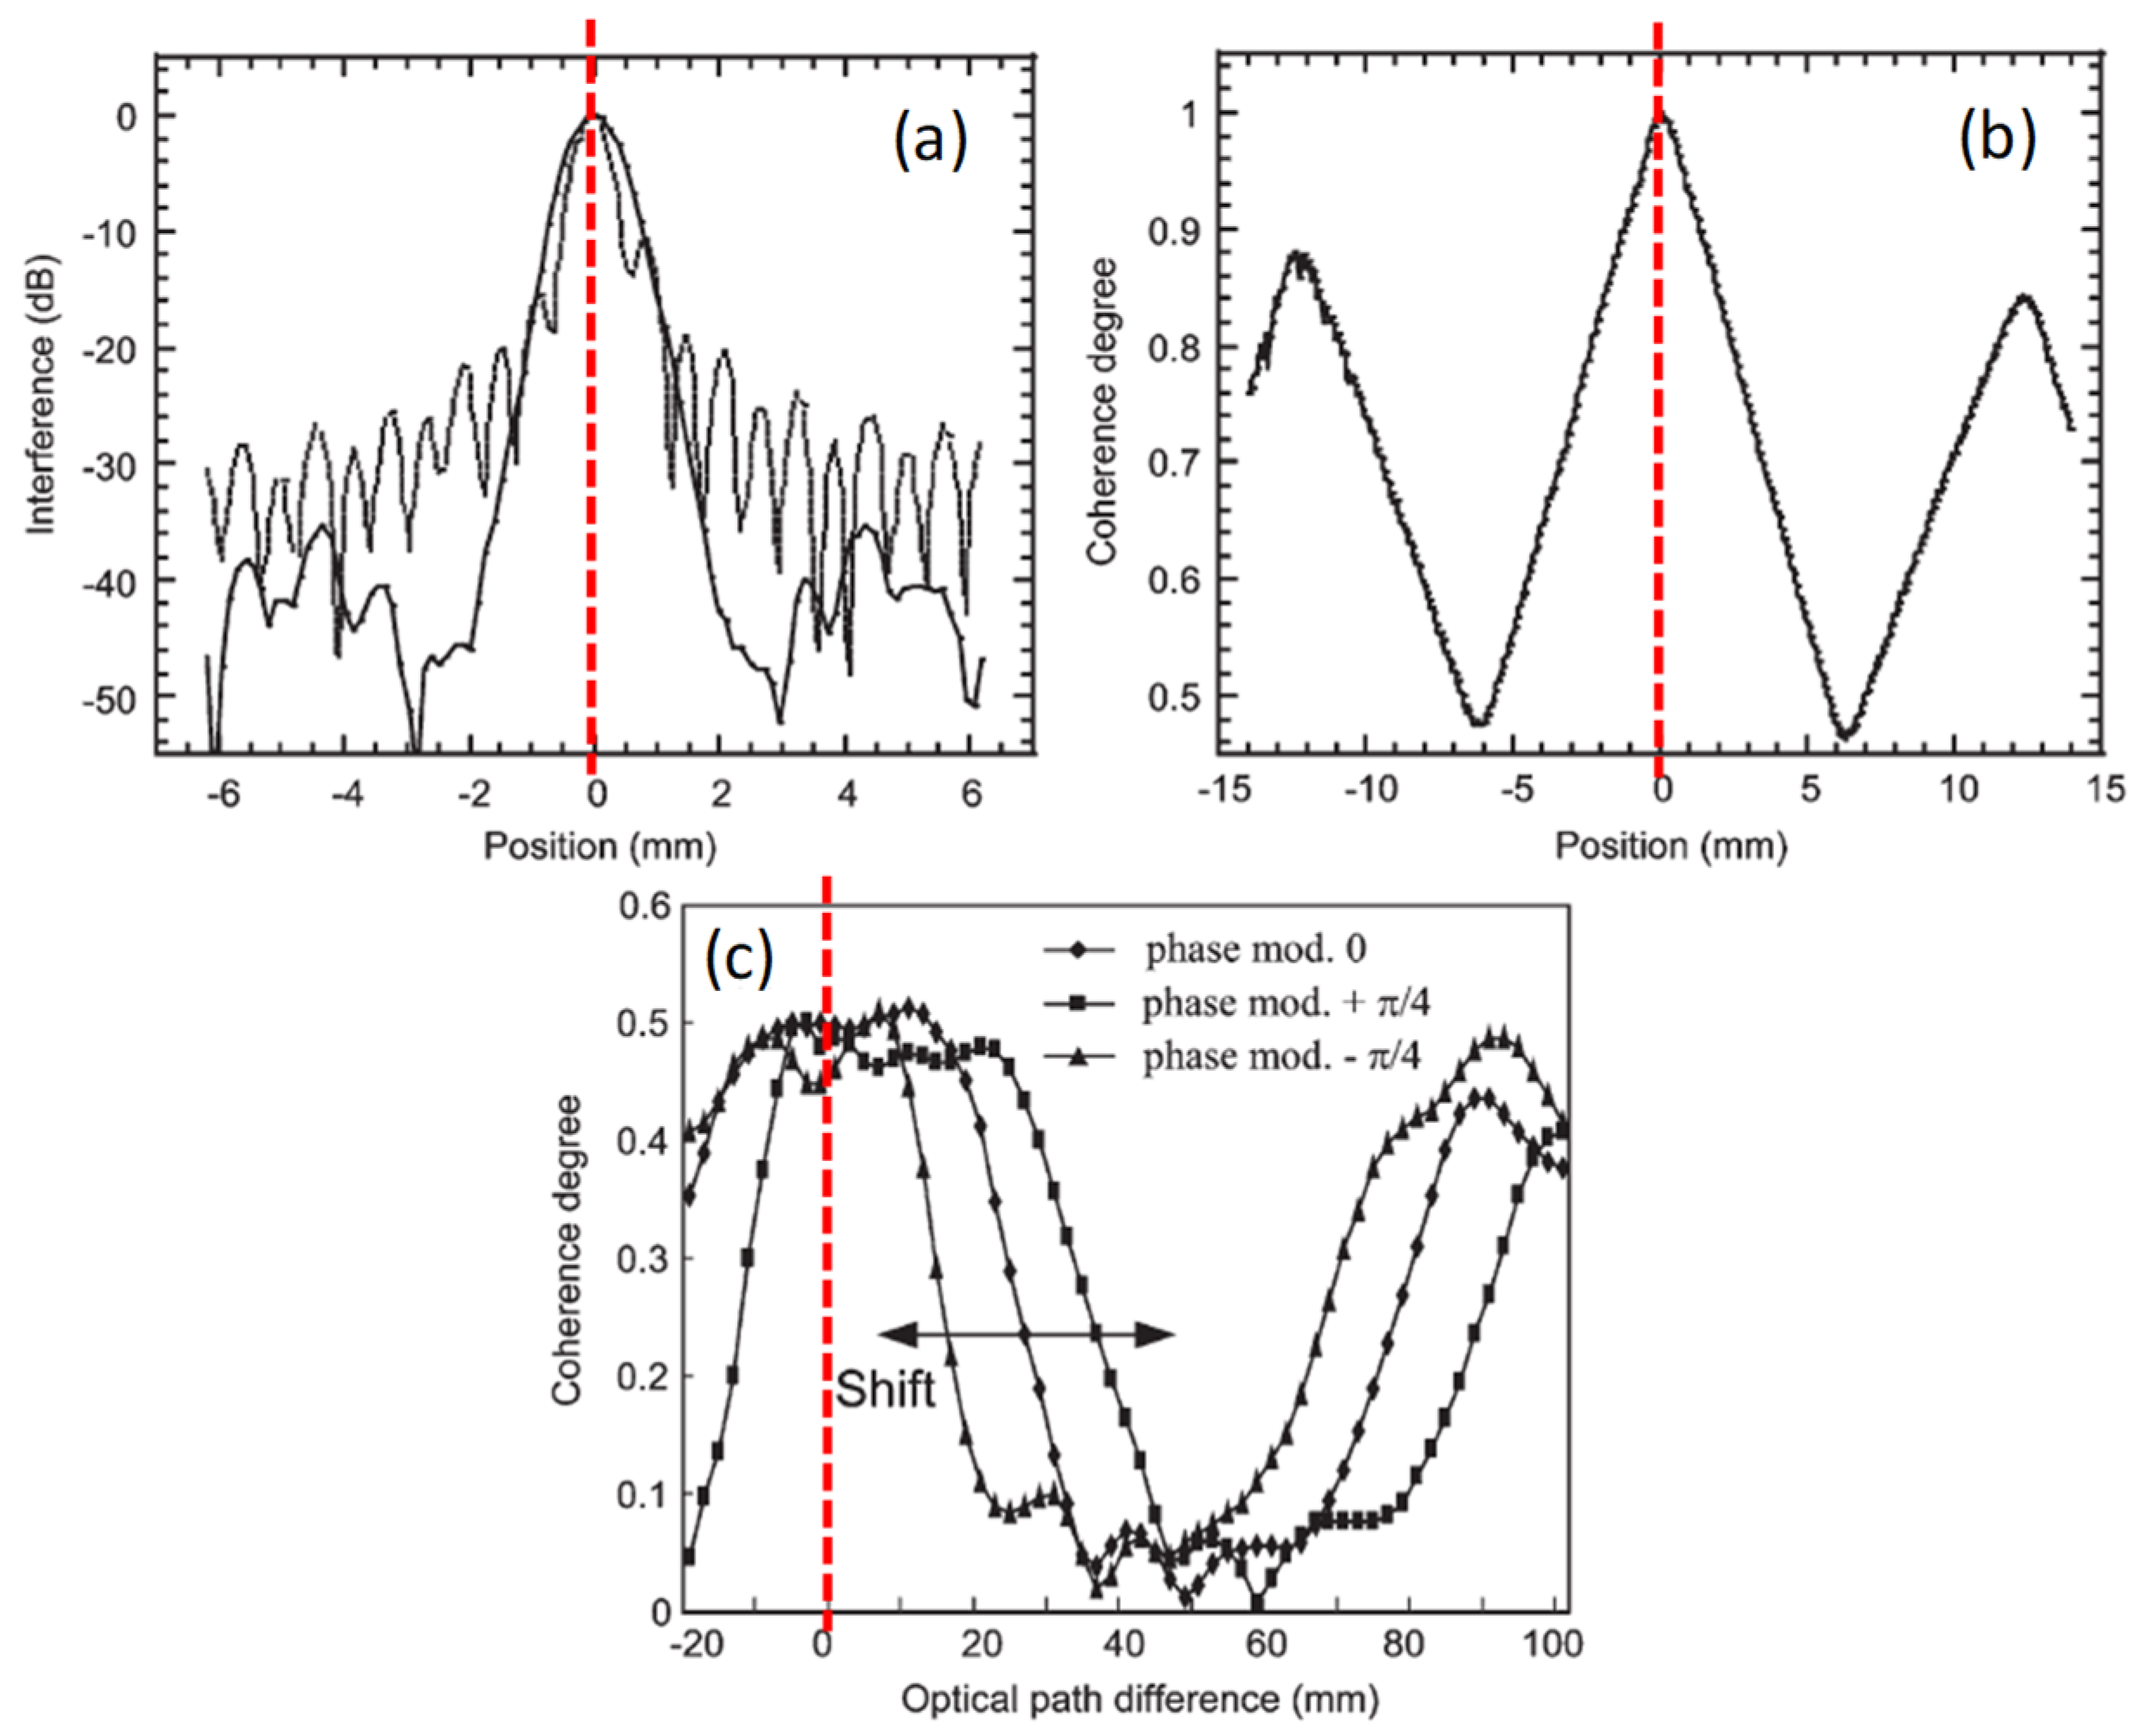
Figure 26a. The fiber is fixed by epoxy glue in stages. The curves that are shown in Figure 26a are the BFS distributions obtained by changing the elongation. In the glue sections, the strain is changed gradually, because the glue is rather soft. In the experiments, the BOCDA spatial resolution is set to be 1.6 mm through Equation (2). In Figure 26b, the two three-mm short sections of a dispersion-shifted fiber (DSF) are fusion spliced with an ordinary single-mode fiber. The two kinds of fibers have a 300-MHz BFS difference, which corresponds to a 6000-με strain difference. Figure 26b clearly shows the short-length and large strain sections, thanks to the IM scheme [51] and the beat lock-in scheme [66].

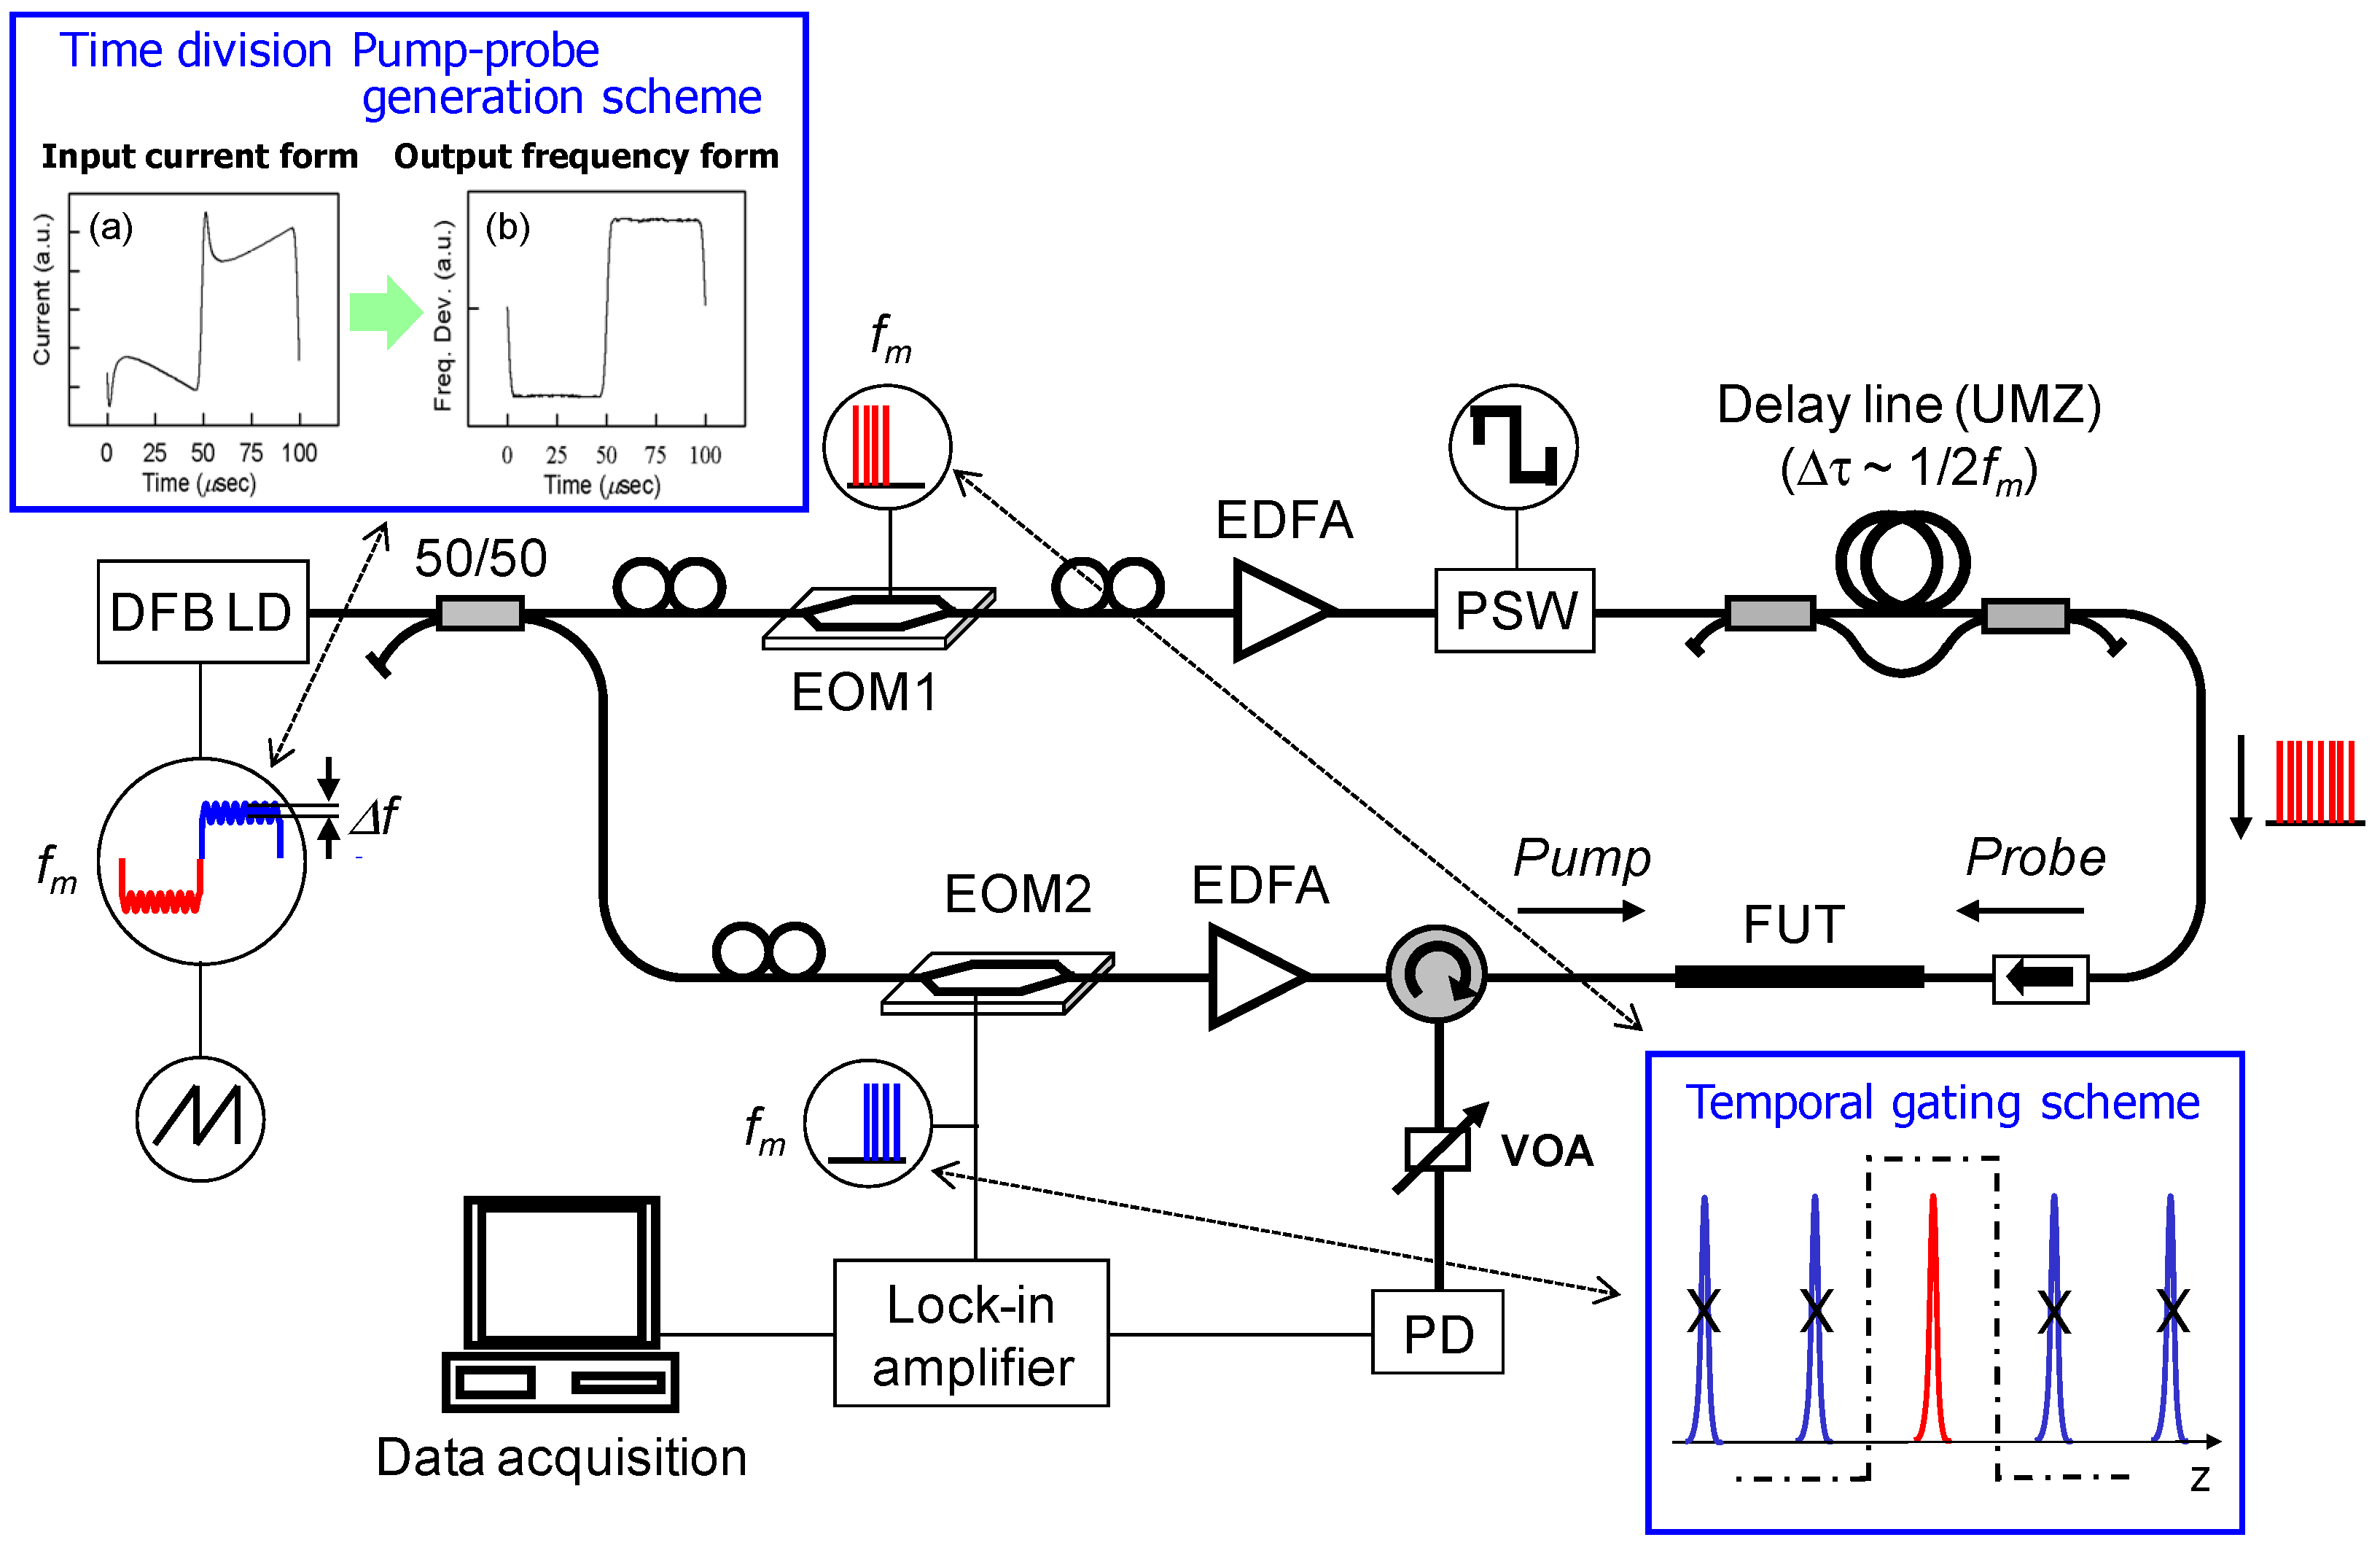
4.4.2. BOCDA System with Temporal Gating Scheme and Time Division Pump and Prove Generation Scheme

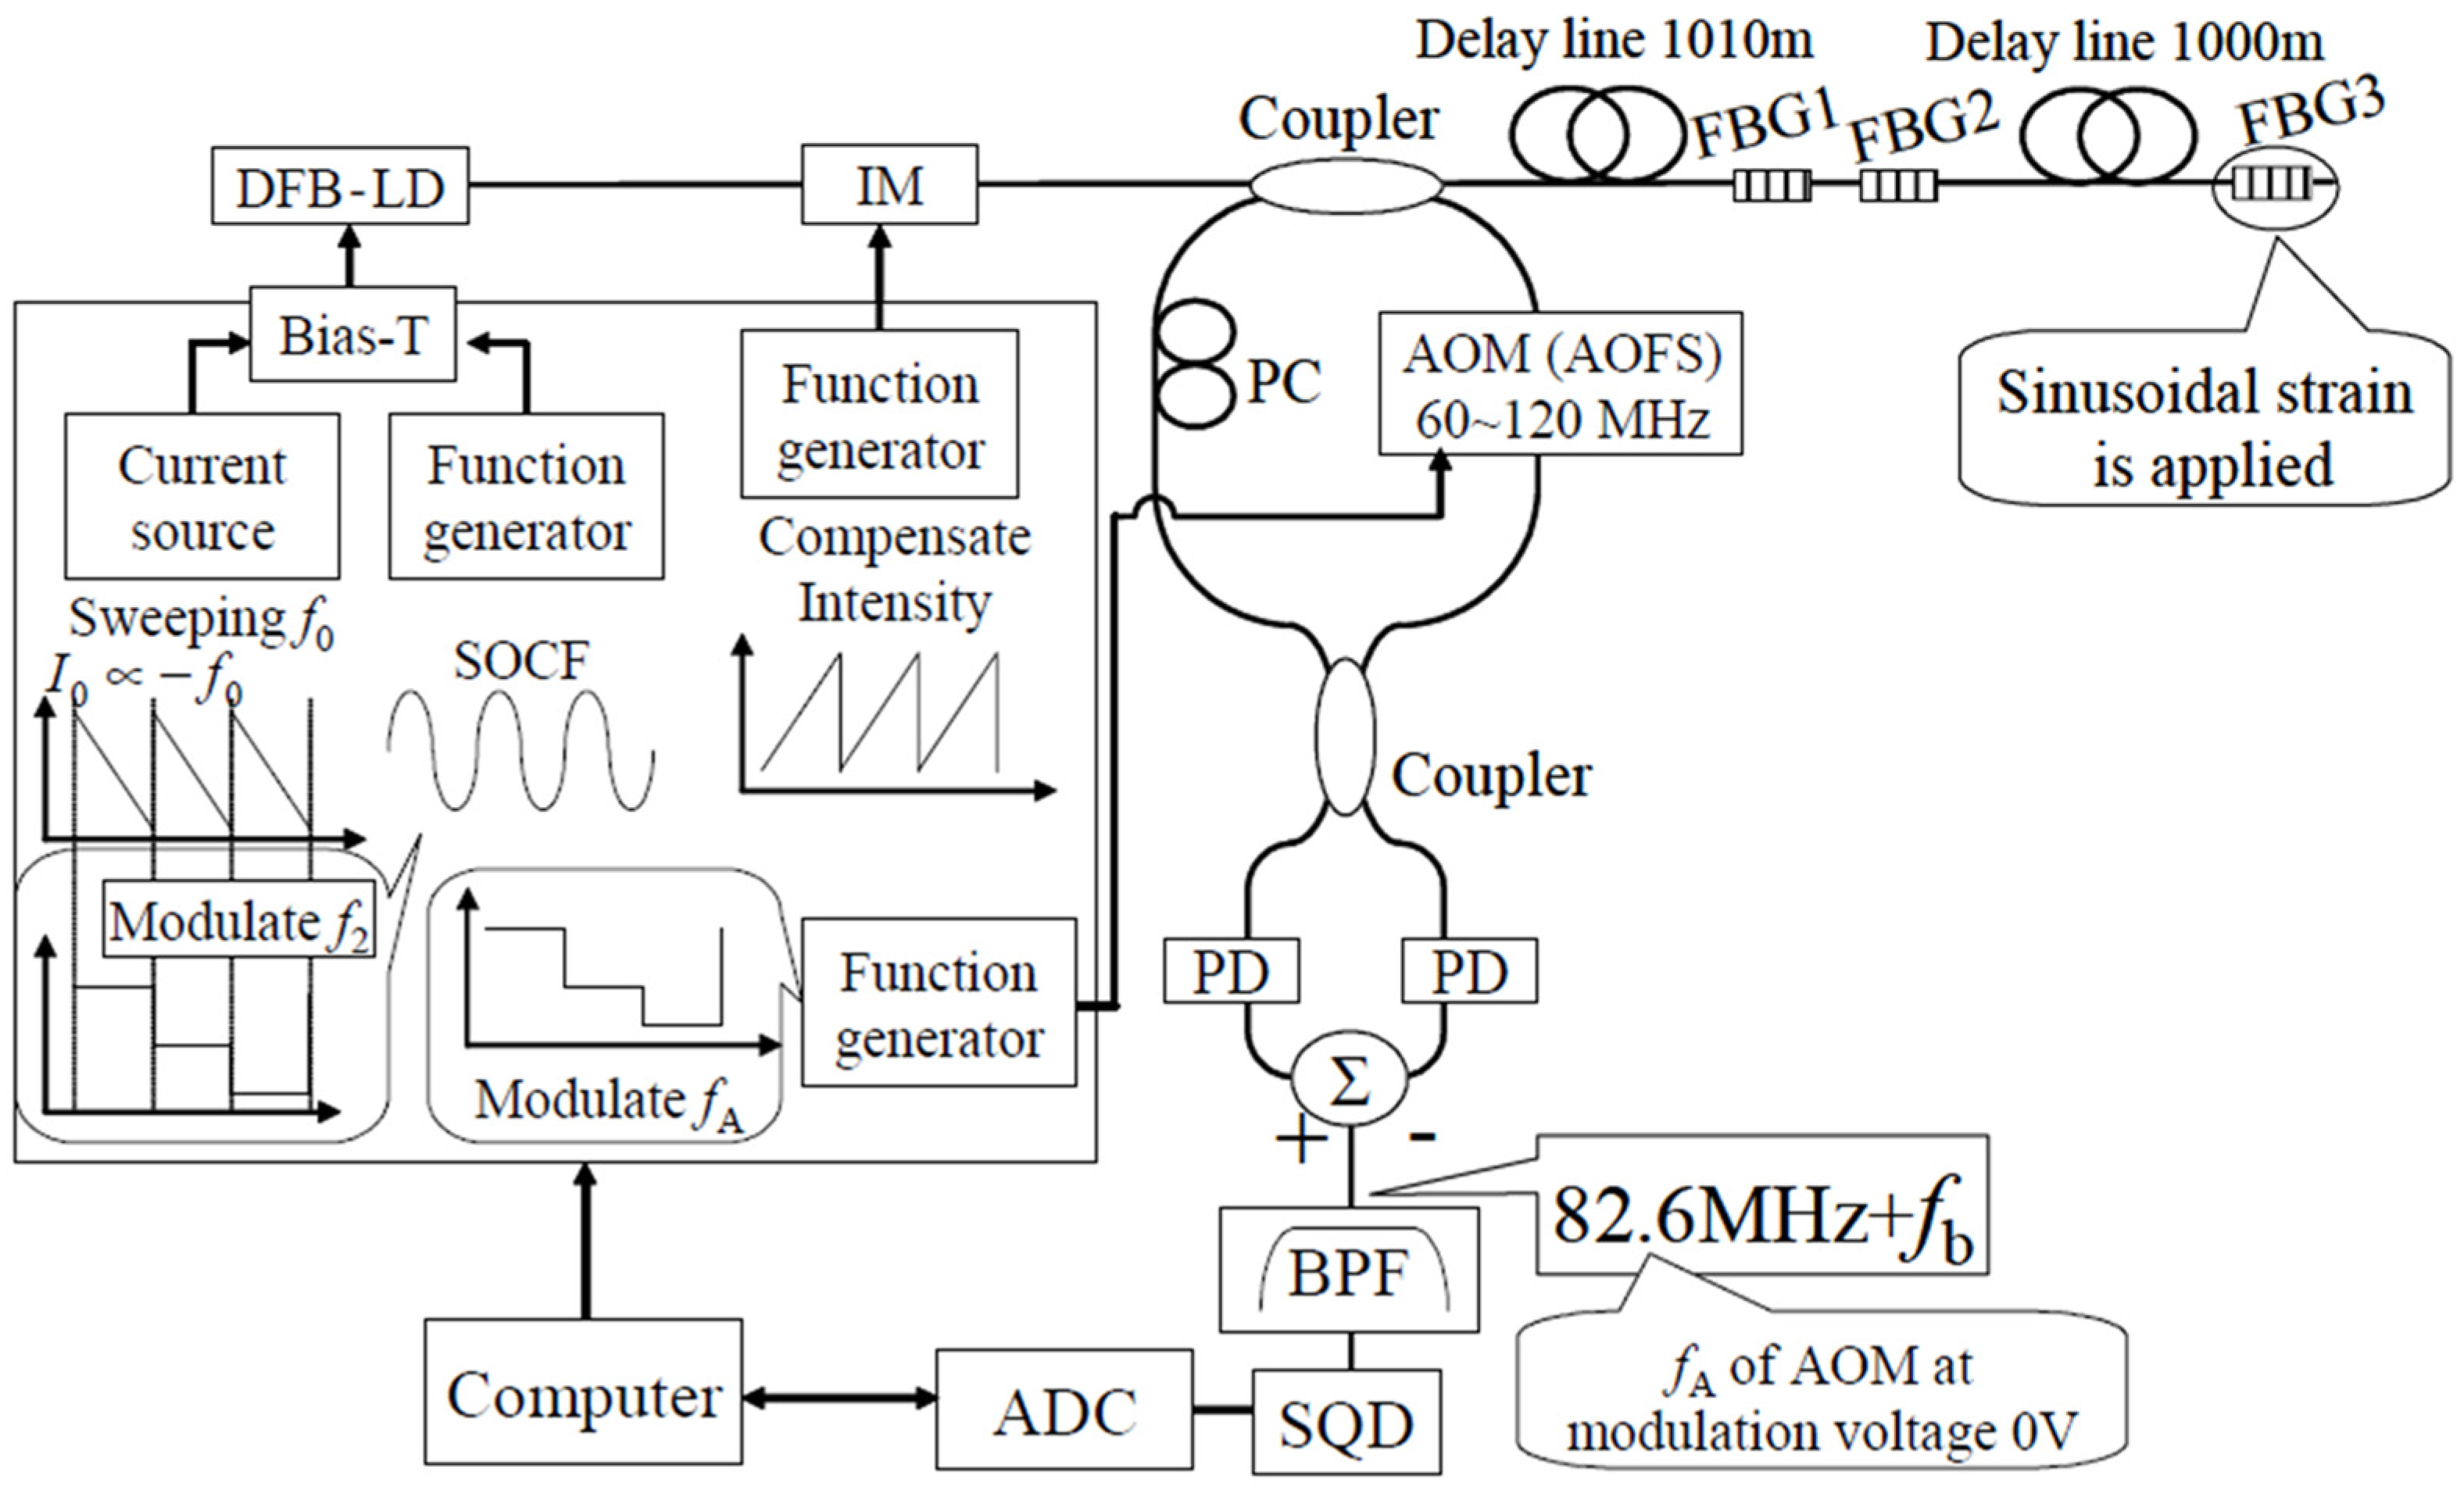
Figure 27 shows a BOCDA system that has the “temporal gating scheme” and the “time-division pump and probe generation scheme” [54].
The direct frequency modulation nature of the LD is also used to set the pump and the prove frequency difference in Figure 27. As shown in an inset at the upper portion, a modified square-waveform current is injected into the LD [59]. The modified waveform shape is synthesized through measuring the frequency response of both the LD and the driving circuits. Figure 27a in the inset is an example of the synthesized current waveform, which can realize a nice square shape of the output laser frequency modulation, as shown in Figure 27b in the inset [59]. The upper and the lower flat portions correspond to the pump and the probe frequency, respectively. The modified square-waveform current for the pump and probe generation and the sinusoidal current for the SOCF are totally injected into the LD, as shown in a circle at the left side of Figure 27.
In the fiber paths for the pump and the probe, EOM1 and EOM2 are set, respectively, to select one of the two frequency portions. This is the principle for the “time-division pump and probe generation scheme” [53]. In this scheme, an expensive SSBM is not used to reduce the cost.
In this system, EOM1 and EOM2 have an additional function, which is the “temporal gating scheme” function. Besides the selection of one frequency portion, the IM modulators select only one FM modulation period and block the following n-1 times FM periods. This realizes one correlation peak position selection among the periodically generated n-times correlation peaks. Then, this scheme elongates the total measurement range by n times, as shown in the lower inset of Figure 27.
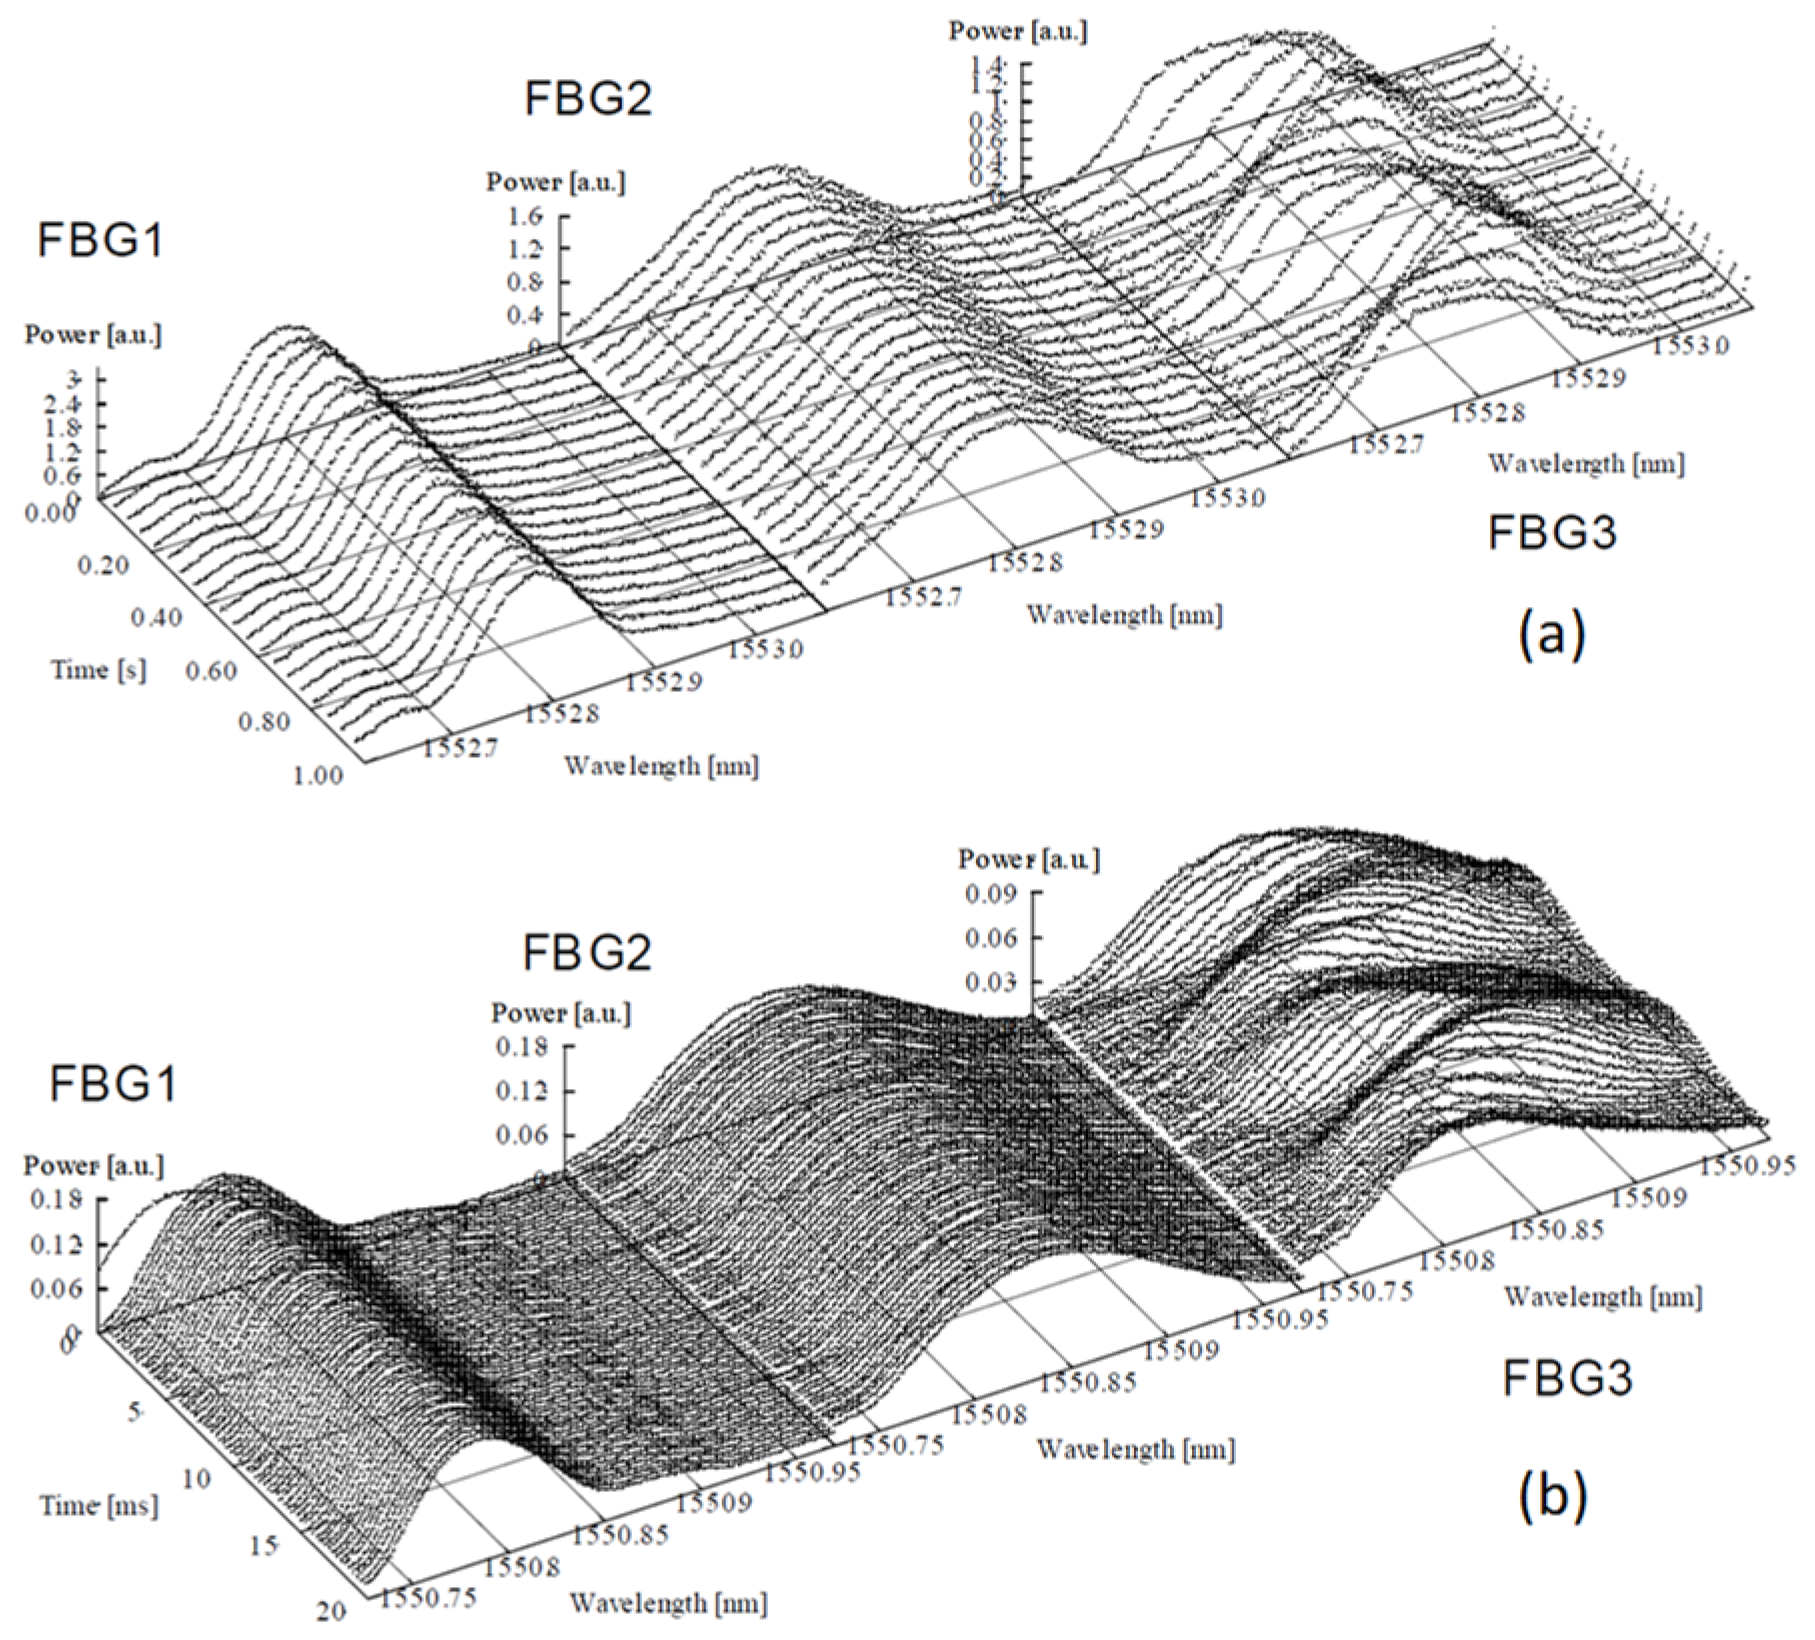
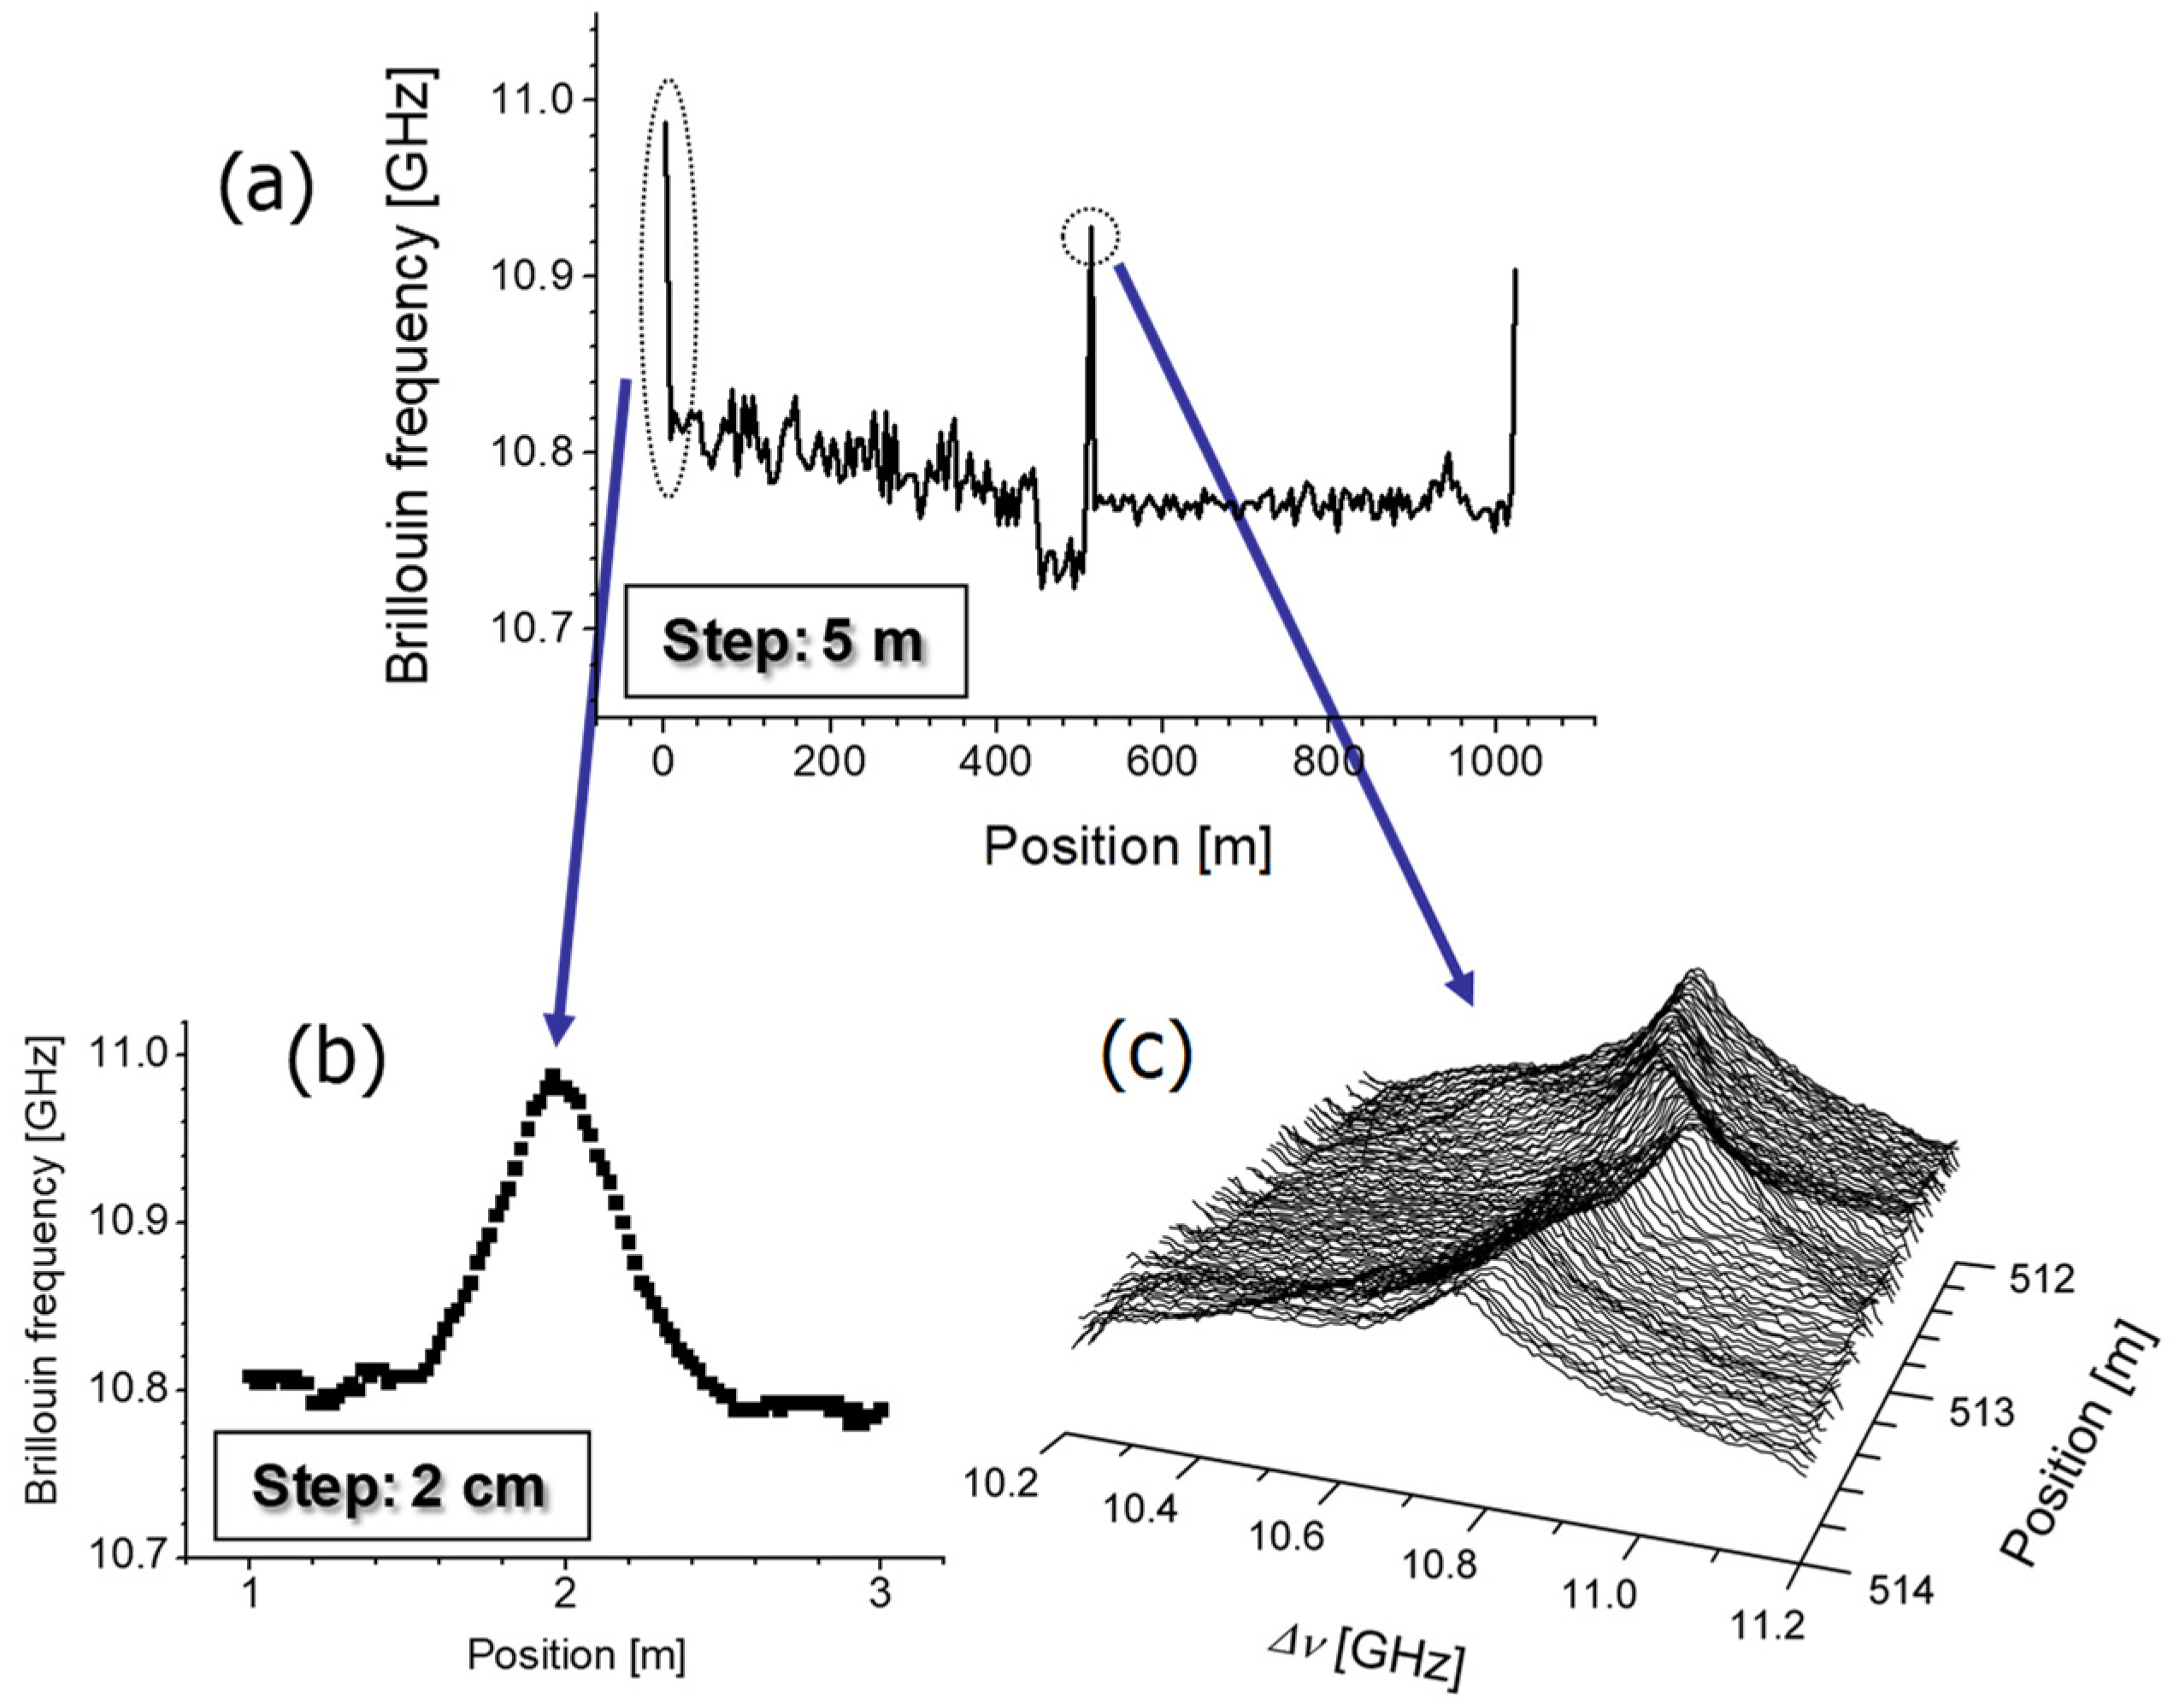
Figure 28 shows a result of the distributed BFS measurement that was obtained by the BOCDA system, as shown in Figure 27 [54]. The spatial resolution is set to be seven cm, and the measurement range is elongated by the “temporal gating scheme” to be 1030 m. The ratio between the range and the resolution is 14,570 [54]. In Figure 28b, the BFS distribution is shown at a strain-applied portion, and Figure 28c shows BGS distribution at another strain-applied portion.

4.4.3. BOCDA System with High-Speed Random Accessibility

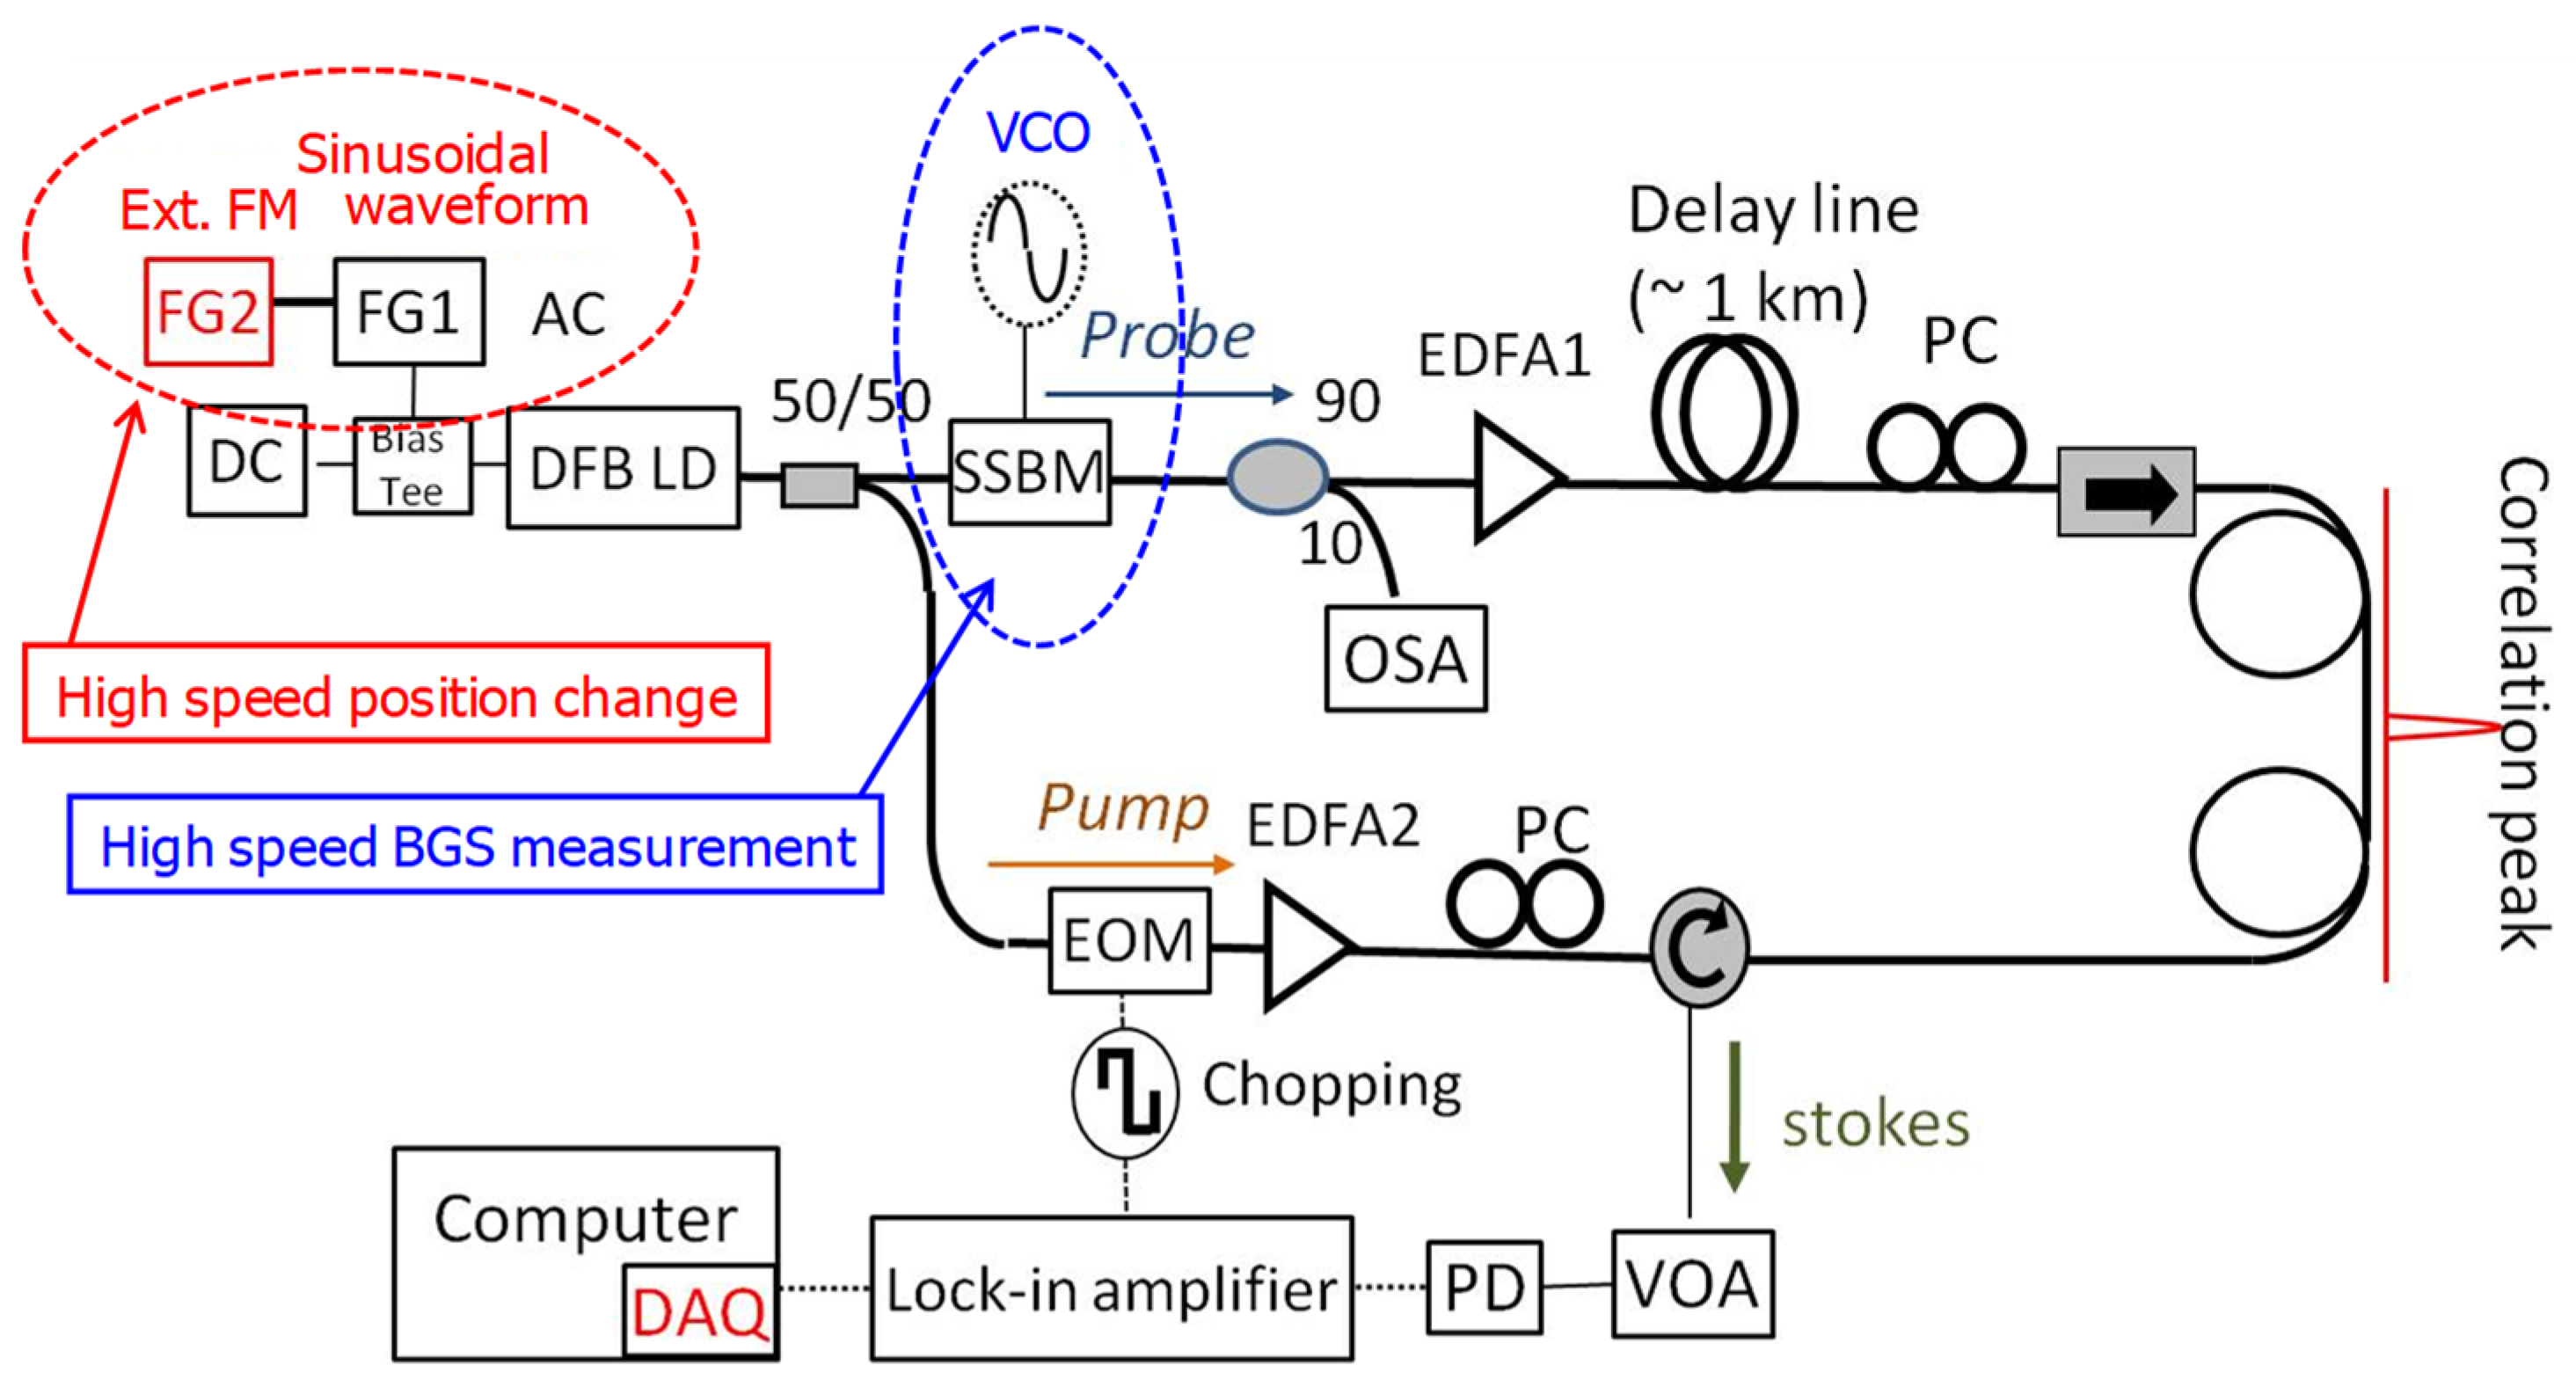
The feature of the BOCDA systems, compared with the time-domain technologies, is the random accessibility. Additionally, the BOCDA can realize a fast measurement speed, because the system utilizes a continuous lightwave. The CW lightwave, of course, has a 100% duty ratio, which means that the lightwave energy is used most efficiently. This is suitable for enhancing the SNR and measurement speed.
The factors related to the individual measurement performance, including the spatial resolution, measurement range, measurement speed, measurement accuracy, strain dynamic range, and so on, have a mutual relationship with each other. Therefore, it is not possible to enhance all of the performance factors at the same time. This aspect shall be discussed briefly later in this section. Before that, we shall show BOCDA systems that have solved practical limitations mainly due to the performance of the equipment.
Figure 29 shows a BOCDA system that was designed to realize a fast random accessing speed [67]. A high-speed change of the measurement point, by changing the SOCF frequency, can be realized by simply using a waveform generator with a high-speed frequency changing function. The frequency difference between the pump and the probe lightwave, which is around 10 GHz, must be also swept in a high speed for measuring the BGS shape. The frequency difference has been generated by the SSBM modulator, which is driven by a microwave synthesizer with a high frequency accuracy. However, in this device, the frequency cannot be swept at a high speed, for example, in kHz order. Then, in Figure 29, a voltage-controlled oscillator is adopted, whose oscillation frequency can be changed quickly by simply changing the input voltage. The frequency stability is enough for application of the BOCDA.
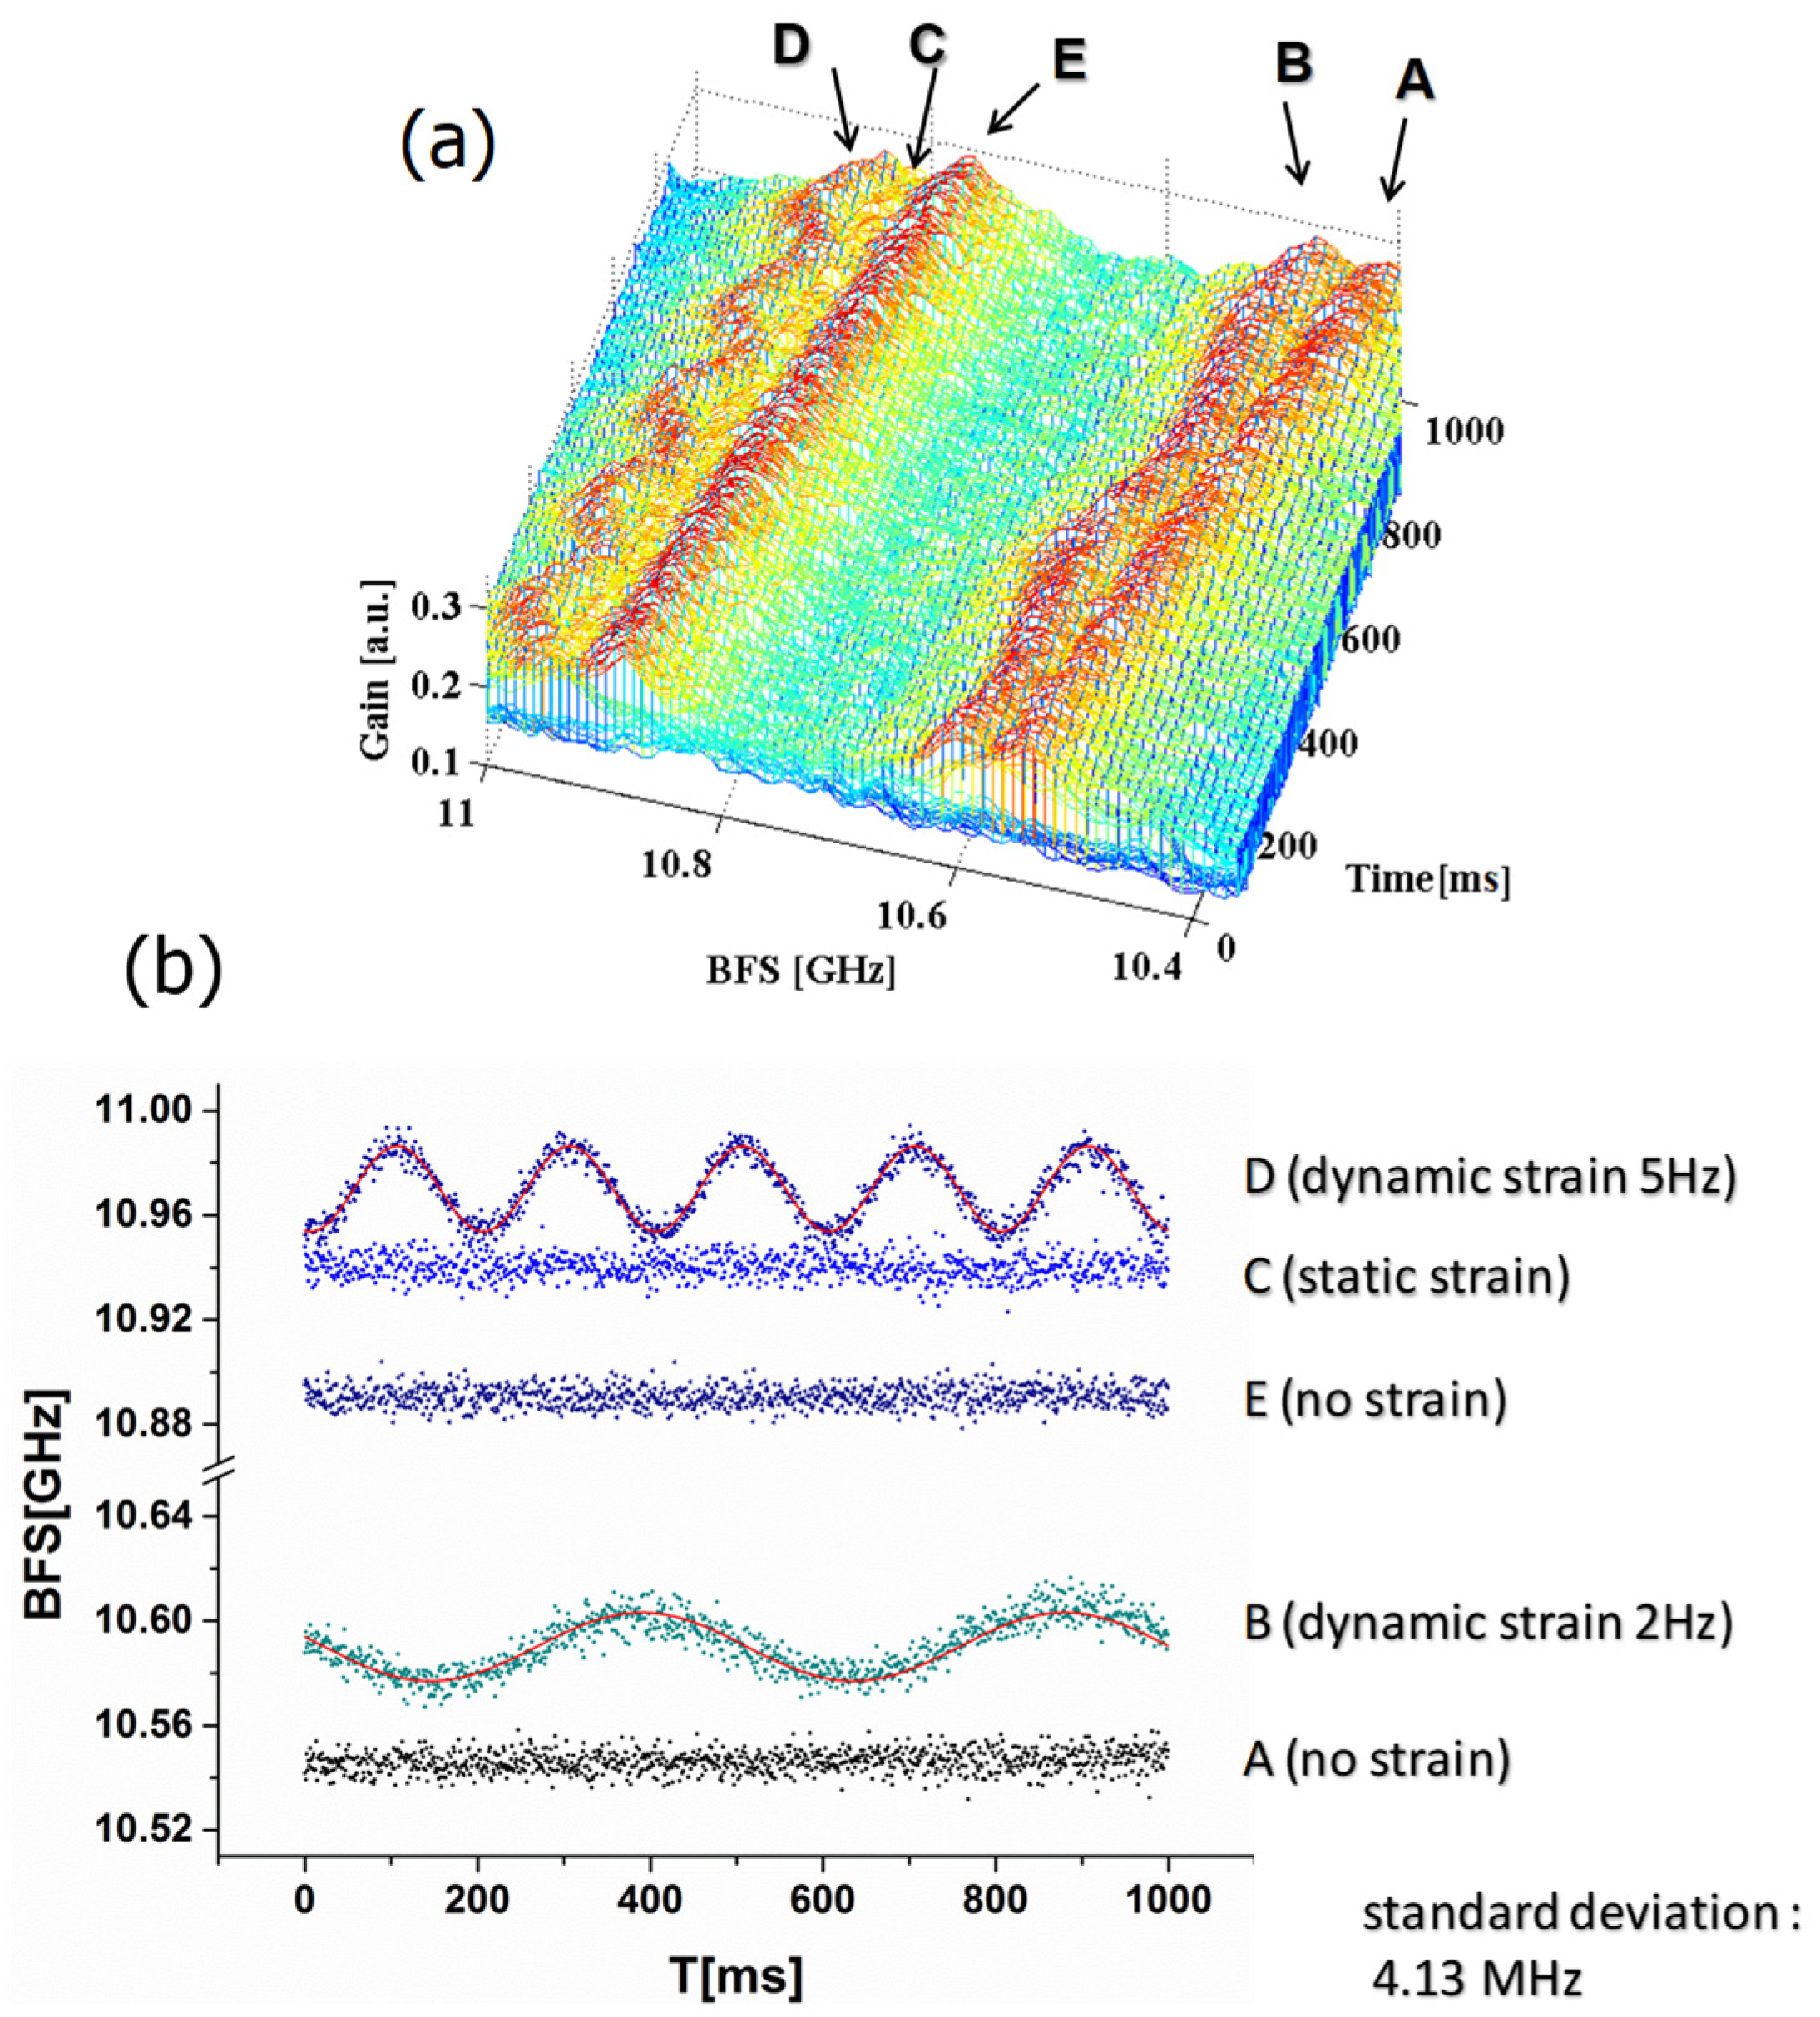
Figure 30 demonstrates a 5000-point high-speed random accessing measurement performed by the system that was shown in Figure 29. Multiple measurement points can be selected arbitrarily along the sensing fiber. In the demonstration shown in Figure 30, five points are selected arbitrarily, and each point is measured at a sampling speed of 1000 samples/s. The measurement points along the fiber are hopped in the sequence of Point A, B, C, D, E, A, B, C, D, E, …, which corresponds to changing the SOCF frequency stepwise at the rate of 5000 times/s. During one step, the frequency difference between the pump and probe lightwave is linearly swept by driving the voltage controlled oscillator (VCO) with a saw-tooth voltage waveform of 5000 Hz. Then, the time-division multiplexed measurement for the selected five points can be demonstrated. Due to the high-speed hopping among the multiple measurement points, simultaneous dynamic strain measurements are realized equivalently, as shown in Figure 30b [67].
In this experiment, the spatial resolution was three cm, and the measurement range was only six meters. Then, elongation of the measurement range was tried by using the temporal gating scheme [68]. In the SOCF technology, which is the principle of the position-selective measurement in the correlation-domain technologies, the system output must be integrated, at least, for one period of the LD frequency modulation in order to realize the position selectivity. Then, the intensity modulation frequency for the lock-in detection should be set at exactly half the SOCF frequency to enhance the random access speed. This means that the lock-in frequency must be changed rapidly when we change the measurement position by the SOCF frequency. However, in an ordinary lock-in amplifier, the reference frequency cannot be changed at a high speed, such as five kHz. Therefore, in Figure 30, the lock-in frequency was set to be constant, which reduced the BFS measurement accuracy. In this experiment, the standard deviation in the BFS measurement was 4.13 MHz. This corresponds to a strain accuracy of about 80 με. In Ref. [68], a lock-in detection circuit was newly established, in which the reference frequency can be changed at a high speed, for example, in the order of kHz. The measurement performances, such as a 200-m measurement range, six-cm spatial resolution, 1000 points/s random access speed, and 1.7-MHz BFS measurement accuracy, have been totally demonstrated.
Recently, we have been studying the limitations of the total performance under random accessibility. One of the dominant restriction factors is the integration time to realize the position-selective function of the correlation-domain technologies, basically which must be at least one period of the LD frequency modulation in the basic BOCDA system. In the case of the double modulation scheme, the integration time should correspond to the lower SOCF frequency. When the temporal gating scheme is introduced to elongate the measurement range, the restricting time becomes one period of the intensity modulation waveform for the gating. This restricting time is required to measure one point in the BGS shape measurement. Namely, to make the BGS spectral shape through measuring, for example, 100 data points, the total measurement time to have one BGS spectral shape takes 100 times longer than the minimum restricting time mentioned above. This means that the random access speed depends closely on the spectral range and the spectral interval in the BGS shape measurement, which correspond to the strain dynamic range and the accuracy. The position-changing time, or the SOCF frequency-changing time, is related to the total random access performances, but it is not always dominant. This was shown in the measurement of Figure 30.
By introducing some additional idea to manage the measurement procedure, we have recently demonstrated the total performance of a seven-cm spatial resolution, 1000-m measurement range, 2500 points/s random access measurement speed, and about 80-με strain accuracy. Here, we introduced both the temporal gating scheme and the double modulation scheme to elongate the measurement range. This study has not been published yet, but will be presented in the near future.

4.5. Application Trials of BOCDA

Besides the studies on the basic principle and the performance improvement schemes [68,69], application trials have also been performed for the BOCDA systems.
Utilizing a centimeter-order spatial resolution, the strain distribution measurement on a surface of a 15-cm diameter pipe was successfully demonstrated, with just one-cm spatial resolution [69]. These trial experiments were done considering a BOCDA application to urban gas pipeline monitoring, which is set under the ground. The measured strain distribution agreed well with a theoretical one [69].
A tiny crack caused on a surface of a steel-reinforced concrete specimen was detected with the centimeter-order spatial resolution of a BOCDA system [70]. Even when the clack width was around 20 μm, the crack was recognized through the distributed measurement of a tensile strain with around one-cm spatial resolution. If the resolution is around one meter, the measured strain is not a tensile one, but rather a compressive one. Then, a tiny crack cannot be detected with low spatial resolution systems.
Utilizing the random accessibility of BOCDA, dynamic strain measurement was performed at multiple points in a tall building model under an earthquake waveform vibration [71]. Even when the strain change between the situations before and after the earthquake vibration was small, the dynamic strain measurement with a sampling rate of 10 samples/s for one point told us that the material had a large strain applied beyond the yielding strain amount several times. This means that the building was almost destroyed by the earthquake waveform vibration.
In the structural health monitoring (SHM) for aircraft wings and bodies, a strain-distributed measurement along the long-length fiber nerve set within the aircraft full body is required. Besides such distributed measurements, dynamic strain measurements at specific selected points are also required. The specific points include, for example, portions around the wheels in landing situations, and connection portions between the wings and the body in flight situations. The random accessibility of the BOCDA technique is fit to such requests. Then, we have been conducting collaboration studies with an aircraft maker on the SHM application of BOCDA systems to aircraft bodies and wings. We have already fabricated several BOCDA prototype models, and performed in-flight tests of the models [72,73,74]. Using a business jet plain, in which the fiber nerve was set on the body material, a strain distribution change between the in-flight and on-ground situation has been successfully measured. The random accessibility has given us the data for simultaneous dynamic strain measurements at arbitrarily selected multiple points along the fiber nerve under the acrobatic flight conditions.
In a civil engineering company, BOCDA systems have already been used to monitor the strain distribution along large real structures, such as an asphalt-faced slope at the bottom of a man-made large pond. The crack detection by the fiber nerve with a centimeter spatial resolution was also performed in a pre-stressed steel-reinforced concrete structure, which is used for a pedestrian deck in practice.
Utilizing the high spatial resolution, we have applied the BOCDA technique to evaluate photonic-integrated circuits. A silica-based planar lightwave circuit (PLC) that has a total waveguide length of 46.8 cm has been evaluated by measuring the BFS distribution with a 5.9-mm spatial resolution [75]. The BFS shift distribution, which corresponds to the waveguide route shape, has successfully been measured [75]. Recently, a BOCDA setup was used to evaluate a silicon-chalcogenide waveguide at the University of Sydney [76].

4.6. Brillouin-Distributed Measurement with Phase Coding by Pseudo-Random Bit Sequence

In the BOCDA technology described above, a continuous wave (CW) lightwave with analog frequency modulation on the pump and probe lightwave was used, which realized the position-selective generation of the stimulated Brillouin scattering along the fiber. Recently, a new concept of a CW wave technology has been introduced [77], in which the pump and probe CW lightwave are modulated in the phase by a common binary pseudo-random bit sequence (PRBS).
In the technology, phase modulation is done by the 0 or π phase in PRBS both for the pump and probe lightwave. Then, the specific position appears where the two lightwaves that have exactly the same sequence meet each other, where the relative phase difference does not takes place to efficiently generate the stimulated Brillouin scattering. At the other portion, the two lightwaves do not have the same correlation due to the PRBS nature. Thus, the position-selective measurement can be done to perform the distributed measurement. The random accessibility can also be realized in the technology.
The spatial resolution is decided by the correlation peak width, which is on the order of half the bit width. The measurement range, or the correlation peak interval, is decided by the PRBS length. PRBS generators can provide sequences even with 231-1 bit length. This corresponds to a billion order of the ratio between the measurement range and the spatial resolution. In Ref. [77], a distributed measurement is demonstrated with about a one-cm spatial resolution and 200-m measurement range.
This technology provides us with a long length and high spatial resolution distributed measurement with random accessibility. Position-selective Brillouin dynamic grating generation has also been demonstrated by this technology [78].

5. Brillouin Optical Correlation Domain Reflectometry

As for the spontaneous Brillouin scattering caused along the fiber, distribution can also be measured by the correlation domain technique. This is called “Brillouin optical correlation domain reflectometry (BOCDR)” [9,55,79,80,81]. In this section, principle and performance improvement schemes for the BOCDR are described.

5.1. Basic BOCDR System

Figure 31 shows a basic setup for BOCDR [9]. A laser diode is used for the light source, and the lightwave is divided into two ways. One is launched to the sensing fiber (fiber under test: FUT) as a pump light, which causes spontaneous Brillouin scattering (SpBS). The backscattered Stokes SpBS is mixed at a fiber coupler with the reference wave from the same LD. A photo diode (PD) receives the interference between the Stokes and the reference wave to output the beat note between the two lightwaves. The intermediate frequency is around 11 GHz, whose spectrum shape is measured and displayed with an electrical spectrum analyzer (ESA). For the position-selective measurement, the LD lightwave frequency is modulated with the direct FM nature of the LD.
In Figure 31, the Stokes wave backscattered at point A has the same phase FM as that of the reference wave, or the two waves that are under the highest correlation. Therefore, the beat note between the Stokes caused at point A and the reference wave shows a Lorentz-shaped spectrum with a width of around 30 MHz. However, the Stokes waves that are caused at non-correlation points, such as point B in Figure 31, shows the broadened spectrum shape, or the background spectrum shaped like a mountain. The BOCDR output spectrum, which is measured directly by the ESA, is almost the same as that measured in the BOCDA system [9,81].
The performance improvement schemes that have been proposed and developed for the BOCDA systems can also be applicable to the BOCDR systems. Several examples of the BOCDR systems with the performance improvement schemes are shown in the following section.

5.2. BOCDR Systems with Performance Improvement Schemes

Figure 32 shows simulations and experiments regarding the intensity modulation scheme for reducing the background spectrum in the BOCDR system [82]. In BOCDR, the IM modulator for the scheme is set just after the laser source, for example, in Figure 31. In Figure 32, the FUT was formed by an ordinary SMF fiber with a short-length DSF section between the SMFs.
In Figure 32, four cases are described [82]. These are no IM modulation, IM by a sinusoidal waveform where both edges of the LD power spectrum are reduced to be zero, IM by a Gaussian waveform in which both edges of the LD power spectrum are also reduced to be zero, and IM by a Gaussian waveform with peaks to recover the power at both edges, which is called the “optimized modulation” in Figure 32. Figure 32b,c shows, respectively, the BGS measurement at the DSF section, and that at the SMF section. In the no-IM case, of course, the mountain-shaped background spectrum fully remains, as was shown also for the BOCDA in Section 4.4.1. Thus, the DSF section cannot be recognized both in the simulation and in the experiment. On the contrary, in the three other cases, the mountain-shaped background spectrum is clearly reduced. Then, the DSF section can clearly be recognized, as shown in Figure 32b. However, in Figure 32b, the dip that was caused at the BFS frequency of 10.85 MHz corresponded to the BFS frequency of the single mode fiber (SMF) or no strained portion. When we measure the SMF section, the dip reduces the Lorentz-shaped signal spectrum, as shown in Figure 32c. Therefore, we need to recover the power at both edges of the LD power spectrum through using the “optimized IM modulation”.
Figure 33 shows the experimental results of the distributed measurement of the BFS at the five-cm DSF section with one-cm spatial resolution [83]. The DSF section could not be recognized without the IM scheme due to the background spectrum, but it can be recognized through using the IM scheme.
Another scheme to reduce the background spectrum is the “differential modulation scheme”, which was originally proposed and demonstrated for the BOCDA system by Professor Song et al. in Chung Ang University, Korea. This scheme has been also tried for use in the BOCDR system [84,85].
In Ref. [84], a phase modulator is set at the reference lightwave arm of a BOCDR system. Then, the BOCDR output spectrum is measured with and without the PM modulation. Schematic drawings for the two cases are shown in Figure 34a,b, respectively [84]. In the situation where the Brillouin scattering and the reference are highly correlated with each other, which corresponds to the correlation peak position, the PM distorts the Lorentz-shaped signal spectrum, as shown in Figure 34b. By subtracting the spectrum with the PM from the spectrum without the PM, the signal spectrum is featured, as shown in Figure 34c. This is the mechanism to reduce the background spectrum in the “differential modulation scheme” [52] or the “phase modulation scheme” [84].
In Figure 35, experimental verification of the “phase modulation scheme” for the BOCDR system is shown [84]. The red and the blue curve correspond to the measurement at the DSF section and the SMF section, respectively. Figure 35a,b show the BOCDR spectrum without the PM, and with the PM, respectively. Figure 35c shows the subtracted spectra, in which the signal spectrum for the DSF and the SMF portion is clearly shown by the red and the blue curves, respectively.
Recently, a BOCDR system has been formed, in which the four performance improvement schemes are introduced [86]. The “intensity modulation scheme” [87] and the “phase modulation scheme” [84] are set in the system to reduce the background spectrum. The “temporal gating scheme” [87] and the “double modulation scheme” [84] elongate the measurement range. Figure 36a–c show synthesized coherence functions for the FM frequency of f0, 4f0, and f0 with 4f0, respectively [55]. As shown in Figure 36c, the double FM using the two frequencies that have the ratio of an integer can elongate the main peak interval while keeping the width of the main peak, which corresponds to the spatial resolution.
In Ref. [86], BOCDR simulations were performed to confirm the validity of the simultaneous use of the four schemes. For example, it is shown in the simulation that the double-modulation scheme introduces the additional background noise spectrum. However, the intensity modulation can also reduce the additional noise components.
Figure 37 shows an example of the BFS distribution measured by this BOCDR system [86]. In this measurement, the double-modulation scheme elongates the range by eight times, and the temporal gating scheme additionally elongates by 31 times. Then, the total elongation is 248 times. The FUT length was 5280 m, and the spatial resolution was 3.94 cm. The ratio between the range and the resolution is 134,000, which is the largest ratio that is realized in the BOCDR systems [86].
A larger ratio has been demonstrated in a BOCDA system, thanks to a higher S/N ratio obtained by the larger Brillouin scattering power, compared with the BOCDR systems. Upon introducing the “double modulation scheme”, “temporal gating scheme”, and the “differential modulation scheme”, the ratio of 1,000,000 was demonstrated [88]. This is the highest value demonstrated by all of the correlation domain techniques.
As for “the phase modulation scheme” in the BOCDR systems, quite a simple way to realize the background spectrum suppression has recently been proposed. In a process to derive the formula that describes the background spectrum reduction with the phase modulation scheme, it has been found that the reduction can also be realized by simply calculating a convolution between the output spectrum of the basic BOCDR system without any PM modulator with a filtering function. This filtering function can simply be formed from the spectrum shape corresponding to the PM modulation. This can simplify the BOCDR system while keeping the background reduction function [89].

6. Brillouin Dynamic Grating and Its Application to Discriminative and Distributed Measurements of Strain and Temperature

In the stimulated Brillouin scattering process, the propagating refractive index grating due to the acoustic wave is enhanced. Then, under the condition that the grating is excited by one eigen polarization mode in a polarization-maintaining fiber, the orthogonal polarization mode might also be reflected in the Bragg reflection condition. We have confirmed this Bragg reflection in the PM fiber in 2008 through collaborative work with Chung Ang University, Korea [19,20]. This phenomenon is named “Brillouin dynamic grating (BDG)”. The distributed measurement of BDG was performed in the correlation-domain technology [90] and the time-domain technology [91]. Additionally, the BDG is confirmed for use in the discriminative measurement of the strain and temperature of the distributed measurement situation.
In our laboratory, another dynamic grating had also been realized by utilizing the gain saturation phenomenon in erbium-doped optical fiber before the demonstration of BDG [92]. Additionally, with the EDFA dynamic grating, strain-distributed measurement had also been demonstrated [93,94].

6.1. Dynamic Grating Generation with Gain Saturation Phenomenon in Erbium-Doped Optical Fibers

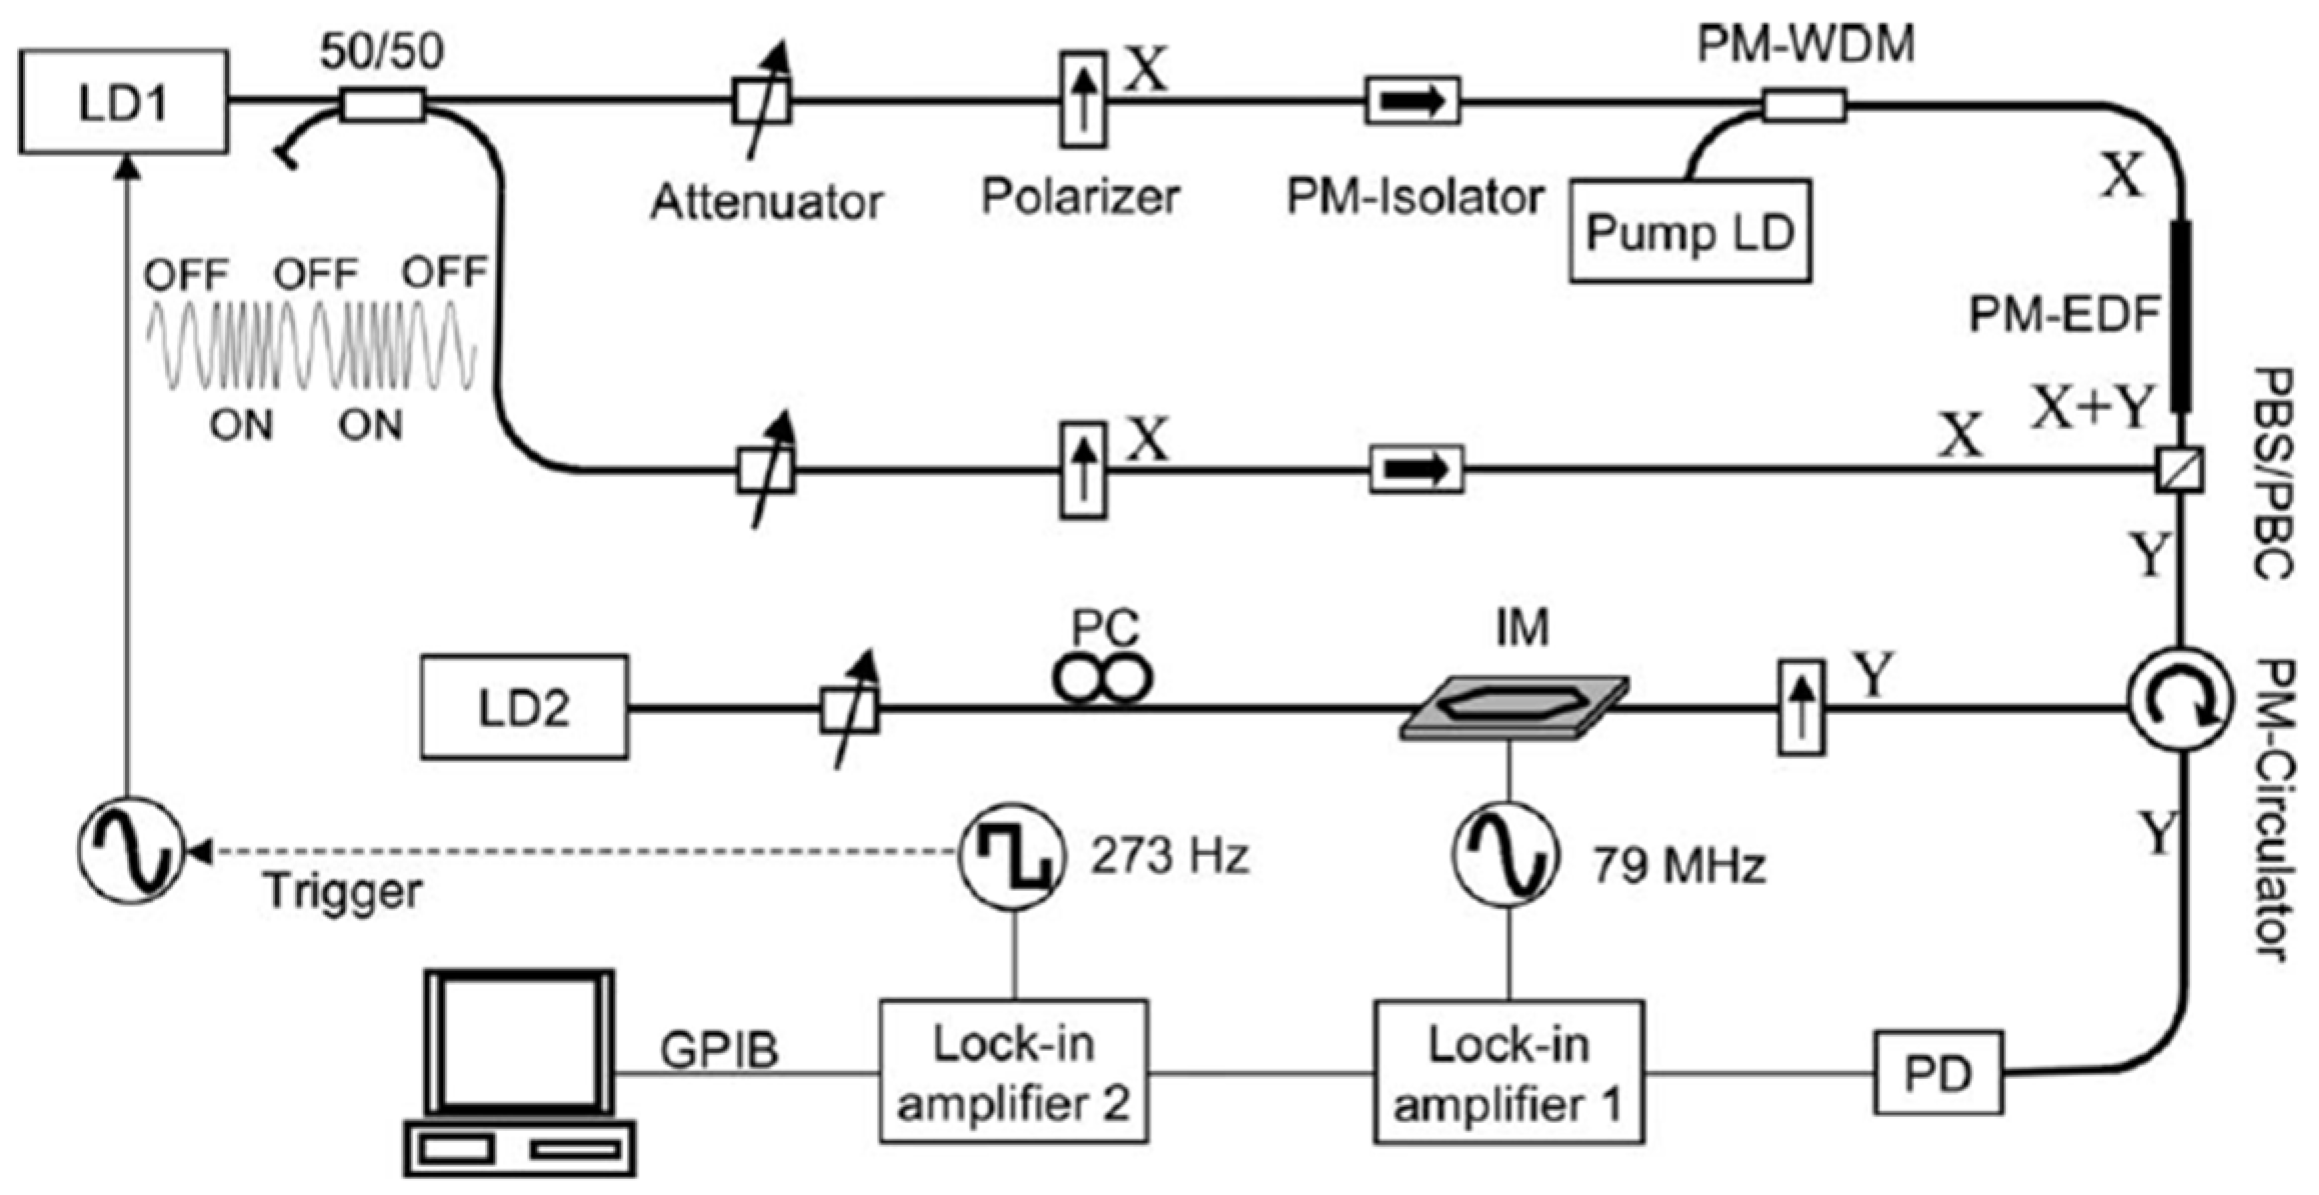
Figure 38 shows an experimental setup for distributed strain measurement, in which a dynamic grating caused along a polarization maintaining erbium-doped fiber (PM-EDF) is localized by the SOCF principle [94].
A continuous laser lightwave emitted from LD1 with a 1.55-μm wavelength is divided into two ways by a fiber coupler. The two waves are launched into the PM-EDF in one of its polarization axes, X, at each fiber end, respectively. In the EDF, a standing wave is generated by the two counter-propagating waves. This standing wave, of course, creates a periodical lightwave intensity change that has the period of half the wavelength, which creates the periodical gain saturation, namely the periodical gain grating. When another orthogonal polarization lightwave is launched into the fiber, it shall be reflected under the Bragg condition that is satisfied. Here, the SOCF is introduced with a FM to LD1, which makes the gain grating localized at the correlation position along the fiber. This is the localization of the gain saturation-induced dynamic grating manipulated by the SOCF technology [94].
Meanwhile, LD2 output is launched into the PM-EDF in the other polarization axis, Y. By sweeping the lightwave frequency, the reflection spectrum can be measured as the output of a photo diode (PD). It is important that the Bragg condition for the Y polarization is shifted, due to the fiber birefringence, compared with the X polarization. When the strain is applied to the fiber, the Bragg frequency is additionally shifted. Then, the system can provide the distributed strain measurement function. To reduce the non-desired reflections and Raleigh backscattering, a two-stage lock-in detection scheme is introduced in the system, which is similar to the “double lock-in scheme” for the BOCDA systems.
Figure 39a shows the experimental results when a 20-cm section in the PM-EDF is strained by 1400 με. The spatial resolution, which corresponds to the width of the synthesized delta function-like coherence peak, is about 20 cm in this experiment. Figure 39b shows the peak frequency plots obtained from Figure 39a. The strained section is recognized through the distributed measurement data to be about 30 cm. Considering the spatial resolution, the distributed data that are shown in Figure 39 are reasonable [94].

6.2. Generation of Brillouin Dynamic Grating in Polarization-Maintaining Fiber

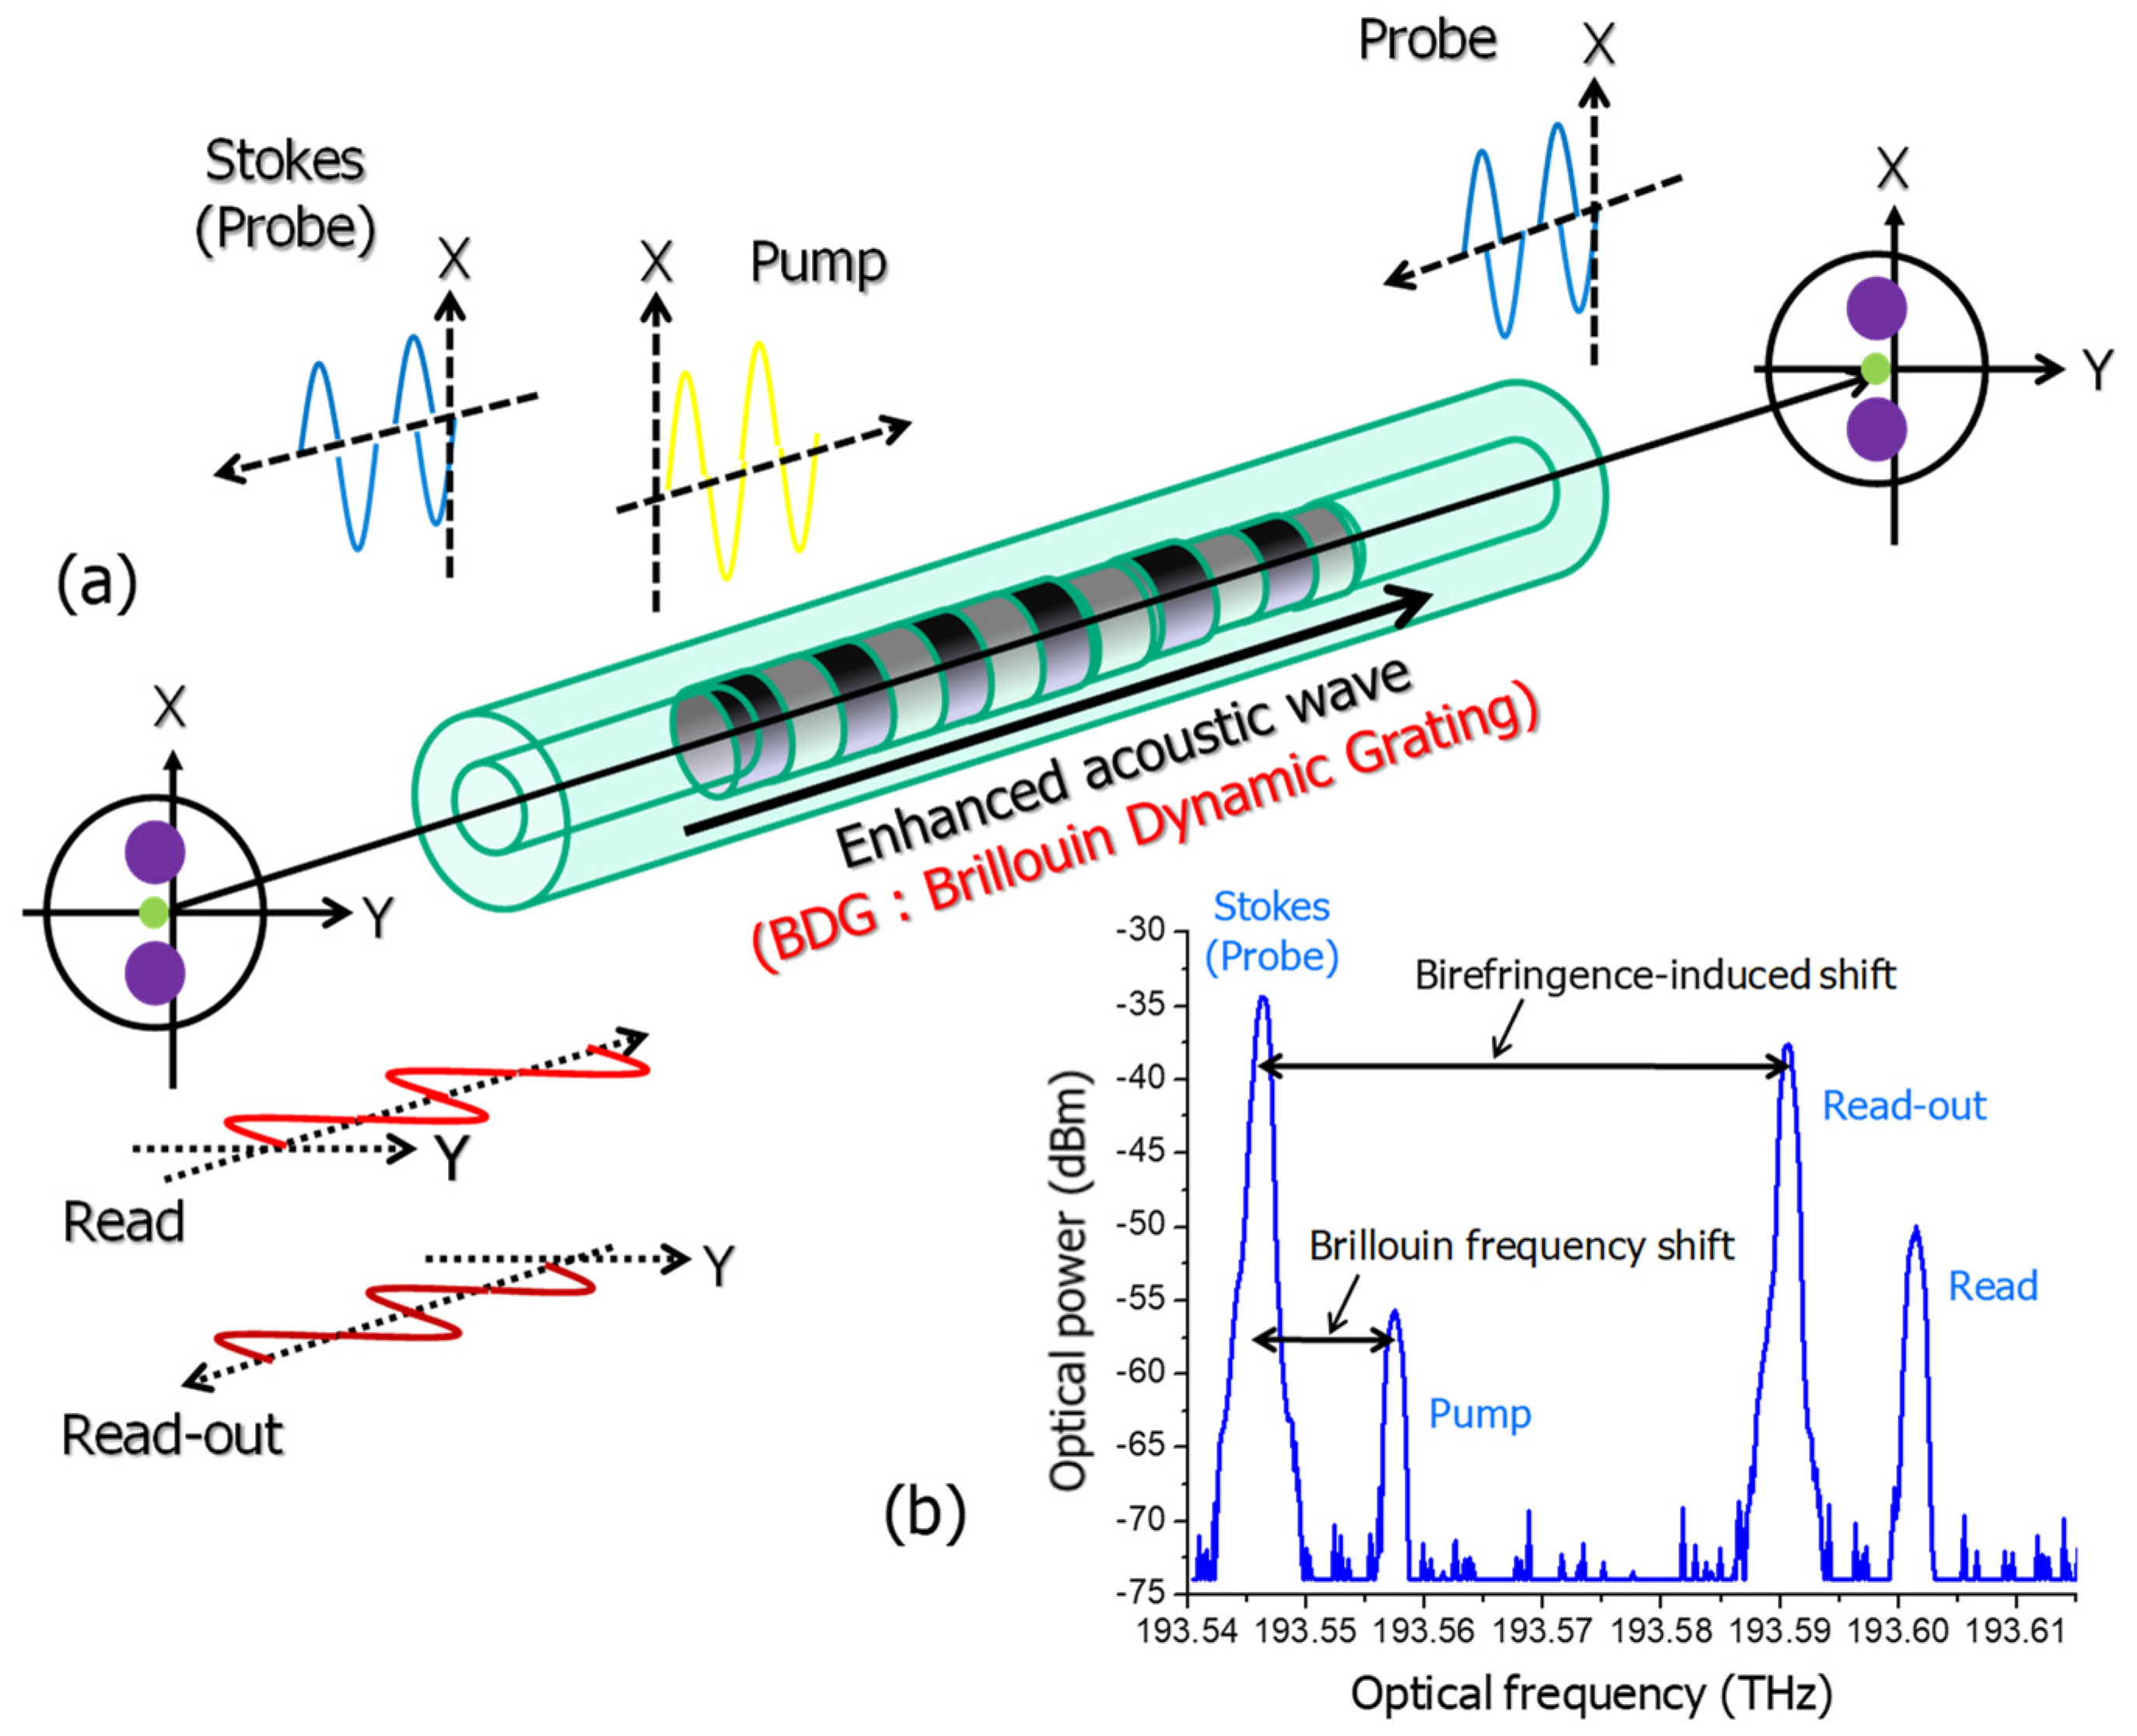
Figure 40a schematically shows the generation of the Brillouin dynamic grating in a polarization-maintaining fiber (PMF). When the pump and probe lightwave are launched at each end of the fiber, respectively, on one polarization axis, and propagate in the fiber in the opposite directions with respect to each other, the stimulated Brillouin scattering takes place. Associated with the stimulated Brillouin scattering process, the molecular thermal vibration-induced acoustic wave is enhanced, which enlarges the propagating refractive index grating. It was thought that the orthogonal polarization lightwave could also be reflected when the Bragg condition is satisfied [19,20].
Figure 40b shows an example of the Bragg reflection of the orthogonal polarized lightwave [20]. The two spectral lines shown on the left side of Figure 40b are the Rayleigh backscattering of the pump light launched for the +z direction on the X polarization axis, and the stimulated Brillouin scattering propagating for −z direction, also on the X polarization axis. The frequency difference between the two waves is just the BFS. On the right side of Figure 40b, two other lines are seen. One is the Rayleigh backscattering of the reading lightwave propagating for the +z direction on the Y polarization axis, and the other is the read-out wave that is the reflection of the reading lightwave that satisfies the Bragg condition. Due to the birefringence of the PMF, the Bragg wavelength or the frequency is different from those of the pump lightwave. In this experiment, the Bragg frequency difference is about 45 GHz.
After the BDG phenomenon was demonstrated, several basic studies and applications have been performed [95,96,97,98,99,100,101,102,103,104,105]. Examples are the discriminative distributed measurement of strain and temperature, variable optical delay lines, correlation domain-distributed sensing of the BDG spectrum, time domain-distributed sensing of the BDG spectrum, distributed temperature sensing, distributed birefringence measurement along a polarization maintaining fiber, a cm-order high spatial resolution-distributed measurement with BOTDA technologies, and so on.
Among these application studies, the technique for the discriminative and distributed measurement of stain and temperature is described in the following section, which utilizes BOCDA and BDG technologies.

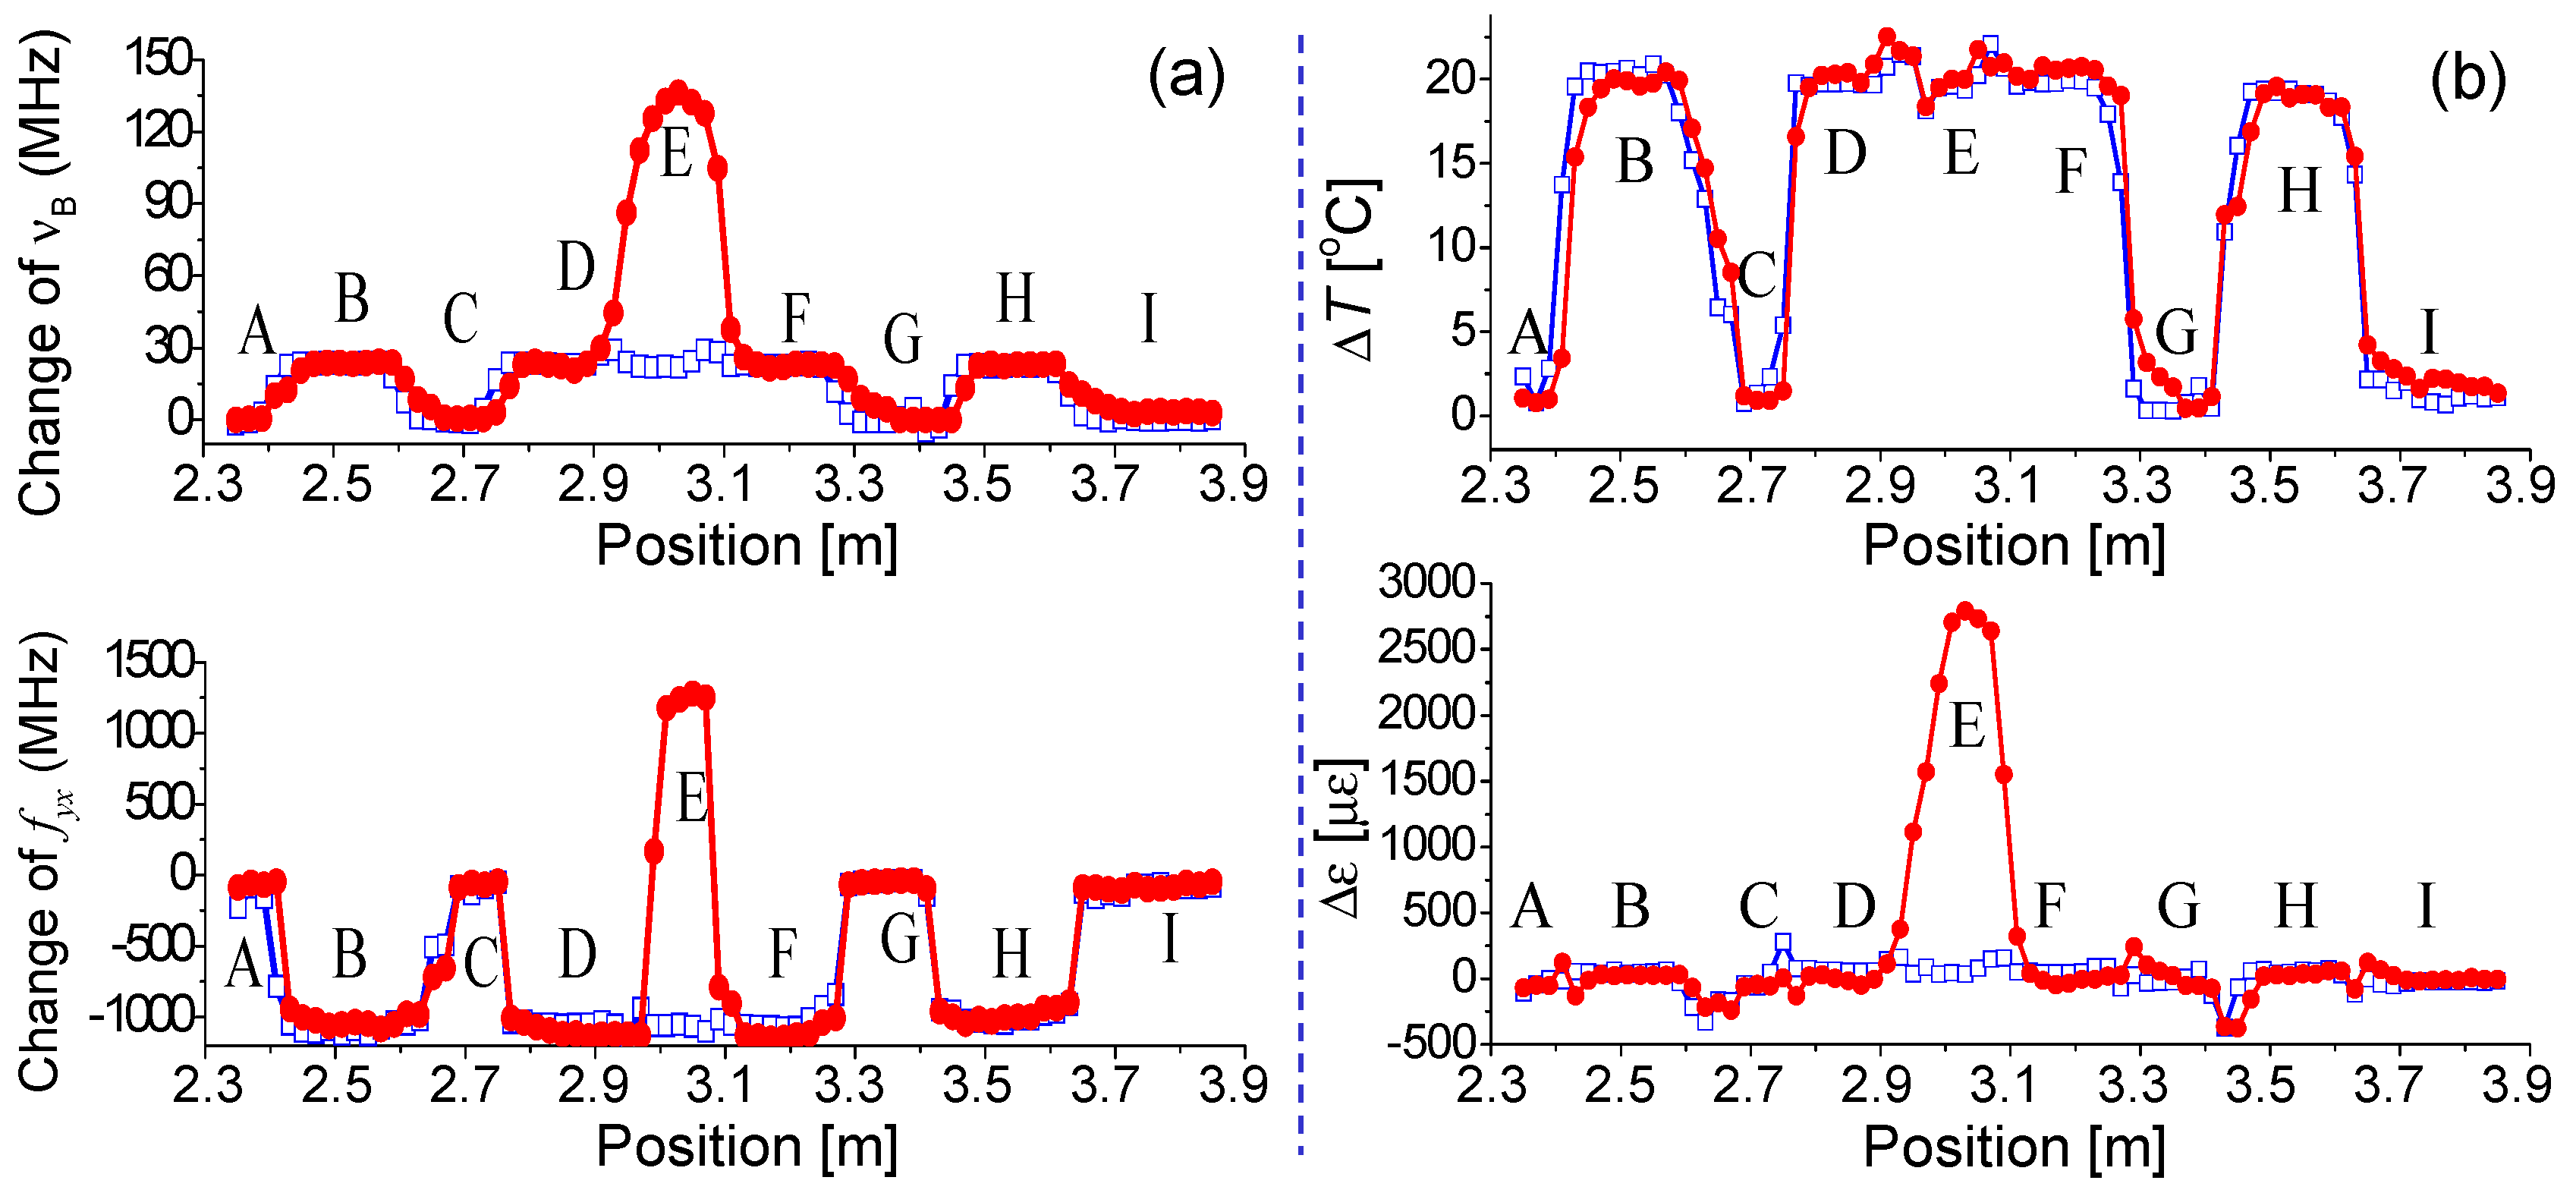
6.3. Discriminative and Distributed Measurement of Strain and Temperature with BDG-BOCDA Systems

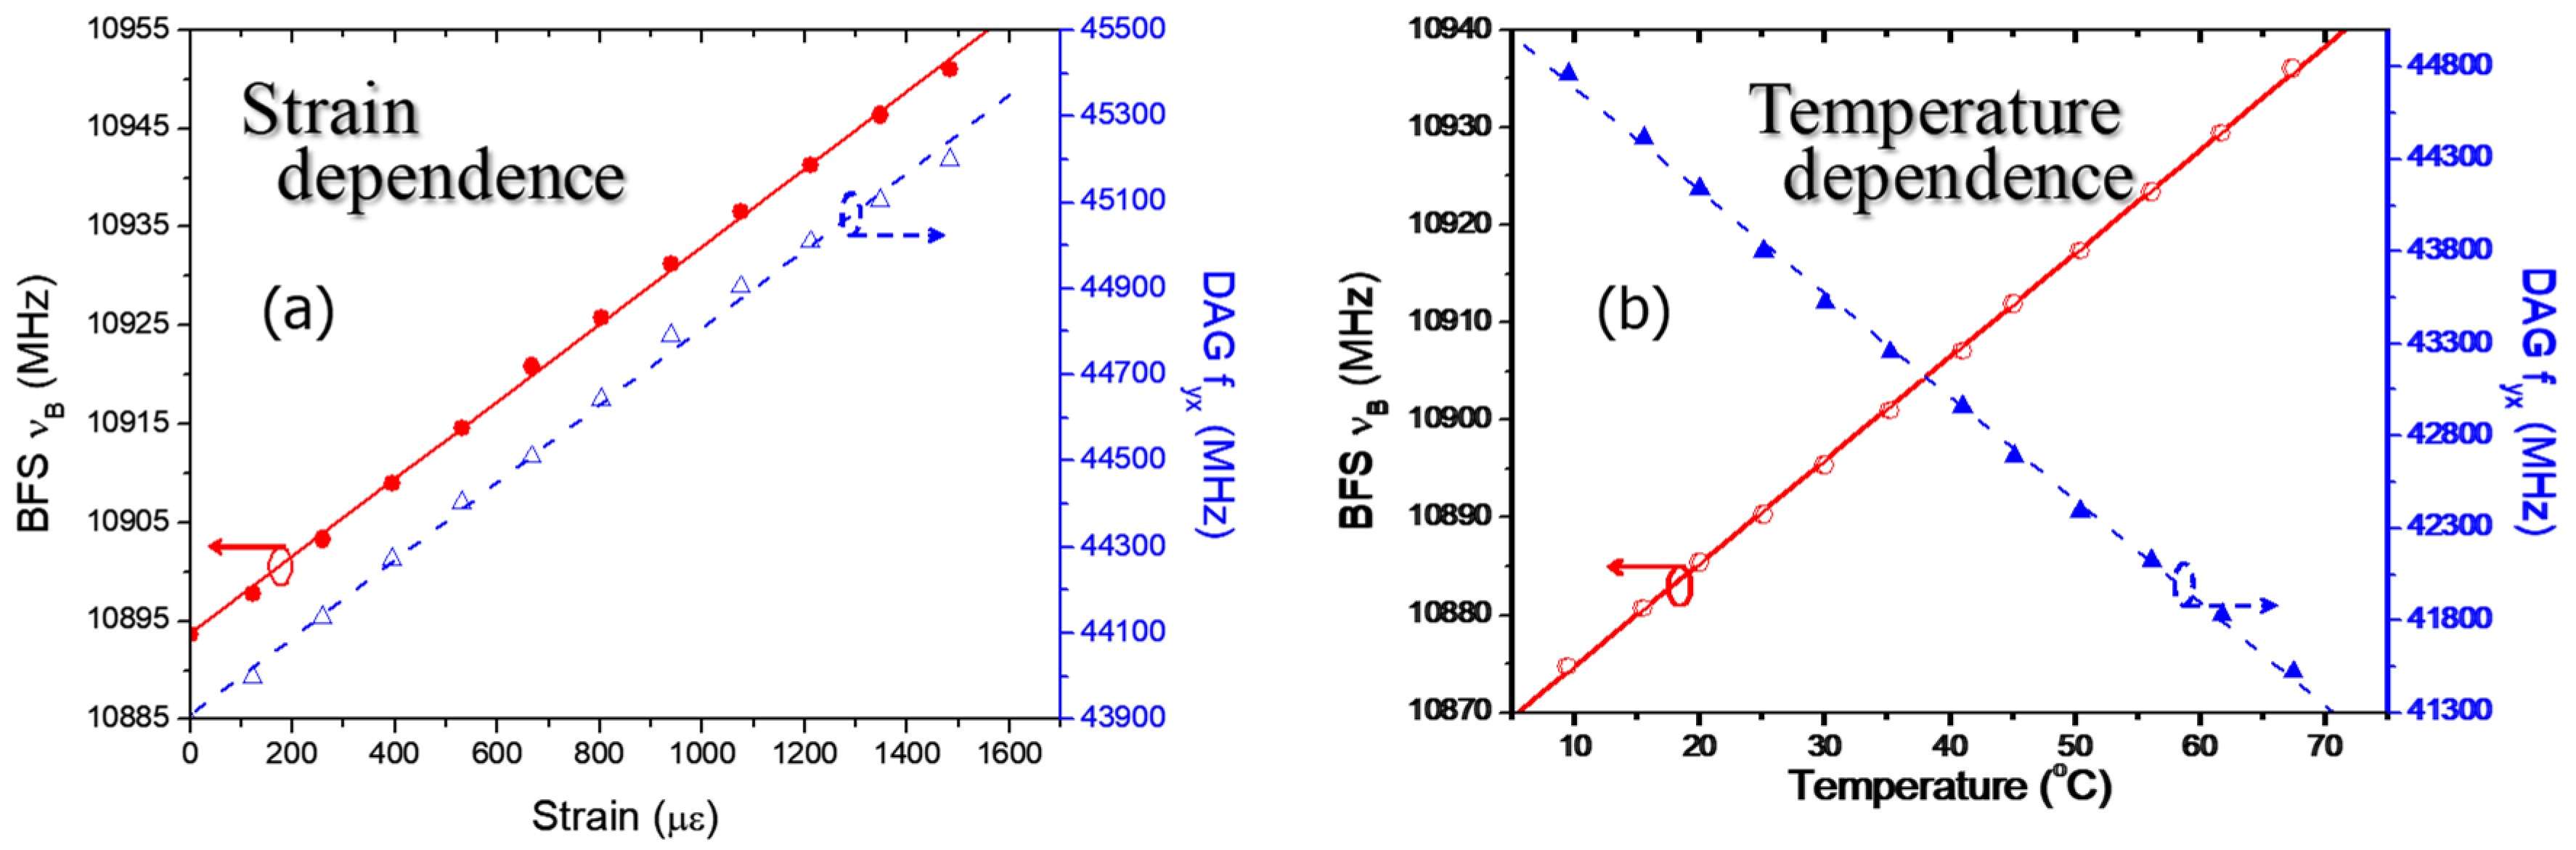
Figure 41 shows the strain and temperature dependence of the BFS and the BDG Bragg frequency [106]. The BDG Bragg frequency is caused by the birefringence of the PMF. It is shown in Figure 41 that the strain dependence of the two parameters shows the same sign, but the temperature dependence shows different signs, with respect to each other. This is a nice relation to calculate the strain and temperature from the two parameters. The relation between the two parameters and the strain/temperature are expressed by using a 2 × 2 matrix. Due to the dependence shown in Figure 41, the matrix has good characteristics when calculating the inverse matrix. The strain change δε and the temperature change δT are expressed as [106]:
( δ ε δ T ) = 1 C ν ε C f T C ν T C f ε ( C f T C ν T C f ε C ν ε ) ( δ ν B δ f y x )
where the four coefficients are the strain and the temperature dependence of the two physical parameters calculated from the data shown in Figure 41.
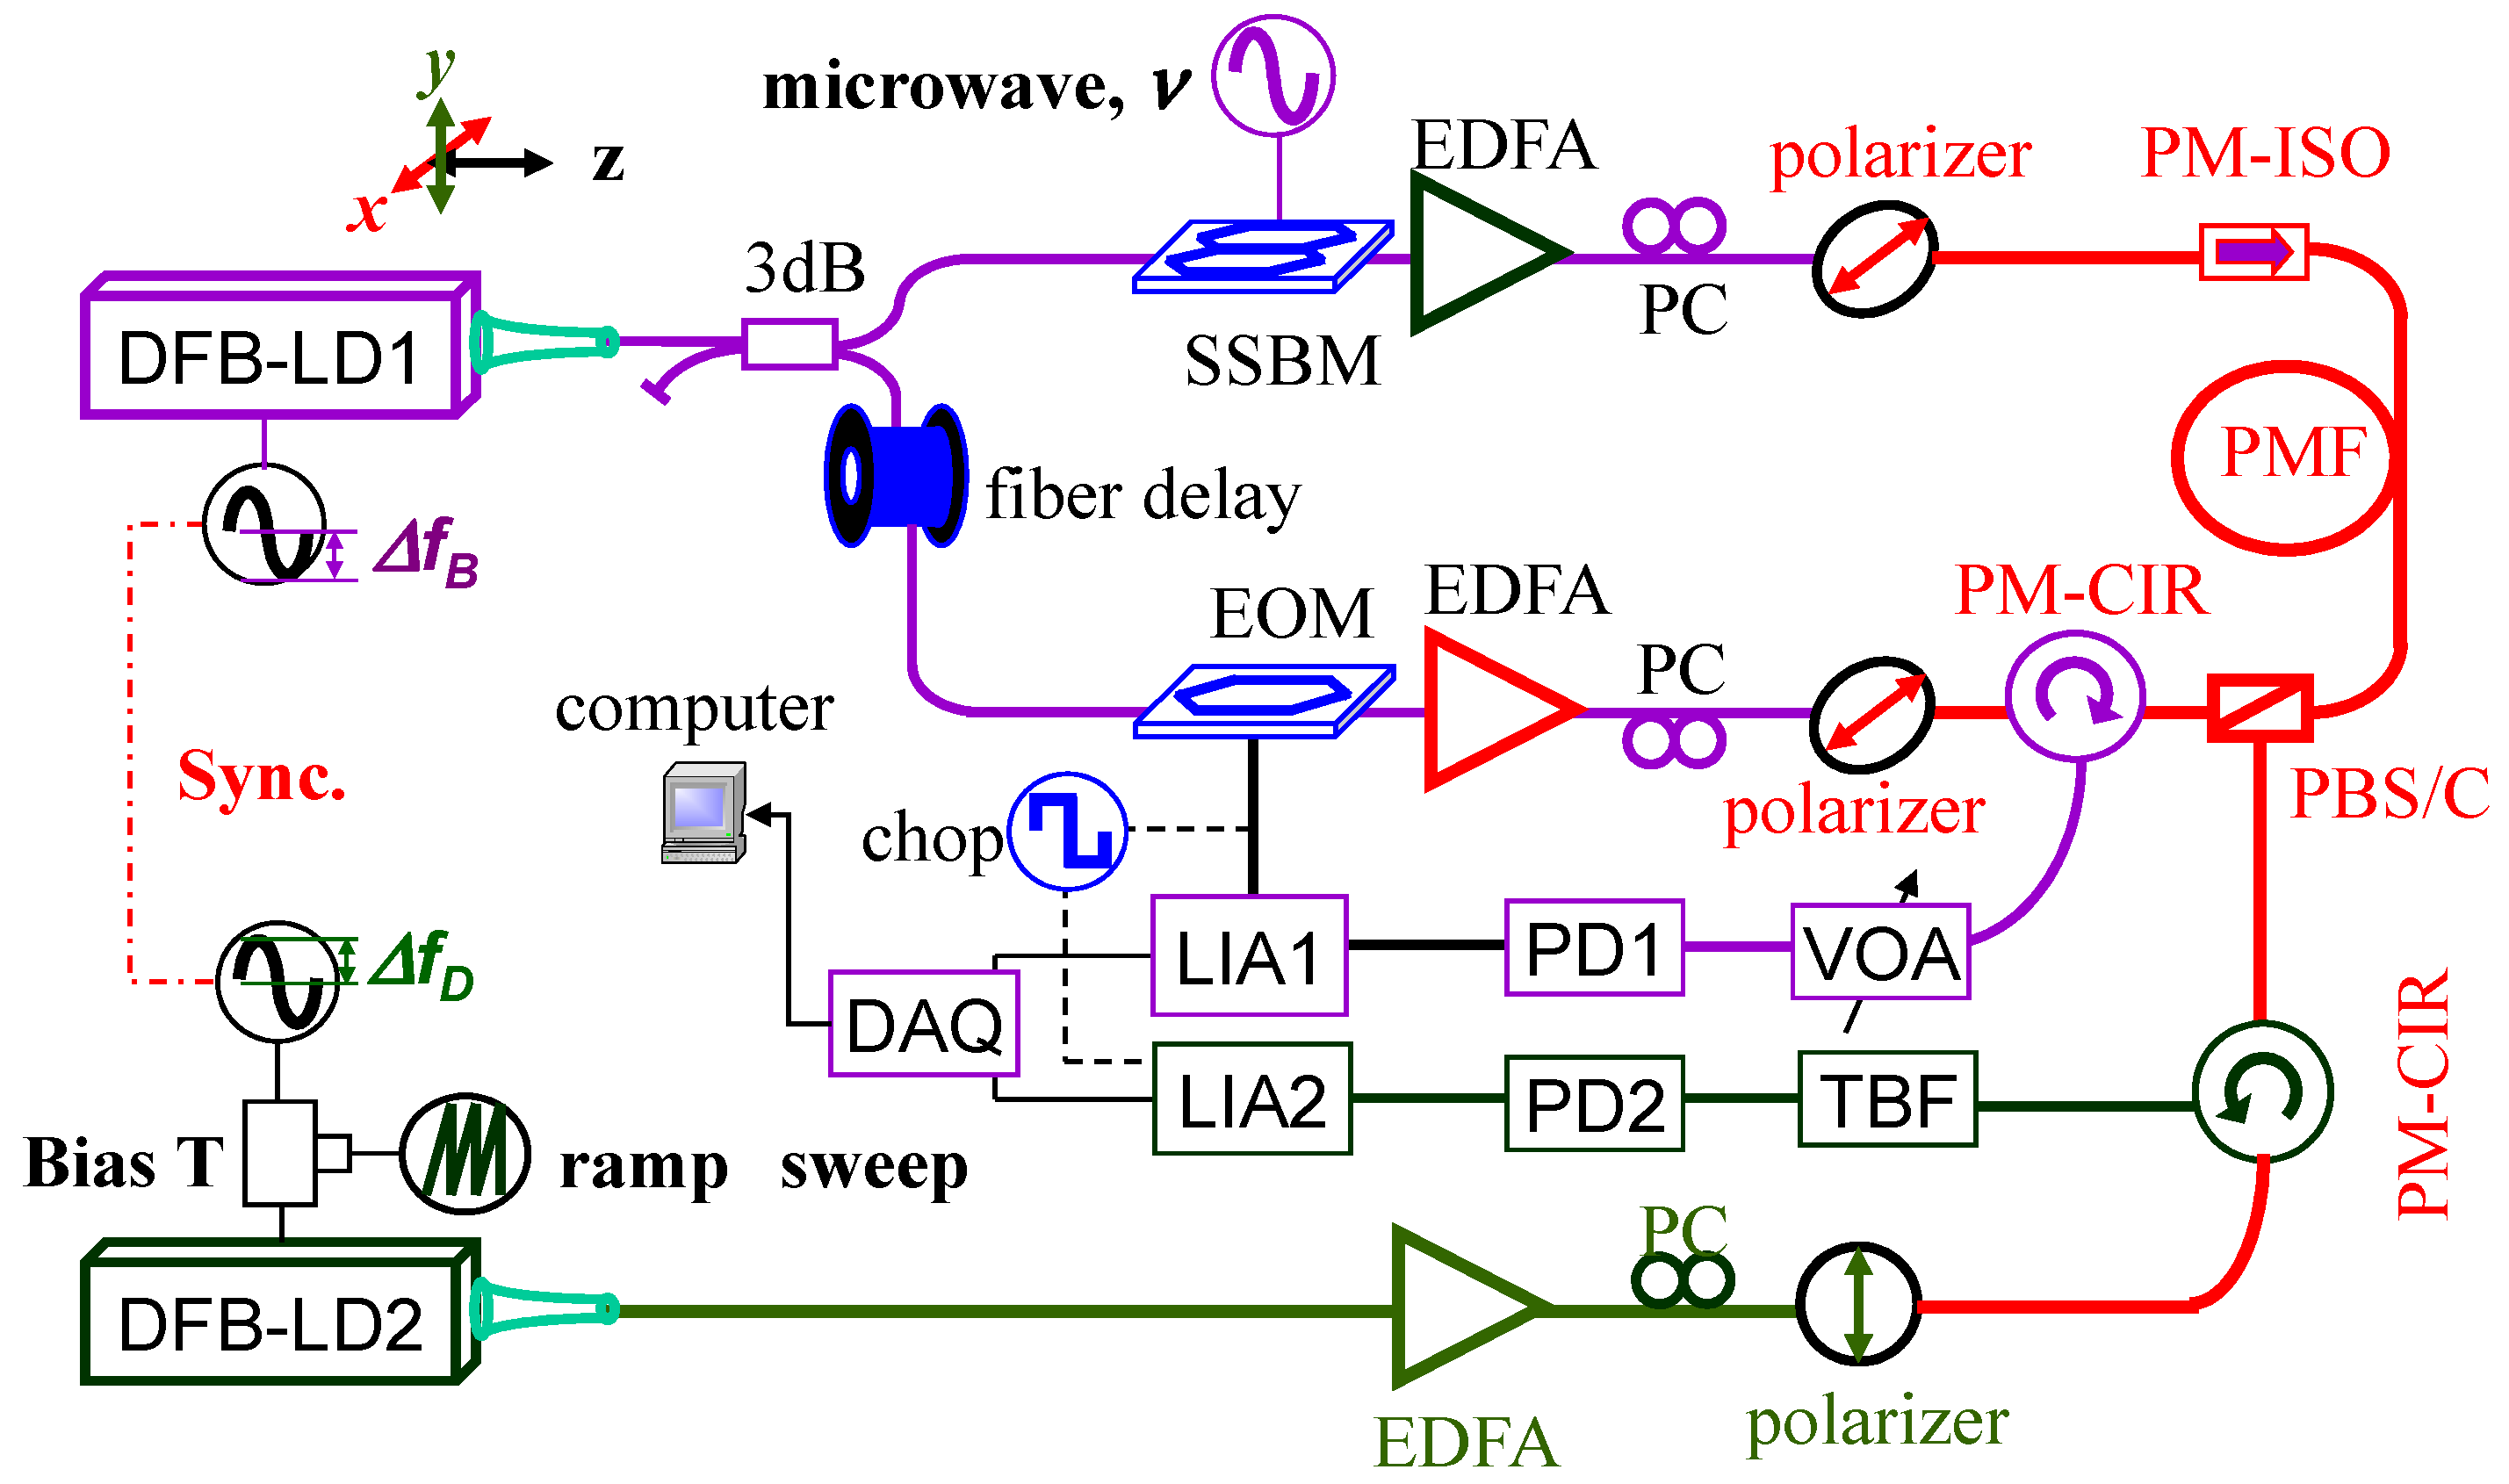
Figure 42 shows a BOCDA system to measure the strain and the temperature distribution discriminatively along a PMF while also measuring the BDG reflection [18]. The upper part is the same as the basic BOCDA-distributed sensing system. In the lower part, another light source, LD2, is set to launch the reading lightwave in the orthogonal polarization axis of the PMF through a polarization beam splitter (PMF). The distributed measurement function is introduced by the BOCDA technique. It is important to also modulate the LD2 with the same FM waveform as the LD1 to have a fine reflection spectrum, due to the dispersion of the acoustic wave [107].
Figure 43a shows the distribution of the two physical parameters, the BFS and the birefringence-induced Bragg frequency difference [18]. In the first measurement shown in the blue squares, the B, D, E, F, and H sections are heated, but no strain is applied. In the second measurement shown in the red dots, the temperature distribution is the same as the first one, but strain is applied at the E section. Figure 43b shows the strain and temperature change calculated by Equation (5). The distribution of the applied strain and the temperature are clearly recognized [18].
As for the spatial resolution, that for the BFS-distributed measurement shows a good coincidence with the BOCDA theory, namely Equation (3). However, the spatial resolution for the distributed measurement of the BDG Bragg reflection frequency is worth about 10 times more than the BOCDA theory, which is clearly shown in the experiments [18]. To clarify the degradation of the spatial resolution, a simulation technique for the BDG-distributed measurement based on the BOCDA technique has been developed.
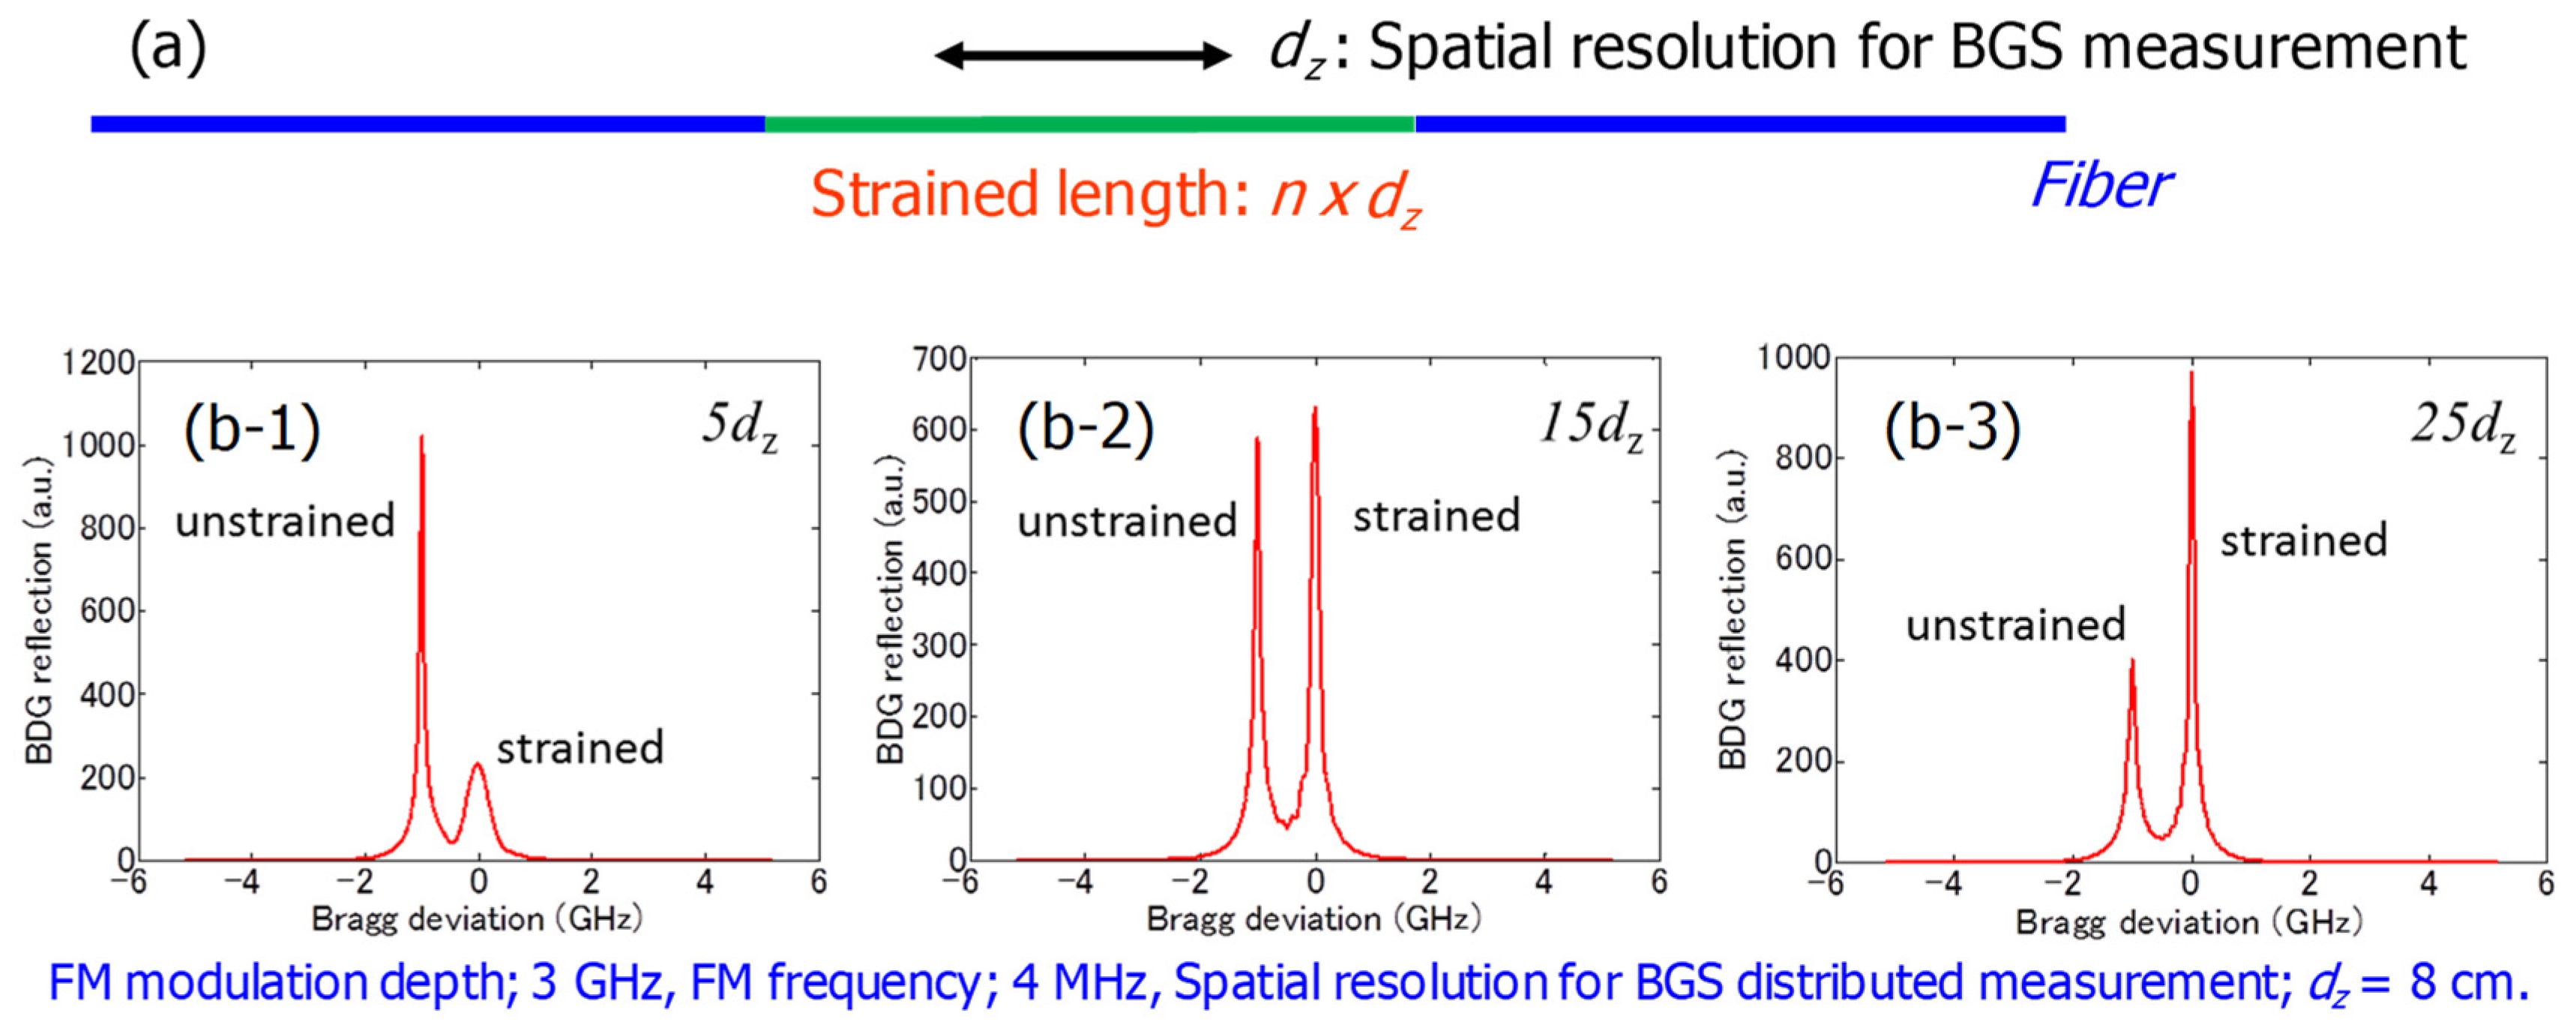
Figure 44 shows the simulation results [108]. In the upper portion of Figure 44, the fiber sample that was used in the simulations is shown. At the center portion, a strain-applied section is set, whose length is changed as n x dz, where n is an integer and dz is the spatial resolution calculated by Equation (3). In the simulations, the correlation peak position is set at the center of the strain-applied section, and dz is set to be eight centimeters. Figure 44(b-1) shows the BDG reflection spectrum when the strain-applied section is five times longer than the BOCDA spatial resolution. The two peaks are observed in the figure. The left and the right peak correspond to the unstrained portion and the strained portion, respectively. The height for the unstrained portion is higher than that for the strained portion, which means that the effective spatial resolution is worth more than five times the length of the resolution of dz,. When the length of the strained portion is 15 times dz, the two peaks are almost the same, which indicates that the equivalent spatial resolution is almost 15dz. This coincides well with the experiments. When the strain-applied length is elongated more, as shown in Figure 44c, the peak for the strained portion becomes larger.
From the simulations and experiments, it is known that the equivalent spatial resolution for the BDG distributed measurement by the BOCDA is worth more than that of the BFS measurement [108]. The reason for the degradation of the spatial resolution was thought to be attributed to the side lobes existing on both the sides of the correlation peak position. We assumed that the side lobes do not form the mountain-shaped background spectrum, but rather form a single peak-shaped one, due to the FM modulation onto the reading lightwave.
If this assumption is fine, we have the possibility of improving the spatial resolution by reducing the effect of the side lobes through using the IM scheme, which is mentioned above for BOCDA and BOCDR. 
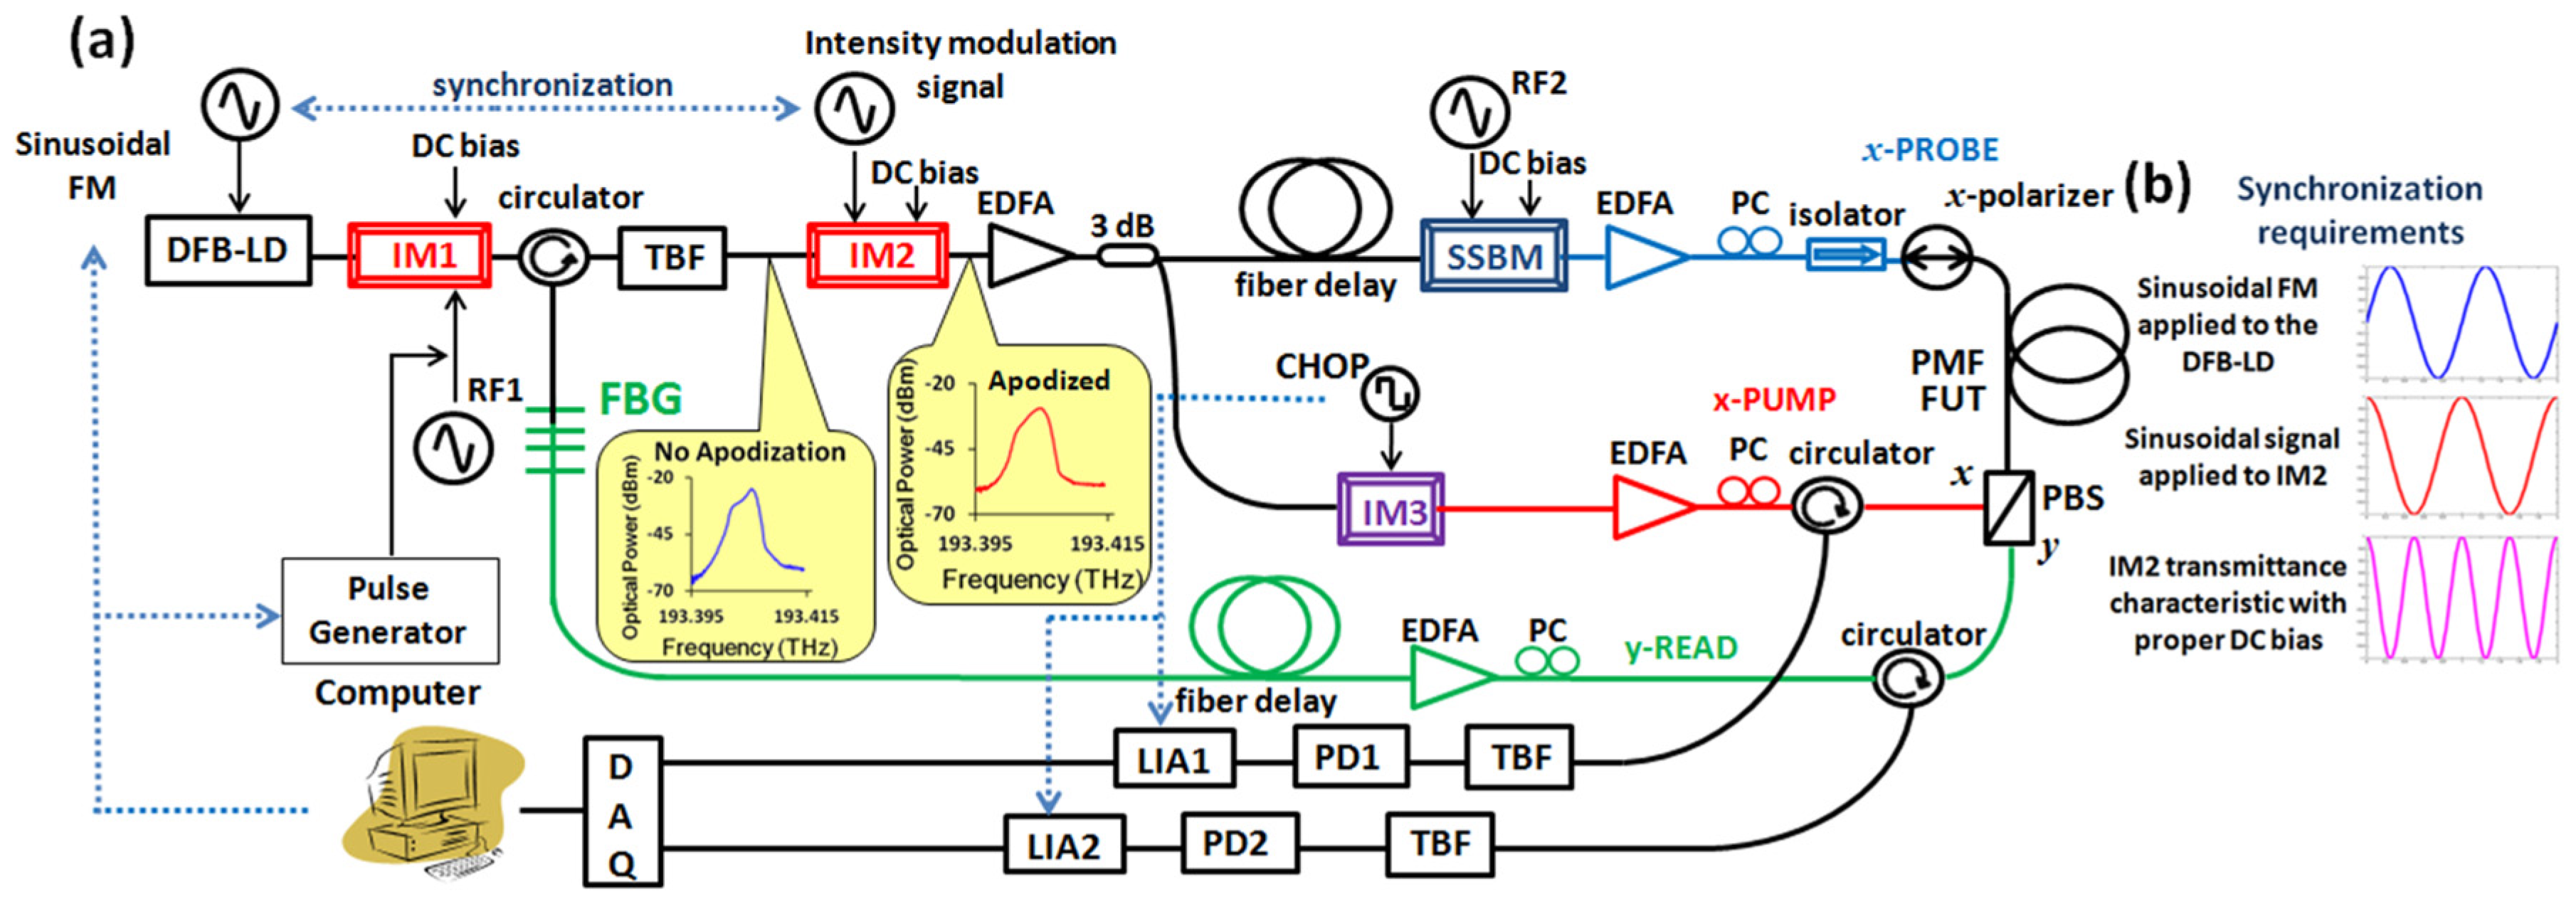
Figure 45 shows an experimental setup of the BDG-BOCDA system, in which an IM modulator is set to apodize both the x-probe and the x-pump wave [109]. 
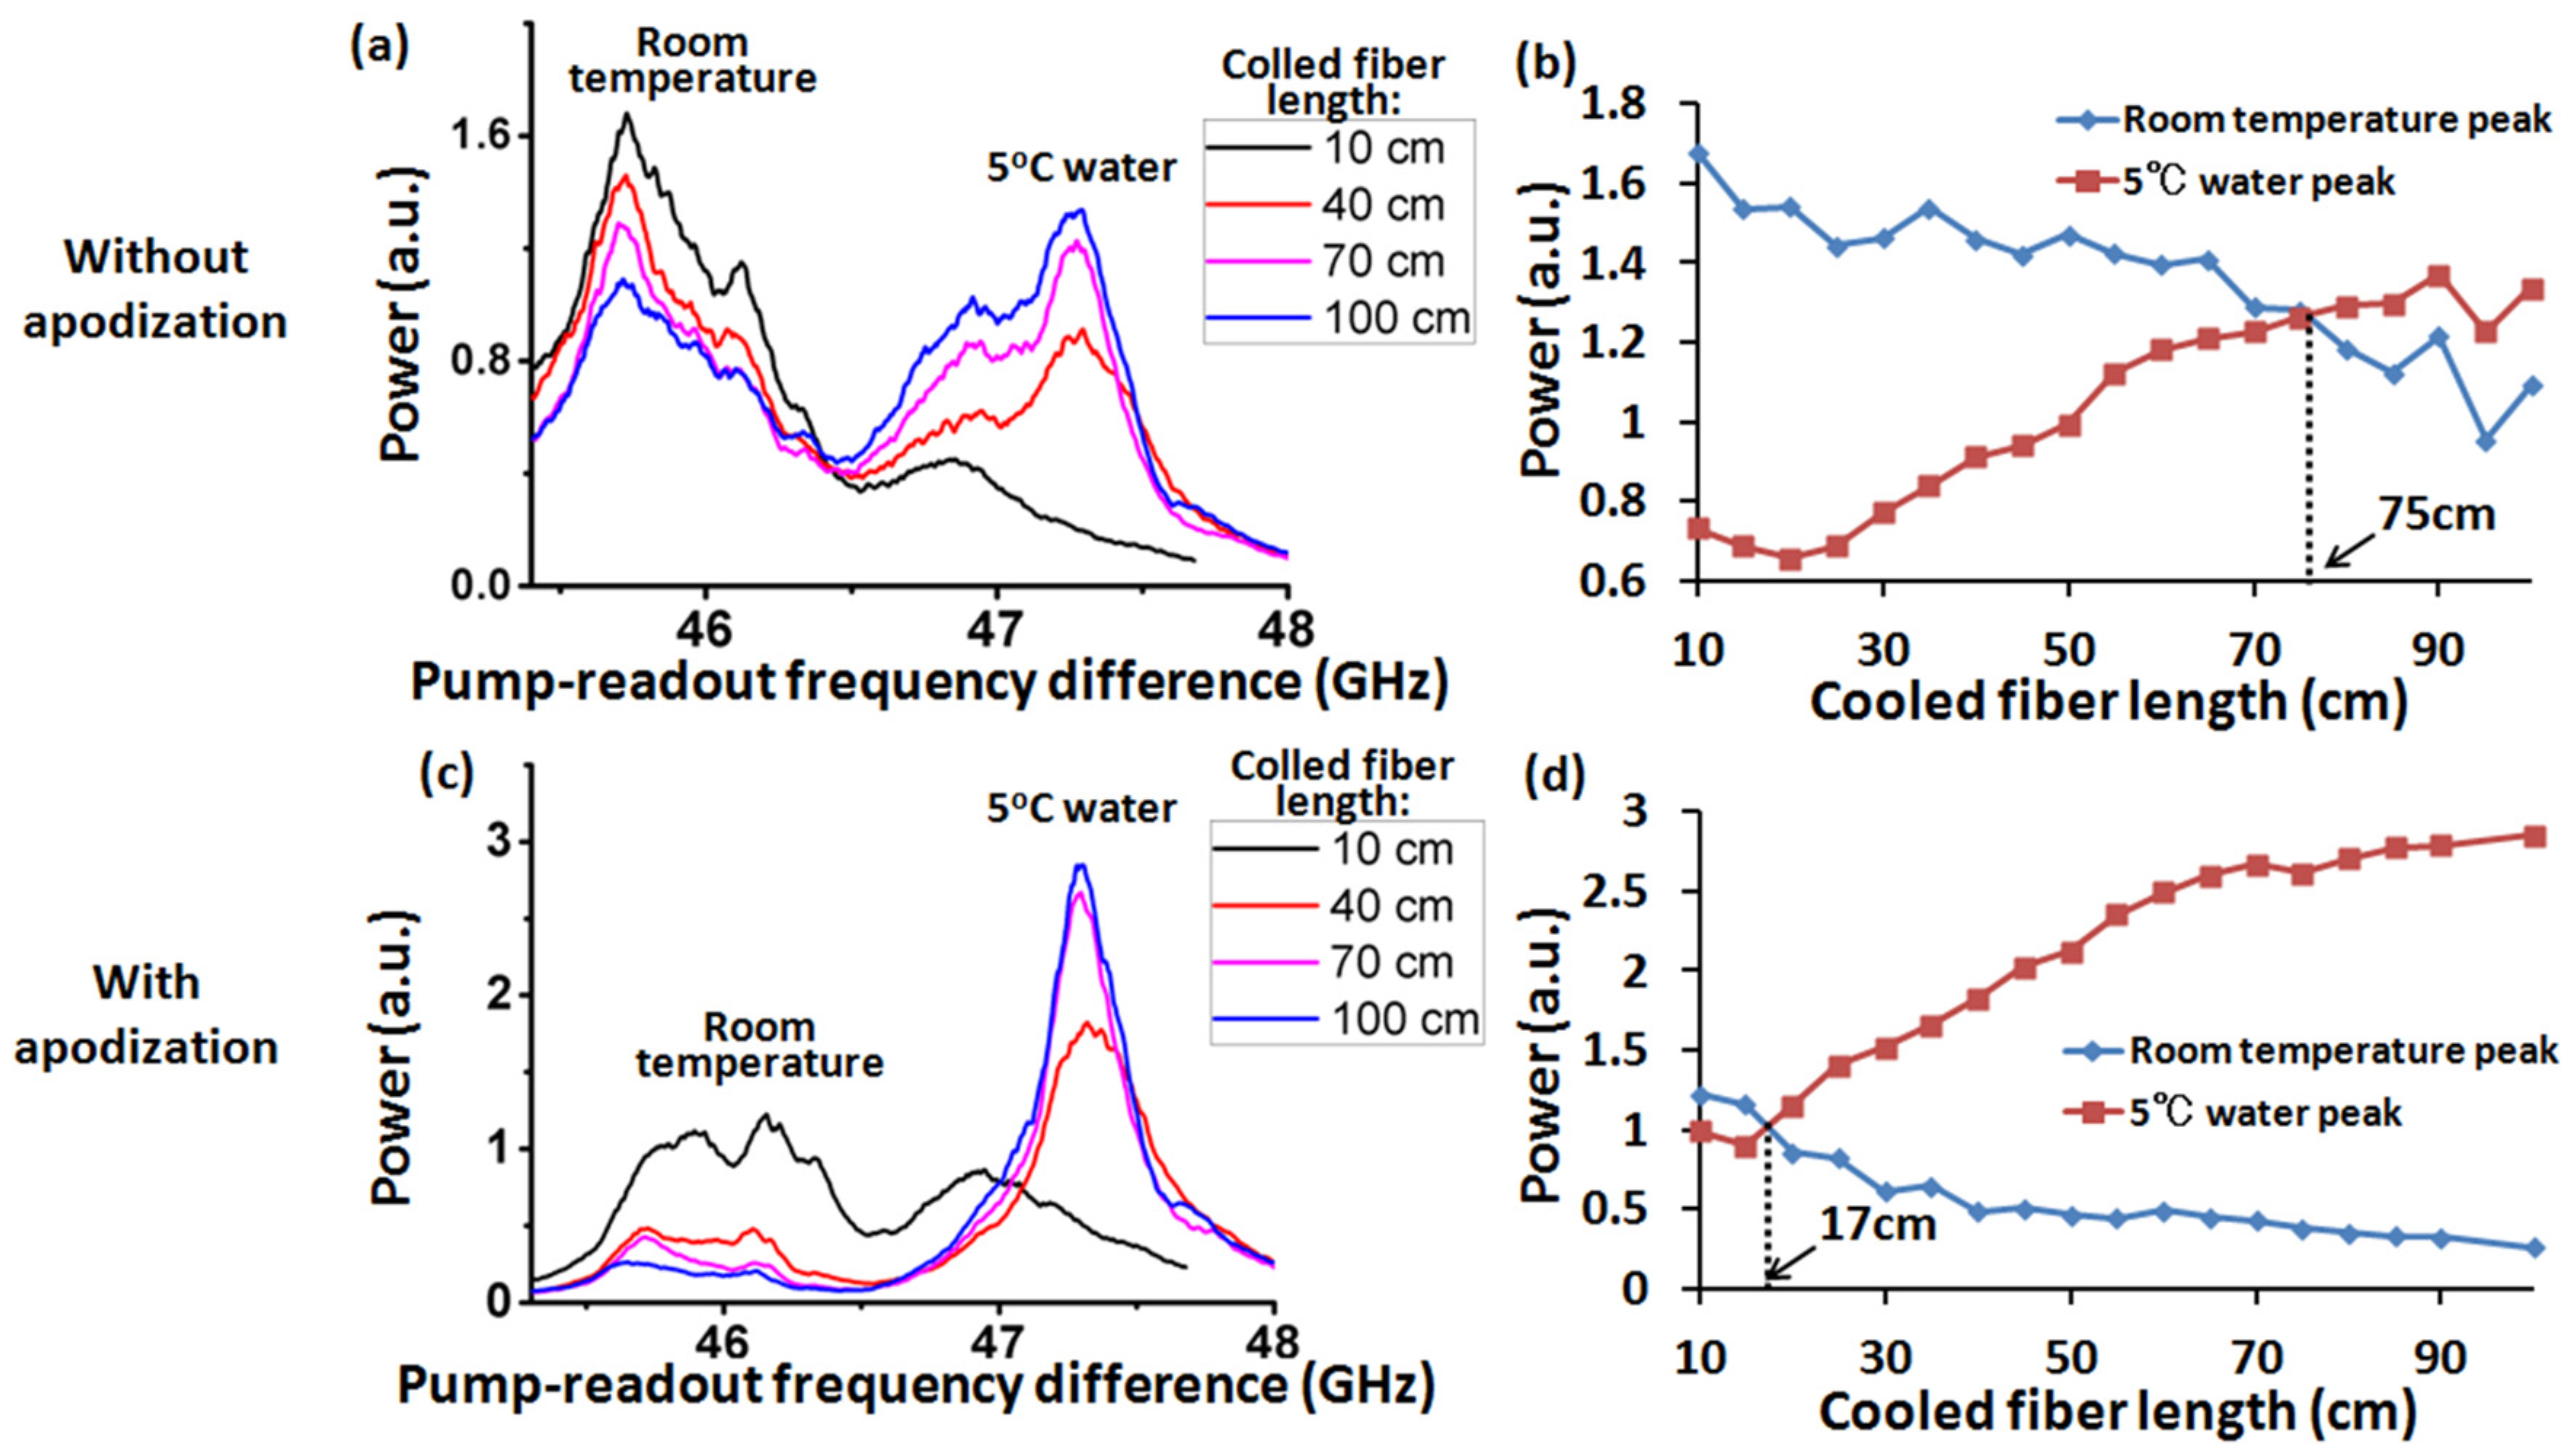
Figure 46a shows the experimental results for the sample fiber, which is the same as the fiber shown in Figure 44 [109]. The stain-applied portion in the simulation is realized to put the portion into the cooled water, and the portion length is changed in the experiments. The correlation peak is set at the center of the cooled section. Figure 46a shows the BDG reflection spectrum, which is the same as that in Figure 44. The two peaks’ power are plotted in Figure 46b. The cross point of the two curves shows the equivalent spatial resolution. Without the IM, the resolution is 75 cm. On the contrary, when introducing the IM, the resolution is improved to be 17 cm, as shown in Figure 46c,d. An improvement by a factor of around five has been realized with the IM scheme [106]. Recently, much improvement has also been shown by applying the IM onto the reading wave [110].
Besides the BOCDA-BDG system shown in Figure 42, other configurations have also been constructed, including the system with only one LD, which can form all the lightwaves of the X-pomp, X-probe, and the Y-read. An example is shown in Figure 45.
As for the BDG-BOCDA system, performance improvement schemes have already been introduced [111,112,113]. Additionally, a prototype model has already been fabricated for the application of the aircraft SHM. In flight conditions, the strain and temperature discriminative and distributed measurement have been successfully demonstrated [74]. The spatial resolution for the BFS measurement is three cm, and the total measurement range is 500 m when using the temporal gating scheme. The sampling rate for the random accessibility is 160 samples/s.

7. Conclusions

Brillouin optical correlation-domain technologies have been reviewed as fiber optic nerve systems for structural health monitoring (SHM) applications. Continuous lightwaves are utilized in the technologies, whose optical coherence properties are synthesized to realize the position-selective measurement along the sensing fiber. The synthesis of optical coherence function (SOCF) technology has also been reviewed, as the basic principle for the Brillouin optical correlation-domain technologies. Distributed or multiplexed sensing schemes utilizing the SOCF technology, which could be used for SHM, have also been discussed.
In the Brillouin optical correlation domain analysis (BOCDA) systems and the Brillouin optical correlation domain reflectometry (BOCDR) systems, superior performances have been demonstrated for the individual performance indicators, such as a spatial resolution of 1.6 mm, a measurement speed of 5000 points/s with the random accessibility, and a strain dynamic range of 7000 με. One other important indicator is the ratio between the total measurement length and the spatial resolution. As this indicator, ratios of 1,000,000:1 and 134,000:1 have been demonstrated in a BOCDA system and a BOCDR system, respectively. In these systems, the performance improvement schemes have been introduced, such as the intensity modulation scheme and the differential measurement scheme (the phase modulation scheme) to reduce the background spectrum, and the temporal gating scheme and the double modulation scheme to elongate the measurement range.
However, studies on the limitations of the total performances of the BOCDA and BOCDR systems have not been sufficiently accumulated. Mutual relations between the various performance indicators, such as the spatial resolution, measurement length, measurement speed, random access speed, strain dynamic range, strain accuracy, and so on, should be studied in detail to make sure of the total performance limitations. Recently, we have been studying the total performance of a BOCDA system mainly from the viewpoint of random accessibility. Performances of a seven-cm spatial resolution, 1000-m measurement range, 2500-times/s random access speed, and 80-με strain accuracy has been totally demonstrated. However, more studies on the total performances or the limitation of the system performance need to be done, at this moment, in order to enhance the varieties of applications of BOCDA and BOCDR technologies. Studies to simplify the system configuration should also be performed. We have the possibility to do so while also keeping the system performance. An example was shown briefly, in this paper, in the subsection of the phase modulation scheme for the BOCDR systems. As for the BDG-BOCDA system, basic research items still remain, such as ways to enhance the spatial resolution in the measurements of the BDG reflection spectrum.
The Brillouin optical time-domain technologies have already demonstrated systems that have quite a long measurement range beyond 100 km, with a 10-m order spatial resolution. For applications that require such a long measurement range, such as for example the SHM of pipelines, BOTDA systems are suitable. On the contrary, Brillouin optical correlation-domain technologies have advantages for applications that require a moderate measurement range, such as for example a 100-m order or km order, and a high spatial resolution, such as for example in the order of centimeters. The most important feature of the BOCDA and the BOCDR is their random accessibility. At multiple points selected arbitrarily along the fiber, time-resolved strain measurements can be done simultaneously. Considering this features positively, SHM schemes using BOCDA technologies for aircraft wings and bodies have been under development. The dynamic strain measurement capability of the correlation domain-distributed sensing technologies also shows the possibility of providing the SHM functions for the social infrastructures, such as buildings, bridges, and highways, especially under earthquake vibration conditions. Utilizing a mm-order spatial resolution, the diagnosis of optical integrated circuits, such as planar lightwave circuits (PLC), is another possible application of the BOCDA systems.
Prototype models of BOCDA and BOCDR systems have already been fabricated or have been under fabrication, under the support of national funding agencies in Japan. For example, a BOCDA prototype model has already provided us with the total performances of a three-cm spatial resolution, 500-m measurement range, 60-με strain accuracy, and 160-times/s random access measurement speed. In this model, the function of the discriminative and distributed measurement of both strain and temperature has also been included. The author would like to expect commercially available equipment for BOCDA and BOCDR systems in the near future.
As another concept of distributed fiber-sensing technology, a Rayleigh scattering-based one has been developed that can be available on a commercial base, which uses a distribution measurement principle such as the frequency modulated continuous wave technique [114]. This technology realizes spatial resolution in the order of sub-mm to mm, a 10–50 m measurement range, and a strain accuracy of around 30 με [115].
These fiber optic nerve systems described above have different distributed measurement principles, and thus show different distributed measurement performances. Therefore, these all have the possibility of being applied to varieties of applications that require different specifications. The author would like to expect that the safety and security of society would be enhanced by introducing the SHM schemes that use these technologies.

Author Contributions

This review paper was totally written by the author.

Funding

This paper was written as a review paper. The author received no external funding for the preparation of this paper.

Acknowledgments

The technologies described in this paper have mainly been studied in the University of Tokyo, Tokyo, Japan, from 1990 to 2017. Since April, 2017, the author has been working in Toyota Technological Institute, Nagoya, Japan. The researches in TTI is also included partly in this paper. The author would like to express sincere thanks to all the laboratory members for their contributions to the researches and developments of the technologies described in this paper. The author would like to acknowledge also to the researchers in companies and institutions, with whom we have had fruitful collaborations related to the technologies.

Conflicts of Interest

The The author declares no conflict of interest.

References

  1. Dakin, J.; Culshaw, B. (Eds.) Optical Fiber Sensors IV; Artech House: Norwood, MA, USA, 1997; pp. 309–368. [Google Scholar]
  2. Hartog, A.H.; Yamate, T. Optical fiber sensors in theoil and gas industry. J. Soc. Instrum. Control Eng. 2012, 51, 260–266. [Google Scholar]
  3. Hotate, K. Fiber distributed Brillouin sensing with optical correlation domain techniques. Opt. Fiber Technol. 2013, 19, 700–719. [Google Scholar] [CrossRef]
  4. Horiguchi, T.; Tateda, M. BOTDA-nondestructive measurement of single-mode optical fiber attenuation characteristics using Brillouin interaction: Theory. J. Lightwave Technol. 1989, 7, 1170–1176. [Google Scholar] [CrossRef]
  5. Horiguchi, T.; Kurashima, T.; Tateda, T. A technique to measure distributed strain in optical fibers. IEEE Photonics Technol. Lett. 1990, 2, 352–354. [Google Scholar] [CrossRef]
  6. Garus, D.; Krebber, K.; Schliep, F. Distributed sensing technique based on Brillouin optical-fiber frequency-domain analysis. Opt. Lett. 1996, 21, 1402–1404. [Google Scholar] [CrossRef] [PubMed]
  7. Bernini, R.; Minardo, A.; Zeni, L. Distributed sensing at centimeter-scale spatial resolution by BOFDA: Measurements and signal processing. IEEE Photonics J. 2012, 4, 48–56. [Google Scholar] [CrossRef]
  8. Hotate, K.; Hasegawa, T. Measurement of Brillouin gain spectrum distribution along an optical fiber using a correlation-based technique -Proposal, experiment and simulation-. IEICE Trans. Electron. 2000, E83-C, 405–412. [Google Scholar]
  9. Mizuno, Y.; Zou, W.; He, Z.; Hotate, K. Proposal of Brillouin optical correlation-domain reflectometry (BOCDR). Opt. Exp. 2008, 16, 12148–12153. [Google Scholar] [CrossRef]
  10. Bao, X.; Webb, D.J.; Jackson, D.A. 22-km distributed temperature sensor using Brillouin gain in an optical fiber. Opt. Lett. 1993, 18, 552–554. [Google Scholar] [CrossRef] [Green Version]
  11. Nikles, M.; Tevenaz, L.; Robert, P.A. Brillouin gain spectrum characterization in single mode optical fibers. J. Lightwave Technol. 1997, 15, 1842–1851. [Google Scholar] [CrossRef]
  12. Alahbabi, M.N.; Cho, Y.T.; Newson, T.P. 150-km-range distributed temperature sensor based on coherent detection of spontaneous Brillouin backscatter and in-line Raman amplification. J. Opt. Soc. Am. B 2005, 22, 1321–1324. [Google Scholar] [CrossRef]
  13. Hotate, K. Application of synthesized coherence function to distributed optical sensing. Meas. Sci. Technol. 2002, 13, 1746–1755. [Google Scholar] [CrossRef]
  14. Hotate, K.; He, Z. Synthesis of optical coherence function and its applications in distributed and multiplexed optical sensing. IEEE J. Lightwave Technol. 2006, 24, 2541–2557. [Google Scholar] [CrossRef]
  15. Hotate, K.; Kamatani, O. Reflectometry by means of optical-coherence modulation. IEE Electron. Lett. 1989, 25, 1503–1505. [Google Scholar] [CrossRef]
  16. Hotate, K.; Kamatani, O. Optical coherence domain reflectometry by synthesis of coherence function. IEEE J. Lightwave Technol. 1993, 11, 1701–1710. [Google Scholar] [CrossRef]
  17. Kamatani, O.; Hotate, K. Optical coherence domain reflectometry by synthesis of coherence function with non-linearity compensation in frequency modulation of a laser diode. J. Lightwave Technol. 1993, 11, 1854–1862. [Google Scholar] [CrossRef]
  18. Zou, W.; He, Z.; Hotate, K. Demonstration of Brillouin distributed discrimination of strain and temperature based on a polarization- maintaining optical fiber. IEEE Photonics Technol. Lett. 2010, 22, 526–528. [Google Scholar] [CrossRef]
  19. Song, K.-Y.; Hotate, K. All-optical dynamic grating generation based on Brillouin scattering in polarization maintaining fiber. In Proceedings of the 19th International Conference on Optical Fibre Sensors, Perth, WA, Australia, 15–18 April 2008; p. 70043T. [Google Scholar]
  20. Song, K.-Y.; Zou, W.; He, Z.; Hotate, K. All-optical dynamic grating generation based on Brillouin scattering in polarization-maintaining fiber. Opt. Lett. 2008, 33, 926–938. [Google Scholar] [CrossRef]
  21. Born, M.; Wolf, E. Principles of Optics, 7th ed.; Cambridge University Press: Cambridge, UK, 1999; pp. 562–568. [Google Scholar]
  22. He, Z.; Hotate, K. Distributed fiber-optic stress-location measurement by arbitrary shaping of optical coherence function. J. Lightwave Technol. 2002, 20, 1715–1723. [Google Scholar]
  23. Ishii, H.; Tanobe, H.; Kano, F.; Tohmori, Y.; Kondo, Y.; Yoshikuni, Y. Quasicontinuous wavelength tuning in super-structure-grating (ssg) dbr lasers. IEEE J. Quantum Electron. 1996, 32, 433–441. [Google Scholar] [CrossRef]
  24. Hotate, K.; Saida, T. Phase-modulating optical coherence domain reflectometry by synthesis of coherence function. IEEE Electron. Lett. 1995, 31, 475–476. [Google Scholar] [CrossRef]
  25. Hotate, K.; Enyama, M.; Yamashita, S.; Nasu, Y. A multiplexing technique for fibre Bragg grating sensors with the same reflection wavelength by the synthesis of optical coherence function. Meas. Sci. Technol. 2003, 15, 148–153. [Google Scholar] [CrossRef]
  26. Mori, K.; Kajiwara, K.; Kishi, M.; He, Z.; Hotate, K. Synthesis of optical coherence function to sweep the 0th peak by phase modulation. In Proceedings of the 22nd International Conference on Optical Fiber Sensors (OFS-12), Beijing, China, 15–19 October 2012; pp. 8421–8533. [Google Scholar] [CrossRef]
  27. Enyama, M.; He, Z.; Hotate, K. Expansion of spatial measurement range by use of vernier effect in multiplexed fibre bragg grating strain sensor with synthesis of optical coherence function. Meas. Sci. Technol. 2005, 16, 977–983. [Google Scholar] [CrossRef]
  28. Hayashi, T.; He, Z.; Hotate, K. Multiplexed FBG sensor system by synthesis of optical coherence function with active beat compensation. In Proceedings of the 18th International Conference on Optical Fiber Sensors (OFS-18), Cancun, Mexico, 23–27 October 2006; p. FA2. [Google Scholar]
  29. Hotate, K.; Kajiwara, K. Proposal and experimental verification of Bragg wavelength distribution measurement within a long-length fbg by synthesis of optical coherence function. Opt. Express 2008, 16, 7881. [Google Scholar] [CrossRef]
  30. Kajiwara, K.; Hotate, K. Measurement of bragg-wavelength distribution in a long-length fiber Bragg grating with high speed sampling. Appl. Phys. Express 2009, 2, 082401. [Google Scholar] [CrossRef]
  31. Kajiwara, K.; Hotate, K. Multiplexing of long-length fiber Bragg grating distributed sensors based on synthesis of optical coherence function. IEEE Photonics Technol. Lett. 2011, 23, 1555–1557. [Google Scholar] [CrossRef]
  32. Saida, T.; Hotate, K. Distributed fiber optic stress sensor by synthesis of the optical coherence function. IEEE Photonics Technol. Lett. 1997, 9, 484–486. [Google Scholar] [CrossRef]
  33. Hotate, K.; Makino, K.; He, Z.; Ishikawa, M.; Yoshikuni, Y. High spatial resolution fiber-optic distributed lateral-stress sensing by stepwise frequency modulation of a super structure grating distributed Bragg reflector laser diode. IEEE J. Lightwave Technol. 2006, 24, 2733–2740. [Google Scholar] [CrossRef]
  34. Hotate, K.; Song, X.; He, Z. Stress-location measurement along an optical fiber by synthesis of triangle-shape optical coherence function. IEEE Photonics Technol. Lett. 2001, 13, 233–235. [Google Scholar] [CrossRef]
  35. Hotate, K.; Kuramoto, A.; He, Z. Optical fiber stress-location measurement by synthesis of binary optical coherence function. IEEE Photonics Technol. Lett. 2004, 16, 578–580. [Google Scholar] [CrossRef]
  36. Saida, T.; Hotate, K. High spatial resolution reflectometry by synthesis of optical coherence function for measuring reflectivity distribution at a long distance. IEEE Photonics Technol. Lett. 1998, 10, 573–575. [Google Scholar] [CrossRef]
  37. Hotate, K.; Kashiwagi, M. High spatial resolution reflectometry for optical subscriber networks by synthesis of optical coherence function with measurement range enhancement. IEICE Trans. Electron. 2003, E86-C, 213–217. [Google Scholar]
  38. He, Z.; Yoshiyama, S.; Enyama, M.; Hotate, K. High-reflectanceresolution optical reflectometry with synthesis of optical coherence function. Jpn. J. Appl. Phys. 2004, 44, L117–L119. [Google Scholar] [CrossRef]
  39. He, Z.; Hotate, K. Synthesized optical coherence tomography for imaging of scattering objects by use of a stepwise frequency-modulated tunable laser diode. Opt. Lett. 1999, 24, 1502–1504. [Google Scholar] [CrossRef] [PubMed]
  40. Hotate, K.; He, Z.; Kitazume, T. Surface shape measurement for a multi-layered object by synthesis of optical coherence function. IEEE J. Sel. Topics Quantum Electron. 2000, 6, 723–729. [Google Scholar] [CrossRef]
  41. Hotate, K.; Okugawa, T. Optical information processing by synthesis of the coherence function. J. Lightwave Technol. 1994, 12, 1247–1255. [Google Scholar] [CrossRef]
  42. Okugawa, T.; Hotate, K. Real-time optical image processing by synthesis of the coherence function using real-time holography. IEEE Photonics Technol. Lett. 1996, 8, 257–259. [Google Scholar] [CrossRef]
  43. Li, C.-H.; Nishiguchi, K.; Miyatake, M.; Makita, A.; Yokoyama, M.; Kishita, K.; Mizutani, T.; Takeda, N. PPP-BOTDA method to achieve 2 cm spatial resolution in Brillouin distributed measuring technique. IEICE Tech. Rep. 2008, 108, 55–60. [Google Scholar]
  44. Li, W.; Bao, X.; Li, Y.; Chen, L. Differential pulse-width pair botda for high spatial resolution sensing. Opt. Express 2008, 16, 21616. [Google Scholar] [CrossRef]
  45. Brown, A.W.; Colpitts, B.G.; Brown, K. Dark-pulse Brillouin optical time-domain sensor with 20-mm spatial resolution. J. Lightwave Technol. 2007, 25, 381–386. [Google Scholar] [CrossRef]
  46. Lee, M.-W.; Stiller, B.; Hauden, J.; Maillotte, H.; Roch, C.; Thévenaz, L.; Sylvestre, T. Differential phase-shift-keying technique-based Brillouin echo-distributed sensing. IEEE Photonics Technol. Lett. 2012, 24, 79–81. [Google Scholar] [CrossRef]
  47. Koyamada, Y.; Sakairi, Y.; Takeuchi, T.; Adachi, S. Novel technique to improve spatial resolution in Brillouin optical time-domain reflectometry. IEEE Photonics Technol. Lett. 2007, 19, 1910–1912. [Google Scholar] [CrossRef]
  48. Song, K.-Y.; Chin, S.; Primerov, N.; Thévenaz, L. Time-domain distributed fiber sensor with 1 cm spatial resolution based on Brillouin dynamic grating. J. Lightwave Technol. 2010, 28, 2062–2067. [Google Scholar] [CrossRef]
  49. Soto, M.A.; Bolognini, G.; Di Pasquale, F.; Thévenaz, L. Long-range Brillouin optical time-domain analysis sensor employing pulse coding techniques. Meas. Sci. Technol. 2010, 21, 094024. [Google Scholar] [CrossRef] [Green Version]
  50. Hotate, K.; Hasegawa, T. A correlation-based continuous-wave technique for measuring Brillouin gain spectrum distribution along an optical fiber with centimeter-order spatial resolution. In Proceedings of the 14th International Conference on Optical Fiber Sensors, Venice, Italy, 11–13 October 2004; Fr2-1 (partII). pp. 651–661. [Google Scholar]
  51. Song, K.-Y.; He, Z.; Hotate, K. Effects of intensity modulation of light source on Brillouin optical correlation domain analysis. J. Lightwave Technol. 2007, 25, 1238–1246. [Google Scholar] [CrossRef]
  52. Jeong, J.-H.; Lee, K.; Song, K.-Y.; Jeong, J.-M.; Lee, S.-B. Differential measurement scheme for Brillouin optical correlation domain analysis. Opt. Express 2012, 20, 27094–27101. [Google Scholar] [CrossRef] [PubMed]
  53. Kannou, M.; Adachi, S.; Hotate, K. Temporal gating scheme for enlargement of measurement range of Brillouin optical correlation domain analysis for optical fiber distributed strain measurement. In Proceedings of the 16th International Conference on Optical Fiber Sensors (OFS-16), Nara, Japan, 14–17 October 2003; p. We3-1. [Google Scholar]
  54. Hotate, K.; Arai, H.; Song, K.Y. Range-enlargement of smplified Brillouin optical correlation domain analysis based on a temporal gating scheme. SICE J. Control. Meas. Syst. Integr. 2008, 1, 271–274. [Google Scholar] [CrossRef]
  55. Mizuno, Y.; He, Z.; Hotate, K. Measurement range enlargement in Brillouin optical correlation-domain reflectometry based on double-modulation scheme. Opt. Express 2010, 18, 5926–5931. [Google Scholar] [CrossRef]
  56. Hotate, K.; Tanaka, M. Correlation-based continuous-wave technique for fiber optic distributed strain measurement using Brillouin scattering with cm-order spatial resolution; Applications to smart materials. IEICE Trans. Electron. 2001, E84-C, 1823–1828. [Google Scholar]
  57. Hotate, K.; Abe, K.; Song, K.-Y. Suppression of signal fluctuation in Brillouin optical correlation domain analysis system using polarization diversity scheme. IEEE Photonics Technol. Lett. 2006, 18, 2653–2655. [Google Scholar] [CrossRef]
  58. Song, K.-Y.; Hotate, K. Enlargement of measurement range in a Brillouin optical correlation domain analysis system using double lock-in amplifiers and a single-sideband modulator. IEEE Photonics Technol. Lett. 2006, 18, 499–501. [Google Scholar] [CrossRef]
  59. Hotate, K.; Yamauchi, T. Fiber-optic distributed strain sensing system by Brillouin optical correlation domain analysis with a simple and accurate time-division pump-probe generation scheme. Jpn. J. Appl. Phys. 2005, 44, L1030–L1033. [Google Scholar] [CrossRef]
  60. Zou, W.; He, Z.; Hotate, K. Distributed dynamic-strain sensing based on Brillouin optical correlation domain analysis. In Proceedings of the 8th Pacific Rim Conference on Lasers and Electro-Optics (CLEO PR 2009), Shanghai, China, 30 August–3 September 2009; p. WE1-5. [Google Scholar]
  61. Washiyama, K.; Kishi, M.; He, Z.; Hotate, K. High speed BOCDA measurement of strain distribution by longitudinal sweep method. In Proceedings of the 34th Progress in Electromagnetics Research Symposium (PIERS), Stockholm, Sweden, 12–15 August 2013; p. 4A-3. [Google Scholar]
  62. Song, K.Y.; Kishi, M.; He, Z.; Hotate, K. High-repetition-rate distributed Brillouin sensor based on optical correlation-domain analysis with differential frequency modulation. Opt. Lett. 2011, 36, 2062–2064. [Google Scholar] [CrossRef] [PubMed]
  63. Zou, W.; He, Z.; Hotate, K. Single-End-access correlation-domain distributed fiber-optic sensor based on stimulated Brillouin scattering. J. Lightwave Technol. 2010, 28, 2736–2742. [Google Scholar] [CrossRef]
  64. Song, K.-Y.; Hotate, K. Brillouin optical correlation domain analysis in linear configuration. IEEE Photonics Technol. Lett. 2008, 20, 2150–2152. [Google Scholar] [CrossRef]
  65. Ryu, G.; Kim, G.T.; Song, K.Y.; Lee, S.B.; Lee, K. Enhanced measurement range of single end accessible Brillouin optical correlation domain analysis incorporating time-domain data processing. In Proceedings of the 26th International Conference on Optical Fiber Sensors, Lausanne, Switzerland, 24–28 September 2018; p. TuE20. [Google Scholar]
  66. Song, K.Y.; He, Z.; Hotate, K. Distributed strain measurement with millimeter-order spatial resolution based on Brillouin optical correlation domain analysis. Opt. Lett. 2006, 31, 2526–2528. [Google Scholar] [CrossRef] [PubMed]
  67. Zhang, C.; Kishi, M.; Hotate, K. 5,000 points/s high-speed random accessibility for dynamic strain measurement at arbitrary multiple points along a fiber by Brillouin optical correlation domain analysis. Appl. Phys. Express 2015, 8, 042501. [Google Scholar] [CrossRef]
  68. Kohno, Y.; Kishi, M.; Hotate, K. Performance improvement in high-speed random accessibility of Brillouin optical correlation domain analysis. In Proceedings of the Sixth European Workshop on Optical Fibre Sensors (EWOFS’2016), Limerick, Ireland, 31 May–3 June 2016; Volume 9916, pp. 991630:1–991630:4. [Google Scholar]
  69. Tanaka, M.; Hotate, K. Application of correlation-based continuous-wave technique for fiber Brillouin sensing to measurement of strain distribution on a small size material. IEEE Photonics Technol. Lett. 2002, 14, 675–677. [Google Scholar] [CrossRef]
  70. Ong, S.S.L.; Kumagai, H.; Iwaki, H.; Hotate, K. Crack detection in concrete using a Brillouin optical correlation domain analysis based fiber optic distributed strain sensor. In Proceedings of the 16th International Conference on Optical Fiber Sensors (OFS-16), Nara, Japan, 14–17 October 2003; p. We3-3. [Google Scholar]
  71. Ong, S.S.L.; Imai, M.; Sako, Y.; Miyamoto, Y.; Miura, S.; Hotate, K. Dynamic strain measurement and damage assessment of a building model using a Brillouin optical correlation domain analysis based distributed strain sensor. In Proceedings of the 16th International Conference on Optical Fiber Sensors (OFS-16), Nara, Japan, 14–17 October 2003; p. We3-2. [Google Scholar]
  72. Kumagai, Y.; Matsuura, S.; Adachi, S.; Hotate, K. Enhancement of BOCDA systems for aircraft health monitoring. In Proceedings of the International Conference on Instrumentation Control and Information Technology, Tokyo, Japan, 20–22 August 2008; p. 2B02-2. [Google Scholar]
  73. Yari, T.; Nagai, K.; Ishioka, M.; Hotate, K.; Koshioka, Y. Aircraft structural health monitoring using on-board BOCDA system. In Proceedings of the 15th Annual International Symposium on Smart Structures and Materials & Nondestructive Evaluation and Health Monitoring, San Diego, CA, USA, 9–13 March 2008. Paper No. 6933-29. [Google Scholar]
  74. Saito, N.; Yari, T.; Hotate, K.; Kishi, M.; Matsuura, S.; Kumagai, Y.; Enomoto, K. Development status of SHM applications for aircraft structures using distributed optical fiber sensor. In Proceedings of the International Workshop on Structural Health Monitoring, Stanford, CA, USA, 10–13 September 2013. [Google Scholar]
  75. Hotate, K.; Watanabe, R.; He, Z.; Kishi, M. Measurement of Brillouin frequency shift distribution in PLC by Brillouin optical correlation domain analysis. In Proceedings of the 22th International Conference on Optical Fiber Sensors (OFS-22), Beijing, China, 15–19 October 2012; p. OF200-15. [Google Scholar]
  76. Zarifi, A.; Stiller, B.; Merklein, M.; Liu, Y.; Morrison, B.; Casas-Bedoya, A.; Ren, G.; Mitchell, A.; Vu, K.; Madden, S.J.; et al. Distributed SBS sensing in a silicon-chalcogenide platform. In Proceedings of the 26th International Conference on Optical Fiber Sensors, Lausanne, Switzerland, 24–28 September 2018; p. TuD4. [Google Scholar]
  77. Zadok, A.; Antman, Y.; Primerov, N.; Denisov, A.; Sancho, J.; Thévenaz, L. Random-access distributed fiber sensing. Laser Photonic Rev. 2012, 6, L1–L5. [Google Scholar] [CrossRef] [Green Version]
  78. Antman, Y.; Primerov, N.; Sancho, J.; Thevenaz, L.; Zadok, A. Localized and stationary dynamic gratings via stimulated Brillouin scattering with phase modulated pumps. Opt. Express 2012, 20, 7807–7821. [Google Scholar] [CrossRef] [Green Version]
  79. Mizuno, Y.; He, Z.; Hotate, K. One-end-access high-speed distributed strain measurement with 13-mm spatial resolution based on Brillouin optical correlation-domain reflectometry. IEEE Photonics Technol. Lett. 2009, 21, 474–476. [Google Scholar] [CrossRef]
  80. Mizuno, Y.; He, Z.; Hotate, K. Measurement range enlargement in Brillouin optical correlation-domain reflectometry based on temporal gating scheme. Opt. Express 2009, 17, 9040. [Google Scholar] [CrossRef] [PubMed]
  81. Mizuno, Y.; Zou, W.; He, Z.; Hotate, K. Operation of Brillouin optical correlation-domain reflectometry: Theoretical analysis and experimental validation. J. Lightwave Technol. 2010, 28, 3300–3306. [Google Scholar] [CrossRef]
  82. Manotham, S.; Kishi, M.; He, Z.; Hotate, K. Simulation and experiment for verifying intensity modulation scheme in Brillouin optical correlation domain reflectometry. In Proceedings of the CLEO2012, San Jose, CA, USA, 6–11 May 2012; p. CM4B.3. [Google Scholar]
  83. Manotham, S.; Kishi, M.; He, Z.; Hotate, K. 1-cm spatial resolution with large dynamic range in strain distributed sensing by Brillouin optical correlation domain reflectometry based on intensity modulation. In Proceedings of the 3rd Asia Pacific Optical Sensors Conference, Sydney, Australia, 31 January–3 February 2012; p. APO12-51. [Google Scholar]
  84. Matsuoka, O.; Kishi, M.; Hotate, K. Brillouin optical correlation domain reflectometry with double frequency modulation and phase modulation. In Proceedings of the 23rd International Conference on Optical Fiber Sensors (OFS-23), Santander, Spain, 2–6 June 2014; pp. 9157–384. [Google Scholar]
  85. Yao, Y.; Kishi, M.; Hotate, K. Brillouin optical correlation domain reflectometry with lock-in detection scheme. Appl. Phys. Express 2016, 9, 072501:1–072501:4. [Google Scholar] [CrossRef]
  86. Shimizu, R.; Kishi, M.; Hotate, K. Enlargement of measurement function in Brillouin optical correlation domain reflectometry with combining four performance Improvement Schemes. In Proceedings of the 25th International Conference on Optical Fiber Sensors (OFS-25), Jeju, Korea, 24–28 April 2017; p. PD-1. [Google Scholar]
  87. Maruyama, F.; Kishi, M.; Hotate, K. Brillouin optical correlation domain reflectometry with temporal gating scheme and apodization scheme. In Proceedings of the 24th International Conference on Optical Fiber Sensors (OFS-24), Curitiba, Brazil, 28 September–2 October 2015. Paper No. 9634-219. [Google Scholar]
  88. Kim, Y.H.; Lee, K.; Song, K.Y. Brillouin optical correlation domain analysis with more than 1 million effective sensing points based on differential measurement. Opt. Express 2015, 23, 33241–33248. [Google Scholar] [CrossRef] [PubMed]
  89. Shimizu, R.; Kishi, M.; Hotate, K. Enhancement of strain measurement dynamic range in basic BOCDR system with background noise reduction by simple filtering calculation scheme. In Proceedings of the 26th International Conference on Optical Fiber Sensors, Lausanne, Switzerland, 24–28 September 2018; p. WF15. [Google Scholar]
  90. Zou, W.; He, Z.; Song, K.-Y.; Hotate, K. Correlation-based distributed measurement of a dynamic grating spectrum generated in stimulated Brillouin scattering in a polarization-maintaining optical fiber. Opt. Lett. 2009, 34, 1126–1128. [Google Scholar] [CrossRef] [PubMed]
  91. Song, K.-Y.; Zou, W.; He, Z.; Hotate, K. Optical time-domain measurement of Brillouin dynamic grating spectrum in a polarization-maintaining fiber. Opt. Lett. 2009, 34, 1381–1383. [Google Scholar] [CrossRef] [PubMed]
  92. Zhu, B.; Saida, T.; Hotate, K. Variable optical filter using dynamic grating in Er doped fiber controlled by synthesis of optical coherence function: Proposal and experimental verification. IEICE Trans. Electron. 2003, E86-C, 97–99. [Google Scholar]
  93. Fan, X.; He, Z.; Hotate, K. Novel distributed fiber-optic strain sensor by localizing dynamic grating in polarization-maintaining erbium-doped fiber: Proposal and theoretical analysis. Jpn. J. Appl. Phys. 2005, 44, 1101–1106. [Google Scholar] [CrossRef]
  94. Fan, X.; He, Z.; Hotate, K. Distributed strain sensor based on dynamic grating in polarization-maintaining erbium-doped fiber. Opt. Lett. 2008, 33, 1647–1649. [Google Scholar] [CrossRef]
  95. Dong, Y.; Bao, X.; Chen, L. Distributed temperature sensing based on birefringence effect on transient Brillouin grating in a polarization-maintaining photonic crystal fiber. Opt. Lett. 2009, 34, 2590–2592. [Google Scholar] [CrossRef] [PubMed]
  96. Dong, Y.; Chen, L.; Bao, X. Truly distributed birefringence measurement of polarization-maintaining fibers based on transient Brillouin grating. Opt. Lett. 2010, 35, 193–195. [Google Scholar] [CrossRef] [PubMed]
  97. Song, K.-Y.; Yoon, H.-J. Observation of narrowband intrinsic spectra of Brillouin dynamic gratings. Opt. Lett. 2010, 35, 2958–2960. [Google Scholar] [CrossRef] [PubMed]
  98. Dong, Y.-K.; Chen, L.; Bao, X. Characterization of the Brillouin grating spectra in a polarization- maintaining fiber. Opt. Express 2010, 18, 18960–18966. [Google Scholar] [CrossRef] [PubMed]
  99. Kalosha, V.P.; Li, W.; Wang, F.; Chen, L.; Bao, X. Frequency-shifted light storage via stimulated Brillouin scattering in optical fibers. Opt. Lett. 2008, 33, 2848–2850. [Google Scholar] [CrossRef] [PubMed]
  100. Song, K.-Y.; Lee, K.; Lee, S.-B. Tunable optical delays based on Brillouin dynamic grating in optical fibers. Opt. Express 2009, 17, 10344–10349. [Google Scholar] [CrossRef]
  101. Zou, W.; He, Z.; Hotate, K. Tunable fiber-optic delay line based on stimulated Brillouin scattering. Appl. Phys. Express 2009, 3, 012501. [Google Scholar] [CrossRef]
  102. Song, K.Y. High-sensitivity optical time-domain reflectometry based on Brillouin dynamic gratings in polarization maintaining fibers. Opt. Express 2012, 20, 27377–27383. [Google Scholar] [CrossRef]
  103. Song, K.-Y. Operation of Brillouin dynamic grating in single-mode optical fibers. Opt. Lett. 2011, 36, 4686–4688. [Google Scholar] [CrossRef]
  104. Dong, Y.; Chen, L.; Bao, X. High-spatial-resolution time-domain simultaneous strain and temperature sensor using Brillouin scattering and birefringence in a polarization-maintaining fiber. IEEE Photonics Technol. Lett. 2010, 22, 1364–1366. [Google Scholar] [CrossRef]
  105. Song, K.Y.; Hotate, K.; Zou, W.; He, Z. Applications of Brillouin dynamic grating to distributed fiber sensors. J. Lightwave Technol. 2016, PP, 1–13. [Google Scholar] [CrossRef]
  106. Zou, W.; He, Z.; Hotate, K. Complete discrimination of strain and temperature using Brillouin frequency shift and birefringence in a polarization-maintaining fiber. Opt. Express 2009, 17, 1248–1255. [Google Scholar] [CrossRef] [PubMed]
  107. Zou, W.; He, Z.; Hotate, K. One-laser-based generation/detection of Brillouin dynamic grating and its application to distributed discrimination of strain and temperature. Opt. Express 2011, 19, 2363–2370. [Google Scholar] [CrossRef] [PubMed]
  108. Yamashita, R.K.; Kishi, M.; Hotate, K. Theoretical evaluation of Brillouin dynamic grating length localized by optical correlation domain technique through reflection spectrum simulation. Appl. Phys. Express 2017, 10, 042501:1–042501:4. [Google Scholar] [CrossRef]
  109. Yamashita, R.K.; He, Z.; Hotate, K. Spatial resolution improvement in correlation domain distributed measurement of Brillouin grating. IEEE Photonics Technol. Lett. 2014, 26, 473–476. [Google Scholar] [CrossRef]
  110. Sasai, T.; Kishi, M.; Hotate, K. Enhancement of spatial resolution in distributed measurement of Brillouin dynamic grating spectrum by optical correlation domain analysis. In Proceedings of the CLEO2016, San Jose, CA, USA, 22–23 June 2016; p. SM3P.6. [Google Scholar]
  111. Yamashita, R.K.; Zou, W.; He, Z.; Hotate, K. Measurement range elongation based on temporal gating in Brillouin optical correlation domain distributed simultaneous sensing of strain and temperature. IEEE Photonics Technol. Lett. 2012, 24, 1006–1008. [Google Scholar] [CrossRef]
  112. Zou, W.; He, Z.; Hotate, K. Range elongation of distributed discrimination of strain and temperature in Brillouin optical correlation-domain analysis based on dual frequency modulations. IEEE Sens. J. 2014, 14, 244–248. [Google Scholar] [CrossRef]
  113. Matsumoto, T.; Kishi, M.; Hotate, K. Discriminative and distributed measurement of temperature and strain with time-division pump-probe-read light generation by single laser diode in simplified BOCDA system. In Proceedings of the 23rd International Conference on Optical Fiber Sensors (OFS-23), Santander, Spain, 2–6 June 2014; Volume 9157. [Google Scholar] [CrossRef]
  114. Ohanian, J.; Yakusheva, A.A.; Kreger, S.; Kominsky, D.; Soller, B.J.; Tran, M.; Komljenovic, T.; Bowers, J.E. OFDR on photonic circuits: Fiber optic sensing infrastructure and applications. In Proceedings of the 26th International Conference on Optical Fiber Sensors, Lausanne, Switzerland, 24–28 September 2018; p. WB1. [Google Scholar]
  115. LUNA, ODiSI 6000 Series Data Sheet. Available online: http://lunainc.com/wp-content/uploads/2017/11/OD6_DataSheet_2018_10.pdf (accessed on 5 November 2018).
Figure 1. Fiber optic nerve systems to realize safety and security in the society.
Applsci 09 00187 g001
Figure 2. Varieties of fiber optic nerve systems. (a) Multiplexed fiber optic sensing; (b) distributed fiber optic sensing; and (c) quasi-distributed fiber optic sensing.
Applsci 09 00187 g002
Figure 3. Optical system for distributed sensing with synthesis of optical coherence function [16].
Applsci 09 00187 g003
Figure 4. Schematic drawings of schemes for the distributed sensing of reflections in an optical fiber with three kinds of synthesis of optical coherence function, which were demonstrated in the early experimental trial [16]. Distributed sensing with (a) changing the synthesized optical coherence lengths; (b) synthesizing sinusoidal-shaped optical coherence functions; and (c) synthesizing a delta function-like optical coherence function.
Applsci 09 00187 g004
Figure 5. Experimental results obtained by the three kinds of synthesis of optical coherence function (SOCF)-based distributed sensing schemes, as shown in Figure 4 [16]. Results shown in Figure 5a–c correspond to the three SOCF schemes shown in Figure 4a–c, respectively.
Applsci 09 00187 g005
Figure 6. SOCF setup to synthesize arbitrary-shaped optical coherence functions [22]. Waveform for FM, PM, and IM are shown in Figure 6i,ii,iii, respectively.
Applsci 09 00187 g006
Figure 7. Parallel shift of the synthesized optical coherence function by using phase modulation, which has a similar waveform to the FM waveform [22]. Figure 7a shows a synthesized delta-function-like optical coherence function without the shift along the position axes, and Figure 7b shows that shifted by the phase modulation, respectively.
Applsci 09 00187 g007
Figure 8. Examples of a variety of shapes of synthesized optical coherence functions [22]. (a) A delta function-like optical coherence function with side lobes reduced using intensity modulation; (b) triangle-shaped optical coherence function; and (c) trapezoid-shaped optical coherence function.
Applsci 09 00187 g008
Figure 9. Delta function-like optical coherence function with sinusoidal FM waveform [14]. (a) FM waveform; (b) power spectrum shape of the light source modulated with the sinusoidal FM waveform, and (c) synthesized delta function-like optical coherence function.
Applsci 09 00187 g009
Figure 10. Example of optical setup for multiplexed sensing of fiber Bragg gratings (FBGs) that have the same Bragg wavelength with the SOCF technology [28].
Applsci 09 00187 g010
Figure 11. Time-resolved simultaneous measurement of reflection spectra at multiple FBGs with the random accessibility by the setup shown in Figure 10 [28]. (a) Random access measurement of the reflection spectra at the three FBGs, which are located along the fiber as shown in Figure 10, with a total measurement speed of 60 Hz. (b) Random access measurement of the reflection spectra at three FBGs, which are located along a fiber portion of a 10 m length, with a total measurement speed of 10 kHz.
Applsci 09 00187 g011
Figure 12. Measurement of Bragg wavelength distribution along a long-length FBG with SOCF technology [29].
Applsci 09 00187 g012
Figure 13. Experimental setup of a quasi-distributed sensing system with multiplexed long-length FBGs by using a synthesized delta function-like optical coherence function [31].
Applsci 09 00187 g013
Figure 14. Experimental demonstration of the quasi-distributed sensing in the system that is shown in Figure 13 [31]. Bragg wavelength distribution along long-length FBGs are successfully obtained by the SOCF technology.
Applsci 09 00187 g014
Figure 15. Optical setup for distributed lateral force measurement along a polarization-maintaining optical fiber utilizing polarization modes coupling and the SOCF technology [32]. (a,b) show, respectively, the FM waveform to synthesize the delta-function-like optical coherence function and PM waveform to shift the synthesized optical coherence function along the optical fiber.
Applsci 09 00187 g015
Figure 16. Experimental results of the lateral force distribution measurement along a polarization-maintaining optical fiber [33]. System output (a) for no lateral force applied, and (b) for lateral force applied at three points along the fiber.
Applsci 09 00187 g016
Figure 17. Schematic drawing of Brillouin scattering caused along an optical fiber and its dependences on applied longitudinal strain and temperature change. (a) Spontaneous Brillouin scattering; (b) stimulated Brillouin scattering; (c) Brillouin gain spectrum (BGS) having the down-shifted frequency compared with the incident pump lightwave; and (d) dependence of Brillouin frequency shift on strain and temperature. The BGS of silica optical fibers has a spectrum width of about 30 MHz, which is related to the phonon lifetime.
Applsci 09 00187 g017
Figure 18. Schematic drawing of Brillouin optical time-domain reflectometry through launching a pulsed lightwave and detecting Brillouin backscattering as a function of time (a). Origin of trade-off between the spatial resolution (pulse width) and the measurement accuracy of strain and/or temperature (line width of the pulse) (b).
Applsci 09 00187 g018
Figure 19. First setup for Brillouin optical correlation domain analysis (BOCDA) (a). Mechanism of the position-selective measurement of the BGS by SOCF technology (b) [8].
Applsci 09 00187 g019
Figure 20. Experimental results and simulation results of the BOCDA outputs [8]. (a,c,e) are for the experiments, and (b,d,f) are for the simulation; (a,b) show the BGS distribution; (c,d) show the Brillouin frequency shift (BFS) distribution; (e,f) show the intensity distributions for the BFS of 10.83 GHz and 10.56 GHz, respectively.
Applsci 09 00187 g020
Figure 21. Example of the BOCDA systems that include three performance improvement schemes: the intensity modulation scheme, the time-division polarization diversity scheme, and the beat lock-in detection scheme [51,57,66].
Applsci 09 00187 g021
Figure 22. The spectral shape induced locally along the optical fiber by the BOCDA principle (a). At both sides of the correlation peak position, broadened spectra are generated that have large power portions at both edges of the spectrum. The BOCDA output spectrum is obtained by integrating all of the spectra that are generated at each position along the fiber (b). At the correlation peak position, a Lorenz-shaped signal spectrum is obtained, and a mountain-shaped background spectrum is generated as the integration of the spectra caused at the non-correlation portion.
Applsci 09 00187 g022
Figure 23. Simulations of the intensity modulation scheme [51]. (a) Two waveforms for the intensity modulation; the dashed curve is a sinusoidal FM waveform, and the red and black curves are for the IM. The red curve is a trial waveform for the IM, which is half the sinusoidal waveform to reduce the power at both edges of the time-averaged power spectrum caused by the FM. The high transmission portion that is shown by the black peak at both edges of the FM power spectrum is introduced to compensate for the over apodization; (b) Background spectrum reduced by the IM modulation; the red curve corresponds to the red IM waveform in (a), which makes over apodization at Δν = 0. The black curve corresponds to the IM waveform with a black peak in (a). (c) Signal spectra with reduced background spectrum by the appropriate IM waveform shown in (a).
Applsci 09 00187 g023
Figure 24. Experimental results of the IM scheme [51]. (a) Time-averaged laser diode (LD) power spectrum shapes without (black) and with (red) the IM modulation. The appropriate IM waveform is used. (b,c) BOCDA output spectra for the cases with (red) and without (black) the IM modulation; (b,c) correspond to the measurement at a strained portion and a non-strained portion along the fiber, respectively.
Applsci 09 00187 g024
Figure 25. BGS distribution along the fiber obtained in experiments (a,b) and simulations (c,d), respectively [51]. (a,c) are for the case without the IM modulation, and (b,d) are for the case with the appropriate IM modulation.
Applsci 09 00187 g025
Figure 26. Demonstration of quite a high spatial resolution in the distributed BFS measurement by BOCDA with the IM scheme and the beat lock-in scheme [66]. (a) BFS distributions when a three-mm length of the fiber is elongated; (b) BFS distribution when the two three-mm short sections of a dispersion-shifted fiber (DSF) are fusion-spliced into an ordinary single-mode fiber. A 300-MHz BFS difference (6000 με strain) is clearly measured due to the IM scheme and the beat lock-in scheme.
Applsci 09 00187 g026
Figure 27. BOCDA system that has the temporal gating scheme and the time-division pump and probe generation scheme [54].
Applsci 09 00187 g027
Figure 28. Experimental results of the distributed measurement by the BOCDA system shown in Figure 27. (a) Total distribution of the BFS; the spatial resolution is set to be seven cm, and the measurement range is elongated by the temporal gating scheme to be 1030 m. The ratio between the range and the resolution is 14,570; (b) BFS distribution at a strain-applied portion. (c) BGS distribution at another strain-applied portion [54].
Applsci 09 00187 g028
Figure 29. BOCDA system to realize a fast random accessibility speed [67].
Applsci 09 00187 g029
Figure 30. Experimental results of 5000 point/s high-speed random accessibility measurement by the system shown in Figure 29; five points are selected arbitrarily along the fiber [67]. Simultaneous dynamic strain measurements can equivalently be realized. (a,b) are the BGS and BFS change as a function of time, respectively.
Applsci 09 00187 g030
Figure 31. Basic BOCDR system [9].
Applsci 09 00187 g031
Figure 32. Experimental and simulation verification of the intensity modulation scheme in the BOCDR system [82]. (a) Four cases are shown: no IM, sinusoidal waveform IM, Gaussian waveform IM, and IM of Gaussian waveform and peaks to recover the power at both edges of the time-averaged LD power spectrum (optimized modulation). (b,c) show, respectively, the BGS measured at the DSF section and that at the SMF section.
Applsci 09 00187 g032
Figure 33. Experimental results of the distributed BFS measurement at the five-cm DSF section with one-cm spatial resolution [83]. The DSF section can be recognized due to the intensity modulation scheme.
Applsci 09 00187 g033
Figure 34. Schematic drawing of background spectrum reduction by the phase modulation scheme [84]. Two cases are shown; measurement at the strained portion (DSF section) and at the non-strained portion (SMF section). (a,b) shows BGS obtained without and with the PM scheme, respectively; (c) Background spectrum reduction by subtracting (b) from (a).
Applsci 09 00187 g034
Figure 35. Experimental results of the BOCDR outputs (a) without the PM and (b) with the PM, respectively [84]; (c) Subtracted spectra; signal spectrum for the DSF section and the SMF section is clearly shown by the red and the blue curves, respectively.
Applsci 09 00187 g035
Figure 36. Simplified explanation of the double modulation scheme to elongate the measurement range [55]. (ac) show, respectively, the synthesized coherence functions for the FM frequency of f0, 4f0, and f0 with 4f0.
Applsci 09 00187 g036
Figure 37. BFS distribution measured by the BOCDR system having the four performance improvement schemes [86]. The measurement range and the spatial resolution is 3.94 cm and 5280 m, respectively. The ratio between these is 134,000.
Applsci 09 00187 g037
Figure 38. Experimental setup for distributed strain measurement in a polarization maintaining erbium-doped fiber (PM-EDF) [94]. In the fiber, the two lightwaves in one polarization axis are propagated in opposite directions with respect to each other, which makes a standing wave that induces gain grating along the fiber. The Bragg reflection spectrum is read by the third lightwave launched in the orthogonal polarization. The difference of the Bragg reflection frequency between the two polarization lightwaves corresponds to the fiber birefringence, which tells us the strain. The SOCF scheme is applied to have the position selective measurement of the birefringence.
Applsci 09 00187 g038
Figure 39. Experimental results of distributed measurement of (a) the Bragg reflection spectrum and (b) the Bragg frequency shift [94].
Applsci 09 00187 g039
Figure 40. Brillouin dynamic grating (BDG) generation in a polarization-maintaining optical fiber (PMF). (a) Schematic drawing of the mechanism for the BDG generation; (b) experimental result of BDG reflection spectra measurement [20].
Applsci 09 00187 g040
Figure 41. Strain and temperature dependence of the BFS and the BDG Bragg reflection frequency in a polarization-maintaining optical fiber [106]. Strain dependence (a) and temperature dependence (b) of the BFS and the BDG Bragg reflection frequency.
Applsci 09 00187 g041
Figure 42. BOCDA system to measure strain and temperature distribution discriminatively along a PMF while measuring both the BFS and the BDG reflection [90].
Applsci 09 00187 g042
Figure 43. Experimental demonstration of distributed and discriminative measurement of strain and temperature [18]. (a) Measured distribution of BFS and birefringence-induced Bragg frequency difference. Blue data; B, D, E, F, and H sections are heated, but no strain is applied. Red data; temperature distribution is the same, but strain is applied at only the E section; (b) Strain and temperature distribution calculated by Equation (5).
Applsci 09 00187 g043
Figure 44. Simulation results of the BDG reflection spectrum shape. (a) Fiber considered in the simulations; strained section is set at the correlation peak position whose length is changed in the simulations. (b) BDG reflection spectra simulated for the cases with different lengths of the strained section; (b-1), (b-2), and (b-3) correspond to the strained section lengths of 5dz, 15dz, and 25dz, respectively, where dz is the theoretical spatial resolution for BOCDA [108].
Applsci 09 00187 g044
Figure 45. Experimental setup of the BDG-BOCDA system to confirm the spatial resolution improvement in the distributed measurement of the BDG reflection by the intensity modulation scheme [109].
Applsci 09 00187 g045
Figure 46. Experimental verification of the spatial resolution improvement by the intensity modulation (IM) scheme [109]. In the experiment, a fiber portion is put into the cooled water, and the portion length is changed. The correlation peak position is set at the center of the cooled portion. (a) BDG reflection spectrum obtained without using the IM, which has the two peaks corresponding to the room temperature and the cooled fiber portion. (b) Plots of the two peaks’ power shown in Figure a. The crossing point of the two curves shows the equivalent spatial resolution. (c) BDG reflection spectrum obtained with using the IM. (d) Plots of the two peaks’ power shown in Figure c. The crossing point shows the equivalent spatial resolution.
Applsci 09 00187 g046

