Article

Distributed Dynamic Cluster-Head Selection and Clustering for Massive IoT Access in 5G Networks

Department of Communications Engineering, Xiamen University, Xiamen 361005, China
*
Author to whom correspondence should be addressed.
Appl. Sci. 2019, 9(1), 132; https://doi.org/10.3390/app9010132
Submission received: 31 October 2018 / Revised: 24 December 2018 / Accepted: 26 December 2018 / Published: 2 January 2019
(This article belongs to the Special Issue Access Control Schemes for Internet of Things)

Abstract

:
With the rapid growth of Internet-of-things (IoT) devices, IoT communication has become an increasingly crucial part of 5G wireless communication systems. The large-scale IoT devices access results in system overload and low utilization of energy efficiency under the existing network framework. In this paper, the cluster head uses the LTE-M protocol, and the intra-cluster uses the low-power wide-area network (LPWAN) self-networking protocol in the wireless sensor network. By a detailed analysis of the messages exchanged between the device and the base station, we describe the causes of overload and the steps of data aggregate combined with the physical channel. Then, we explore the cluster head quantity and the optimal scale in the intra-cluster under the traditional K-mean algorithm. When K is 30 under specific resources, the simulation results show that the system’s access success probability and resource utilization are optimal. Also, we propose a distributed dynamic cluster-head selection and clustering scheme based on an improved K-means algorithm. Simulation results show that the proposed scheme can reach 88.07% on the access success probability. The throughput and resource utilization are 3.5 times high than that of the optimal K-means.

1. Introduction

Massive machine type communication is one of the main scenes of 5G wireless communication. Cisco estimates that 70% of IoT device connections will serve by the 3rd Generation Partner Project (3GPP) developed networks [1] because the existing cellular network has broad coverage, a large amount of deployed infrastructure, a complete user service management system, and so on. In order to adapt to the IoT device service well, in the future wireless network, the primary solution is to optimize the existing cellular network for service characteristics. Therefore, the 3GPP organization has been working on the standardization of IoT networks since Release-8, which is more inclined to choose optimization schemes that have less impact on existing networks to enable cellular networks to support massive IoT device communication [2].
With a large number of IoT devices application service centered on the uplink, the transmission data is small, the transmission is frequent, and the battery is difficult to replace. When large-scale devices request to access the network, the collision caused by random access is the main reason for low resource utilization of small data IoT devices. There are two main problems in the existing network for the future massive IoT access.
  • Massive IoT devices access will generate a large number of collisions and especially the congestion of random access, which will seriously reduce the access success probability and result in a system overload.
  • IoT devices transmit small amounts of data requiring more than 20 handshakes to establish a data connection with the base station (BS) in LTE-M [3], which leads to high signaling overhead and results in low Resource Utilization.
The solutions are optimized for these problems as follows: on the one hand, the research mainly considers the high-efficiency random access process of the Media Access Control (MAC) layer. It is primarily to improve the random access process to alleviate the problem of high collision probability, thereby reducing waste and achieving energy efficiency optimization. Also, it mainly divides into two research ideas. One is a dynamic allocation of random access process resources including preamble, time, and frequency-domain. The other is access control including dynamic control methods [4,5] and multiple back-off methods [5,6].
On the other hand, based on the idea of cooperative relaying, it can be combined with other lower-power technologies [7] for intra-cluster communication. In the relay-based transmission mechanism, device clustering algorithm and the selection of cluster head are the critical factors affecting energy efficiency. Specific rules group all devices, one of which acts as a coordinator. The Conventional clustering method is based on the fixed geographical position of the device before the network starts to operate. The cluster head is stationary regardless of whether the device is in an active state or a dormant state. This approach improves the performance of the system, but it requires the cluster head to have an unlimited energy supply. Literatures [8,9,10,11,12,13,14] propose a low-energy adaptive clustering hierarchy (LEACH) algorithm and related improvements. LEACH is a self-organizing, adaptive clustering protocol that uses randomization to distribute the energy load evenly among the sensors in the network. Sensors elect themselves to be local cluster-heads at any given time with a certain probability. A series of K-means selection algorithms based on grouping and coordinator are introduced in ref. [15]. Researches [16,17] discuss within their clustering mechanism some criteria, such as the communication interest among the devices. Ref. [18] explains in detail the exploitation of the device-to-device communication scenario; it can support efficient resource management, especially in the considered Orthogonal Frequency-Division Multiple Access (OFDMA) setup.
He and Huang [19] proposed a two-stage mechanism to minimize the energy consumption of all Machine-Type Communications (MTC) devices. The first phase consists of MTC device grouping and coordinator selection, and the criteria for grouping and coordinator selection is the minimization of energy consumption for each group. The second phase is that the base station allocates the power for each coordinator to reduce energy consumption further. However, it is difficult to obtain a final solution for the goal, so then the author uses the Step-by-step calculation to achieve sub-optimal results. The literature [20] proposes a scheme using clustering and relaying ideas: intra-cluster communication relies on a multiphase Carrier Sense Multiple Access/Collision Avoidance (CSMA/CA) protocol, and resource reservation protocols use for communication between the cluster head and the base station. Ref. [21] proposes a dynamic clustering and user association scheme in the small wireless networks. In their work, the authors decompose the user association into a dynamic clustering problem and put forward a user association method based on cultural similarity to solve the problem. Literatures [22,23,24] use cloud-based solutions for energy efficiency optimization. In ref. [25], a user-centric clustering and scheduling scheme based on service perception is given to improve the delay and throughput performance [26] of the cloud Radio Access Network (RAN) through coordinated multipoint transmission. However, there is still an unsolved problem that cooperative relays make cluster heads consume more energy than other devices.
In this paper, we consider the scenario of large-scale IoT device access. A large number of collisions result in lower energy efficiency. Then, we present a detailed analysis of the random access process and data transmission process combined with the physical channel. We give the main reason for the collision and finally, we propose a distributed dynamic cluster-head selection and clustering scheme based on an improved K-means algorithm. The solution draws on distributed ideas, which allow high-energy behavior to distribute across all devices. More specifically, this work provides two significant contributions.
  • We analyze the communication process combined with the channel resources including random access and data transmission under the existing network system structure developed by 3GPP. The energy efficiency of the system is then modeled based on the analysis.
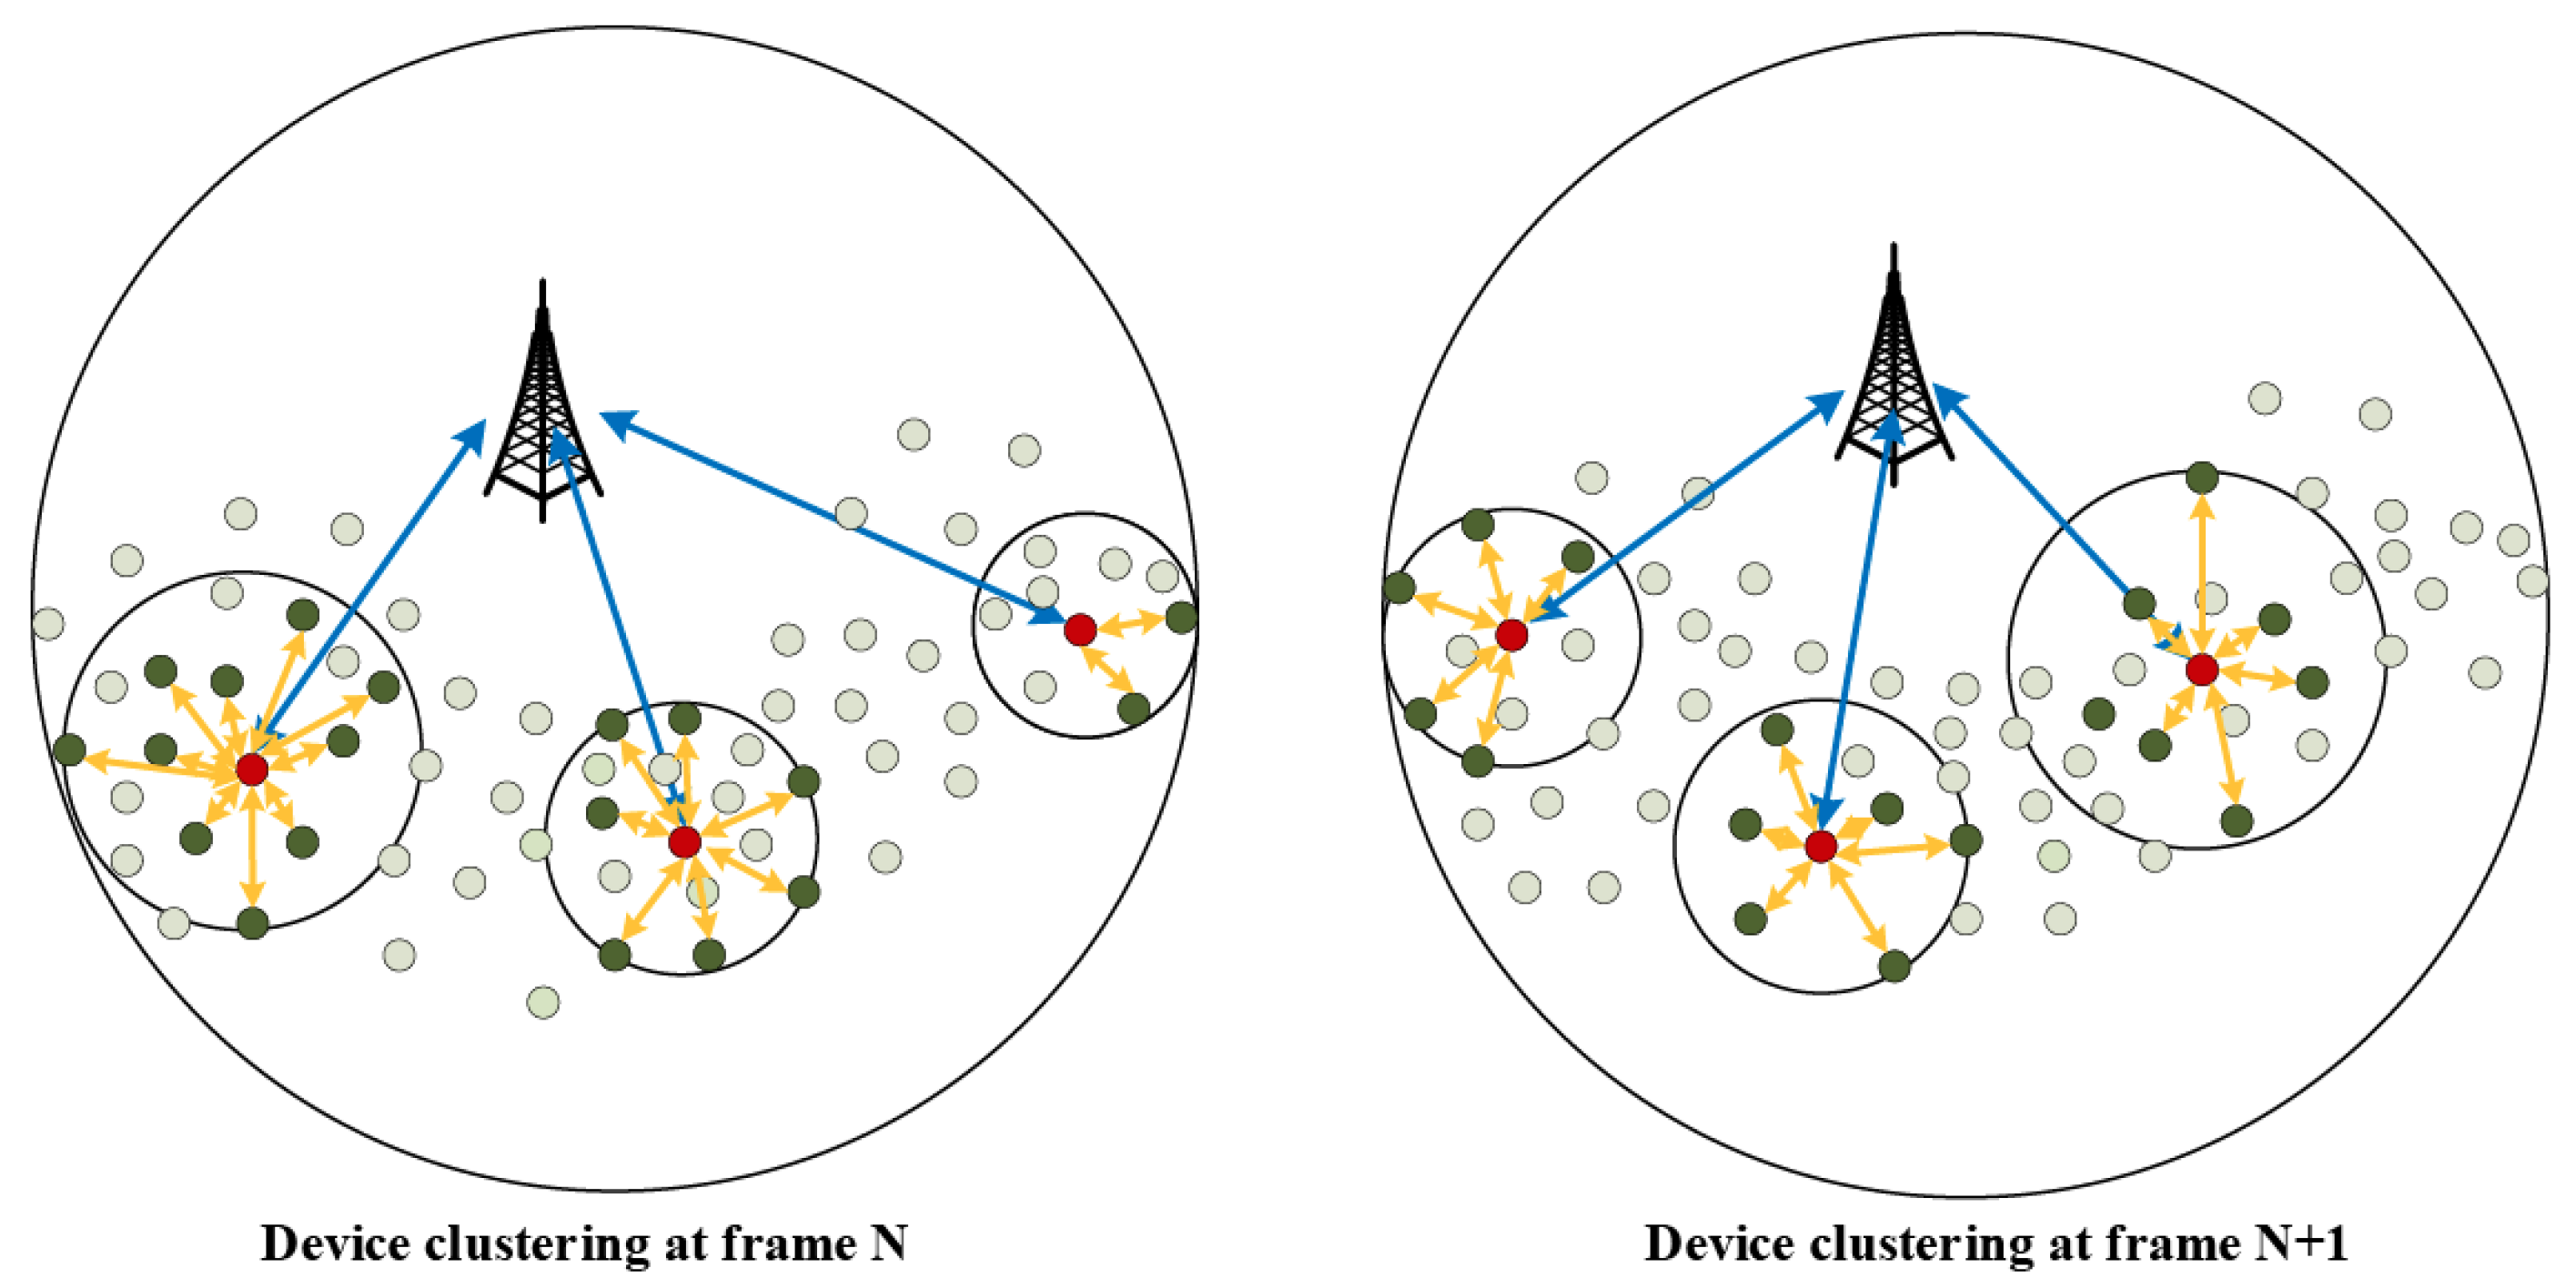
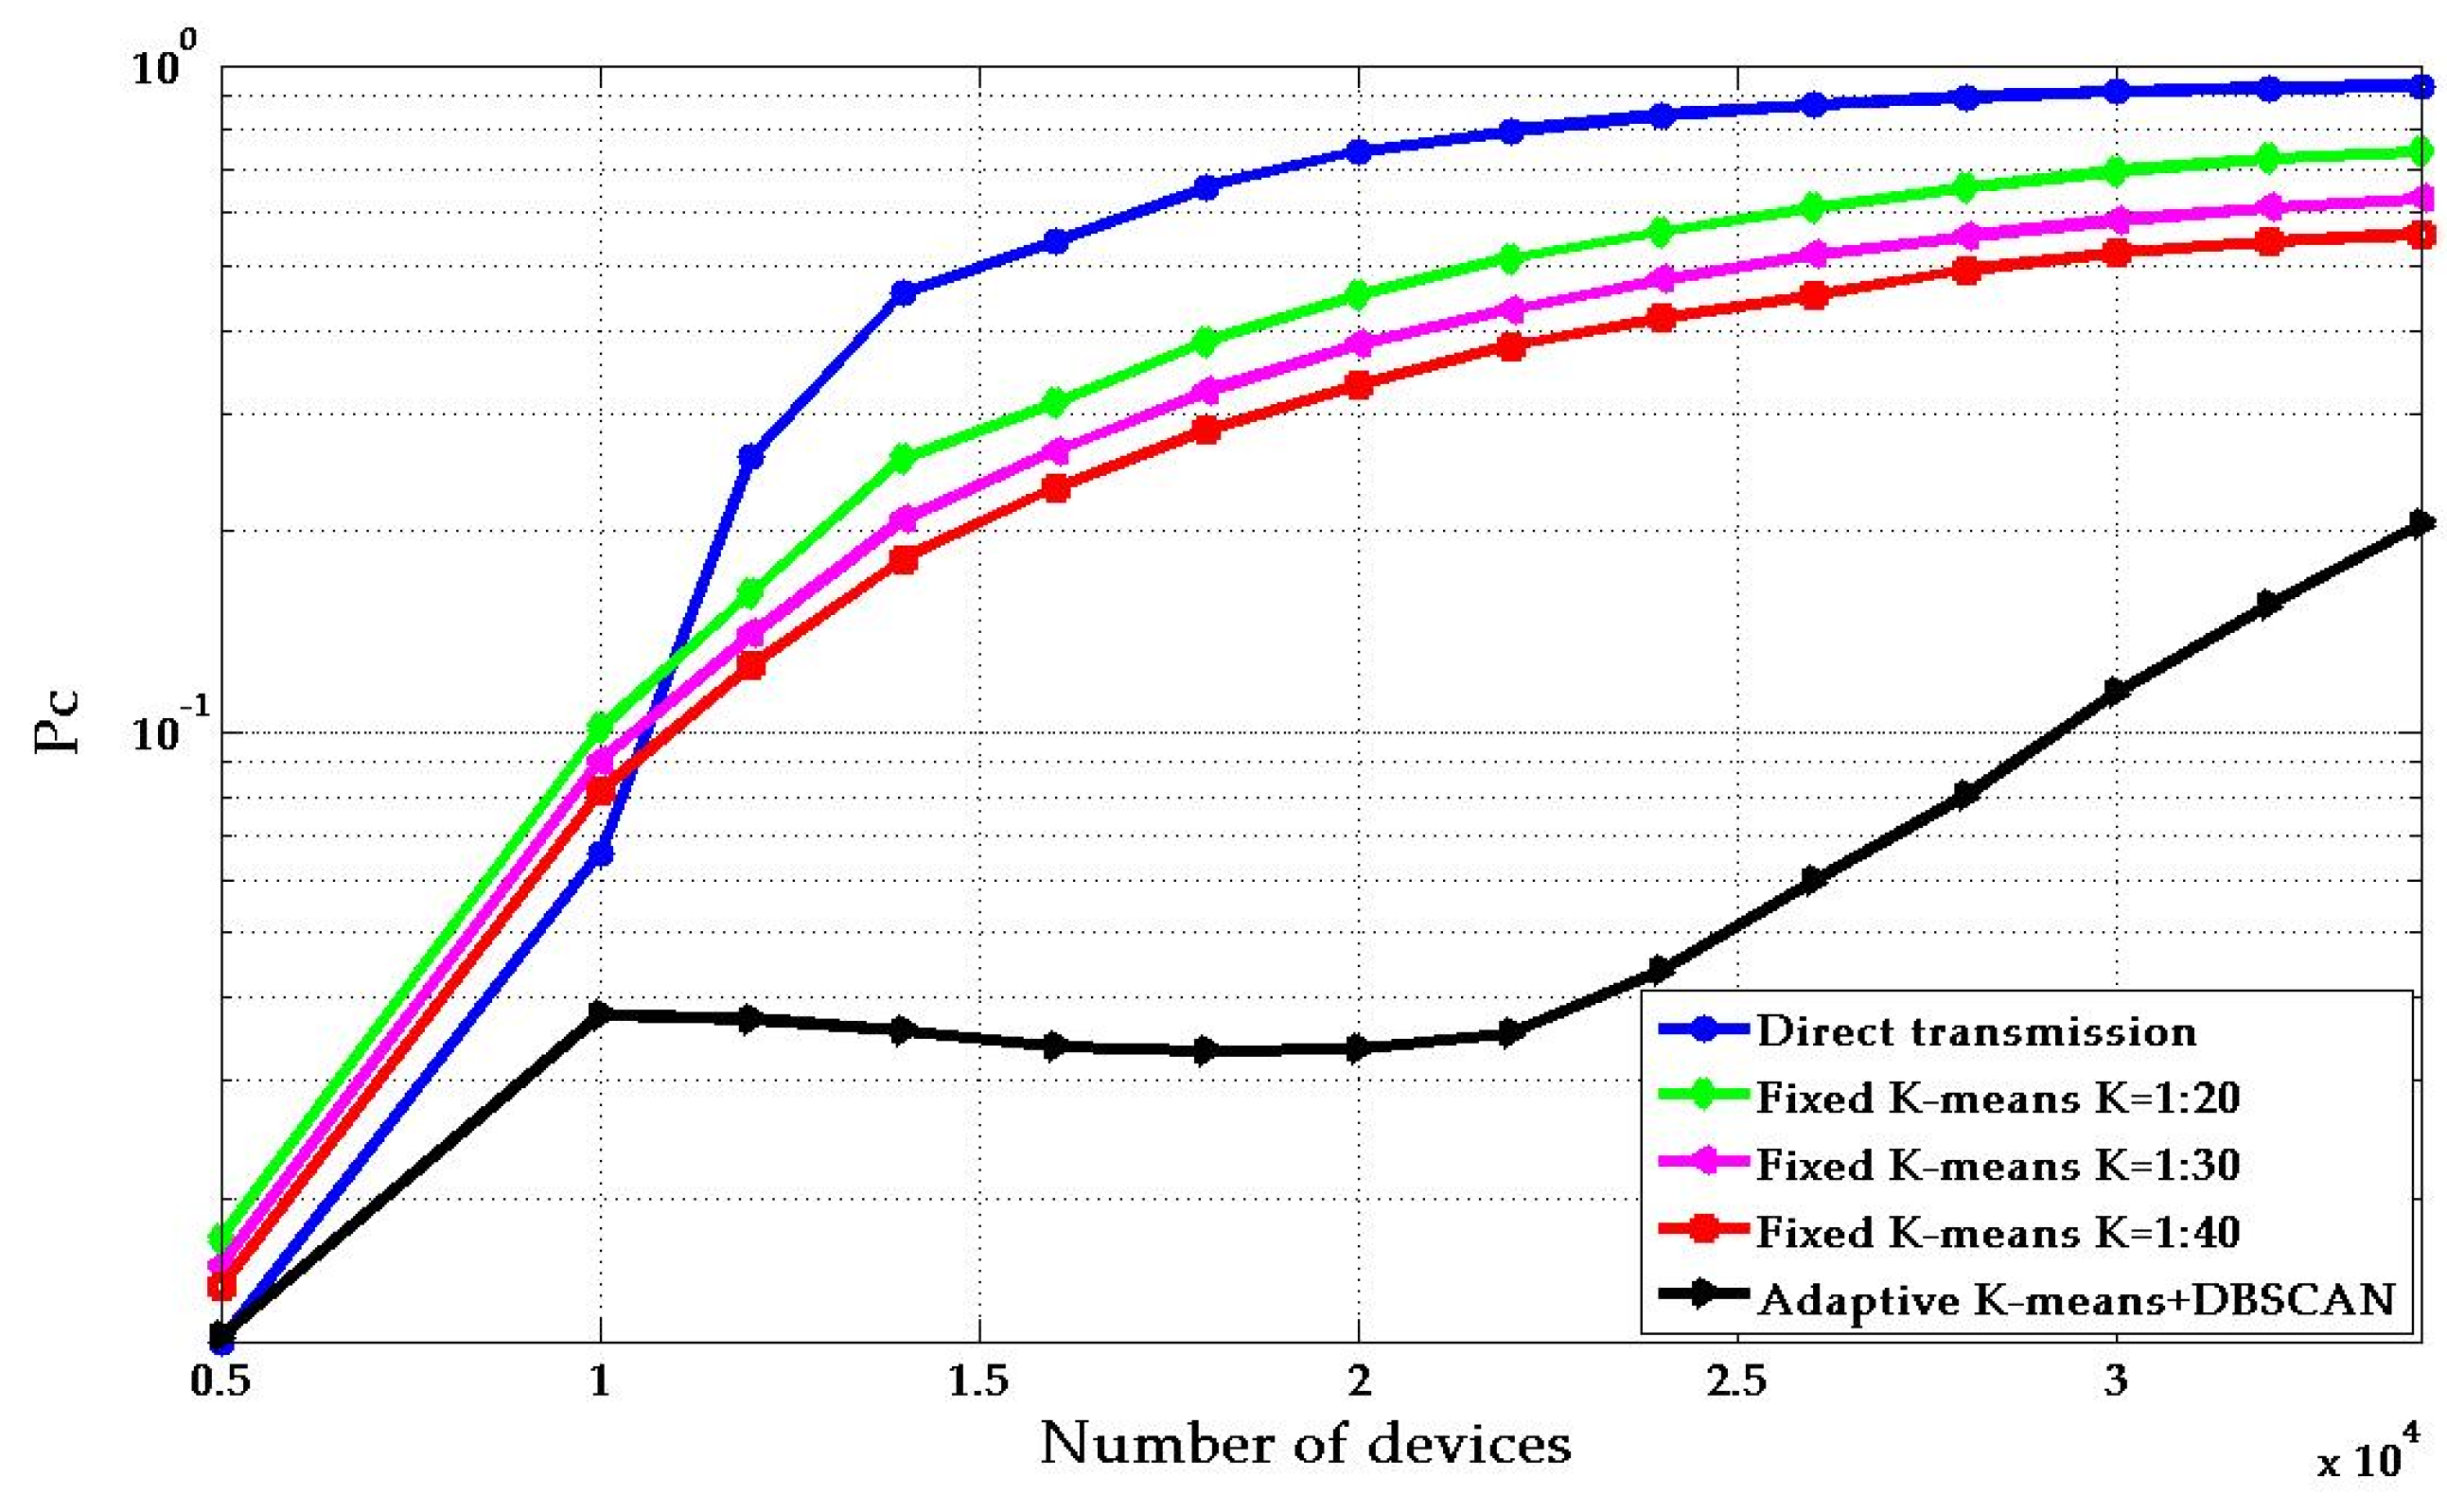
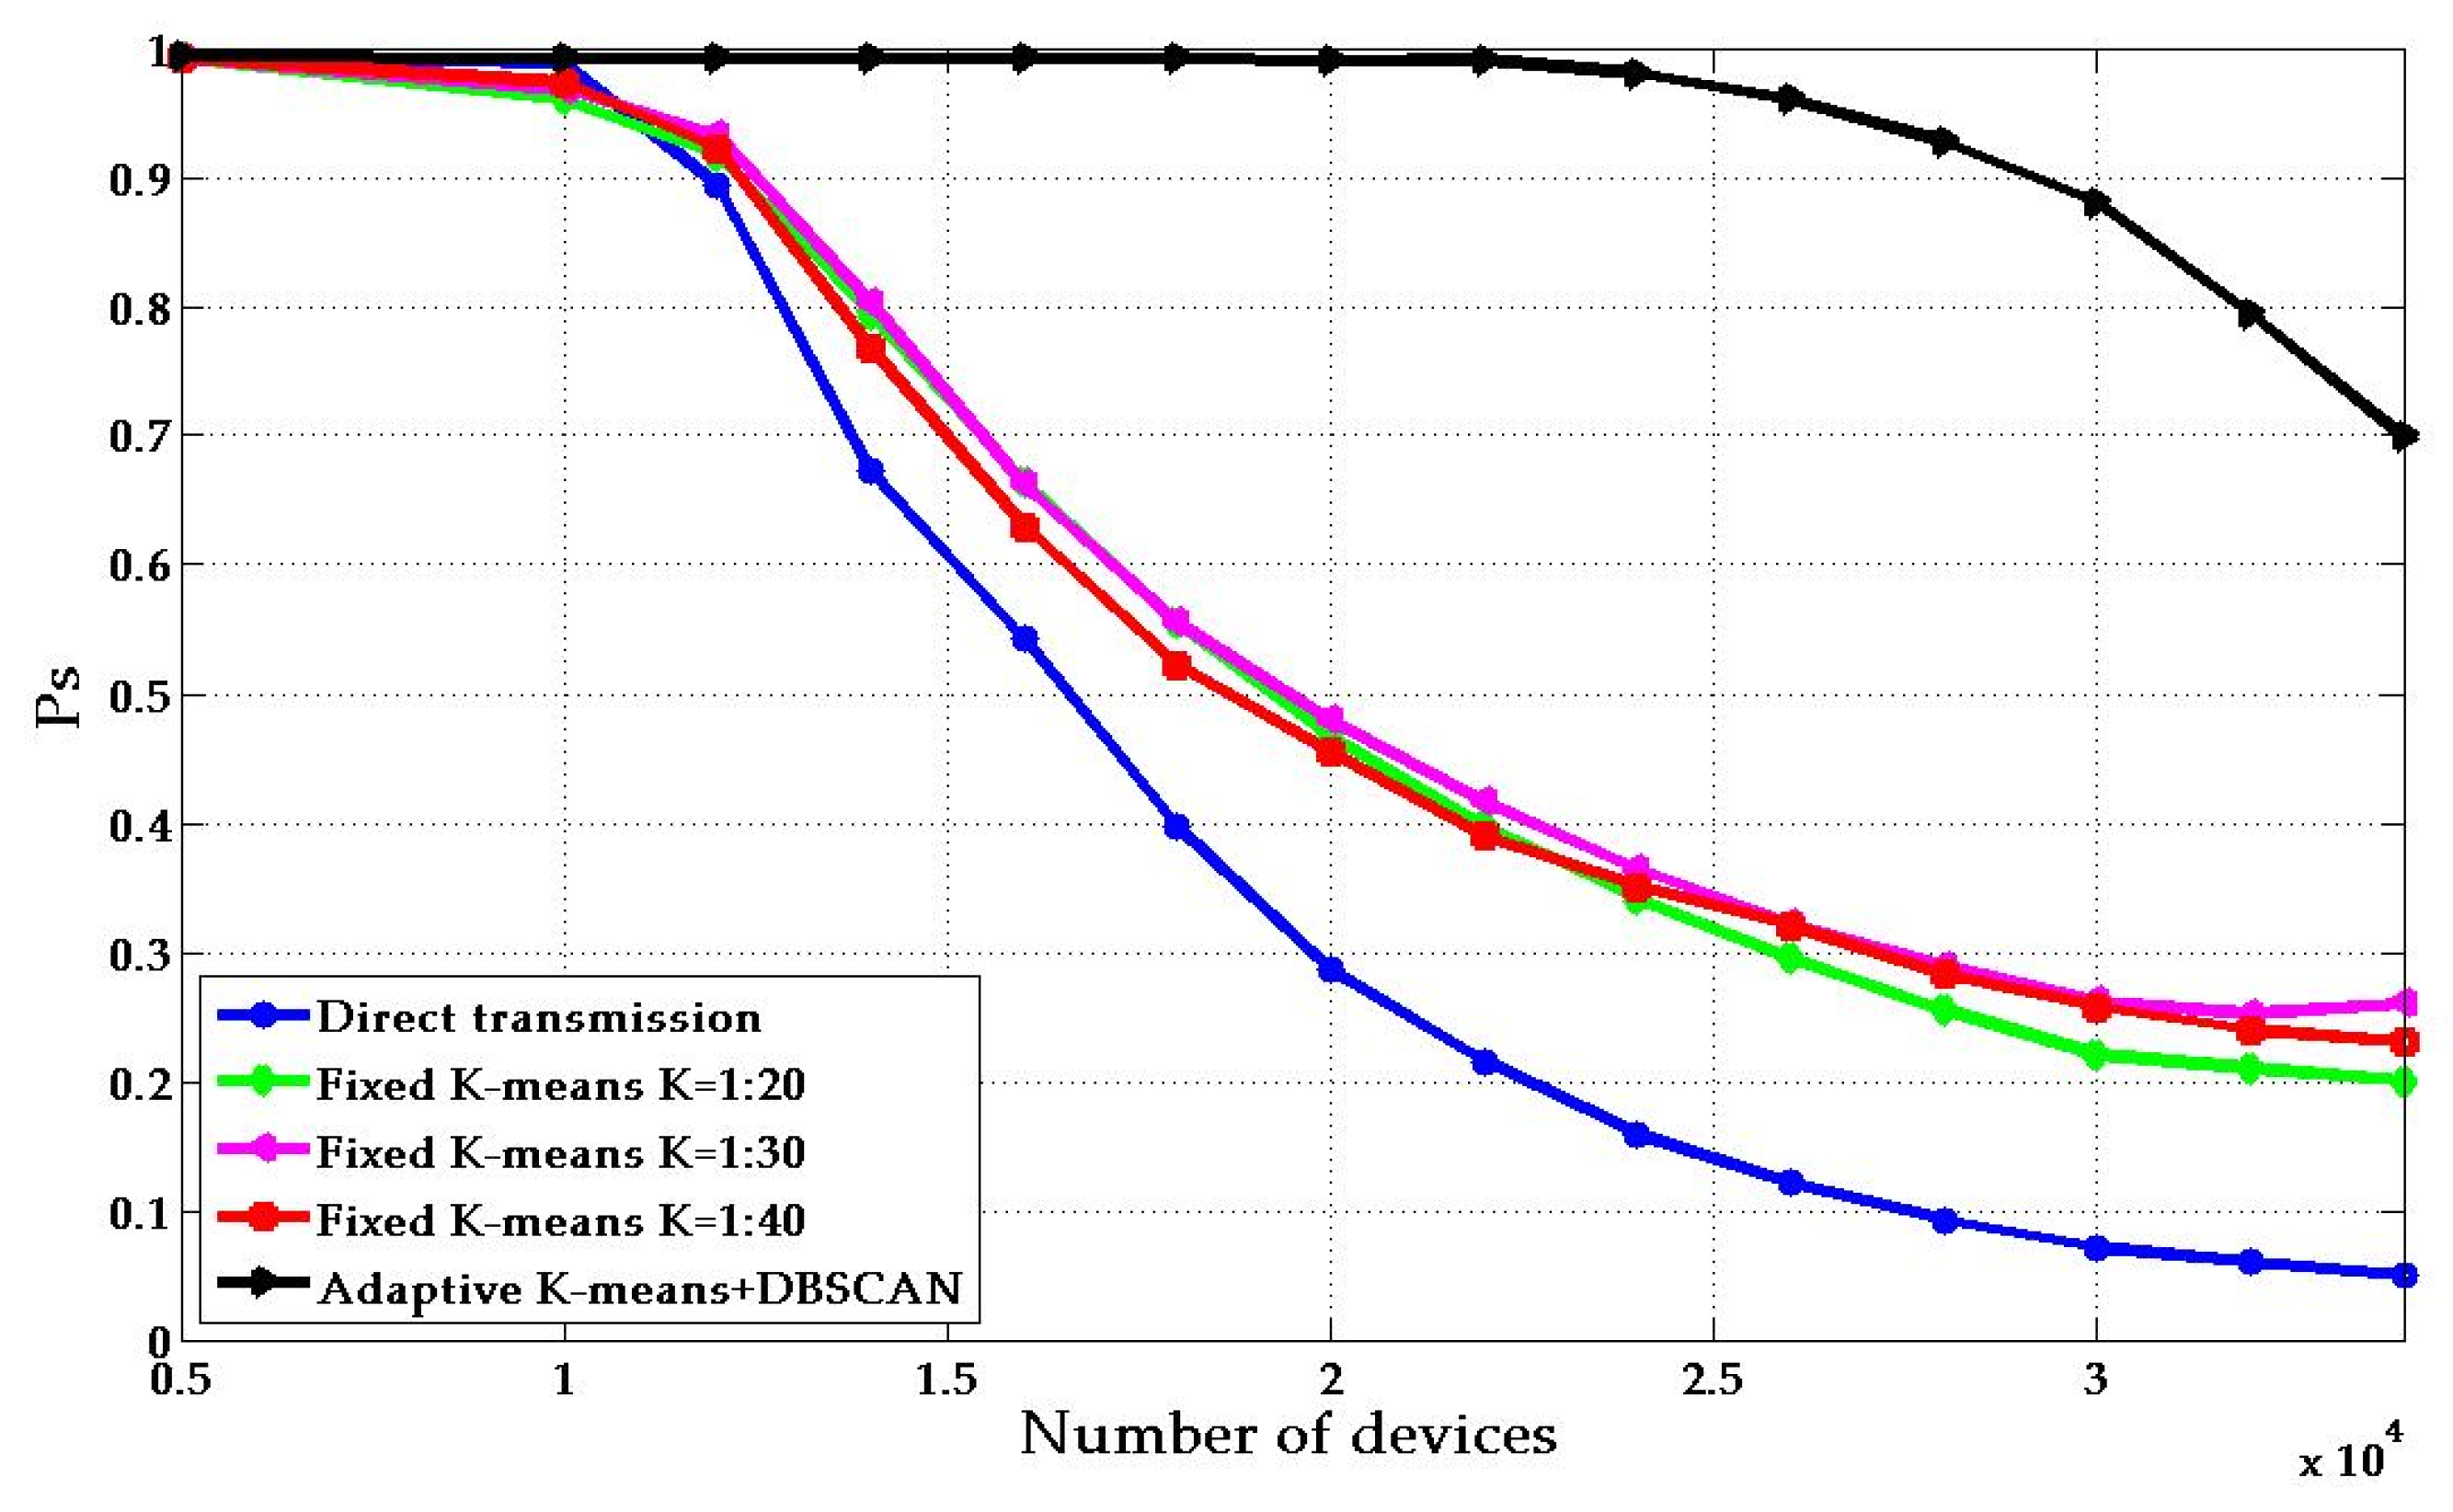
  • We use a noise-based density-based method to pre-separate clusters, obtain the required number of cluster heads and initial positions according to the distribution of devices in the region, and solve the actual process access problem of excessive energy consumption in the cluster head. In the optimization of system energy efficiency, an adaptive energy efficiency optimization algorithm based on the distributed idea is proposed. Compared with the existing K-means algorithm, the simulation results show that the proposed algorithm can significantly improve the system energy efficiency and throughput.
The rest of the paper is organized as follows. Section 2 describes the random access procedure and data aggregation procedure in this paper. The system model considered in this paper is defined in Section 3. The numerical results are given in Section 4. Section 5 summarizes the conclusions.

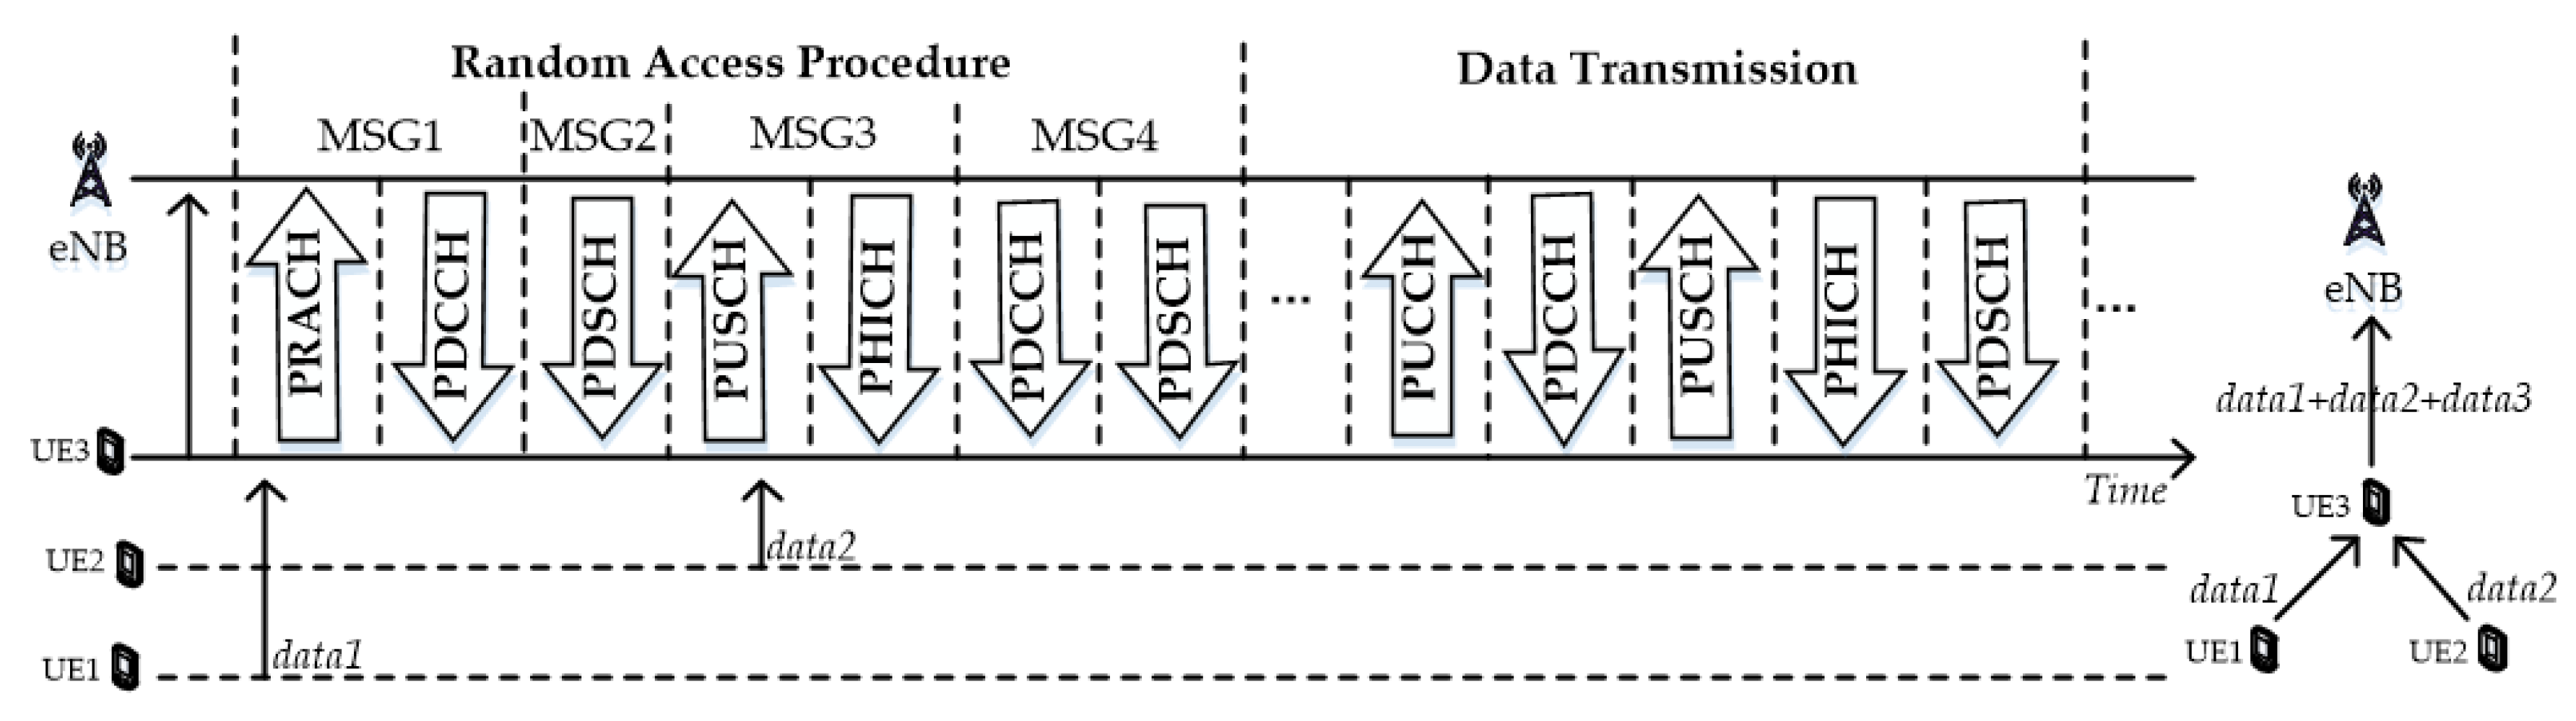
2. Description of Random Access and Data Aggregation

Figure 1 shows the signaling interaction and data transmission between the device and the base station. The device is in a Radio Resource Control (RRC) idle state before starting the data reporting process. The following three processes are required to complete the data transfer:
  • Establishing an RRC-connected contention-based random access procedure
  • Establishing an RRC-connected data transmission
  • Releasing an RRC connection
The active User (UE) 1, 2, and 3 send data1, 2, and 3 to the base station respectively at different times. Collisions mainly occur during the random access process. The random access procedure includes four steps MSG1 to MSG4. The device first selects a limited preamble resource to send request access to the base station on the Physical Random Access Channel (PRACH) in MSG1. Collisions occur when two or more devices select the same preamble. The device can transmit multiple times, and the base station settings determine the maximum number of transmissions. Upon receiving the preamble, the base station applies for a Cell Radio Network Temporary ID (C-RNTI) and applies for uplink and downlink resources for scheduling. Then, the base station sends a random access response over the Physical Downlink Shared Channel (PDSCH) for each UE. The response contains the Random Access (RA)-preamble identifier, timing alignment information, initial uplink grant, and temporary C-RNTI. One PDSCH can carry random access responses to multiple UEs.
After the UE sends the preamble, it monitors the Physical Downlink Control Channel (PDCCH) and waits for a random access response within a random access response window:
  • If the UE receives a response containing an RA-preamble identifier which is the same as the identifier contained in the transmitted random access preamble, the response is successful, and the RA-preamble identifier is used for uplink transmission.
  • If the UE does not receive a response within the random access window or fails to verify the response, the response fails.
In this case, if the number of random access attempts is smaller than the upper limit, the UE retries random access. Otherwise, random access fails.
The UE sends Msg3 using the resources contained in the random access response. The UE transmits uplink scheduled data over the Physical Uplink Shared Channel (PUSCH). The size of the transport block is specified in the random access response. The information in the transport block sent by the UE varies in different random access scenarios: The RRC Connection Request message is sent by the UE over the Common Control Channel (CCCH) and contains the cause of the Radio Resource Control connection setup. This message also contains the Media Access Control (MAC) control element for requesting uplink transmission resources. Other scenarios at least the C-RNTI of the UE are transmitted.
After the UE sends Msg3, a contention resolution timer starts. Within the timer length, the base station performs contention resolution at the MAC layer and informs the UE of the resolution through the C-RNTI on the PDCCH or through the UE Contention Resolution Identity on the PDSCH. The UE monitors the PDCCH before the timer expires. The UE considers the contention resolution as successful, notifies upper layers, and stops the timer if both of the following conditions are met: the UE obtains the temporary C-RNTI over the PDCCH, the MAC packet data unit (PDU) is successfully decoded, and the MAC PDU contains information matching the CCCH equipment data unit (SDU) transmitted in Msg3. If the contention resolution is successful, the contention-based random access procedure is complete. If the contention resolution timer expires, the UE considers the contention resolution as failed. Then, the UE performs random access again if the number of random access attempts has not reached its upper limit. If the number of random access attempts has reached its upper limit, the random access procedure fails.
Figure 1 shows an example of data aggregation in the cluster header devices. In the LTE-M wireless network system, 12 subcarriers in frequency or one slot in the time domain are called a resource block (RB). It can be used to carry data. As shown in Figure 1, data1, data2, and data3 will be placed in the buffer before a new cluster header device is to upload data. Before the cluster header device transmits data, it will upload other data in the previous buffer. The data of the devices in the cluster transmit to the cluster head device through an intra-cluster network such as Lora, SigFox, or other typical local area networks (LAN) protocol (orthogonal to cellular networks). The cluster head device then forwards the data to the base station using the LTE-M uplink channel. It can see from the above-detailed process that the cluster head device needs to perform a random access process before performing data transmission. At the same time, it is necessary to establish a connection with additional signaling to acquire the RB of the PUSCH for transmitting data. After the random access connection establishes, the cluster head device uploads the device data of the other clusters together in the previous buffer. In the transmission process, this is a new way to reduce the collision caused by the random access of a large number of devices in the cluster. This solution improves the overall energy efficiency utilization and reduces energy consumption with less signaling overhead. The solution is efficient for small data IoT devices.

3. System Model

Using collaborative relay can significantly improve system energy efficiency. In the traditional clustering method, the cluster head is already divided according to the fixed geographical position of the device before the network starts to operate, regardless of whether the device is in an active state or the sleep state. However, it is an unavoidable problem that cooperative relaying makes the cluster head consume more energy than other devices. In order to get rid of high energy consumption in a single cluster head, this paper draws on the idea of “distributed” and uses spatial and temporal methods for data aggregation to distribute high energy consumption behavior to all devices. As shown in Figure 2, the solid red circle represents the device that is activated and is the cluster head, the solid black circle represents the activated device, and the open circle represents the inactive device. During the Nth frame to the N +1th frame, combined with different device activation or silence, the grouping and cluster head selection dynamically perform according to the number of activated devices and the distance between the devices. The number of devices activated at different points in time is less than the total number of devices. The density of devices that need to be clustered is relatively small, which reduce the complexity of the clustering algorithm.
Based on the group and relay mechanism, research [19,27] usually adopts the K-means algorithm to optimize the criterion function for evaluating clustering performance. In the adoption of this algorithm, it is necessary to specify the number of clusters and consider the optimal number of cluster heads [28,29]. Also, it generally assumes that the algorithm will be used to perform the clustering step before the device starts to access. However, in practice, the access process of the device is a dynamic process including new device registration and device failure, which requires dynamic clustering. This paper proposes an adaptive cluster head selection method to solve this problem. This method reduces the collisions generated by the equipment from the access, thereby improving the energy efficiency and capacity of the system further.

3.1. Energy Consumption Analysis

This paper considers the uniform distribution of N devices in a single base station. The base station uses a clustering algorithm to cluster each device D n ( n = 1 , N ) in the cell according to the transmission environment including the channel quality and the device location. Then, the Base station divides the device into M ( M N ) clusters. The number and set of devices belonging to the m t h group can be expressed as N m and G m . Each group will select a cluster head as the device for data aggregation, which the devices in the cell can represent as C = { c m | m = 1 , 2 , , M } , where the cluster head of the m t h cluster is c m . The devices in the cluster can transmit data through the cluster header device. The system consists of two links: one is between the device and the cluster header device, and the other is between the cluster header device and the base station. The corresponding link data rates are expressed as r D n c m and r c m , l . According to Shannon’s theorem:
r D n c m = B D log 2 ( 1 + p D n | h D n c m | 2 N 0 B D ) , D n G m
r c m , l = B log 2 ( 1 + p c m , l | h c m | 2 N 0 B )
B D and h D n c m represent the bandwidth and channel gain of the link from device D n to cluster header device c m belonging to the cluster G m , respectively. We assume that link one is flat fading because the intra-cluster distance is short and transmitted in narrowband. p D n is the transmission power of the MTC device D n . p c m , l is the transmission power of the cluster header device c m on the l t h RB ( l L c m ) .
The purpose of optimization is to maximize the overall energy efficiency of the system, that is, to minimize energy consumption. In this paper, p D n S n / r D n c m represents the data packet transmitted by the device D n in the cluster m , where S n refers to the number of bits of the device D n data packet. The link energy consumption of all devices is:
e c D = m = 1 M D n G m p D n S n r D n c m
e c C = l = 1 L m = 1 M p c m , l D c m , l r c m , l
D c m , l = n = 1 N m S n , l is the total amount of data received by the cluster header device c m in the cluster and transmitted by the l t h RB. In the model, we ignore the receiving energy consumption of the cluster header equipment, because when the distance between the device and the base station is much larger than 10 meters, the energy consumption is mainly based on the total energy consumption [20]. Therefore, the total energy consumption of the system is E C s y s :
E C s y s = e c D + e c C
Since the LPWAN network is used within the cluster, we assume that K has been determined. We can simplify the problem to minimize the energy consumption of the convergence device. Minimizing energy consumption is equivalent to maximizing the number of bits transmitted per unit of energy consumption [20]. At the same time, we assume that each RB allocates equal power, the problem can be considered as maximizing the number of bits transmitted per unit RB consumption. Therefore, the issue of minimizing energy consumption can be described as (6) within T time.
min { M , G m , c m , L } E C s y s s . t .   ( a )   p D i = p t , D n C ( b )   p c m , l = p t ( c )   B t B max , t T ( d )   L p L q = φ   , p q ( e )   { min ( L p ) , min ( L p ) + 1 , , max ( L p ) } { L 1 L 2 L p 1 L p + 1 L D N } = φ , p D i
In the above formula, (a) (b) indicates that their transmission powers are set the same whether they are regular devices or cluster header devices;(c) indicates that the bandwidth resources of each subframe are limited, and M is the bandwidth of the cellular system; (d) (e) indicate that there are exclusivity and adjacency in the RB resources [29]. Table 1 shows the notations introduced in the system model.

3.2. Algorithm Design

Perhaps, using different methods of selecting a cluster header device differs the energy consumption in the intra-cluster communication. Additionally, different cluster heads and state of the channel of base stations will exert an impact on the amount of data carried by each unit RB in the communication between them. Therefore, the choice of the cluster head will be closely related to the two links. We regard the selection of the sink node device as a function:
y m = max x D k { 1 N m 1 x D n , x D k G m , n k x D n x D k + w h x D k B S }
Taking into account the state of the channel between the cluster header device and the base station, we apply the adaptive K-means algorithm to the cluster set. It is also required to select the cluster head for each cluster so that we can obtain the final location of them. In the equation, the constant w considers as the weight factor which affects the channel gains. In addition, it will consume the least energy when constant w equals 1 [19].
The device D n belongs to the cluster m , the value of r D n m equals 1, that is, D n G m , otherwise equals 0. The variation x D n represents the position of the device D n and y m represents the cluster head position of the m t h cluster.
According to the above analysis, the objective algorithm function is described as:
U = D n = 1 N m = 1 M r D n m x D n y m 2
In the same random access time slot, according to their density, the activated devices are clustered in a way such that the adjacent allocates in one cluster. When multiple active devices are included in a different cluster, the center coordinates are taken as the result of clustering, and the number of clusters is the required value. After that, to get clustered sets, we bring the values into the K-means algorithm.
Table 2 shows the pseudo-code. The clustering preprocessing is mainly to obtain the two parameters required for the K-means algorithm k and the initial clustering center C = { c m | m = 1 , 2 , , M } . Here we use the simplified Density-Based Spatial Clustering of Applications with Noise (DBSCAN) algorithm for clustering preprocessing. To get the parameters k and the initial clustering center C = { c m | m = 1 , 2 , , M } of the K-means algorithm. We process the small-area selection part by referring to the basic idea of the DBSCAN clustering algorithm, and the BSs according to its density clustering, the adjacent distance is divided into a cluster, the cluster contains multiple BSs, taking the center coordinates as the result of clustering, the number of groups is the desired value. Steps 1–16 of the Table 2 algorithm are the detailed procedures of DBSCAN. MinPts represents the minimum number of points in the adjacent domain of the core object, and E p s represents the radius of the field. We explored the value of MinPts and found that network performance was the best when MinPts = 2 . Due to the randomness of the distribution density, the capacity of the cluster may be too large. So the radius of the cluster and the number of devices in the cluster must be limited. To simplify the process, when the cluster radius exceeds the distance R 0 , or the number of cluster members exceeds Z , the left devices directly connect to the base station as a separate device.

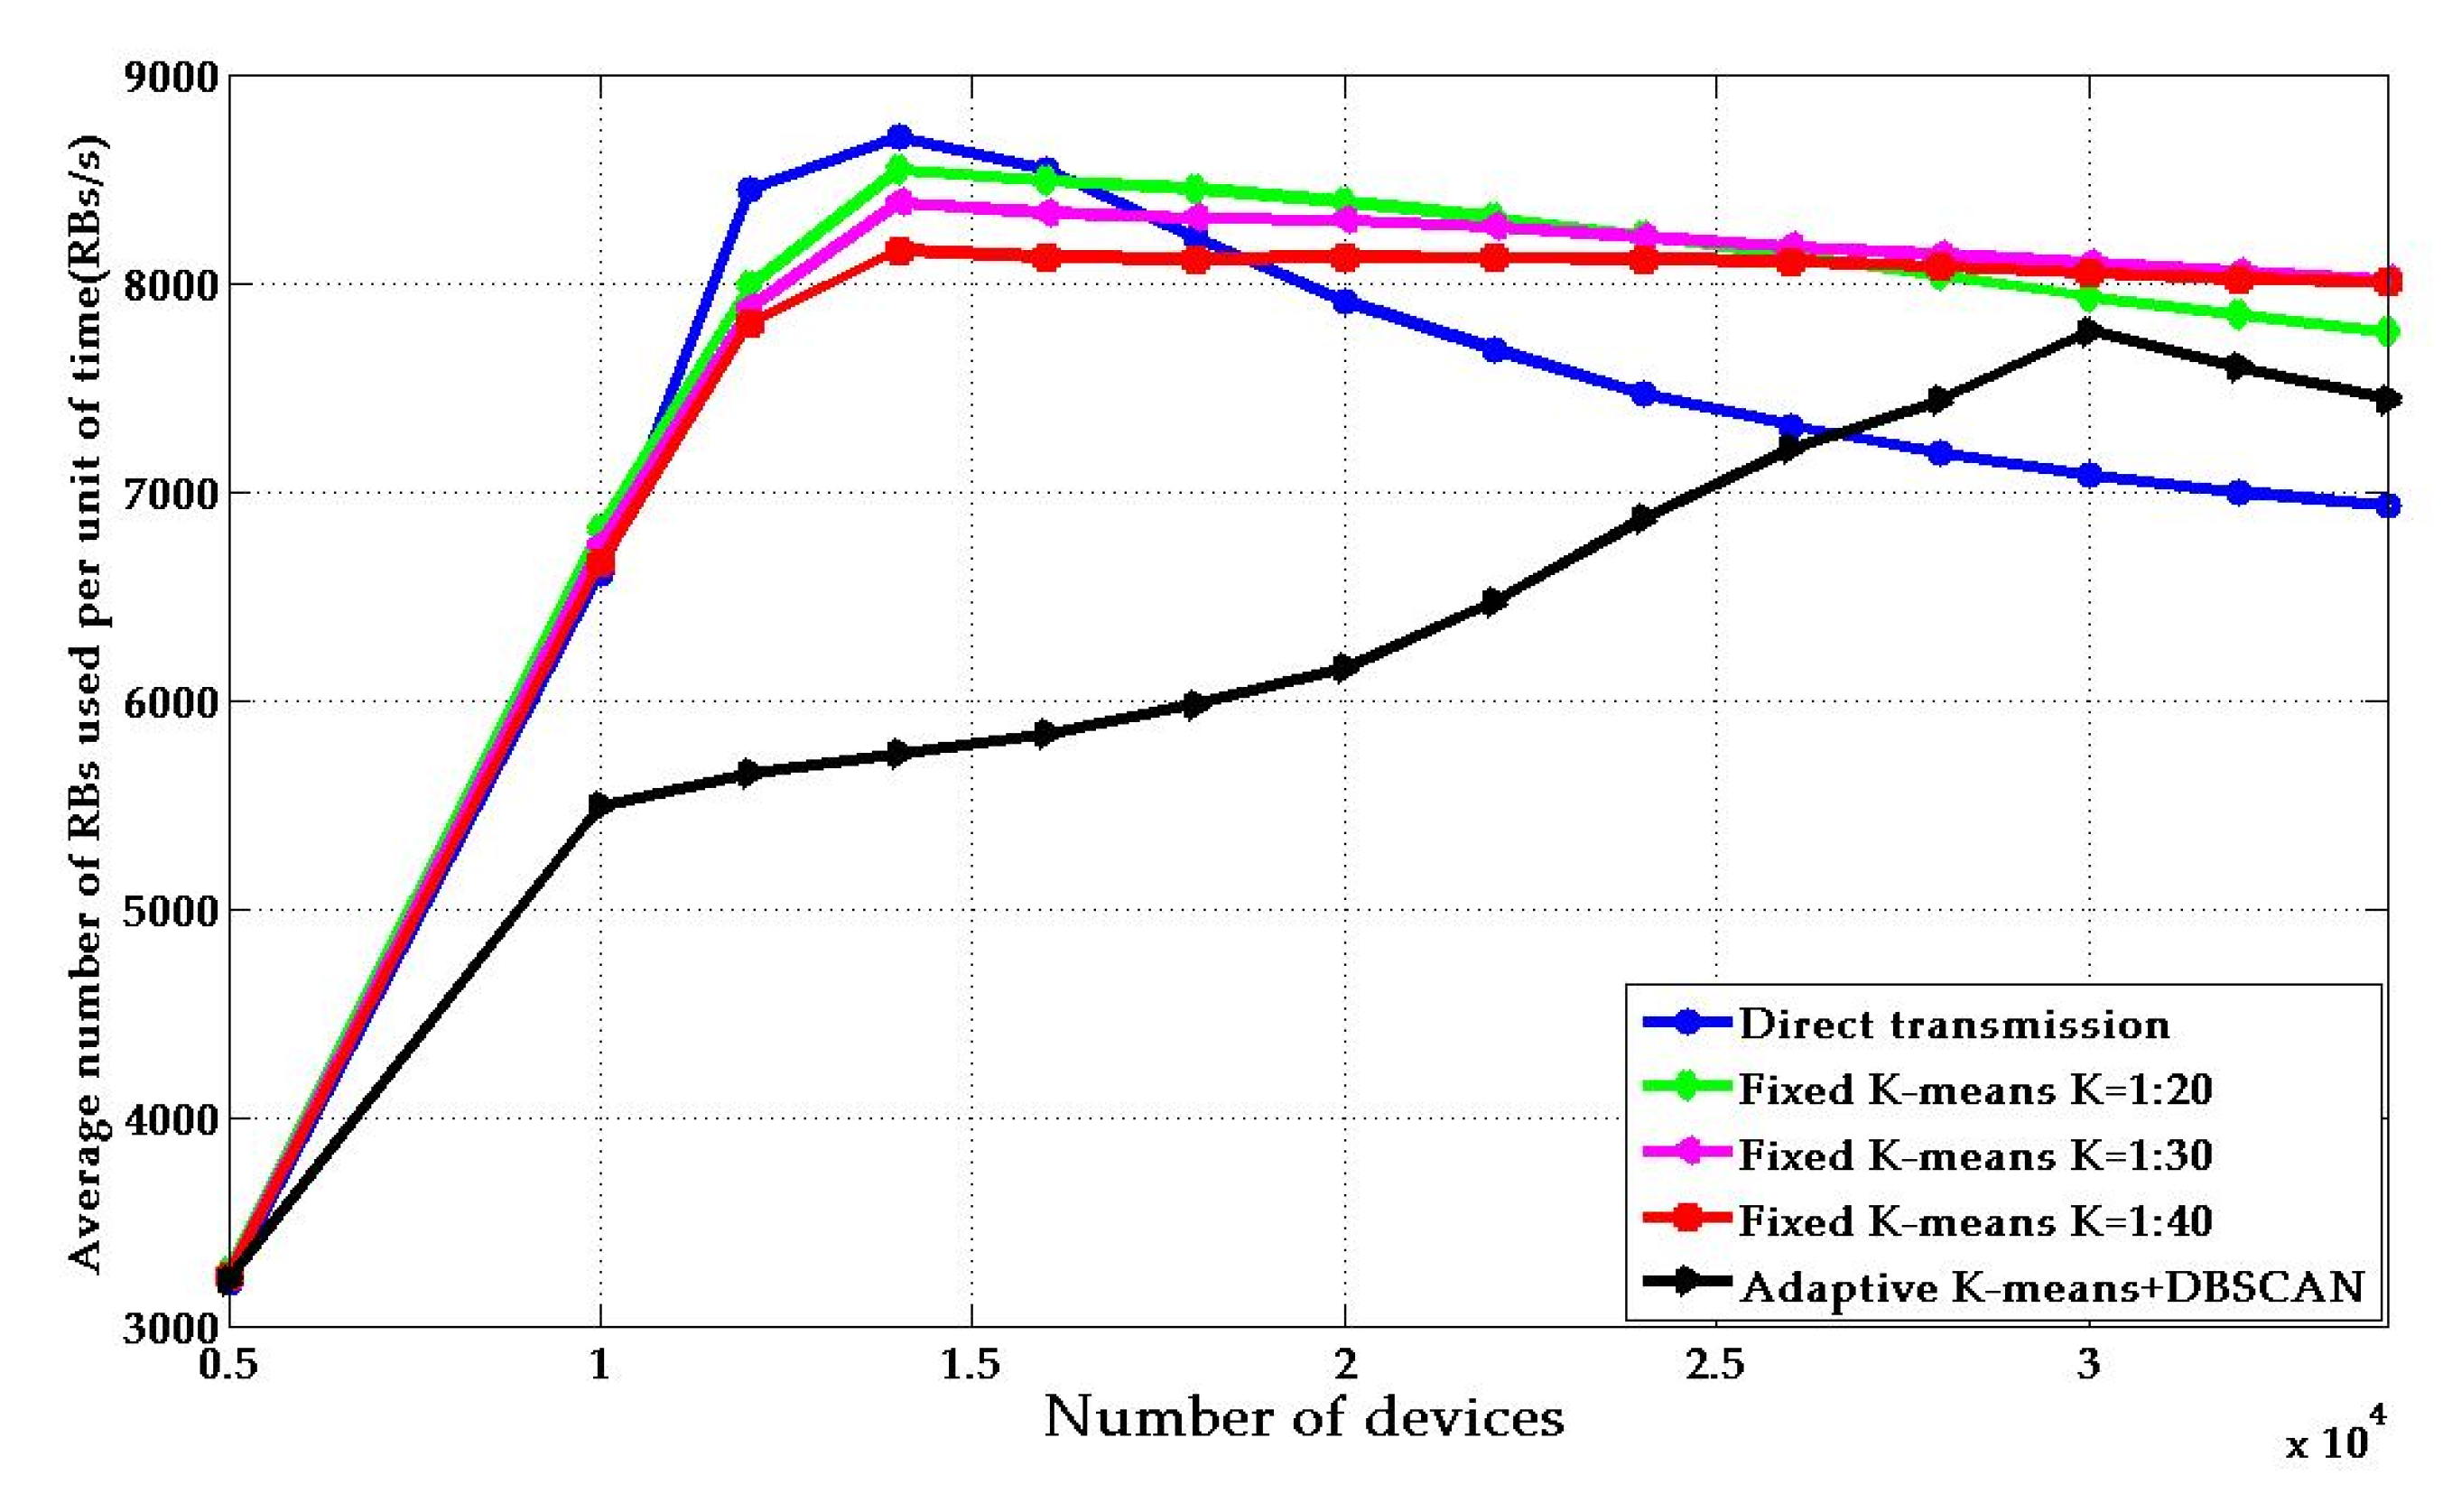
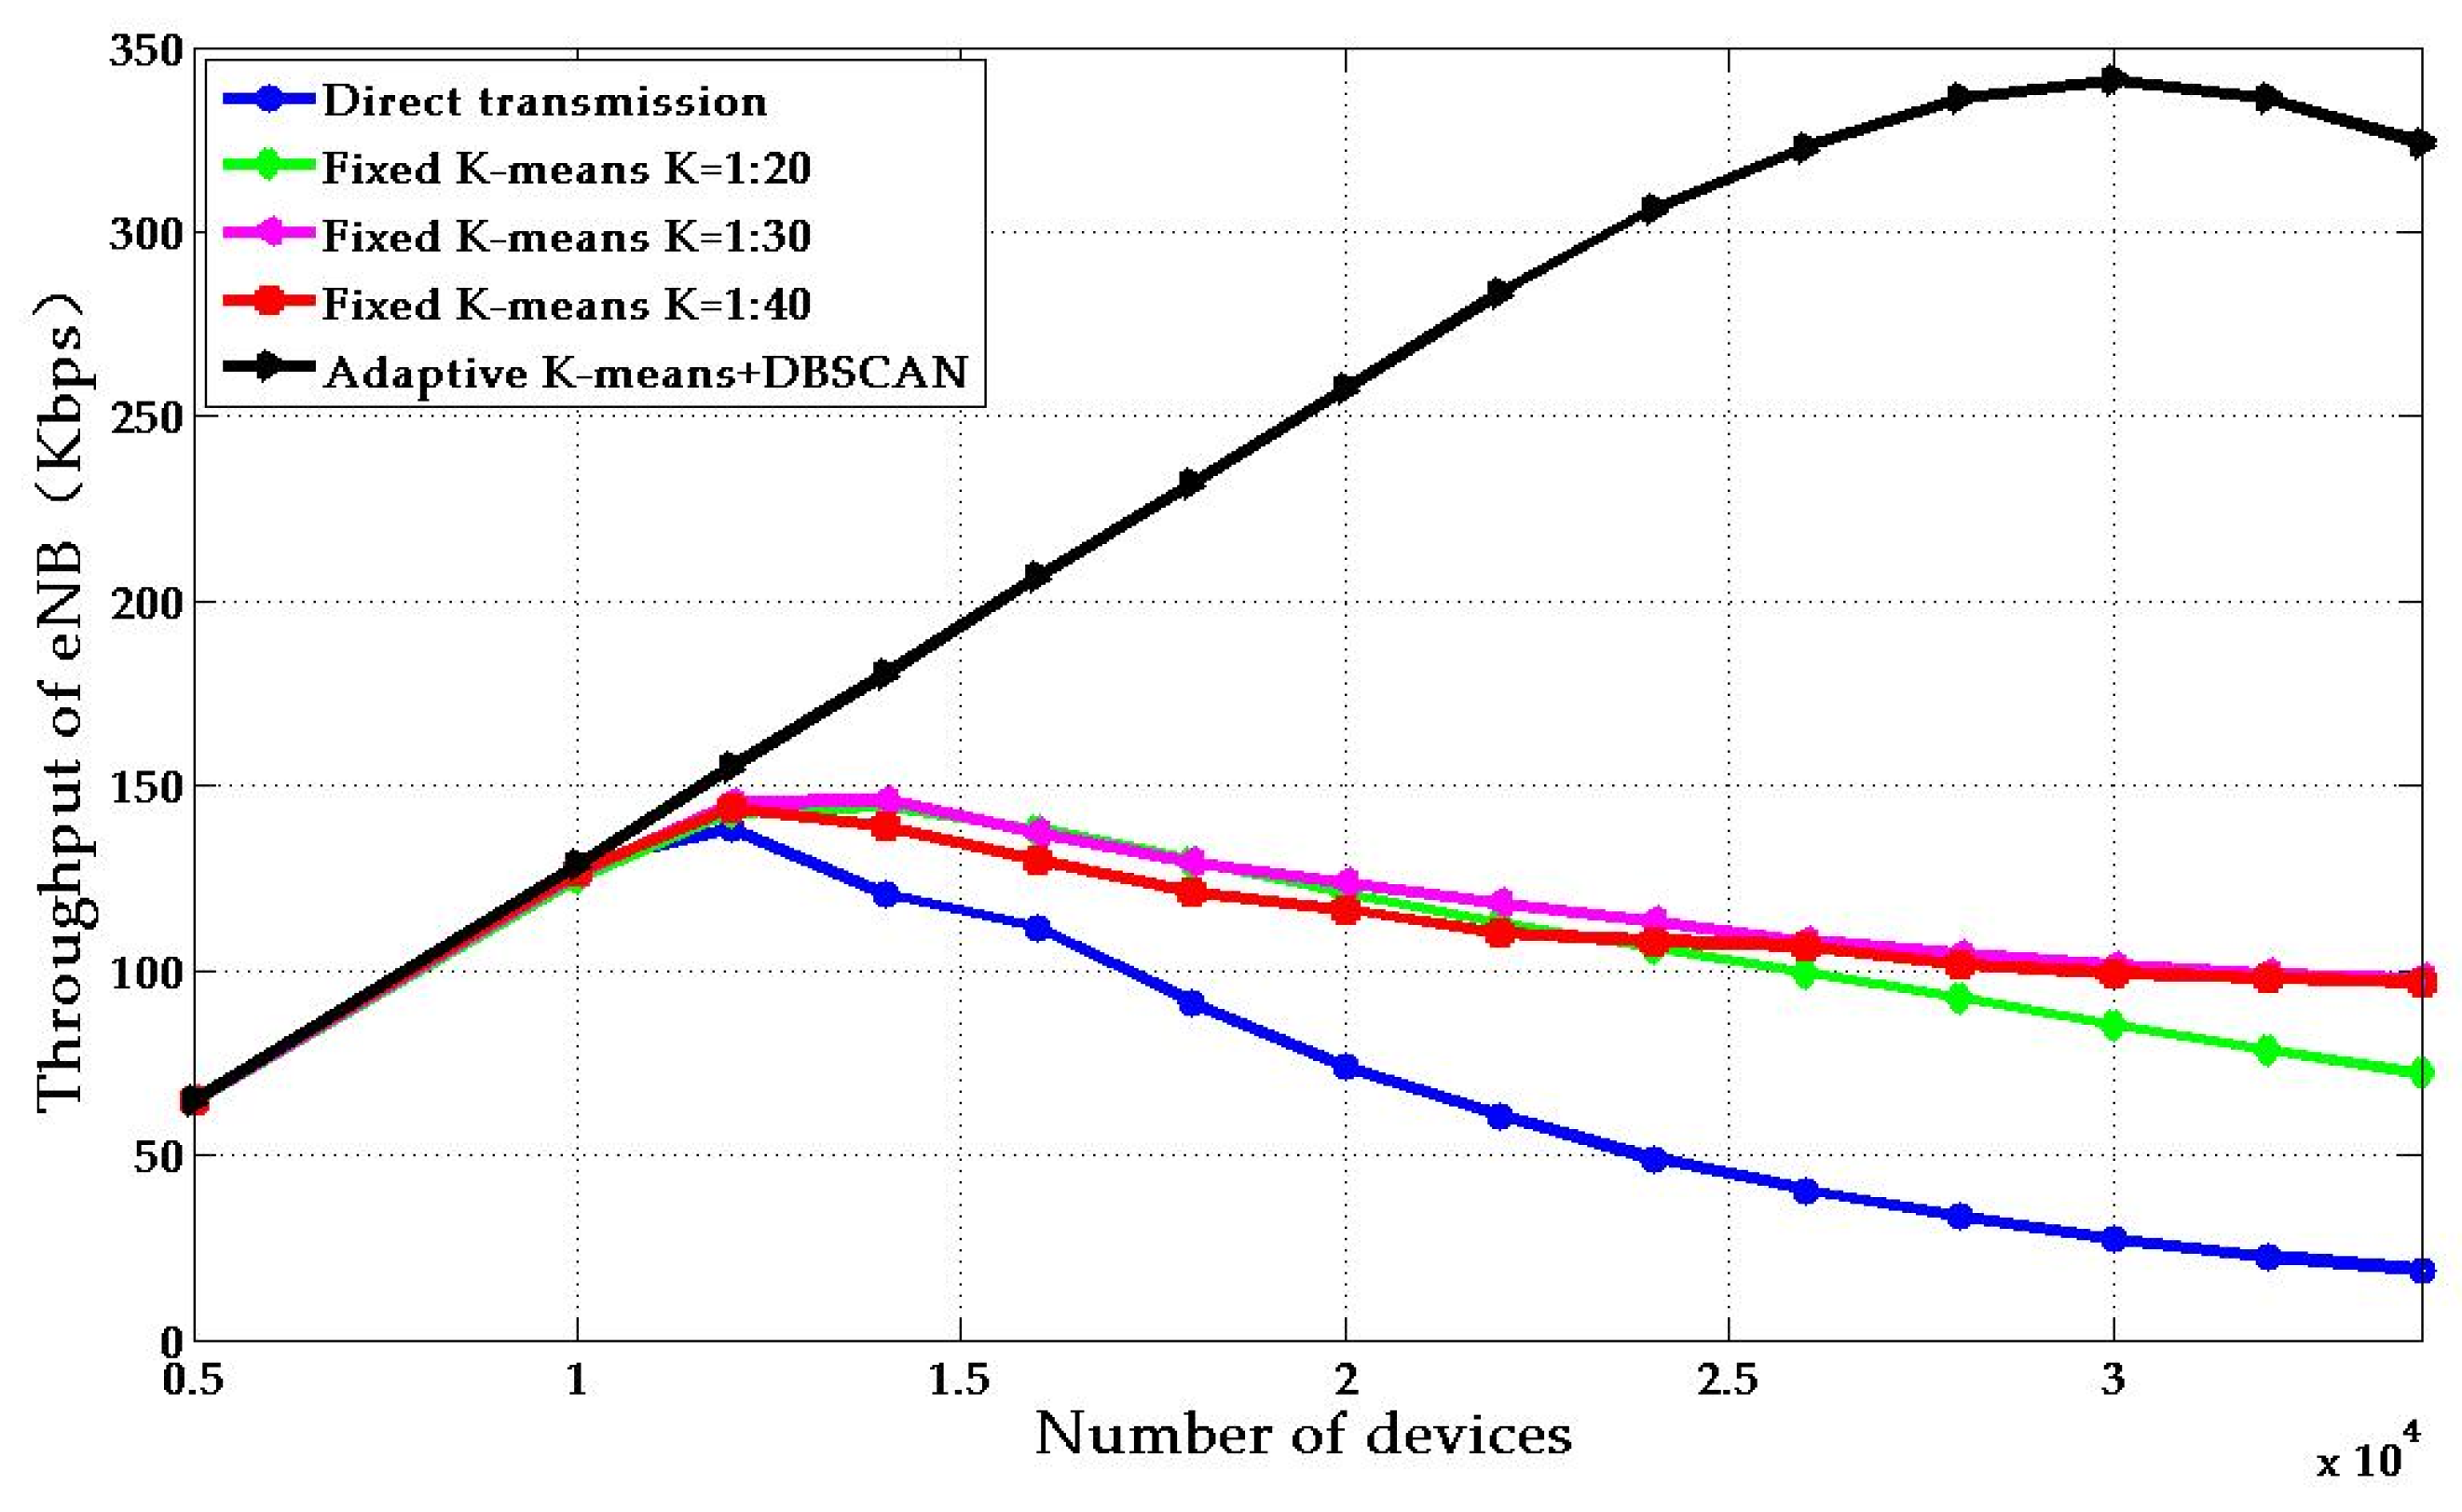
4. Numerical Results

4.1. Platform Analysis

In order to reflect the effect of the improved k-means algorithm of the proposed adaptive clustering on the energy efficiency, we first built an access simulation platform based on Matlab. The platform adopts the event-driven mechanism and object-oriented programming method, which makes the system structure clear, easy to organize and understand, maintainable, and can easily add new function modules and algorithms.
The access simulation platform is mainly divided into the initialization module, a simulation module, and an output module. The initialization module mainly includes the initialization of some simulation architecture such as scheduler, calendar table, and some real simulation entity. The simulation module is primarily based on the channel access and the packet transmission process of the LTE standard. The output module mainly includes the preservation, analysis and drawing operation of each simulation data.
As mentioned above, the simulation is based on event-driven and each event corresponds to the transmission of a message, which can be a signaling transmission or data transfer process during a random access process. All data are listed in the virtual queue and sorted according to the transmission time. In each emulation step, we remove the next message from the virtual line and handle the appropriate event. Events fall into two main categories. One category is the event that the device that does not connect to the base station initiates the access, then carries on the signaling transmission simulation action of the random access process. The other category is the device that has been connected to the base station. Then the event will upload data. This type of device performs data transmission simulation actions.

4.2. Parameters

The simulation scenario is a circular area with a radius of 1000 meter. The IoT devices are distributed evenly in the network. The data size of each device is generated according to the periodic escalation model in the GERAN business. Random access parameters are derived from literature [30,31]. The path loss model mainly considers the large-scale fading and uses the Friis propagation loss model [32]. Table 3 shows other simulation parameters [33,34,35,36].
In addition to the proposed algorithm, this paper also contrasts the simulation performance between the direct transmission scheme without algorithm and the K-means algorithm scheme with different proportion of cluster. At the same time, five performance metrics [37,38,39,40] of the system consider the collision probability of random access; the average transmitted data amount per unit RB, the average number of RBs transmitted per unit time, the access success probability and system throughput. Average transmitted data amount per unit RB is the pivotal performance metric of energy efficiency, and the average number of RBs transmitted per unit time indicates the utilization of the system wireless resource. From Figure 3, Figure 4, Figure 5, Figure 6 and Figure 7 we can observe:
As for the direct transmission scheme, the collision probability increases with the increase in the number of IoT devices. Especially when the number of devices is between 10,000 and 14,000, the probability of collision and the average number of using RB per unit time increase exponentially, and the average number of using RB per unit time saturate when the number of devices reaches 14000. This results in a sharp decrease in the access success probability and the average amount of data carried by unit RB. After that, with the increase of device number, the increasing trend of collision probability tends to be smooth, the average number of RBs used per unit of time decreases, so that the access success probability decreases and the average number of carrying data of unit RB tends to flatten.
Consequently, this shows that the energy efficiency of the system decreases with the increase of device number. In Figure 7, as the number of devices increases, the throughput of the system is first increased and then reduced when the number of devices is 12,000. This is because it was the optimal number of devices in the phase when the average number of RBs used per unit of time was sharply increased, and the average amount of data carried by unit RB was significantly reduced.
For the general K-means algorithm scheme [20,27], different proportion cluster header devices show different performance. From Figure 3, we can see that when the number of devices does not exceed 10,000, the collision probability of the K-means algorithm clustered by any proportion is higher than that of the direct transmission scheme. However, from Figure 5, the average number of using RB is more significant in unit time, which results in a relatively low amount of the access success probability and the average number of carrying data of unit RB.
In Figure 7, there is no significant reduction in the throughput of the K-means algorithm. With the increase in the number of devices greater than 10000, the superiority of the scheme emerges gradually. As shown in Figure 3, under the condition of same IoT device number, with a decrease of the proportion, the less the number of groups, the smaller the collision probability and the lower the average number of using RB in unit time. So, the access success probability and average transmitted data amount per unit RB are optimal at a ratio of 1:30 and the throughput performance is further optimized. The simulation results show that the K-means algorithm can indeed improve the efficiency and throughput performance of the system.
Compared with the optimal scale K-means algorithm, in our scheme, when the number of devices is between 10,000 and 22,000, we can observe that the collision probability tends to be stable and the average number of RBs used per unit of time increases gradually with the rise in device number. Also, it indicates that the system access capacity and resource utilization are not saturated. Therefore, the system can keep access success probability close to 100% and the average volume of data transmitted per unit increases steadily. As a result, the throughput increases linearly, which is different from the way that the K-means algorithm uses to alleviate the throughput decline. With the further increase in the number of devices greater than 22,000, the collision probability begins to increase and the average number of using RB per unit time is still growing. So the access success probability begins to decline, and the increase in throughput also tends to stabilize. When the number of devices achieves 30,000, the access success probability is still close to 90%, and the performance of the base station is up to 345 kbits. Besides, the average amount of data carried by unit RB tends to stabilize at 70 bits/RB. The two metrics for the K-means algorithm improved by adaptive clustering is 3.5 times that of the optimal K-means algorithm. Also, the energy efficiency of the system has grown significantly. With the increase in the number of devices, the performance degradation of random access and data transmission leads to deterioration of system performance.

5. Conclusions

We discussed the research direction of energy efficiency in cellular communication and summarized a concrete method for each direction. Then, Section 2 established a system model based on the random access process combined with the wireless resource block. Based on this model, with the cooperative relaying idea as the foundation, this paper proposed a distributed dynamic cluster-head selection and clustering scheme based on an improved K-means algorithm, and built a system simulation platform to simulate and analyze the proposed algorithm. The simulation results show that the proposed algorithm can significantly improve the efficiency of the system. At present, we have mainly considered the impact of the LTE-M cellular network used in out-of-cluster communication on system energy efficiency. In the next phase, we will determine the impact of the technology used in intra-cluster communication on system energy efficiency. Also, the clustering preprocessing algorithm used in the adaptive clustering algorithm is a DBSCAN algorithm used for the non-uniformity of device distribution density. However, as the number of devices further increases, the number of devices activated each time gradually increases, and the density tends to be uniform. At this point, the advantages of the algorithm are no longer reflected. Therefore, it is necessary to explore new algorithms to cope with the challenge of a larger number of devices in the future.

Author Contributions

All the authors contributed to the conception, design, and performance of the experiment, the analysis of the data and the writing of the paper. Y.Z., K.L. and H.Y. initiated and discussed the research problem; K.L. and H.Y. conceived and designed the scheme; Y.Z., K.L., and H.Y. performed the experiments and constructed the figures. Y.Z. and K.L. analyzed the data; K.L., Y.Z., X.X., H.Y., and L.H. wrote the paper.

Acknowledgments

The work presented in this paper was partially supported by the 2018 National Natural Science Foundation of China (Grant number 61871339).

Conflicts of Interest

The authors declare no conflict of interest. The founding sponsors had no role in the design of the study; in the collection, analyses, or interpretation of data; in the writing of the manuscript, and in the decision to publish the results.

Abbreviations

The following abbreviations are used in this manuscript:
IoTInternet of thing
MACMedia Access Control
OFDMAOrthogonal Frequency-Division Multiple Access
LPWANLow-Power Wide-Area Network
3GPP3rd Generation Partner Project
BSBase Station
LEACHLow-Energy Adaptive Clustering Hierarchy
D2DDevice-to-Device
MTCMachine-Type Communications
RANRadio Access Network
CSMA/CACarrier Sense Multiple Access/Collision Avoidance
RRCRadio Resource Control
PRACHPhysical Random Access Channel
C-RNTICell Radio Network Temporary ID
PDSCHPhysical Downlink Shared Channel
PDCCHPhysical Downlink Control Channel
PHICHPhysical HARQ Indication Channel
RARandom Access
PUSCHPhysical Uplink Shared Channel)
CCCHCommon Control Channel
PDUPacket Data Unit
LANLocal Area Networks
RBResource Block

References

  1. Cisco Systems, Inc. Cisco Visual Networking Index: Global Mobile Data Traffic Forecast Update, 2016–2021 White Pape. Available online: https://www.cisco.com/c/en/us/solutions/collateral/service-provider/visual-networking-index-vni/mobile-white-paper-c11-520862.html (accessed on 28 March 2017).
  2. Lazarescu, M.T. Design of a WSN Platform for Long-Term Environmental Monitoring for IoT Applications. IEEE J. Emerg. Sel. Top. Circuits Syst. 2013, 3, 45–54. [Google Scholar] [CrossRef] [Green Version]
  3. Madueño, G.C.; Nielsen, J.J.; Kim, D.M.; Pratas, N.K.; Stefanović, Č.; Popovski, P. Assessment of LTE Wireless Access for Monitoring of Energy Distribution in the Smart Grid. IEEE J. Sel. Areas Commun. 2016, 34, 675–688. [Google Scholar] [CrossRef]
  4. 3GPP TR 37.868. Technical Specification Group Radio Access Network: Study on RAN Improvements for Machine-type. In 3rd Generation Partnership Project; 3GPP: Valbonne, France, September 2011. [Google Scholar]
  5. Lien, S.Y.; Liau, T.H.; Kao, C.Y. Cooperative Access Class Barring for Machine-to-Machine Communications. IEEE Trans. Wirel. Commun. 2012, 11, 27–32. [Google Scholar] [CrossRef]
  6. ZTE. R2-104662: MTC Simulation Results with Specific Solutions, 3GPP, TSG RAN WG2 Meeting 71; ZTE: Shenzhen, China, August 2010. [Google Scholar]
  7. Lien, S.Y.; Chen, K.C.; Lin, Y. Toward ubiquitous massive accesses in 3GPP machine-to-machine communications. IEEE. Commun. Mag. 2011, 49, 66–74. [Google Scholar] [CrossRef]
  8. Heinzelman, W.R.; Chandrakasan, A.; Balakrishnan, H. Energy-efficient communication protocol for wireless microsensor networks. In Proceedings of the 33rd Annual Hawaii International Conference on System Sciences, Maui, HI, USA, 10 January 2000. [Google Scholar]
  9. Gangwar, B.; Bhosale, J.D.; Gangwar, N. An energy optimized path selection and dynamic Cluster head selection for Wireless Mesh Network. In Proceedings of the International Conference on Trends in Electronics and Informatics (ICEI), Tirunelveli, India, 11–12 May 2017. [Google Scholar]
  10. John, A.; Rajput, A.; Babu, K.V. Dynamic cluster head selection in wireless sensor network for Internet of Things applications. In Proceedings of the International Conference on Innovations in Electrical, Electronics, Instrumentation and Media Technology (ICEEIMT), Coimbatore, India, 3–4 February 2017. [Google Scholar]
  11. Mohapatra, A.D.; Sahoo, M.N.; Sangaiah, A.K. Distributed fault diagnosis with dynamic cluster-head and energy efficient dissemination model for smart city. Sustain. Cities Soc. 2018, 43, 624–634. [Google Scholar] [CrossRef]
  12. Jia, D.; Zhu, H.; Zou, S.; Hu, P. Dynamic Cluster Head Selection Method for Wireless Sensor Network. IEEE Sens. J. 2016, 15, 2746–2754. [Google Scholar] [CrossRef]
  13. Kalantari, M.; Ekbatanifard, G. An energy-aware dynamic cluster head selection mechanism for wireless sensor networks. In Proceedings of the IEEE International Systems Conference (SysCon), Montreal, QC, Canada, 1–8 April 2017. [Google Scholar]
  14. Song, Q.; Nuaymi, L.; Lagrange, X. Survey of radio resource management issues and proposals for energy-efficient cellular networks that will cover billions of machines. EURASIP J. Wirel. Commun. Netw. 2016, 1, 140. [Google Scholar] [CrossRef]
  15. Kim, R.Y. Snoop based group communication scheme in cellular Machine-to-Machine communications. In Proceedings of the IEEE International Conference on Information and Communication Technology Convergence (ICCT), Jeju, Korea, 17–19 November 2010. [Google Scholar]
  16. Tsiropoulou, E.E.; Mitsis, G.; Papavassiliou, S. Interest-aware energy collection & resource management in machine to machine communications. Ad Hoc Netw. 2018, 68, 48–57. [Google Scholar]
  17. Tsiropoulou, E.E.; Paruchuri, S.T.; Baras, J.S. Interest, energy and physical-aware coalition formation and resource allocation in smart IoT applications. In Proceedings of the 51st Annual Conference on Information Sciences and Systems (CISS), Baltimore, MD, USA, 1–6 April 2017. [Google Scholar]
  18. Katsinis, G.; Tsiropoulou, E.E.; Papavassiliou, S. Joint Resource Block and Power Allocation for Interference Management in Device to Device Underlay Cellular Networks: A Game Theoretic Approach. Mob. Netw. Appl. 2017, 22, 539–551. [Google Scholar] [CrossRef]
  19. Tu, C.Y.; Ho, C.Y.; Huang, C.Y. Energy-Efficient Algorithms and Evaluations for Massive Access Management in Cellular Based Machine to Machine Communications. In Proceedings of the IEEE Vehicular Technology Conference (VTC Fall), San Francisco, CA, USA, 5–8 September 2011. [Google Scholar]
  20. Ho, C.Y.; Huang, C.Y. Energy-Saving Massive Access Control and Resource Allocation Schemes for M2M Communications in OFDMA Cellular Networks. IEEE Wirel. Commun. Lett. 2012, 3, 209–212. [Google Scholar] [CrossRef]
  21. Azari, A.; Miao, G. Energy-efficient MAC for cellular-based M2M communications. In Proceedings of the 2nd IEEE Global Conference on Signal and Information Processing, Atlanta, GA, USA, 3–5 December 2014; pp. 128–132. [Google Scholar]
  22. Guan, Z.; Li, J.; Wu, L.; Zhang, Y.; Wu, J.; Du, X. Achieving Efficient and Secure Data Acquisition for Cloud-supported Internet of Things in Smart Grid. IEEE Int. Things J. 2017, 4, 1934–1944. [Google Scholar] [CrossRef]
  23. Du, X.; Guizani, M.; Xiao, Y.; Chen, H.H. A Routing-Driven Elliptic Curve Cryptography based Key Management Scheme for Heterogeneous Sensor Networks. IEEE Trans. Wirel. Commun. 2009, 8, 1223–1229. [Google Scholar] [CrossRef]
  24. Cheng, Y.; Fu, X.; Du, X.; Luo, B.; Guizani, M. A lightweight live memory forensic approach based on hardware virtualization. Inf. Sci. 2017, 379, 23–41. [Google Scholar] [CrossRef]
  25. Hasan, M.; Hossain, E.; Niyato, D. Random access for machine-to-machine communication in LTE-advanced networks: Issues and approaches. IEEE Commun. Mag. 2013, 51, 86–93. [Google Scholar] [CrossRef]
  26. Dawaliby, S.; Bradai, A.; Pousset, Y. In depth performance evaluation of LTE-M for M2M communications. In Proceedings of the IEEE International Conference on Wireless and Mobile Computing, Networking and Communications (WiMob), New York, NY, USA, 1–8 May 2016. [Google Scholar]
  27. Zhang, X.; Wang, Y.; Wang, R. Group-based joint signaling and data resource allocation in MTC-underlaid cellular networks. Sci. China Inf. Sci. 2017, 60, 304. [Google Scholar] [CrossRef]
  28. Kim, D.M.; Sorensen, R.B.; Mahmood, K.O.; Osterbo, N.; Zanella, A.; Popovski, P. Data Aggregation and Packet Bundling of Uplink Small Packets for Monitoring Applications in LTE. IEEE Netw. 2017, 31, 32–38. [Google Scholar] [CrossRef] [Green Version]
  29. Dhillon, H.S.; Huang, H.C.; Viswanathan, H.; Valenzuela, R.A. On resource allocation for machine-to-machine (M2M) communications in cellular networks. In Proceedings of the 2012 IEEE Globecom Workshops (GLOBECOM), Anaheim, CA, USA, 3–7 December 2012. [Google Scholar]
  30. Polyanskiy, Y.; Poor, H.V.; Verdu, S. Channel Coding Rate in the Finite Blocklength Regime. IEEE Trans. Inf. Theory 2010, 56, 2307–2359. [Google Scholar] [CrossRef] [Green Version]
  31. Wei, C.H.; Bianchi, G.; Cheng, R.G. Modeling and Analysis of Random Access Channels With Bursty Arrivals in OFDMA Wireless Networks. IEEE Trans. Wirel. Commun. 2015, 14, 1940–1953. [Google Scholar] [CrossRef]
  32. Petrioli, C.; Nati, M.; Casari, P. ALBA-R: Load-Balancing Geographic Routing Around Connectivity Holes in Wireless Sensor Networks. IEEE Trans. Parallel Distrib. Syst. 2014, 25, 529–539. [Google Scholar] [CrossRef]
  33. Ferdouse, L.; Anpalagan, A.; Misra, S. Congestion and overload control techniques in massive M2M systems: A survey. Trans. Emerg. Telecommun. Technol. 2017, 28, 21–37. [Google Scholar] [CrossRef]
  34. Rico-Alvarino, A.; Vajapeyam, M.; Xu, H. An overview of 3GPP enhancements on machine to machine communications. IEEE Commun. Mag. 2016, 54, 14–21. [Google Scholar] [CrossRef]
  35. Stefanovic, C.; Popovski, P. ALOHA Random Access that Operates as a Rateless Code. IEEE Trans. Commun. 2013, 61, 4653–4662. [Google Scholar] [CrossRef] [Green Version]
  36. Yang, X.; Venkata, K.R.; Bo, S.; Du, X.; Fei, H.; Michael, G. A survey of key management schemes in wireless sensor networks. Comput. Commun. 2007, 30, 2314–2341. [Google Scholar]
  37. Du, X.; Chen, H.H. Security in Wireless Sensor Networks. IEEE Wirel. Commun. Mag. 2008, 15, 60–66. [Google Scholar]
  38. Du, X.; Xiao, Y.; Guizani, M.; Chen, H.H. An effective key management scheme for heterogeneous sensor networks. Ad Hoc Netw. 2007, 5, 24–34. [Google Scholar] [CrossRef]
  39. Zhao, Y.; Huang, L.; Chi, T.Y. Capacity analysis for multiple-input multiple-output relay system in a low-rank line-of-sight environment. IET Commun. 2012, 6, 668–675. [Google Scholar] [CrossRef]
  40. Andrade, T.P.C.d.; Astudillo, C.A.; Sekijima, L.R.; da Fonseca, N.L.S. The Random Access Procedure in Long Term Evolution Networks for the Internet of Things. IEEE Commun. Mag. 2017, 55, 124–131. [Google Scholar] [CrossRef]
Figure 1. Signaling interaction and data transmission between device and base station.
Applsci 09 00132 g001
Figure 2. Adaptive clustering diagram range from the Nth frame to the N+1th frame.
Applsci 09 00132 g002
Figure 3. Collision probability.
Applsci 09 00132 g003
Figure 4. Access success probability.
Applsci 09 00132 g004
Figure 5. Average number of Resource Block (RB)s used per unit of time.
Applsci 09 00132 g005
Figure 6. Average transmitted data amount per unit RB.
Applsci 09 00132 g006
Figure 7. The throughput of the base station.
Applsci 09 00132 g007
Table 1. Notations introduced in system model.
ParameterNotation
Bandwidth B D
Channel gain h D n c m
Normal Device D n ( n = 1 , N )
The cluster set G m
The cluster head of the m t h cluster c m
Number of devices in the cell C = { c m | m = 1 , 2 , , M }
The transmission power of the Machine Type Communications (MTC) device D n p D n
The transmission power of the cluster header device c m on l t h Resource Block (RB) p c m , l
The number of bits of the device D n data packet S n
The total amount of data received by the cluster header device c m in the cluster and transmitted by the l t h RB D c m , l
The link data rates of the device and the cluster header device r D n c m
The link data rates of the cluster header device and the base station r c m , l
The total energy consumption E C s y s
Table 2. The pseudo-code of adaptive K-means algorithm.
Algorithm 1. Adaptive K-means Algorithm
1: Input: MinPts = 2 E p s X M = 1 r n m = 0 ε ( ε is arbitrarily small)
2: Mark all objects in data set X as unprocessed
3: for (each object p in data set X ) do
4:  if ( p is clustered or marked as noise)
5:   continue;
6:  else if ( N E p s ( p ) < M i n P t s )
7:   Mark object p as the border point;
8:   else
9:   Mark object p as the core point, Create a cluster C m , Add all the object s in the N E p s ( p ) to C , M + + ;
10:   for (Unprocessed object q in the N E p s ( p ) )
11:    if ( N E p s ( q ) < M i n P t s )
12:    Add all the Objects in the N E p s ( p ) which do not belong to any cluster to C ;
13:   end for
14:   end if
15:  end if
16: end for
17: Get the position of the center of the initial cluster C = { c m | m = 1 , 2 , , M } ;
18: Calculate y m by the formula (7);
19: Calculate U by the formula (8), U mark as U o l d m , n , g , 1 m M , 1 n N , 1 g M ;
20: if ( x n y m x n y g )
21:   r n m = 1 , the new value U mark as U n e w ;
22:  if ( | U n e w U o l d | ε )
23:  return step 26;
24:  else
25:  return step 18;
26:   if ( x n y m > R 0 )
27:   move the object n out of the cluster m , M + + , c M = D n ;
28:   else
29:   end the algorithm;
30:   end if
31:  end if
32: end if
33: Output B = { B m | m = 1 , 2 , , M } , C = { c m | m = 1 , 2 , , M }
Table 3. List of main simulation parameters.
ParameterValue
Traffic distribution parameter
Cell radius1000 m
Number of devicesVariation (5000–30000)
Number of aggregation devicesVariation (depends on the algorithm)
Group arrival rate of the device1/10
Grouping modelPeriodic reporting of business models
PHY parameter
Working frequency900 MHz
Transmit power of the base station30 dBm
Transmit power of the device23 dBm
The power density of thermal noise−121.45 dBm/Hz
Target bit error rate of AMC 5 × 10 4
MAC parameter
Number of preambles54
Backoff time20 subframe
Maximum number of retransmissions10
System parameter
System bandwidth1.4 MHz
Simulation time 10 × 10 3 subframe (10 s)
Algorithm parameter
The maximum number of devices that trigger the algorithm27
Maximum cluster radius300 m

