Article

Investigation of Flame Evolution in Heavy Oil Boiler Bench Using High-Speed Planar Laser-Induced Fluorescence Imaging

1
National Key Laboratory of Science and Technology on Tunable Laser, Harbin Institute of Technology, Harbin 150000, China
2
Institute of Opt-Electronics, Harbin Institute of Technology, Harbin 150000, China
3
School of Energy and Power Engineering, Shandong University, Jinan 250000, China
*
Authors to whom correspondence should be addressed.
Appl. Sci. 2018, 8(9), 1691; https://doi.org/10.3390/app8091691
Submission received: 6 September 2018 / Revised: 16 September 2018 / Accepted: 17 September 2018 / Published: 18 September 2018
(This article belongs to the Section Optics and Lasers)

Abstract

:
Over recent years, much attention has been paid to the performance evaluation of industrial-type burners. The ignition and stable combustion process are of great significance in assessing the quality of burner. The planar laser-induced fluorescence (PLIF) technique can be applied to heavy oil boilers, extending this technique to engineering applications. Considering the complex environment of the bench test, measures such as temperature control and moisture proofing are made to improve the possibility of detection using PLIF. In this paper, an experimental investigation of flame growth following ignition is reported. A wrinkled structure could be observed from the configuration of the ignition flame; its trajectory will be depicted. The results showed that the wrinkled structure developed downward, i.e., by deviation from the direction of the airflow. The displacement velocity of the flame was used to describe the combustion rate. Good agreement was obtained for the flame shapes of both forced ignition and autoignition. In addition, the center of combustion deviated from the center of boiler, possibly due to some irregularity in the burner’s assembly which was critical to the design of the combustion chamber.

1. Introduction

In recent years, the planar laser-induced fluorescence (PLIF) technique, a modern optical diagnostic method with high spatial and temporal resolution, has developed rapidly in the field of combustion diagnosis [1,2,3]. Many experimental results can be found in the literature regarding both qualitative characterizations of flame structure and quantitative measurements of interesting features, such as concentration, temperature, and velocity [4,5,6,7,8]. However, most successful applications are confined to the ideal environment of the laboratory, regardless of the impact of the external environment, i.e., variables such as temperature, humidity, and vibration on the PLIF system. Besides, the subjects are mostly laboratory flames [9,10,11], for example Bunsen flames. Small flame scales and an ideal environment provide convenience for the study of the mechanism, but if a harsh experiment environment and larger flame scale exist, this poses a great challenge to the PLIF system. A high-speed OH-PLIF system is capable of imaging flame structures and demonstrating dynamic evolution [12,13], but when faced with bench tests, terrible problems come with it. Due to low laser energy output and the high requirements of the working environment, the commercial high-speed PLIF system cannot be applied to the complex environment of the bench test. For instance, in the experimental factory, the temperature fluctuates widely, and the humidity may reach 90%, greatly weakening the detection capability of the high-speed OH-PLIF system, thus limiting the engineering application of the PLIF technique.
Actual industrial combustors, such as boilers and gas turbines, operate in extremely complex conditions. To our knowledge, in view of the performance evaluation of industrial-type burners, at present, limited exhaust pollutants and temperature have been investigated [14,15]. However, flame growth during the combustion process is also important for assessing the quality of the burner. In order to improve the environmental adaptability of PLIF systems, and extend this technique to engineering applications, the main task is to solve the problem of temperature and humidity. Modular design is of great significance. The laser system needs special treatment, i.e., in which temperature control and moisture proofing have been employed. The specific measures will be discussed in the experiment details section.
In the context of energy saving and emissions reduction, heavy oil, which has the advantages of abundant reserves and low costs, has been the focus of much attention [16]. Oxy-fuel combustion of heavy oil was applied to this experiment in order to reduce carbon dioxide emissions while offering a more efficient use of heavy oil resources [17]. However, at present, oxy-fuel technology faces huge safety issues due to both its enlarged flammability range and enhanced explosion severity with respect to air, which limits the practical application of this technology [18]. The heavy oil boiler, an industrial-type burner, operates with an oil spray involving a two-phase combustion process. The physical processes such as spray atomisation and transport, turbulence, and chemistry interact with each other, which makes it hard to predict combustion state by numerical simulations [19,20]. The combustion characteristics of heavy oil under different conditions, including temperature and pollutant emission characteristics, have been investigated [17]. However, experimental studies on the flame structure of heavy oil combustion are still rare in the literature. The process of flame evolution is significant in the study of combustion characteristics and the evaluation of the performance of the burner. For this reason, it is imperative to describe the two-dimensional flame structure by OH-PLIF images.
The aim of this paper is to report the successful application of PLIF technique to an industrial burner, which is beneficial to promoting development of the PLIF technique, and solving some engineering problems. In this experiment, applying a 400 Hz OH-PLIF, the evolution of the flame structure during the ignition process is investigated. A deep understanding of the ignition process helps to understand the entire combustion process. Meanwhile, by means of different laser sheet positions, the main burn area in the whole combustion chamber is demonstrated. It is of great significance in the assessment of heavy oil burner performance.

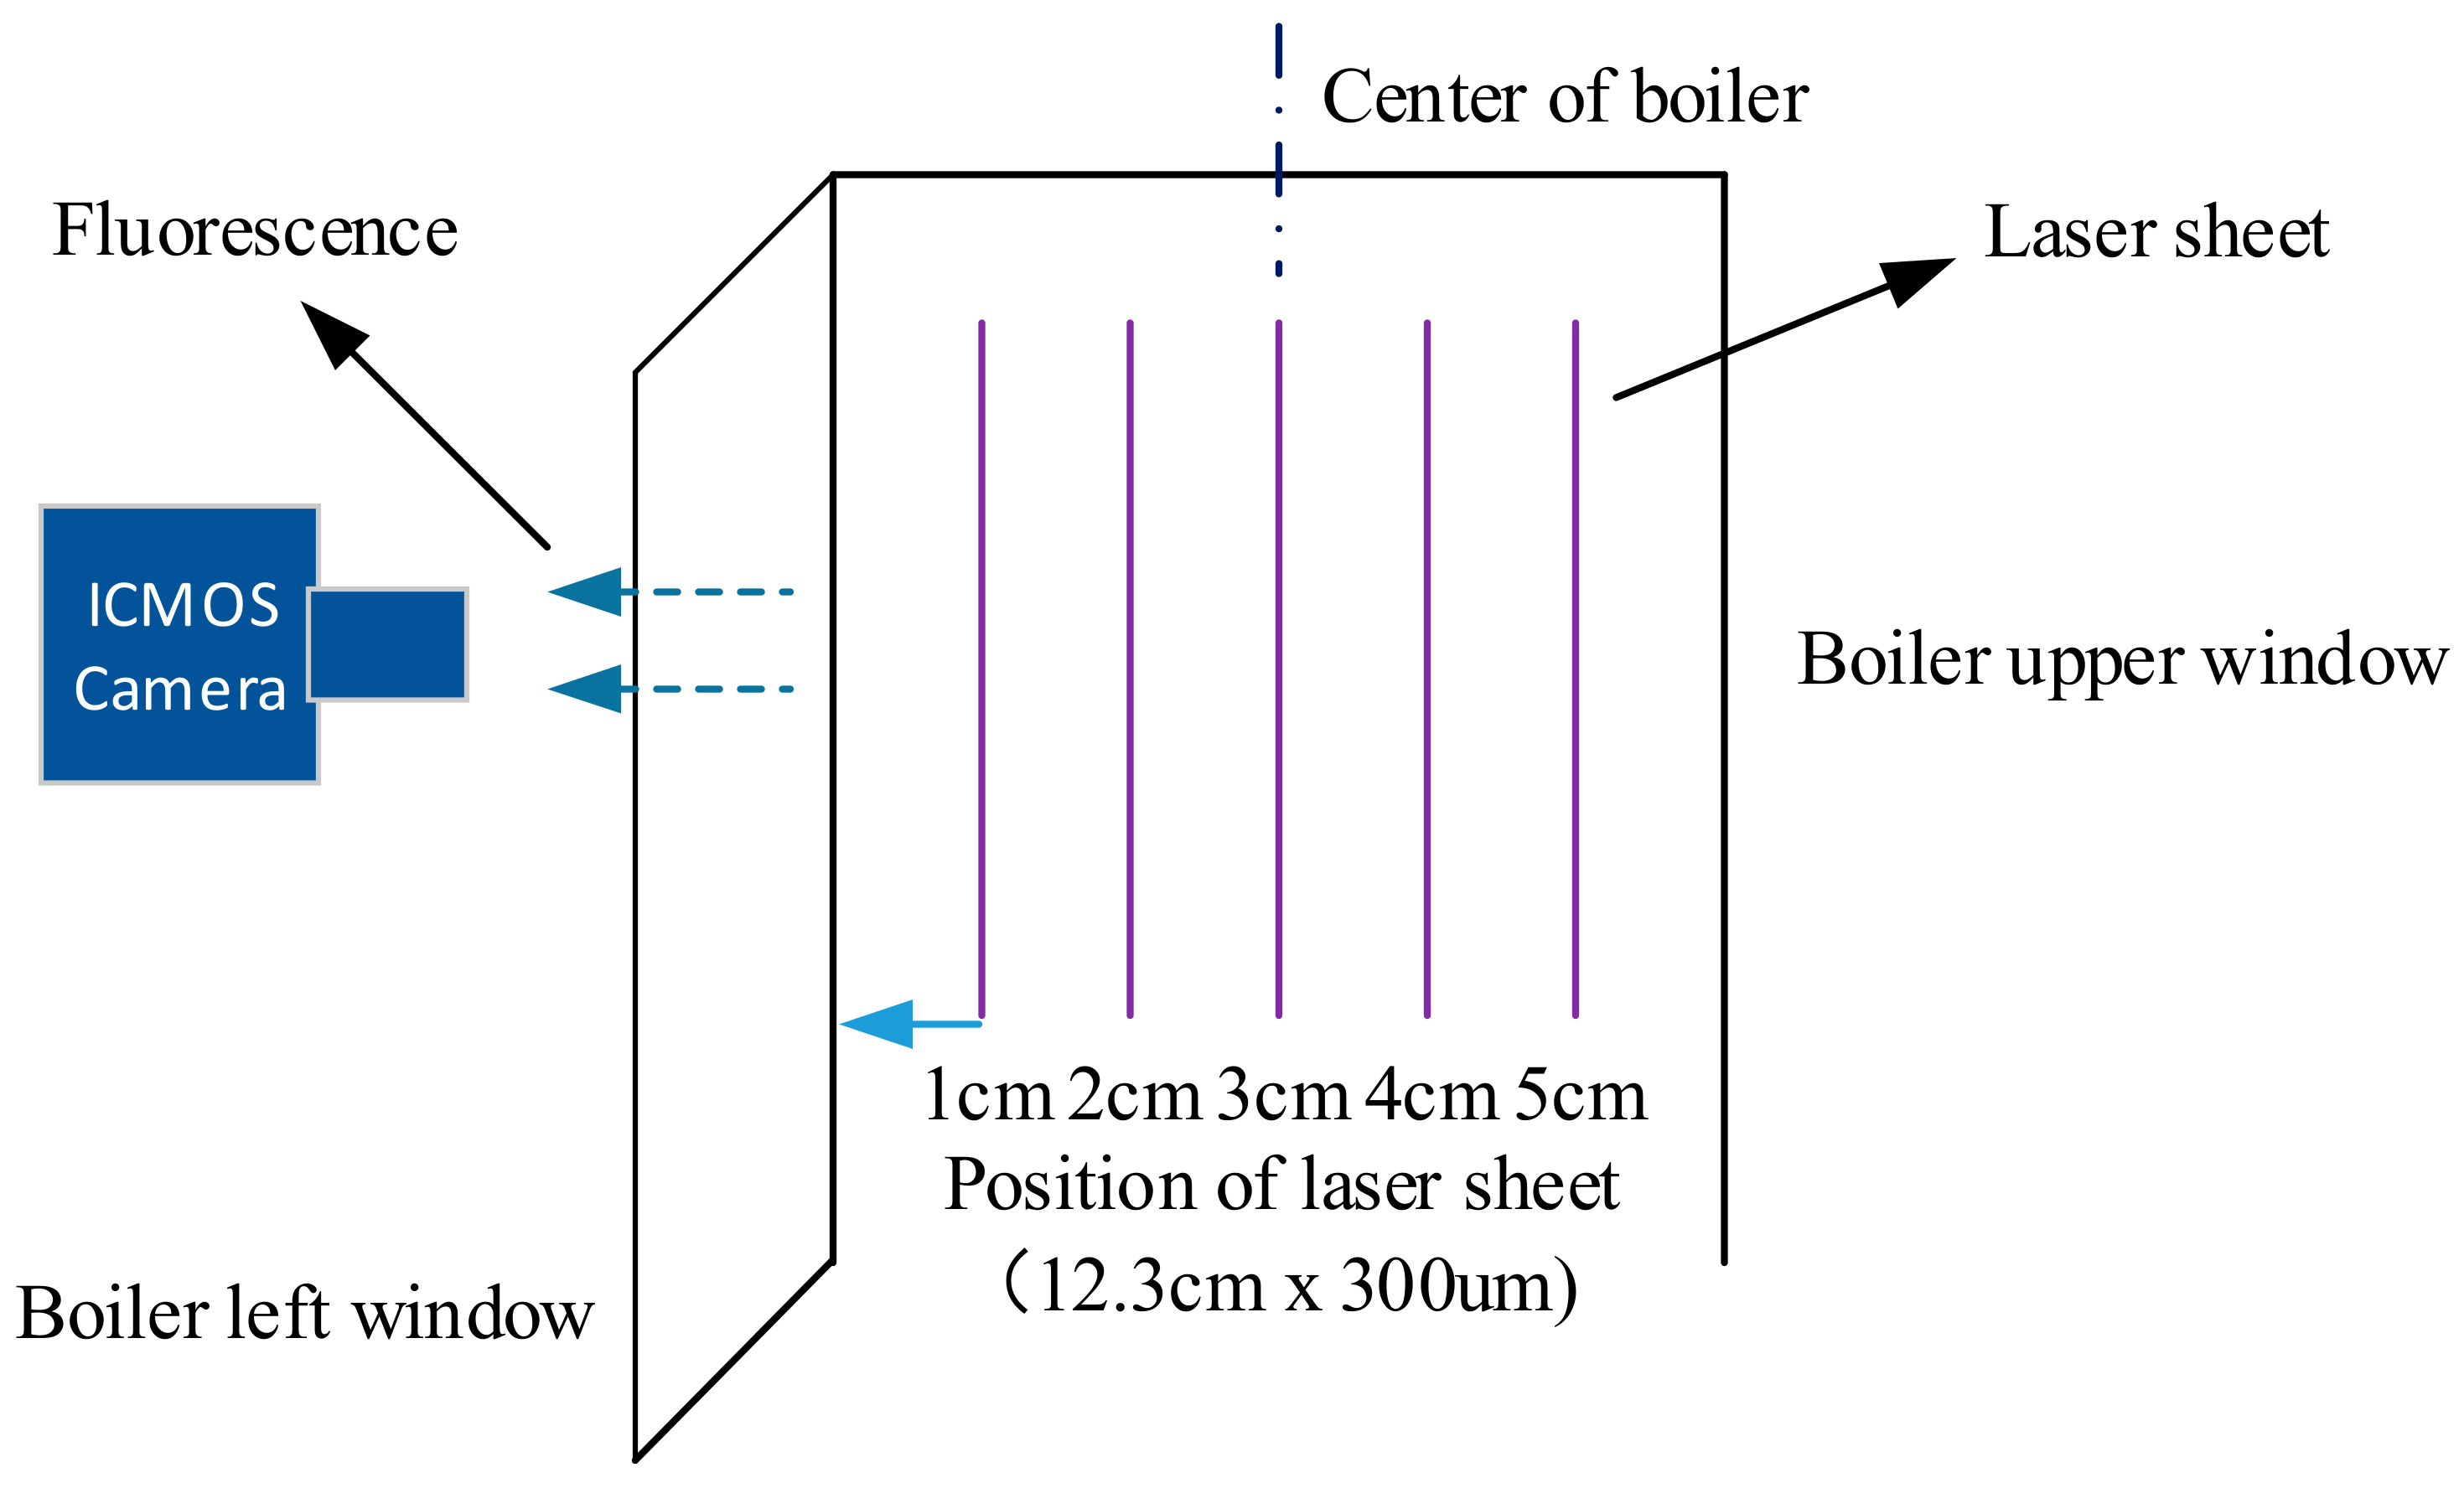
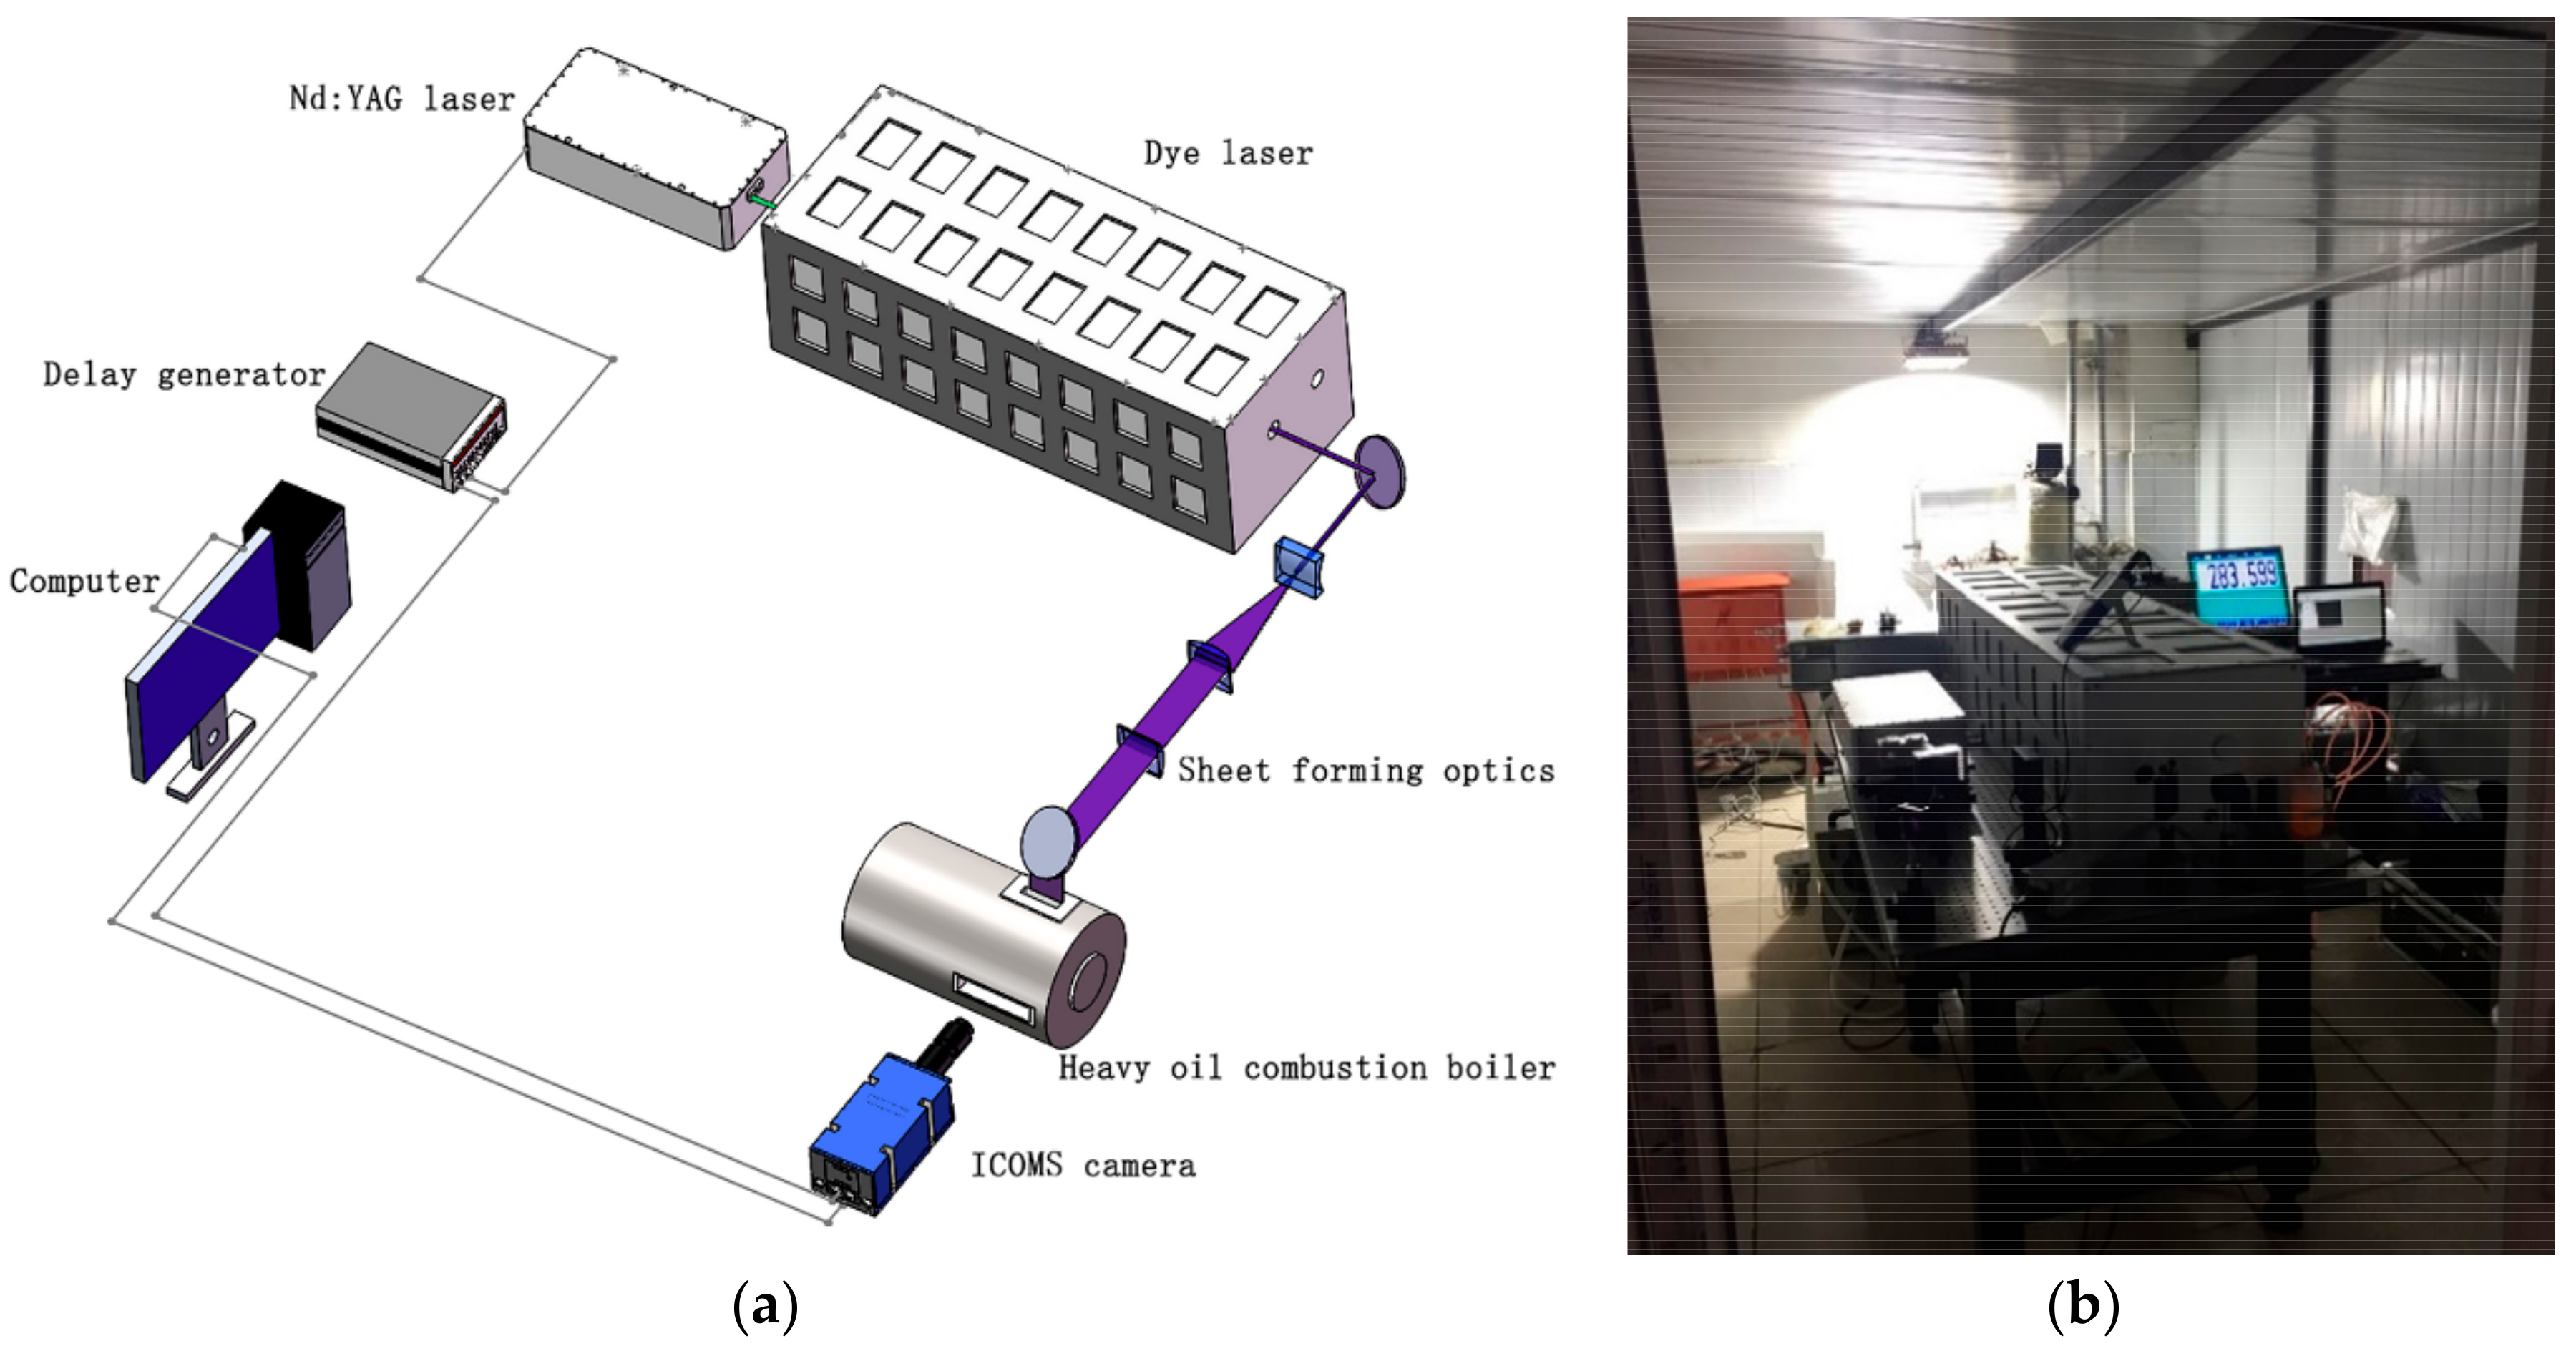
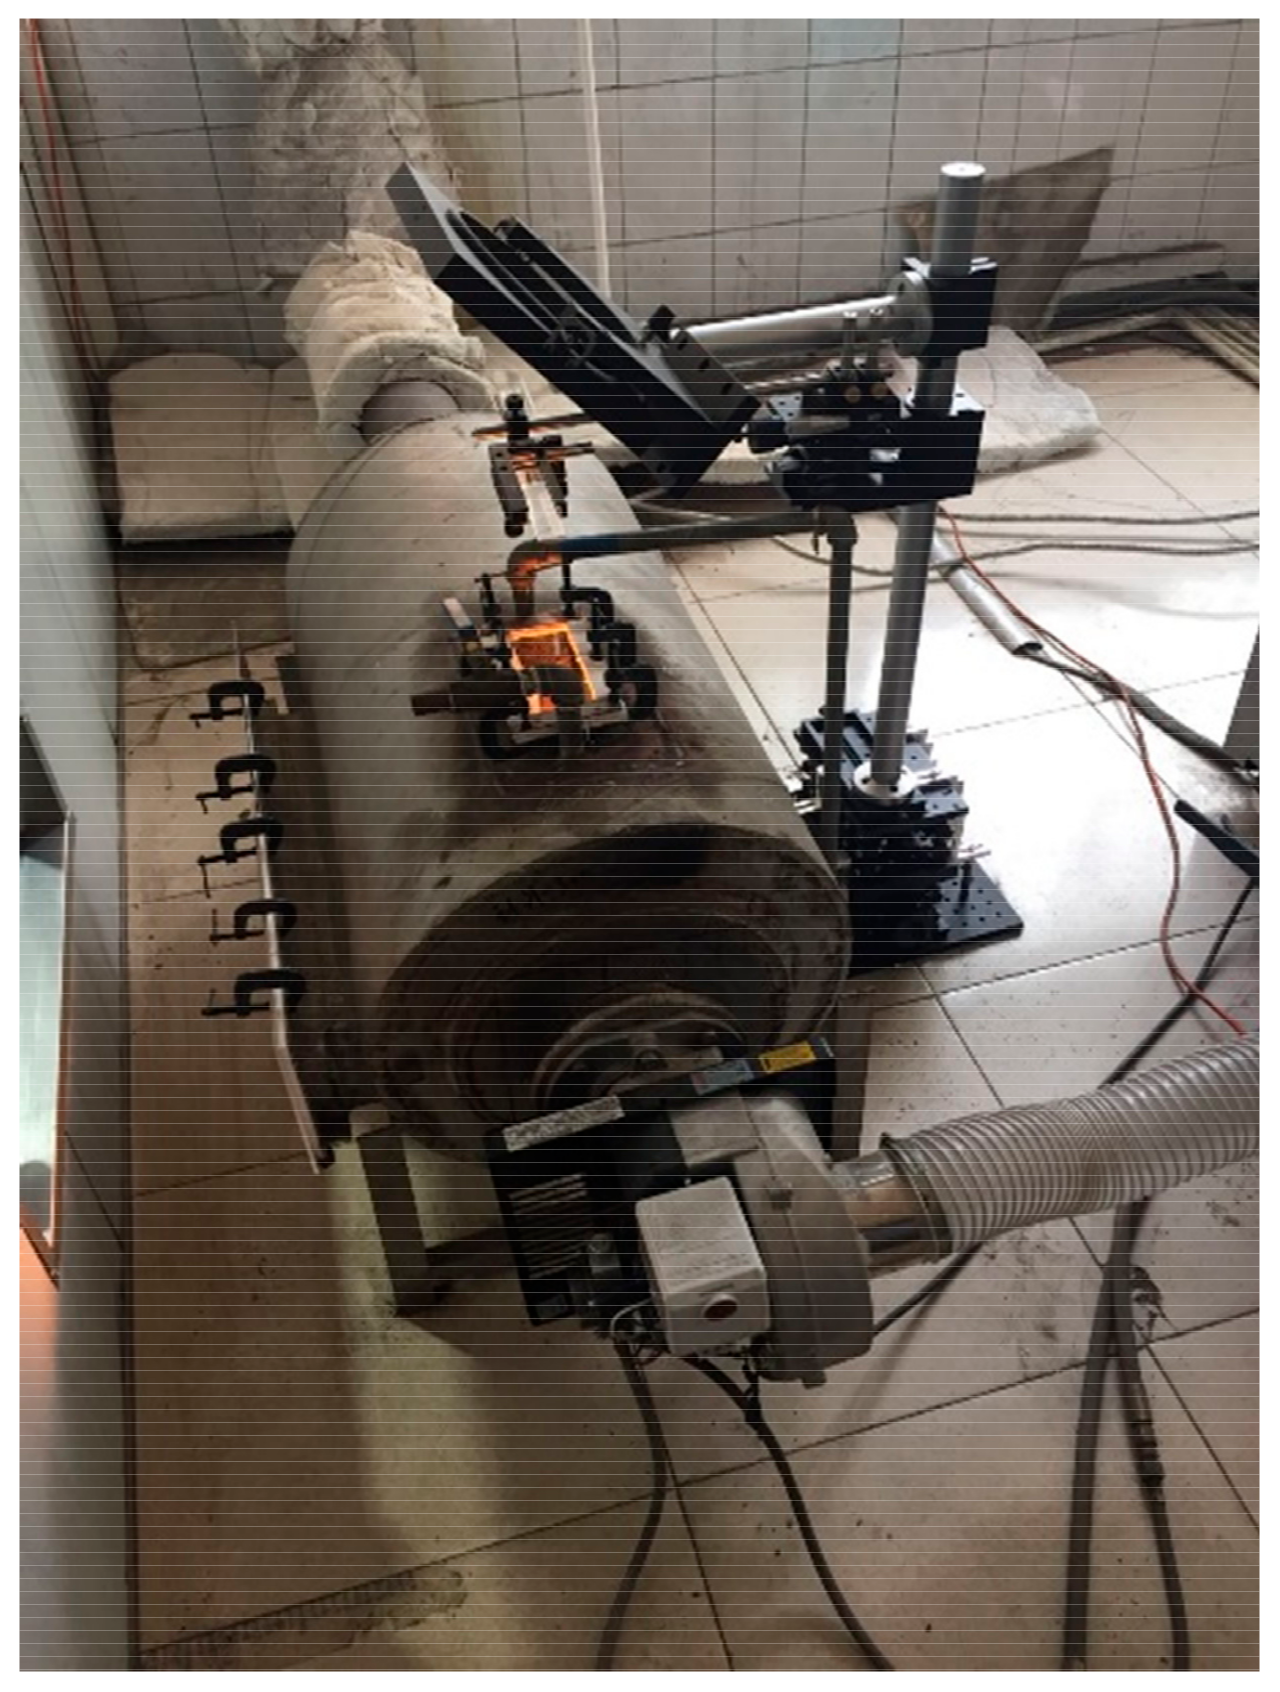
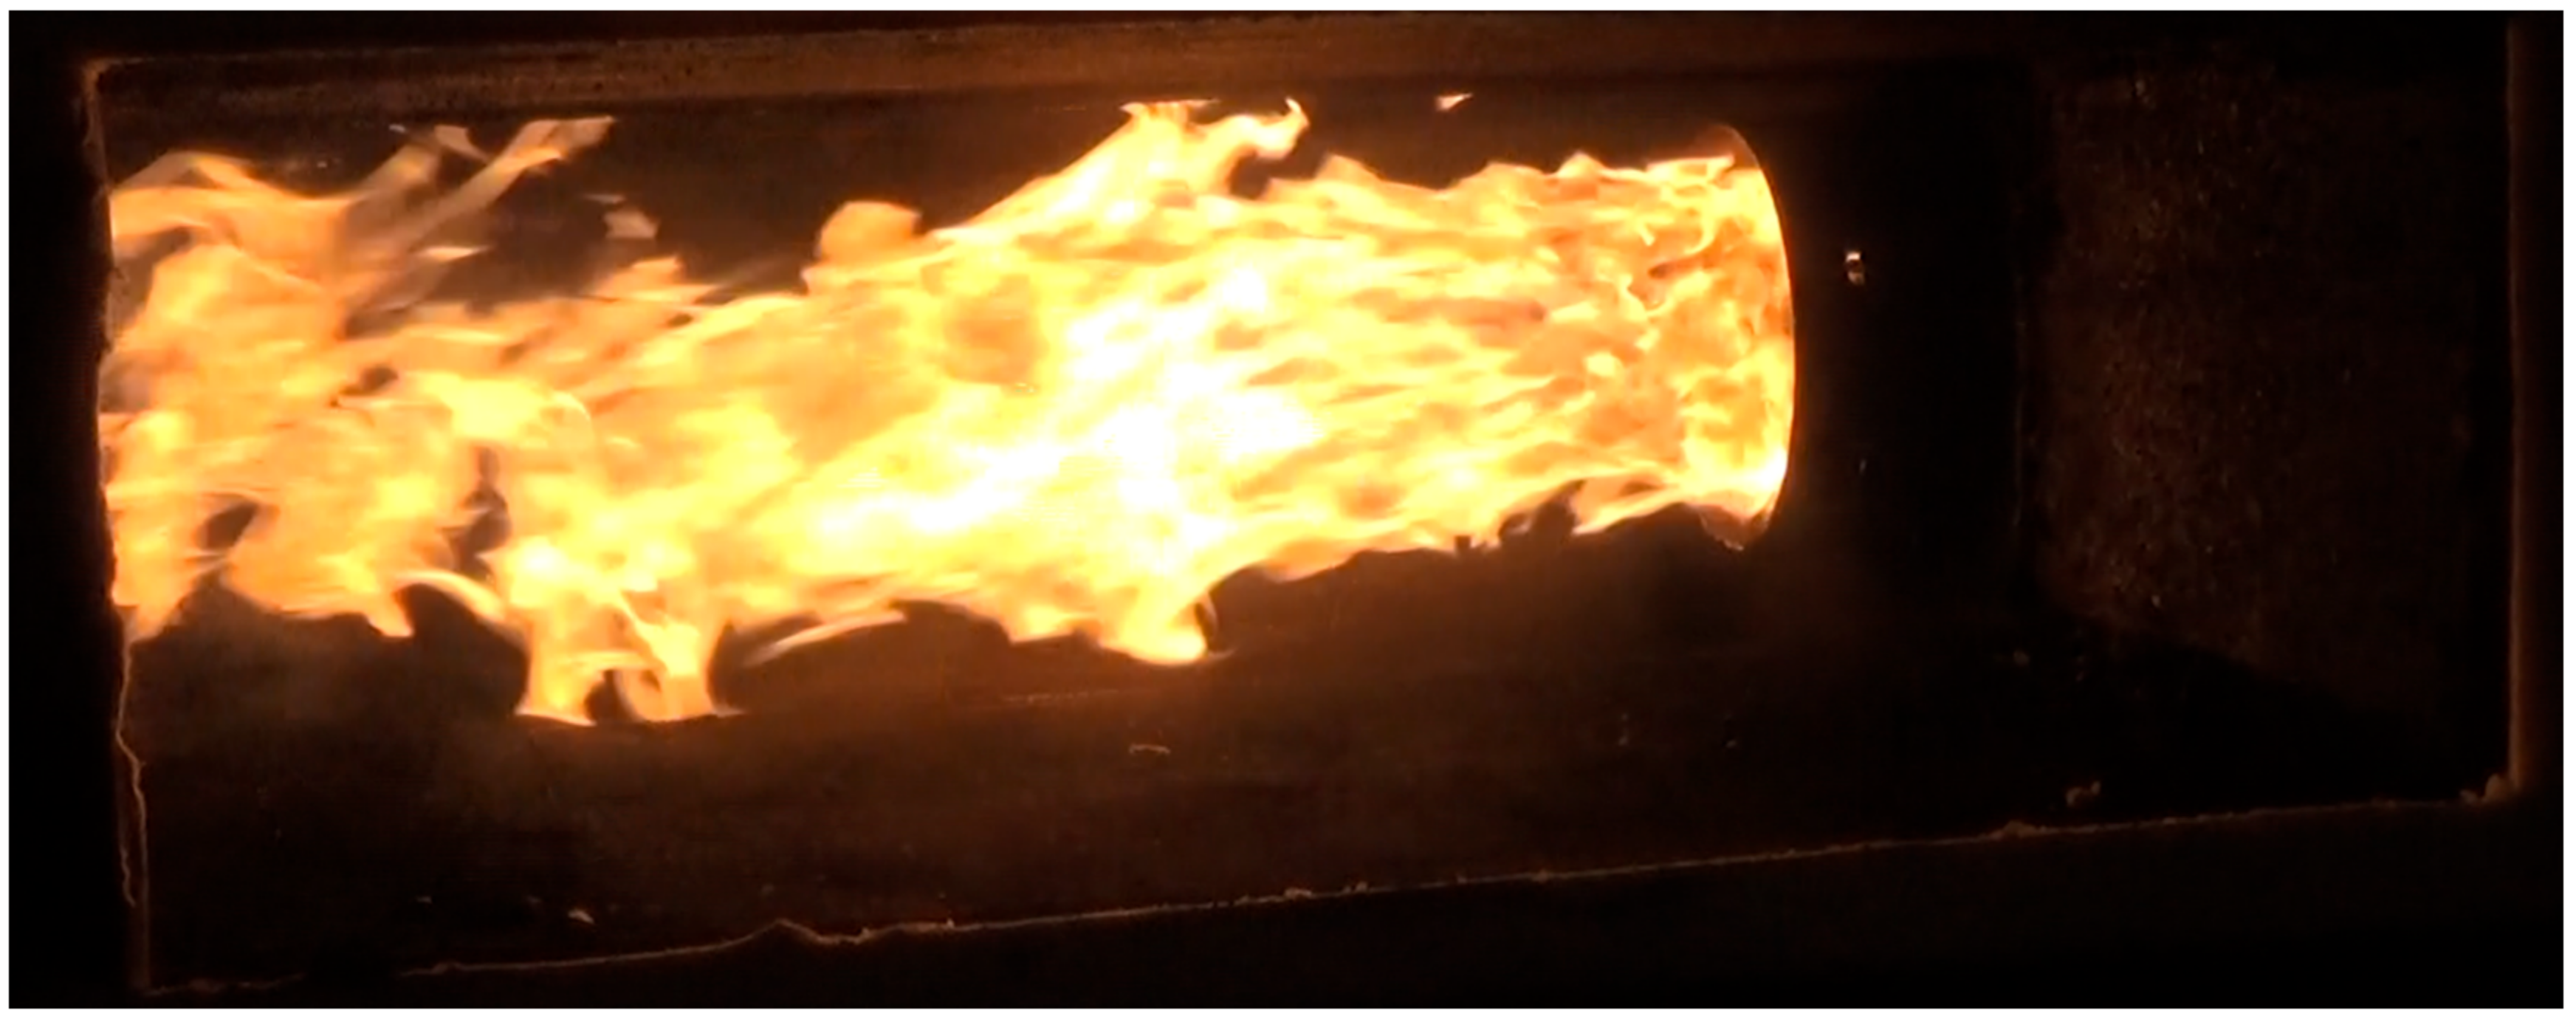
2. Experiment Details

A schematic representation of the experimental optical set-up is shown in Figure 1a. The laser system consisted of a pulsed Nd: YAG laser pumping a dye laser circulating rhodamine 590 dye in methanol. The dye laser light was frequency doubled to yield about 1.8 mJ/pulse at a frequency of 400 Hz. The laser wavelength, 283.599 nm, was calibrated by wavemeter (WaveMaster, Coherent, CA, USA), corresponding to 283.553 nm; this was used to excite the Q 1 ( 8 ) line of the (0,1) band of the OH ( X 2 Π A 2 Σ + ) system. The OH transition was confirmed to give off a strong fluorescence signal relative to neighboring transitions, which was particularly suitable for this complex environment [20]. In the experiment, the observation windows were extremely vulnerable to oil contamination, which greatly increased the difficulty of excitation and detection. Laser energy can be seriously affected by the external environment, especially temperature and humidity. The temperature in the factory fluctuated within the range of 25–35 °C. In addition, factory humidity reached 90%, resulting in fluctuation of laser energy and drift of the laser wavelength. More seriously, the harsh environment will affect the stable operation of the PLIF system. High temperatures can affect the thermal effects of the laser crystal, and reduce frequency-doubling efficiency, while high humidity may cause crystal deliquescence. It is worth mentioning that the pumping source was developed independently for the PLIF system to overcome complex experimental environment. The pumping source was filled with nitrogen to prevent moisture accumulation. Finally, anti-vibration measures were also considered.
In order to meet the engineering needs, a large size sheet light is needed. The optics consisted of a concave lens ( f = 8   mm ), collimating lens ( f = 240   mm ), and focus lens ( f = 800   mm ). The sheet forming optics generated a nearly 10.5 cm laser sheet, and the sheet reaching the observation window was nearly 12.3 cm. The sheet-forming optics system spread the laser beam into a collimated 12.3 cm (width) laser sheet. Subsequently, the distribution of sheet energy was not uniform, as calculated. The fluorescence from part of the illuminated sheet was recorded with an intensified CMOS camera (EoSens® CXP, MIKROTRON, Unterschleissheim, Germany). The combination of simrock 315/15 and UG11 mounted in front of the ICMOS camera was used to block flame spontaneous radiation and laser scattered light. In consideration of the signal-to-noise ratio of the images, the exposure time was fixed at a value of 30 ns. The camera has a maximum frame rate of 10 KHz, and the COMS array was 1000 × 1000 pixels. In the experiment, the ICMOS camera imaged a 110 × 110 mm2 area of the combustion field, giving a spatial resolution of about 110 um per pixel. In contrast to a laboratory burner, industrial-type burners possess relatively complex control systems. More specifically, the ignition delay and control line delay fluctuation represent obstacles in the detection of the evolution of the flame structure. The experimental timing is controlled by digital delay generator (DG645, Stanford Research Systems, Sunnyvale, CA, USA), with 5 pm accuracy. In the experiment, the trajectory of the wrinkled structure and velocity of the flame surface depend on the pixel positions. In Figure 2, for the trajectory of the wrinkled structure, we chose the top B. For the trajectory of flame surface A, we chose the center of the flame surface A. As the flame surface had a certain thickness, we chose the brightest position of the flame surface center, which represents the most violent combustion. The velocity of the flame surface can be obtained by changing the pixel positions of the same structure of the two images; the time of two images is 2.5 ms. The experiment was repeated many times under specific working conditions. Although only typical images are shown in the paper, the results proved consistent.
The experiments were conducted in a horizontal oil-fired boiler, with a size of 500 mm × 800 mm, in Shandong University. The boiler site map and the flame shape are shown in Figure 3 and Figure 4. For detection, two observation windows fitted with quartz glass were opened on the side and top of the boiler, with a size of 120 mm × 600 mm and 60 mm × 140 mm, respectively. The burner model was RIELLO40-G10LC (RIELLO, Legnago, Italy), whose the maximum output is 2.5 GPH (10 kg/h). The jet was a solid nozzle (Steinen S) with an output of 1.0 GPH (3.73 kg/h), and the atomization angle was 60°. The oil pump pressure was 12 bar. Heavy oil possesses a high molecular weight, viscosity, and asphaltene contents, as well as containing ash. The combustion process will be accompanied by a large amount of pollution. Meanwhile, heavy oil is difficult to burn. So, the heavy oil for the experiment, strictly speaking, was nonstandard fuel oil with a mixture of heavy and light oils [17].

3. Results and Discussion

This section presents results of measurements of flame structure during the ignition process using 400 Hz OH-PLIF. The section is divided into three parts. The first part presents the evolution of the flame structure under forced ignition. The displacement velocity of the flame is extracted from time-resolved sequences OH-PLIF images. The second part investigates flame growth following autoignition. A comparision between forced ignition and autoignition is also performed to illustrate similarities and differences. The extraction method of flame velocity is the same as that of the former. The third part aims at the spatial distribution of the flame in the whole combustion chamber. Different laser sheet positions were employed to study it.

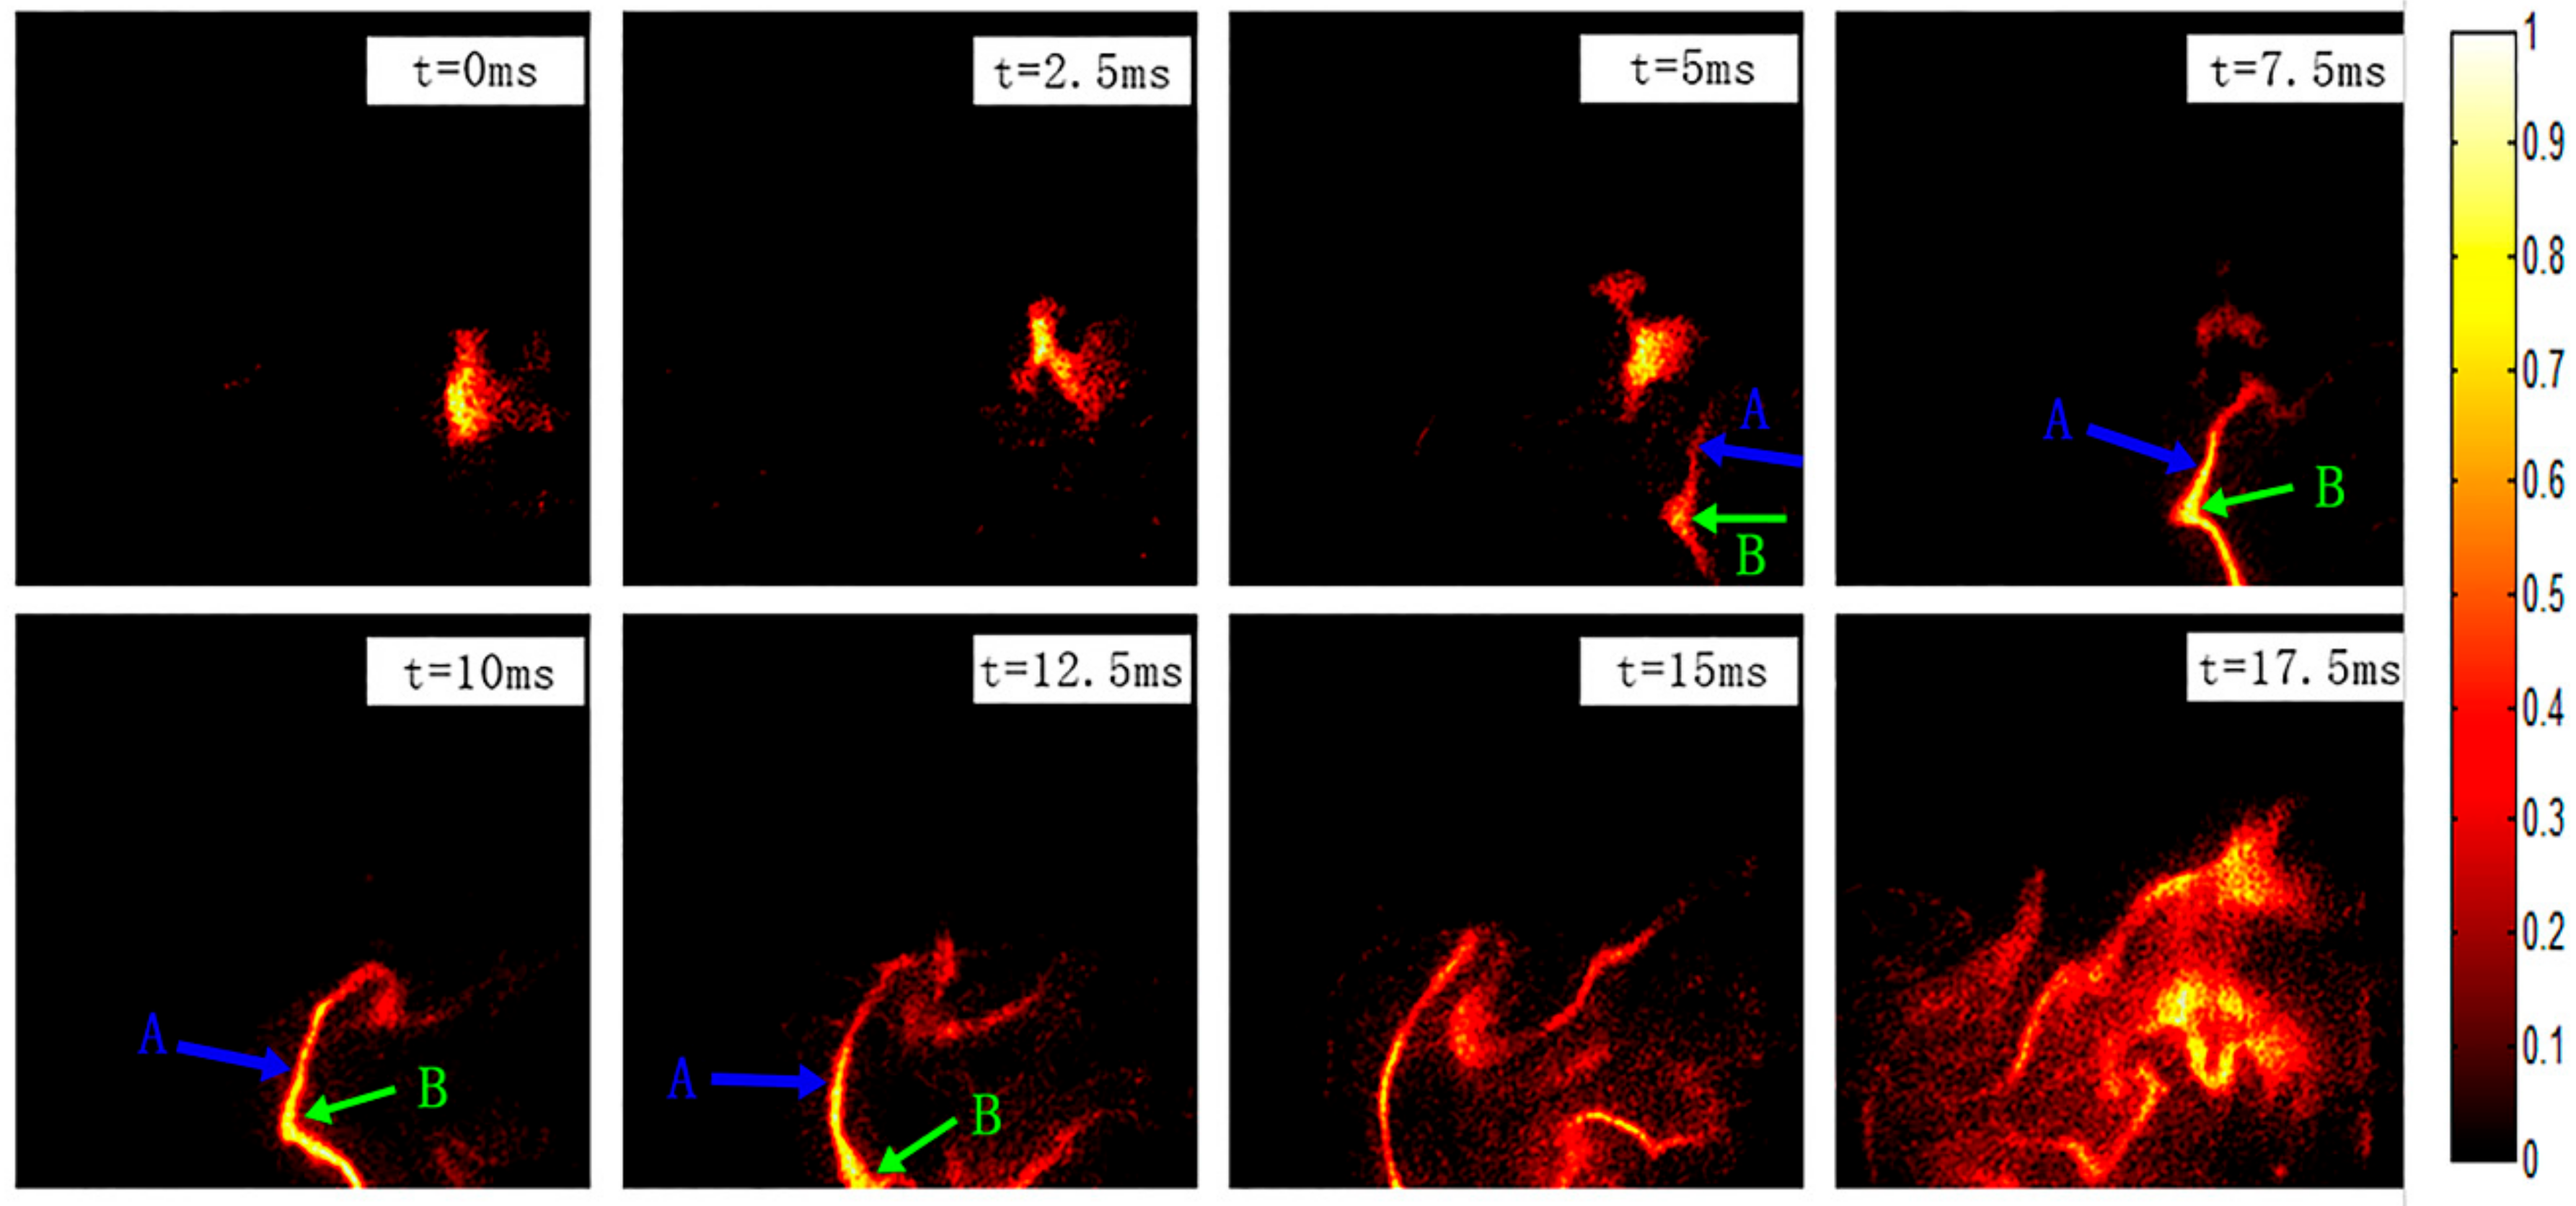
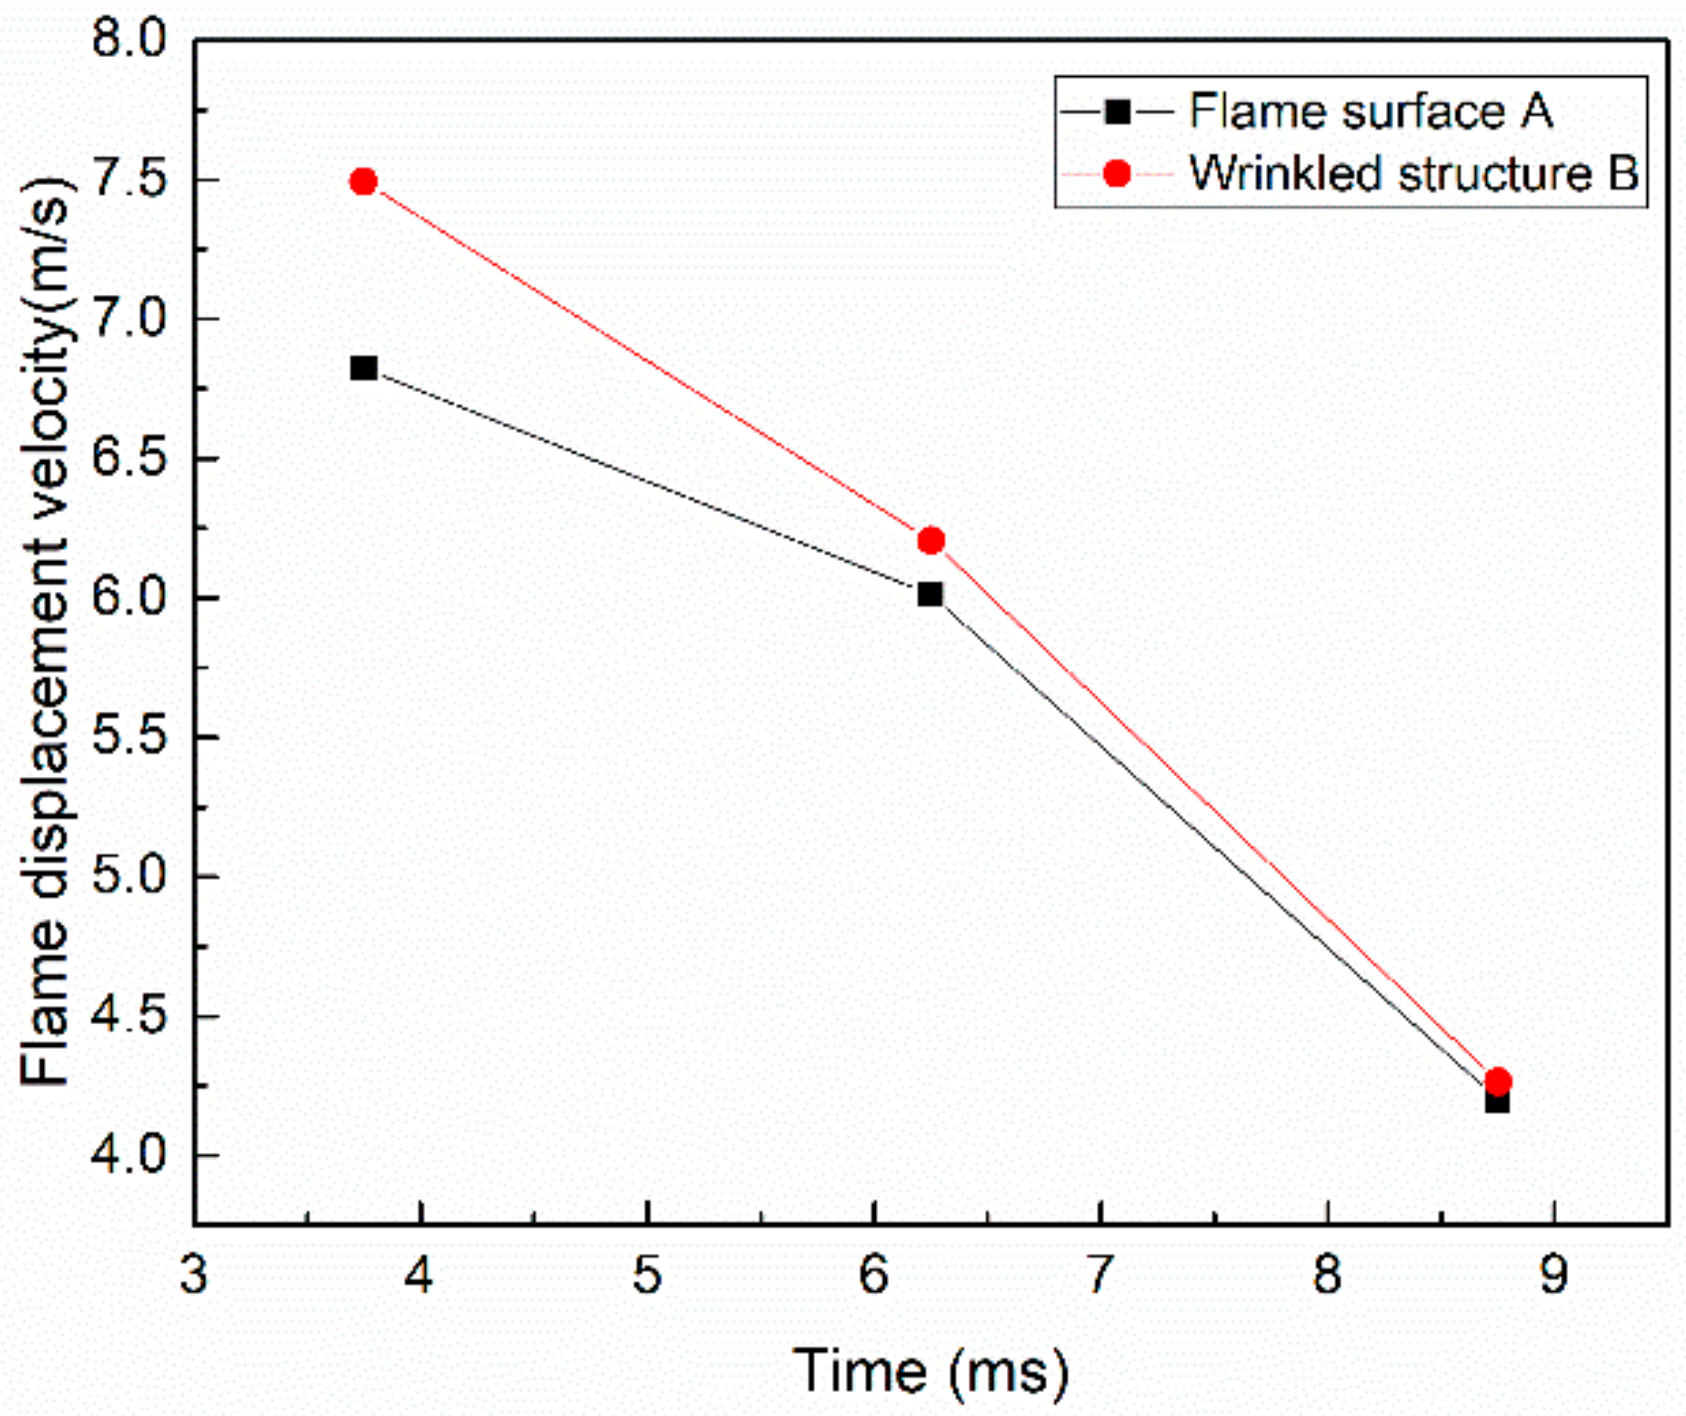
3.1. Forced Ignition Process

The forced ignition process was completed by high voltage discharge. Accurate timing control was needed to avoid discharging strong light in order to capture the ignition flame at the initial time. Time-resolved sequences OH-PLIF images are shown in Figure 2. The dynamic change process of the flame structure is recorded. At the initial time (t = 0 ms), the electric spark creates a transient flame core in the mixture of oil and gas; then, the fire kernel develops and propagates. A weak flame front below the flame core exists. It’s worth noting that the flame surface does not develop directly from the flame core, and the transfer of heat and mass should contribute to the evolution. This phenomenon may be affected by ignition energy [21]. From the appearance of the flame, it is similar to a turbulent premixed flame, so it can be speculated that although the combustion process of heavy oil is extremely complex, involving two-phase combustion, the ignition process can be viewed as a gas combustion process, i.e., belonging to homogeneous combustion, of which similar studies can be done. The wrinkled structure of the flame surface can be used as an indicator to reflect the interaction between turbulence and flame. It is of great significance for enhancing material transport and intensifying combustion [22,23], so tracing the path of the structure development can help designers to better understand combustion conditions. The displacement vector diagram of the wrinkled structure and flame surface are shown in Figure 5. It can be seen that the wrinkled structure develops downward, namely in deviation from direction of airflow. The wrinkled structure can be used as the leading edge of a brush [24], which largely reflects the combustion trend. What is more, the displacement velocity along the direction of the flow gets gradually smaller, but the vertical velocity does the opposite. This indicates that the center of combustion is not along the direction of gas flow, but has a certain angle with it.
As the turbulent burning velocity is defined according to different flame types [25], to be more intuitive, the displacement velocity of it is used to describe the combustion rate. In Figure 6, the displacement velocity of the wrinkled structure and flame surface were extracted. It can be seen that the velocity gradually decreased. In addition, the former is slightly larger than the latter. The reason for this might be that the position of the wrinkled structure burns more intensely than elsewhere, showing that the displacement speed is larger [25,26]. It also implies that the wrinkled structure plays a role in intensifying combustion.

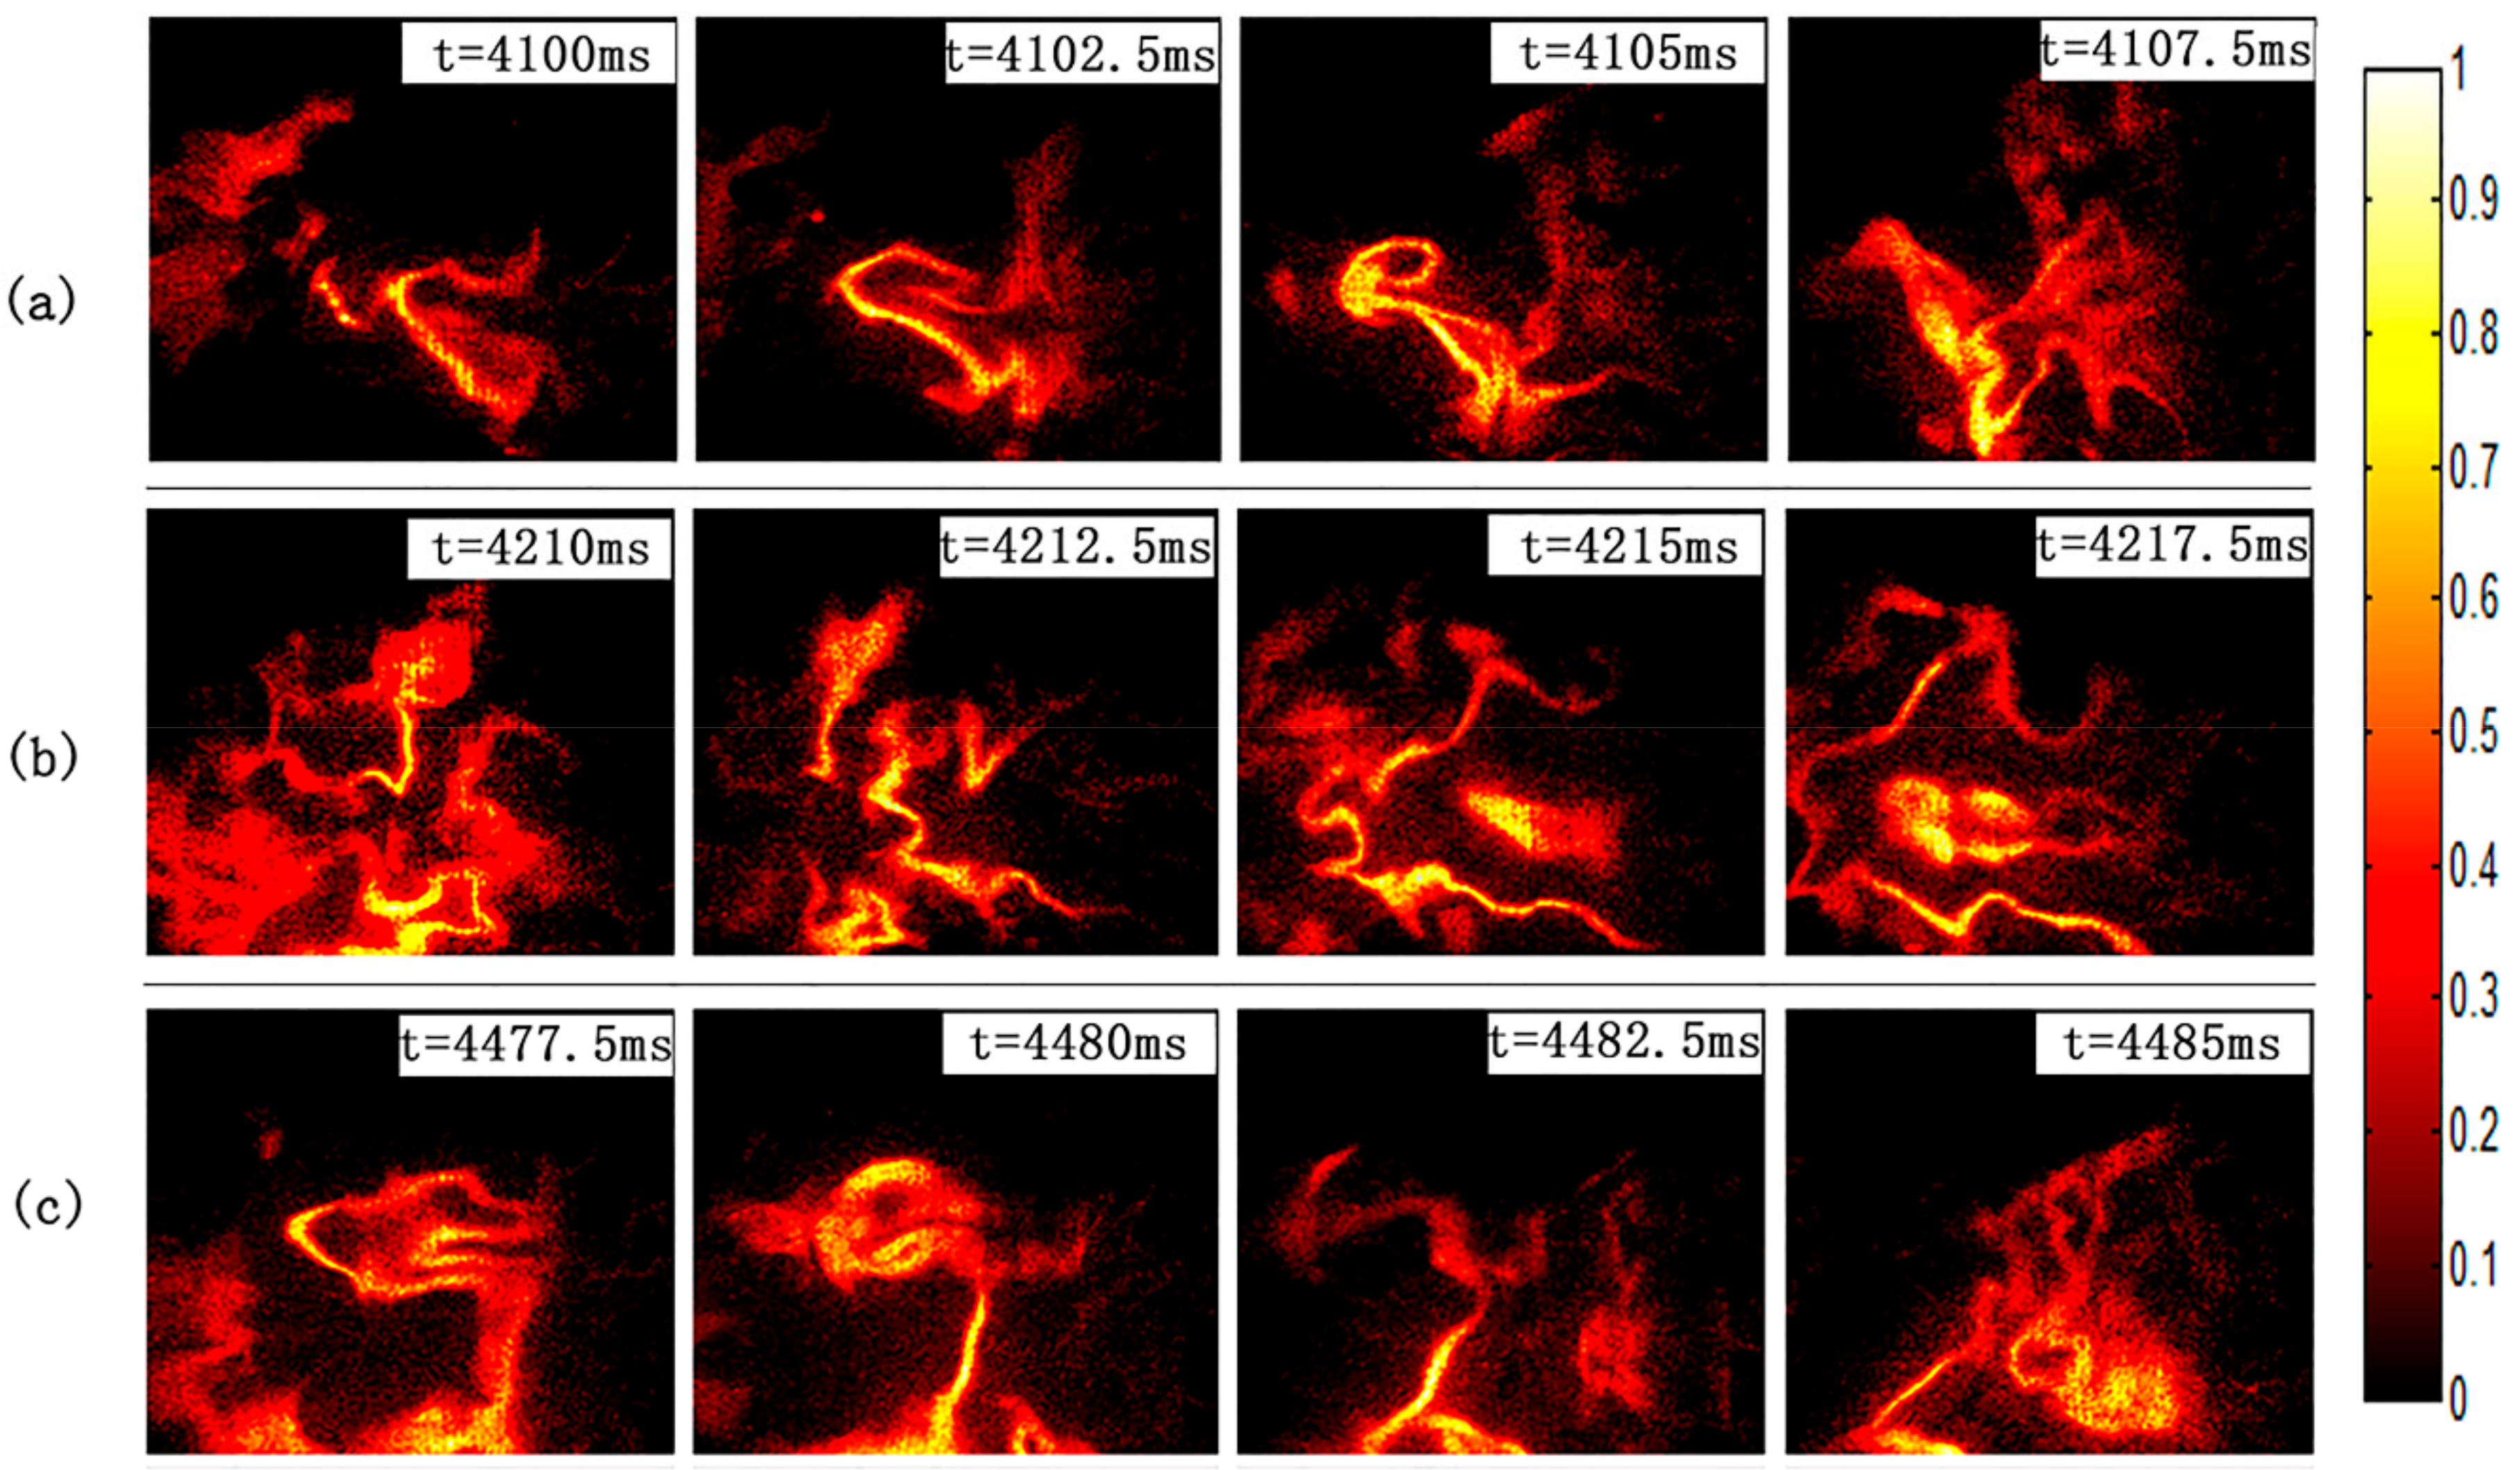
3.2. Autoignition Process

Flame growth following autoignition is demonstrated in Figure 7a–c. As mentioned earlier, spray combustion creates a turbulent environment in the combustion chamber. The flame is not continuous during the turbulent combustion process; instead, it is a process comprising extinction and re-ignition [12]. In the state of steady combustion, there is an autoignition process of the flame. In Figure 7, the change of the flame surface shape is similar to that of a forced ignition; however, the degree of wrinkle of the flame surface is obviously different. The ignition time, nearly 10 ms, i.e., much less than that of a forced ignition, indicated that the combustion was more intense. A Comparison of Figure 2 and Figure 7b shows that the initial condition of the interface between fuel and air may affect ignition time. The distorted flame front implies that the turbulence intensity is higher than before. If we focus our attention on the degree of the wrinkled structure, we will, surprisingly, find a similar trend of contraction and expansion, which requires further study. Though the flames trembled violently, the phenomenon of stratified flame combustion was still investigated. The existence of this phenomenon may play an important role in stabilizing combustion. The same method is applied for autoignition processing. We still focus attention on information about the velocity, which is estimated in Figure 8. The velocity gradually decreased, whereas three autoignition processes expressed different displacement velocities of the flame surface in Figure 7a–c. Analysis of the images suggests that this may be due to different heat release rates [21]. The temperature of the combustion chamber periphery gradually increased, resulting in intense burning in combustion chamber, thus showing different velocities.
In this experiment, the frequency of the laser is 400 Hz; this is sufficient to detect flame growth following ignition, especially in terms of the trajectory of the wrinkled structure. However, it is not enough to get more information about combustion, so a laser with a high repetition rate which has been adapted to complex environments is desirable. It can be found that the connection between the displacement velocity of the wrinkled structure and the flame shape is associated with the fact that the distorted flame shape may correspond to a greater combustion rate. In other words, the extent to which the wrinkled structure promotes combustion concerning the combustion rate is large.

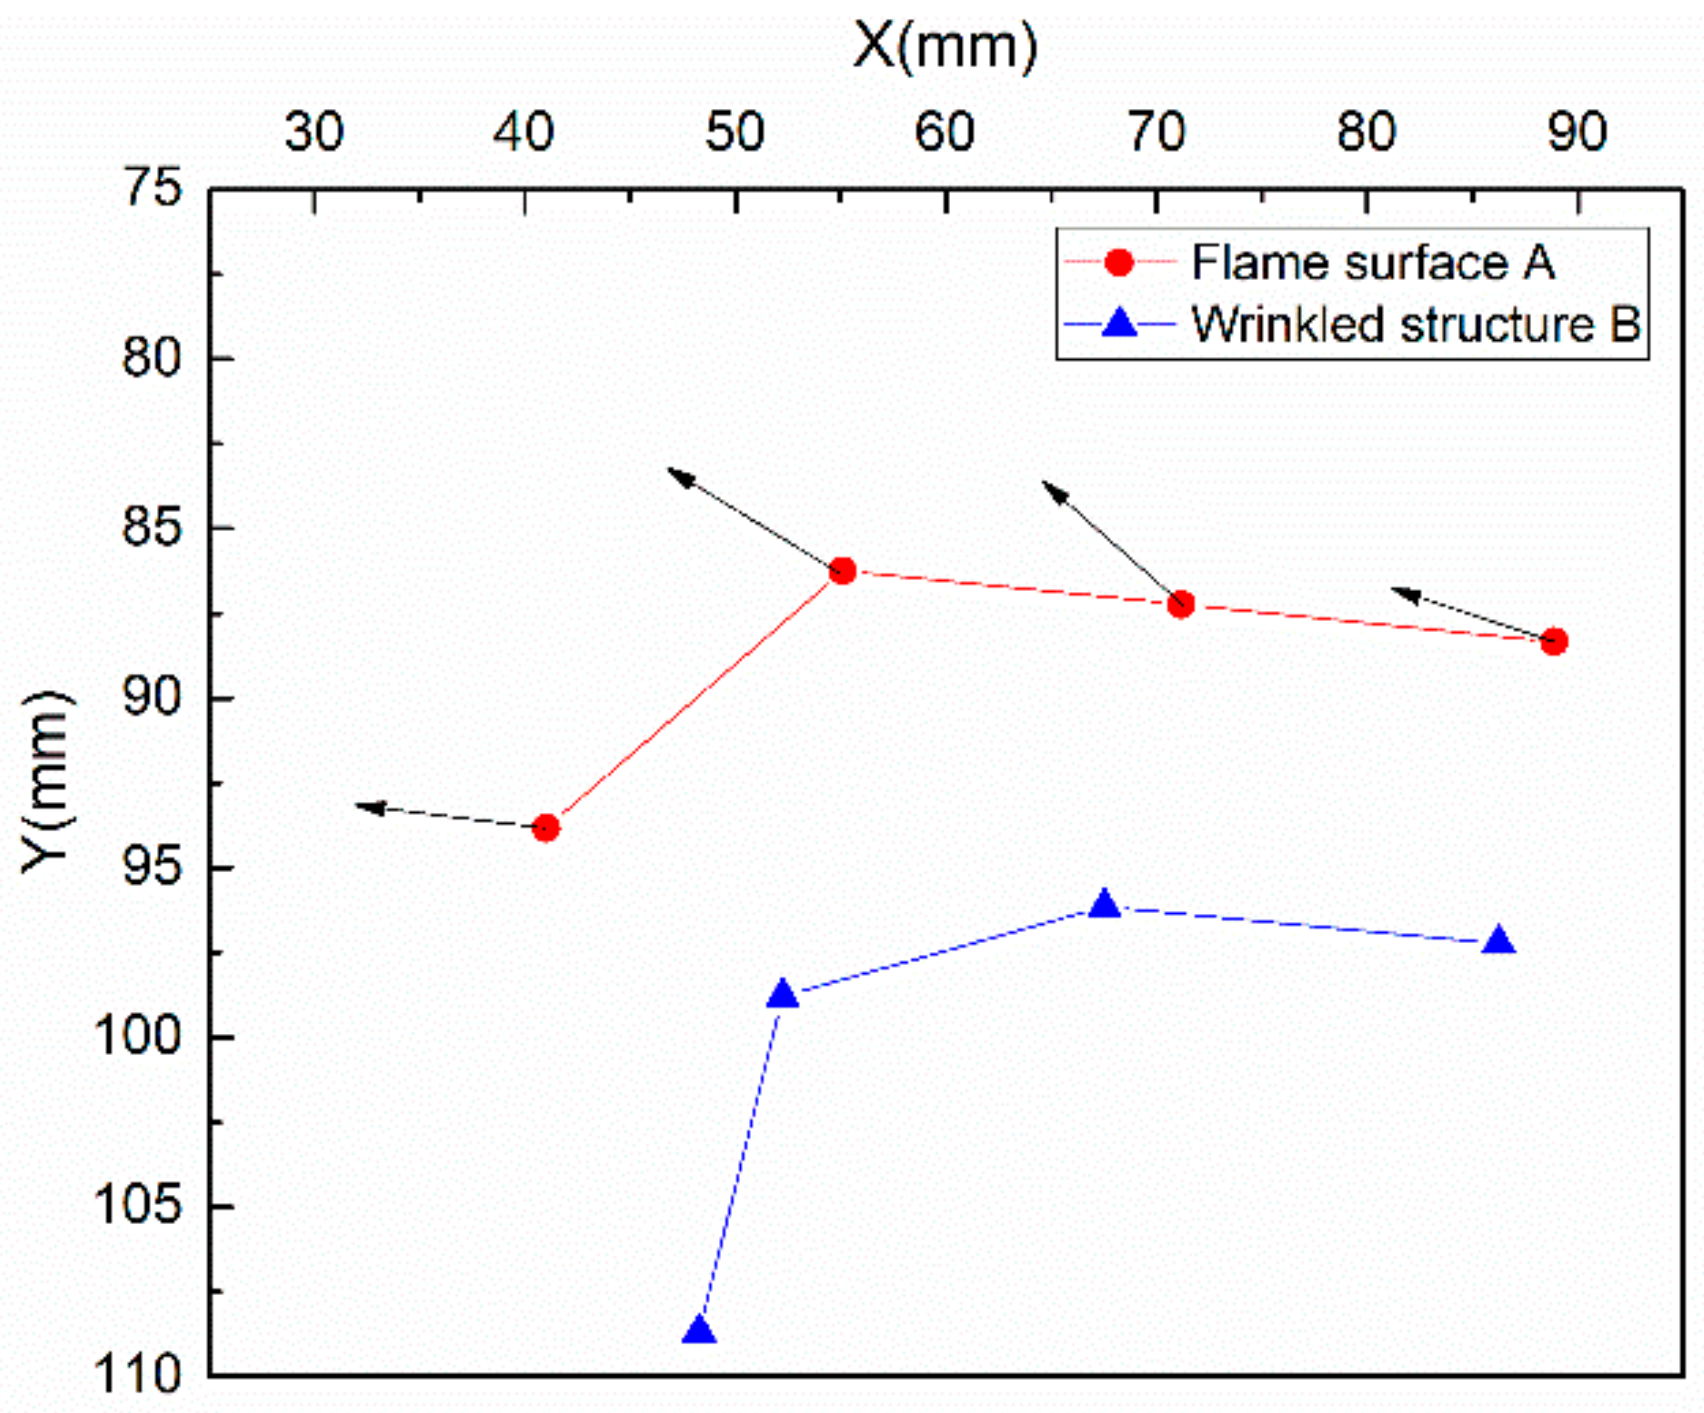
3.3. Spatial Distribution of Flame

For the purpose of comprehensively understanding combustion conditions, different incident laser positions (from 1–5 cm) were employed. Taking advantage of a large laser sheet (12.3 cm × 300 µm), the spatial distribution of the combustion field is presented. In Figure 9, the central axis of the boiler furnace corresponds to the position where the laser sheet is 3 cm from the left window. As shown in Figure 10a, as the detection distance increases, more flame fronts are detected. The distribution of the OH signal on both sides of the central axis is quite different. Obviously, the right side of boiler combustion chamber burns violently, corresponding to the center of combustion. The area of stable combustion was demonstrated by means of image cumulative averages, as shown in Figure 10b. It can be clearly seen that the center of the boiler is not the most widely-distributed position in the OH signal. The stable combustion area gradually got wider as the laser sheet distance increased. The distribution of the OH signal along the direction of gas flow was extracted intuitively, as shown in Figure 11. Again, it can be confirmed that the center of combustion deviated from the center of boiler. Maybe the burner suffered a small defect during assembly which was critical to the design of the combustion chamber.

4. Conclusions

In order to break the constraints on the application of the PLIF technique and satisfy engineering needs, and taking environmental factors into account, the experiment was successfully performed on a heavy oil boiler, i.e., an industrial-type burner, by using 400 Hz OH-PLIF. The performance of the burner is evaluated from two aspects: the ignition process and combustion area. In the ignition process, firstly, flame growth was investigated for the case of ignition. The trajectory of the wrinkled structure was depicted to reflect the center of combustion, which is of significance for control of the ignition time. What is more, it may influence ignition success rates. Furthermore, it can influence the quality of the heavy oil boiler. The displacement velocity of flame was extracted to describe the combustion rate; the results showed that the velocity expressed a similar, gradually decreasing trend, and the distorted flame shape may correspond to a greater combustion rate. In the stable combustion process, the center of combustion deviated from the center of boiler; this was perhaps due to a defect in the unit’s assembly, which was critical to the design of the combustion chamber.
In further research, the main direction is to improve the laser repetition frequency, which is particularly important for studying flame fluctuation. It is also a vital criterion for evaluating the quality of burners.

Author Contributions

X.Y. is the leader of the work. J.P. and Z.C. are responsible for experiment setting and paper writing. Y.Y. and G.C. are mainly engaged in picture editing and related data processing. Z.W. contributes to the stable operation of burner. All have made positive contributions to the work.

Funding

This research was funded by the National Natural Science Foundation of China (Grant Nos. 51536002, 61405048, and 91441130). Fundamental Research Funds for the Central Universities (Grant No. HIT. NSRIF. 2014045), and the National Key Scientific Instrument and Equipment Development Projects of China (No. 2012YQ040164). The APC was funded by the National Natural Science Foundation of China (Grant No. 51536002).

Acknowledgments

Thanks to the reviewers and editor for manuscript improvements. This work was supported by the National Natural Science Foundation of China (Grant Nos. 51536002, 61405048, and 91441130). Fundamental Research Funds for the Central Universities (Grant No. HIT. NSRIF. 2014045), and the National Key Scientific Instrument and Equipment Development Projects of China (No. 2012YQ040164).

Conflicts of Interest

The authors declare no conflict of interest.

References

  1. Hanson, R.K.; Seitzman, J.M.; Paul, P.H. Planar laser-fluorescence imaging of combustion gases. Appl. Phys. B 1990, 50, 441–454. [Google Scholar] [CrossRef]
  2. Giezendanner, R.; Keck, O.; Weigan, P. Periodic combustion instabilities in a swirl burner studied by phase-locked planar laser-induced fluorescence. Combus. Sci. Technol. 2003, 175, 721–741. [Google Scholar] [CrossRef]
  3. Kaminski, C.F.; Hult, J.; Alden, M. High repetition rate planar laser induced fluorescence of OH in a turbulent non-premixed flame. Appl. Phys. B 1999, 68, 757–760. [Google Scholar] [CrossRef]
  4. Cho, Y.; Kim, J.H.; Cho, T. Analysis of turbulent premixed flame structure using simultaneous PIV-OH PLIF. J. Vis. 2004, 7, 43–54. [Google Scholar] [CrossRef]
  5. Versluis, M.; Georgiev, N.; Martinsson, L. 2-D absolute OH concentration profiles in atmospheric flames using planar LIF in a bi-directional laser beam configuration. Appl. Phys. B 1997, 65, 411–417. [Google Scholar] [CrossRef]
  6. Bruchhausen, M.; Guillard, F.; Lemoine, F. Instantaneous measurement of two-dimensional temperature distributions by means of two-color planar laser induced fluorescence (PLIF). Exp. Fluids 2005, 38, 123–131. [Google Scholar] [CrossRef]
  7. Frank, J.H.; Kalt, A.M.; Bilgera, R.W. Measurements of conditional velocities in turbulent premixed flames by simultaneous OH PLIF and PIV. Combust. Flame 1999, 116, 220–232. [Google Scholar] [CrossRef]
  8. Giezendanner-Thoben, R.; Meier, U.; Meier, W. Phase-locked temperature measurements by two-line OH PLIF thermometry of a self-excited combustion instability in a gas turbine model combustor. Flow Turbul. Combus. 2005, 75, 317–333. [Google Scholar] [CrossRef]
  9. Kiefer, J.; Li, Z.S.; Zetterberg, J. Investigation of local flame structures and statistics in partially premixed turbulent jet flames using simultaneous single-shot CH and OH planar laser-induced fluorescence imaging. Combust. Flame 2008, 154, 802–818. [Google Scholar] [CrossRef]
  10. Li, Z.S.; Li, B.; Sun, Z.W. Turbulence and combustion interaction: High resolution local flame front structure visualization using simultaneous single-shot PLIF imaging of CH, OH, and CH2O in a piloted premixed jet flame. Combust. Flame 2010, 157, 1087–1096. [Google Scholar] [CrossRef]
  11. Fu, J.; Tang, C.L.; Jin, W. Study on laminar flame speed and flame structure of syngas with varied compositions using OH-PLIF and spectrograph. Int. J. Hydrogen Energy 2013, 38, 1636–1643. [Google Scholar] [CrossRef]
  12. Juddoo, M.; Masri, A.R. High-speed OH-PLIF imaging of extinction and re-ignition in non-premixed flames with various levels of oxygenation. Combust. Flame 2011, 158, 902–914. [Google Scholar] [CrossRef]
  13. Osborne, J.R.; Ramji, S.A.; Carter, C.D. Relationship between local reaction rate and flame structure in turbulent premixed flames from simultaneous 10 kHz TPIV, OH PLIF, and CH2O PLIF. Proc. Combust. Inst. 2017, 36, 1835–1841. [Google Scholar] [CrossRef]
  14. Lefebvre, A.H. Fuel Effects on gas turbine combustion-liner temperature, pattern factor, and pollutant emissions. J. Aircr. 1984, 21, 887–898. [Google Scholar] [CrossRef]
  15. Jaravel, T.; Riber, E.; Cuenot, B. Large Eddy. Simulation of an industrial gas turbine combustor using reduced chemistry with accurate pollutant prediction. Proc. Combust. Inst. 2017, 36, 3817–3825. [Google Scholar] [CrossRef]
  16. Seljeskog, M.; Sevault, A.; Ditaranto, M. Pursuing the oxy-fuel light-/heavy oil retrofit route in oil refineries—A small scale retrofit study. Energy Procedia 2013, 37, 7231–7248. [Google Scholar] [CrossRef]
  17. Wang, Z.Q.; Liu, M.; Cheng, X.X. Experimental study on oxy-fuel combustion of heavy oil. Int. J. Hydrogen Energy 2017, 42, 20306–20315. [Google Scholar] [CrossRef]
  18. Benedetto, A.D.; Cammarota, F.; Sarli, V.D. Reconsidering the flammability diagram for CH4/O2/N2, and CH4/O2/CO2 mixtures in light of combustion-induced rapid phase transition. Chem. Eng. Sci. 2012, 84, 142–147. [Google Scholar] [CrossRef]
  19. Jenny, P.; Roekaerts, D.; Beishuizen, N. Modeling of turbulent dilute spray combustion. Prog. Energy Combust. Sci. 2012, 38, 846–887. [Google Scholar] [CrossRef]
  20. Mercier, X.; Orain, M.; Grisch, F. Investigation of droplet combustion in strained counterflow diffusion flames using planar laser-induced fluorescence. Appl. Phys. B 2007, 88, 151–160. [Google Scholar] [CrossRef]
  21. Mastorakos, E. Ignition of turbulent non-premixed flames. Prog. Energy Combust. Sci. 2009, 35, 57–97. [Google Scholar] [CrossRef]
  22. Tay-Wo-Chong, L.; Zellhuber, M. Combined influence of strain and heat loss on turbulent premixed flame stabilization. Flow Turbul. Combust. 2016, 97, 263–294. [Google Scholar] [CrossRef]
  23. Sarli, V.D.; Benedetto, A.D. Sensitivity to the presence of the combustion submodel for large eddy simulation of transient premixed flame–vortex interactions. Ind. Eng. Chem. Res. 2012, 51, 7704–7712. [Google Scholar] [CrossRef]
  24. Shepherd, I.G.; Cheng, R.K. The burning rate of premixed flames in moderate and intense turbulence. Combust. Flame 2001, 127, 2066–2075. [Google Scholar] [CrossRef]
  25. Driscoll, J.F. Turbulent premixed combustion: Flamelet structure and its effect on turbulent burning velocities. Prog. Energy Combust. Sci. 2008, 34, 91–134. [Google Scholar] [CrossRef]
  26. Lawn, C.J.; Schefer, R.W. Scaling of premixed turbulent flames in the corrugated regime. Combust. Flame 2006, 146, 180–199. [Google Scholar] [CrossRef]
Figure 1. (a) Experimental set-up schematic diagram; (b) Experimental set-up site photo.
Applsci 08 01691 g001
Figure 2. Flame evolution following spark ignition, field of view = 110 mm × 110 mm. Frame rate = 400 Hz. A and B mean flame surface and wrinkled structure, respectively. The oxygen concentration is 33%. The excess air coefficient α = 1.652, which is the ratio of the practical oxygen supply to the theoretical oxygen consumption. The oxygen consumption is 103 L/min, and the total gas flow is 676 L/min.
Applsci 08 01691 g002
Figure 3. The boiler site map.
Applsci 08 01691 g003
Figure 4. Flame shape in combustion.
Applsci 08 01691 g004
Figure 5. The displacement vector diagram of wrinkled structure and flame surface. The arrow represents the normal line of the flame surface. The flame propagation direction is from right to left, and the distance coordinates correspond to the field of view.
Applsci 08 01691 g005
Figure 6. The displacement velocity of flame in forced ignition process.
Applsci 08 01691 g006
Figure 7. Selected sequences of OH-PLIF images about flame evolution following autoignition (ac). Images in time-sequence from left to right only, with 2.5 ms between consecutive frames, field of view = 110 mm × 110 mm. The oxygen concentration is 33%. The excess air coefficient α = 1.652. The oxygen consumption is 103 L/min, and the total gas flow is 676 L/min.
Applsci 08 01691 g007
Figure 8. The displacement velocity of flame in autoignition process.
Applsci 08 01691 g008
Figure 9. Schematic diagram of laser sheet position.
Applsci 08 01691 g009
Figure 10. OH-PLIF images of different sheet positions. (a) OH-PLIF images in different positions; (b) the average of 1000 OH-PLIF images.
Applsci 08 01691 g010
Figure 11. The distribution of OH signal from different laser sheet positions.
Applsci 08 01691 g011

