1. Introduction
It is routine to obtain vibration measurements in the structural health monitoring of suspension bridges, railway tracks, high-rise buildings etc. Vibrations near a railway track can be a matter of concern [
1]. Especially due to the high speed trains [
2] travelling at speeds in excess of 200 km/h or even 300 km/h, nearby buildings are likely to be affected. When the train tracks are built in cities, whether they are above ground or underground, they generate a certain amount of vibration in nearby buildings and structures [
3,
4]. Such vibrations at low levels can be acceptable unless there is resonance. Resonance causes damage to buildings and can make them unsafe or unstable. Thus, certain international standards have recommended regular quantification and management of these vibrations [
5], especially those up to 250 Hz. It is important to monitor the vibration frequencies as they often act a benchmark for normal operations. However, it may be difficult to attach electrical or bulky sensors to railway tracks due to safety concerns. Assembling equipment or accessories near the tracks for obtaining measurements is also a challenge. Hence, fiber Bragg grating (FBG) sensors have been found to hold great promise in this area [
6,
7] since the fiber cables can run for several meters and allow for continuous and remote monitoring. In particular, in train tunnels, there is very little space for workers to conduct checks with conventional accelerometers when the lines are in operation. However, with fiber sensors, the system can be used without disrupting normal operations.
Fiber Bragg gratings (FBG) have been used as vibration sensors for nearly two decades. The conventional use of FBGs for vibration measurements involves gluing the bare FBG directly on to the vibrating object [
8,
9]. Since the FBG is fragile and establishing good contact is crucial, this method is most suitable in laboratory conditions. Some alternate, packaged designs of FBG-based vibration sensors are also commercially available [
10,
11]. The FBG sensor has the main advantage of intrinsic sensitivity without additional complex packaging or design. In this paper, we present a sensor that is configured as a simple rectangular beam with a uniform FBG and extrapolates the concept of a cantilever. Cantilever vibration and modal studies with a FBG sensor have been reported by several groups [
12,
13]. The modal frequency varies depending on the configuration and dimensions of the cantilever. The results in literature have mainly focused on the shift in modal frequencies.
However, the objective of this study is to detect the vibration frequencies, apart from the modal frequencies, that affect the beam at a given time. This paper presents the results from a passive vibration sensor. The sensor design includes a rectangular metal beam of low stiffness bearing a fiber Bragg grating, which detects vibration frequencies from the vibrating object that it is coupled to. It is based on the principle of the coupling of forced vibrations. The FBG measures two types of frequencies due to the beam vibration: (a) the modal frequencies of the beam, which can be calculated numerically and (b) other frequencies from the periphery due to forced vibrations. A rectangular beam of a certain mass and dimension has a fixed set of vibration modes and is likely to exhibit those modal frequencies [
14,
15]. However, other frequencies measured by this sensor are likely to be from its peripheral environment or nearby sources of vibration. This sensor relies on the coupling of vibrations from one metallic object to the other. Measuring vibration frequencies is a proven method of detecting structural integrity. This vibration sensor can be used to conduct intermittent checks on various types of structures and machinery by passively conducting the vibrations from them.
2. Experimental Methods
A FBG with a central wavelength at 1549 nm, which was fabricated on a single-mode fiber, was used as the sensor. The bare FBG was glued to a thin and light metal beam (aluminum, 470 mm × 15 mm × 0.3 mm) with a rectangular cross-section. The FBG was located at around 15 cm from one end of the beam. The wavelength shift was recorded with the Micron optics interrogation (MOI) system sm130 (Micron Optics, Atlanta, GA, USA). The sampling frequency of the interrogation system was limited to 500 Hz but the same measurements can be obtained using an edge filter and a photoreceiver or using alternate interrogation systems with higher sampling frequency. Two common acoustic sources were used for the experiments in this study. An LG phone was used in-contact for pulsed vibrations and a Bluetooth speaker (connected to a phone) was used for frequency tones. The wavelength shift was recorded in the time domain and converted to the frequency domain by Fast Fourier Transform (FFT) function in MATLAB (R2014a, MathWorks, Natick, MA, USA). The sensor beam was tested in two different configurations. The first batch of experiments was set up with another beam acting as a wedge (or intermediate medium) that couples vibrations on to the sensing beam. The tested configurations are described as cases 1 to 4. The second setup used a simply supported aluminum plate as the intermediate medium, with the sensing beam placed near one edge on top of the plate (case 5). Finally, the field application test is described in case 6, where the sensing beam was propped against the external casing of an operational three-phase motor.
The following is the list of cases tested with the sensing beam to determine whether it is able to detect forced vibration frequencies in different orientations.
First setup: Beam on beam
- (i)
Case 1: Test with different frequencies from a speaker
- (ii)
Case 2: Test with phone vibration simultaneously with beam oscillation
- (iii)
Case 3: Test with the beam moved closer to speaker
- (iv)
Case 4: Test with the FBG bearing surface flipped downwards
Second setup: Beam on plate
- (v)
Case 5: Test with different frequencies and comparison with analytical results
Third setup: Beam propped against operational motor
- (vi)
Case 6: Beam in contact with motor housing
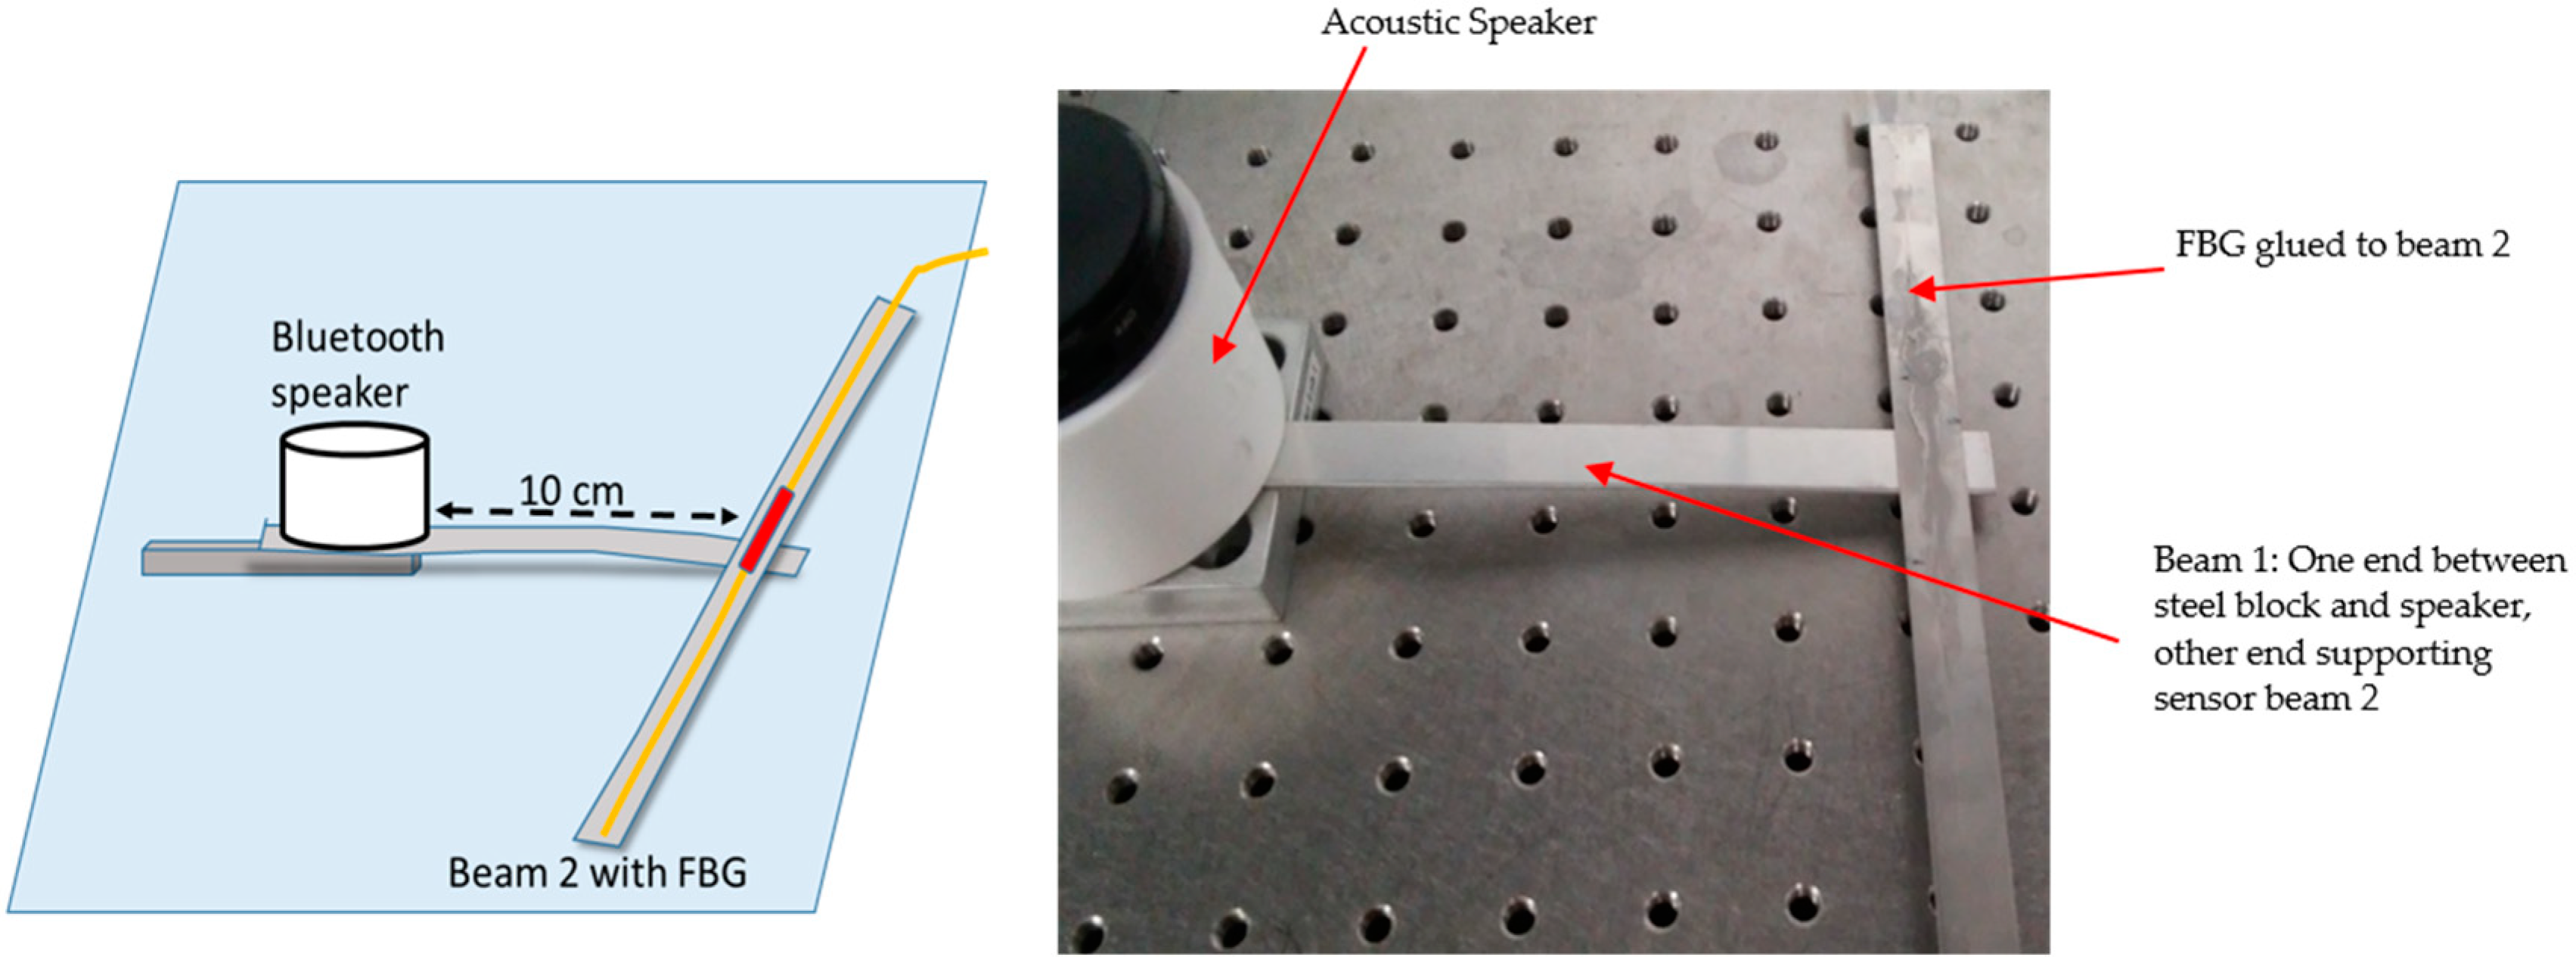
Figure 1 shows one of the configurations used to test the sensor (case 1) for detecting different vibrational frequencies. A metallic block was placed on an optical table. A beam with a length of 15 cm and thickness of 1 mm was placed with one end on the block and the other end free, which is a similar position to cantilevers. Beam 1 was weighed down with an acoustic speaker, which was termed the fixed end. The speaker was placed face down to allow better coupling of the sound to the metal. The sensing beam was placed without fasteners on the free end of beam 1. Several orientations of this configuration were tested with the ends of the beam 2: both taped-free; both touching the table; or one end touching the table and the other end free to oscillate. The FBG was either attached to the wedge point or within 5 cm distance of it. All the tests were repeated several times and the selected cases were analyzed in the next section.
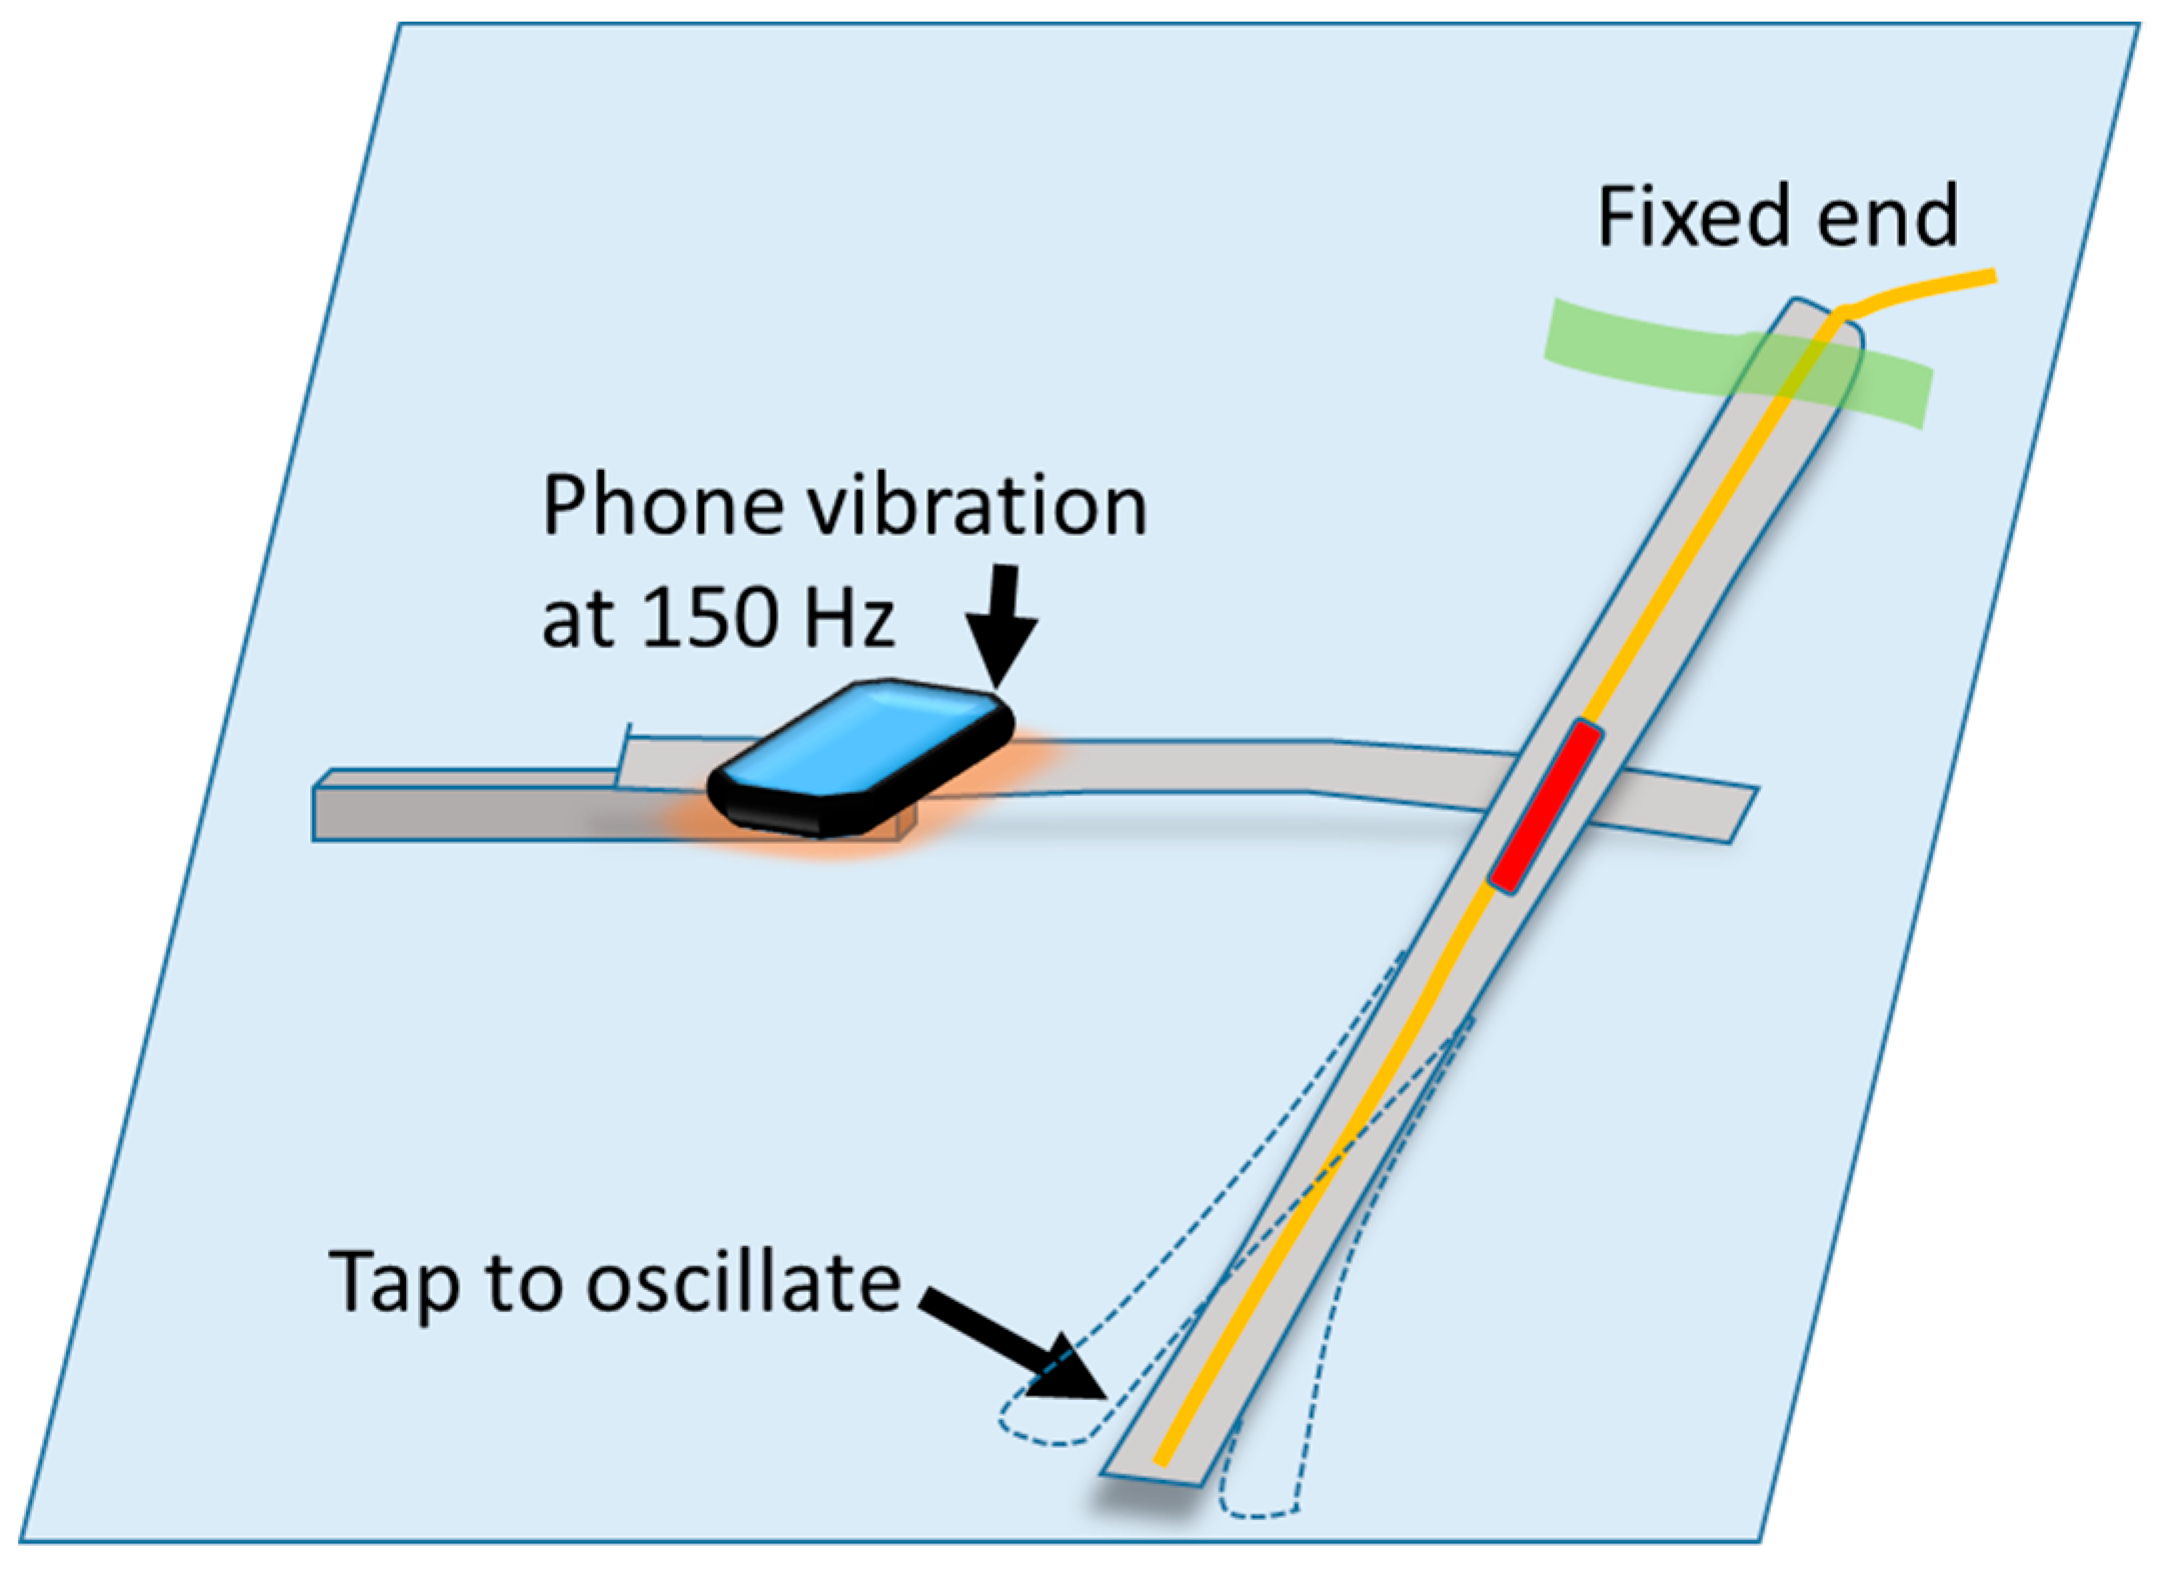
Figure 2 shows the schematic for case 2 where a phone is replaced as the acoustic source. The setup is used for testing the vibrations of a phone, which is superposed on the oscillations of beam 2.
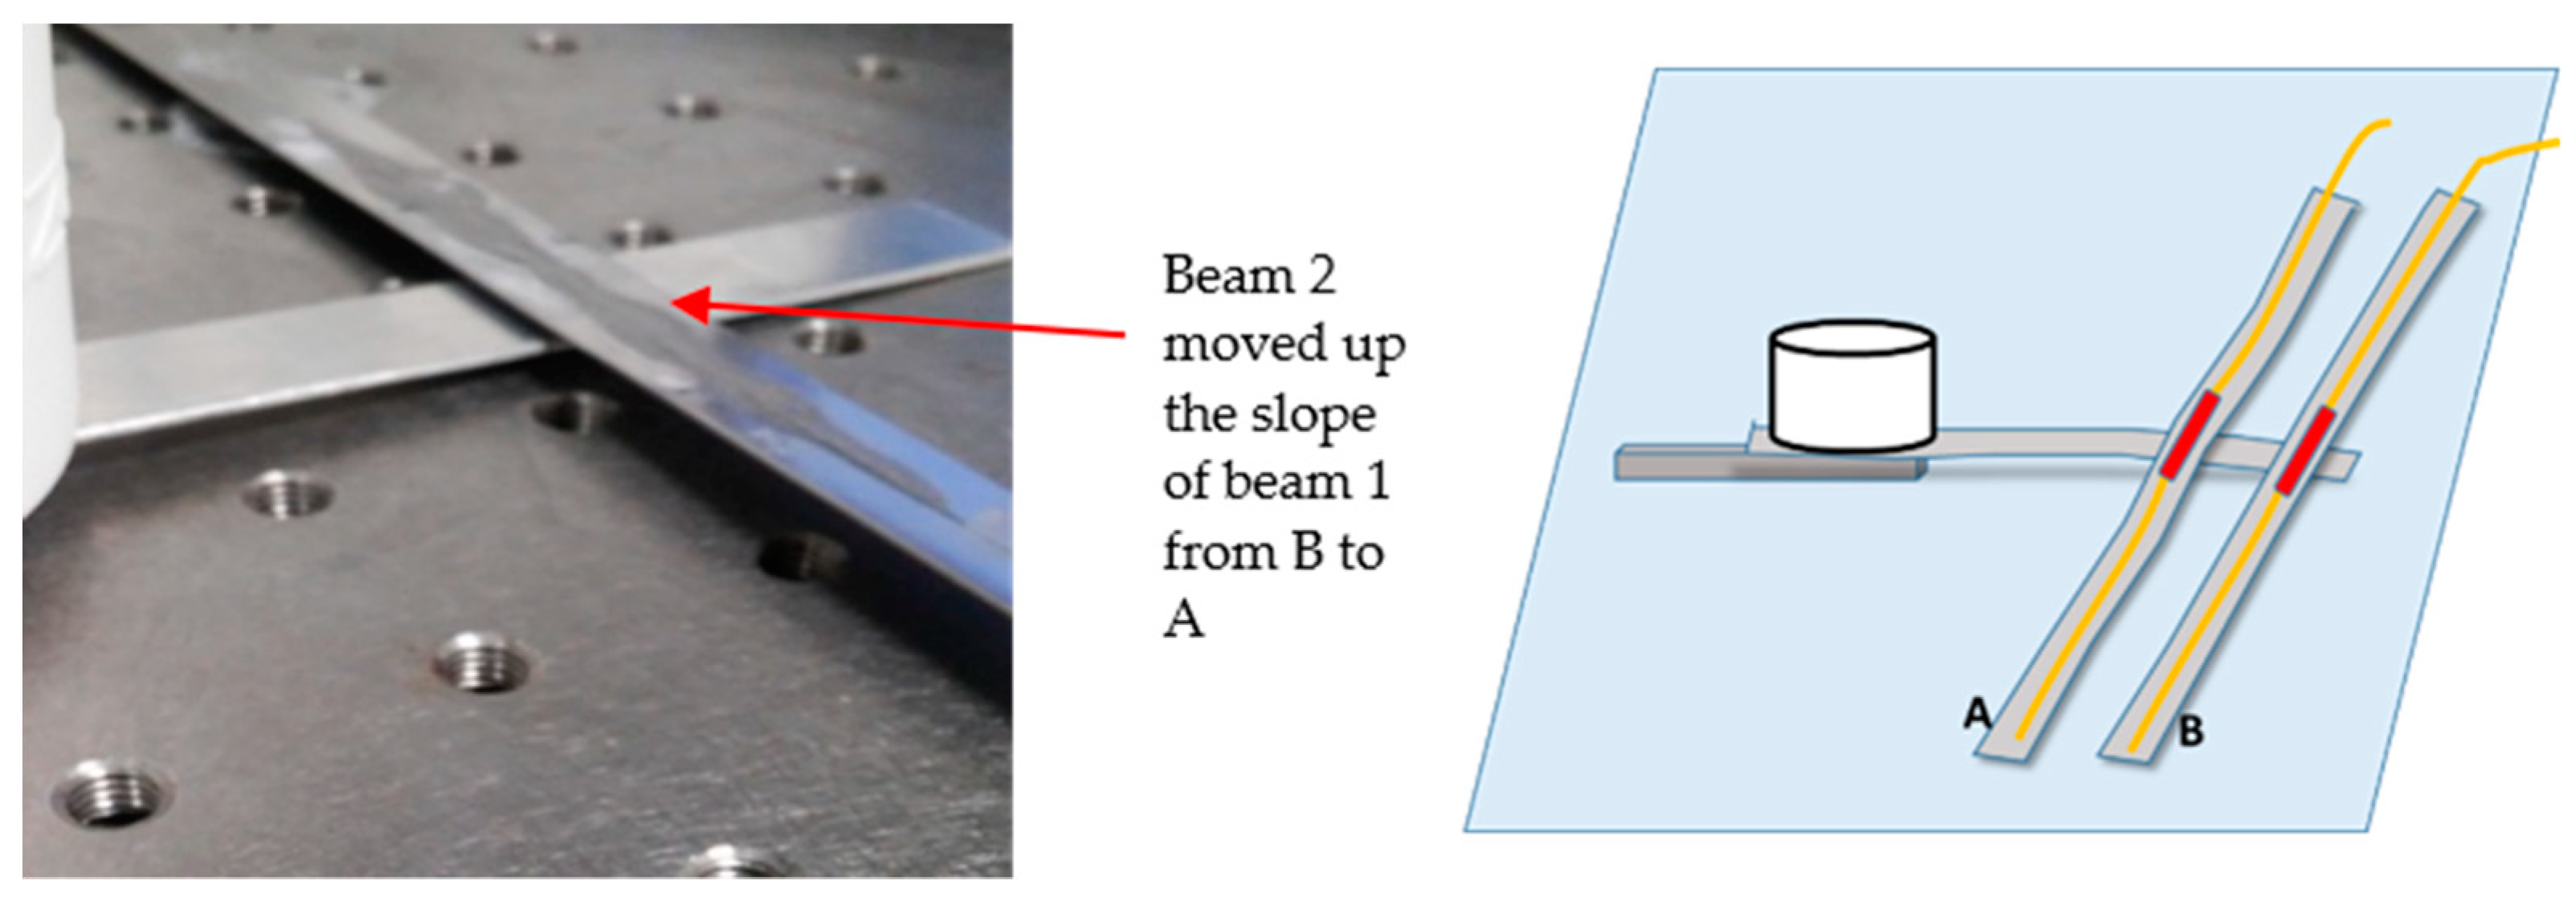
Figure 3 shows the picture and the schematic used for case 3, where the sensing beam 2 was moved closer to the Bluetooth speaker (from B to A). In this measurement configuration, the sensing beam was placed a few cm away from the free end. Since the sensing beam is pliant and flexible, this configuration introduces a higher tensile pre-strain in the FBG, which causes the baseline to shift to a higher wavelength. In case 4, similar tests were conducted by flipping the sensor aimed to ascertain whether the orientation of the FBG-bearing side changed the response to vibrations.
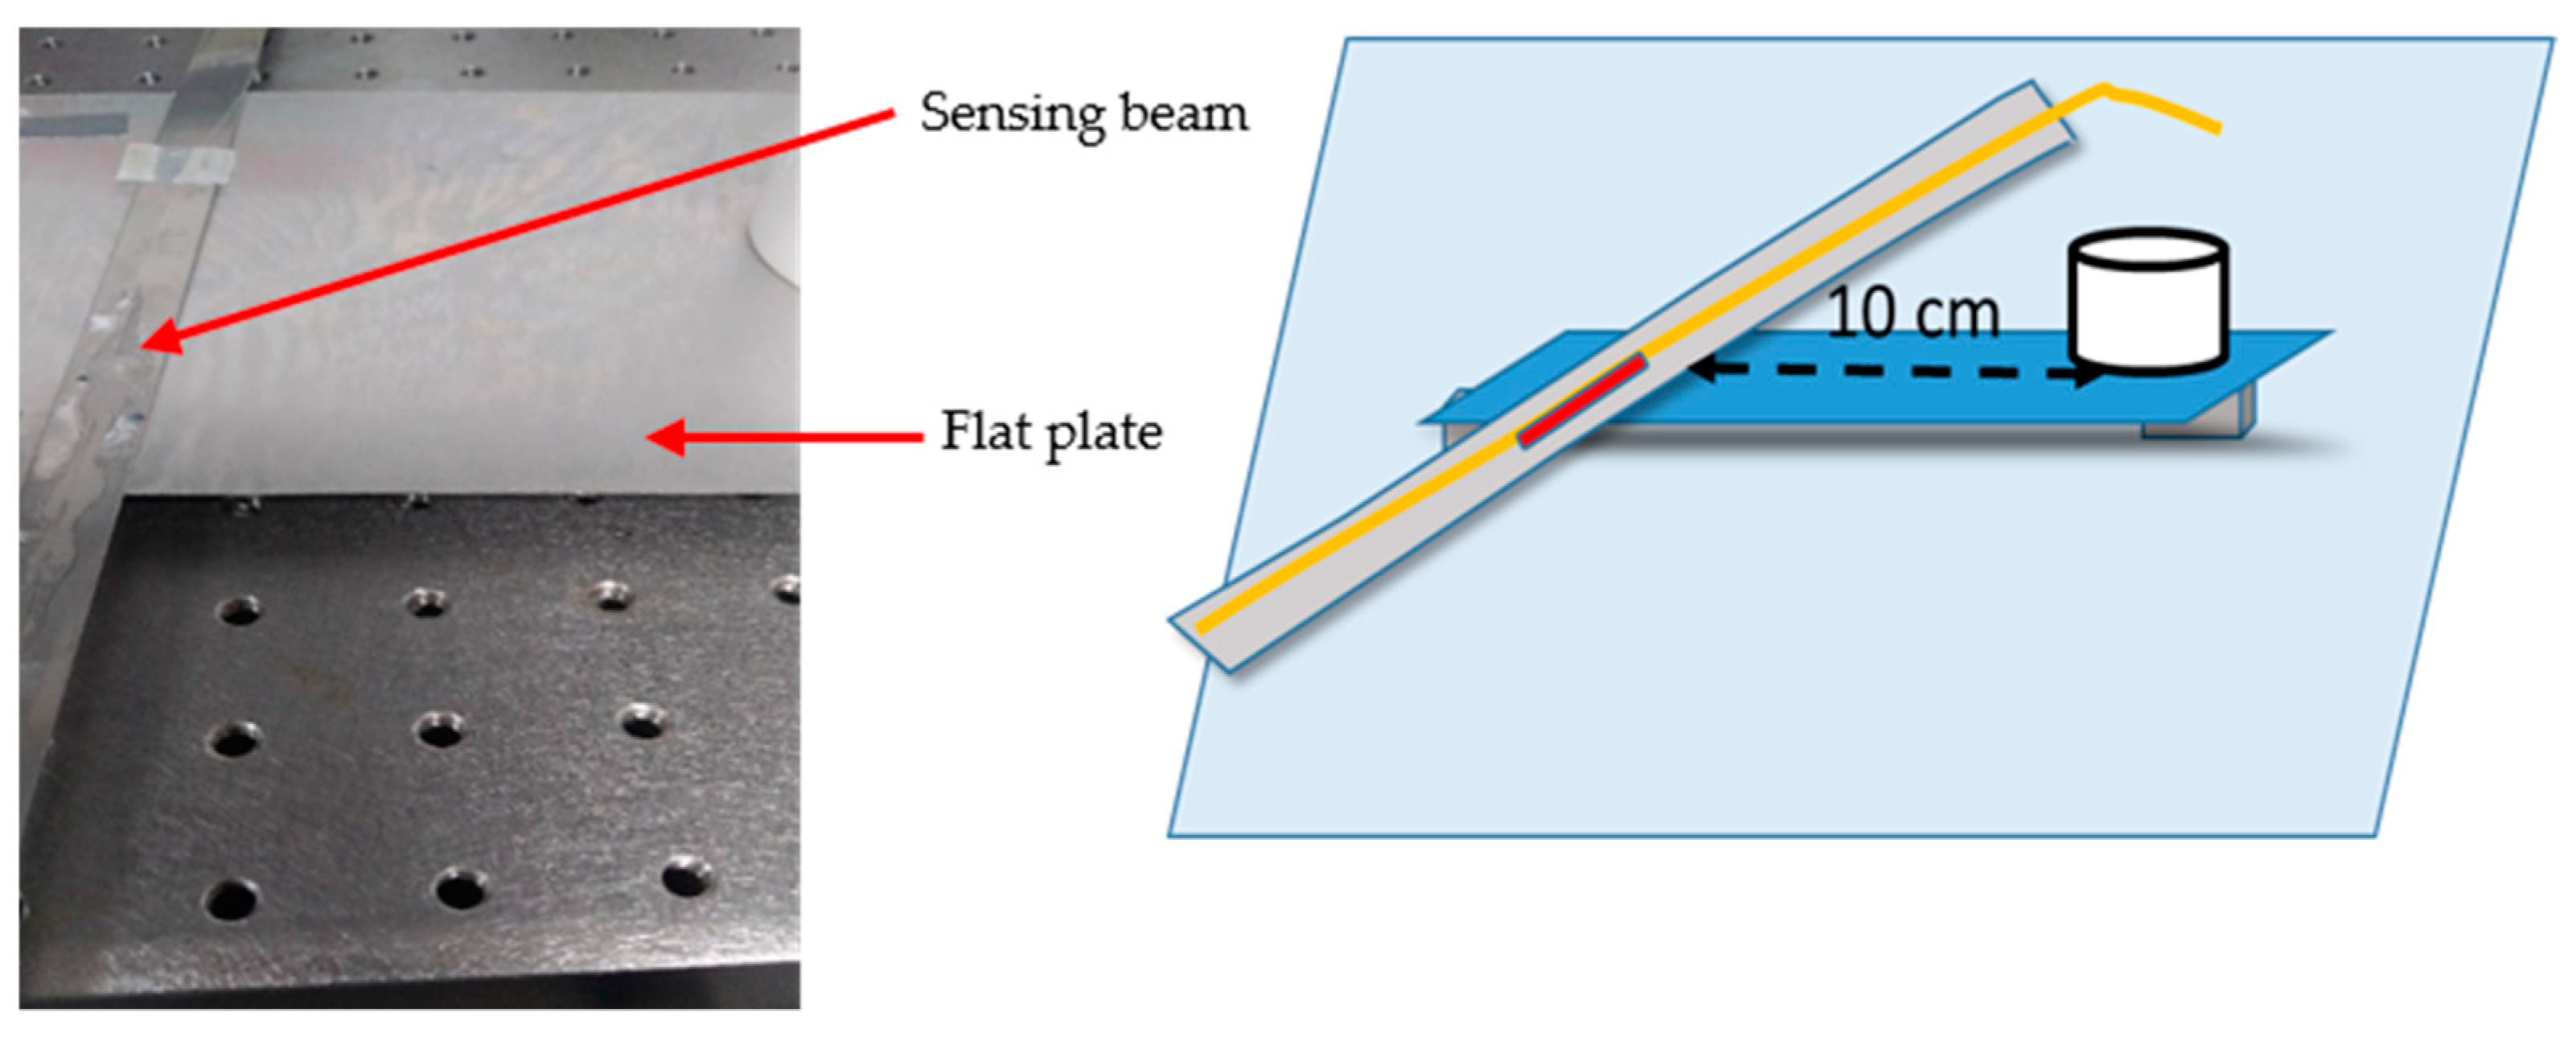
Figure 4 shows the experimental configuration of case 5, which was conducted with the sensing beam placed on a flat aluminum plate. Furthermore, this beam was simply supported along two edges. The speaker was placed near one edge and the sensor beam was placed near the other edge. The distance between the edge of the speaker and the sensing beam was more than 10 cm. These laboratory tests were followed by field tests where the sensor was tested with an operational three-phase motor (case 6).
3. Results and Discussion
The results obtained from the different cases are presented in this section. For case 1 (
Figure 1), the speaker was used to play sine tones of different frequencies to generate acoustic vibrations. The time-dependent response of the wavelength shift of the FBG was recorded with the MOI.
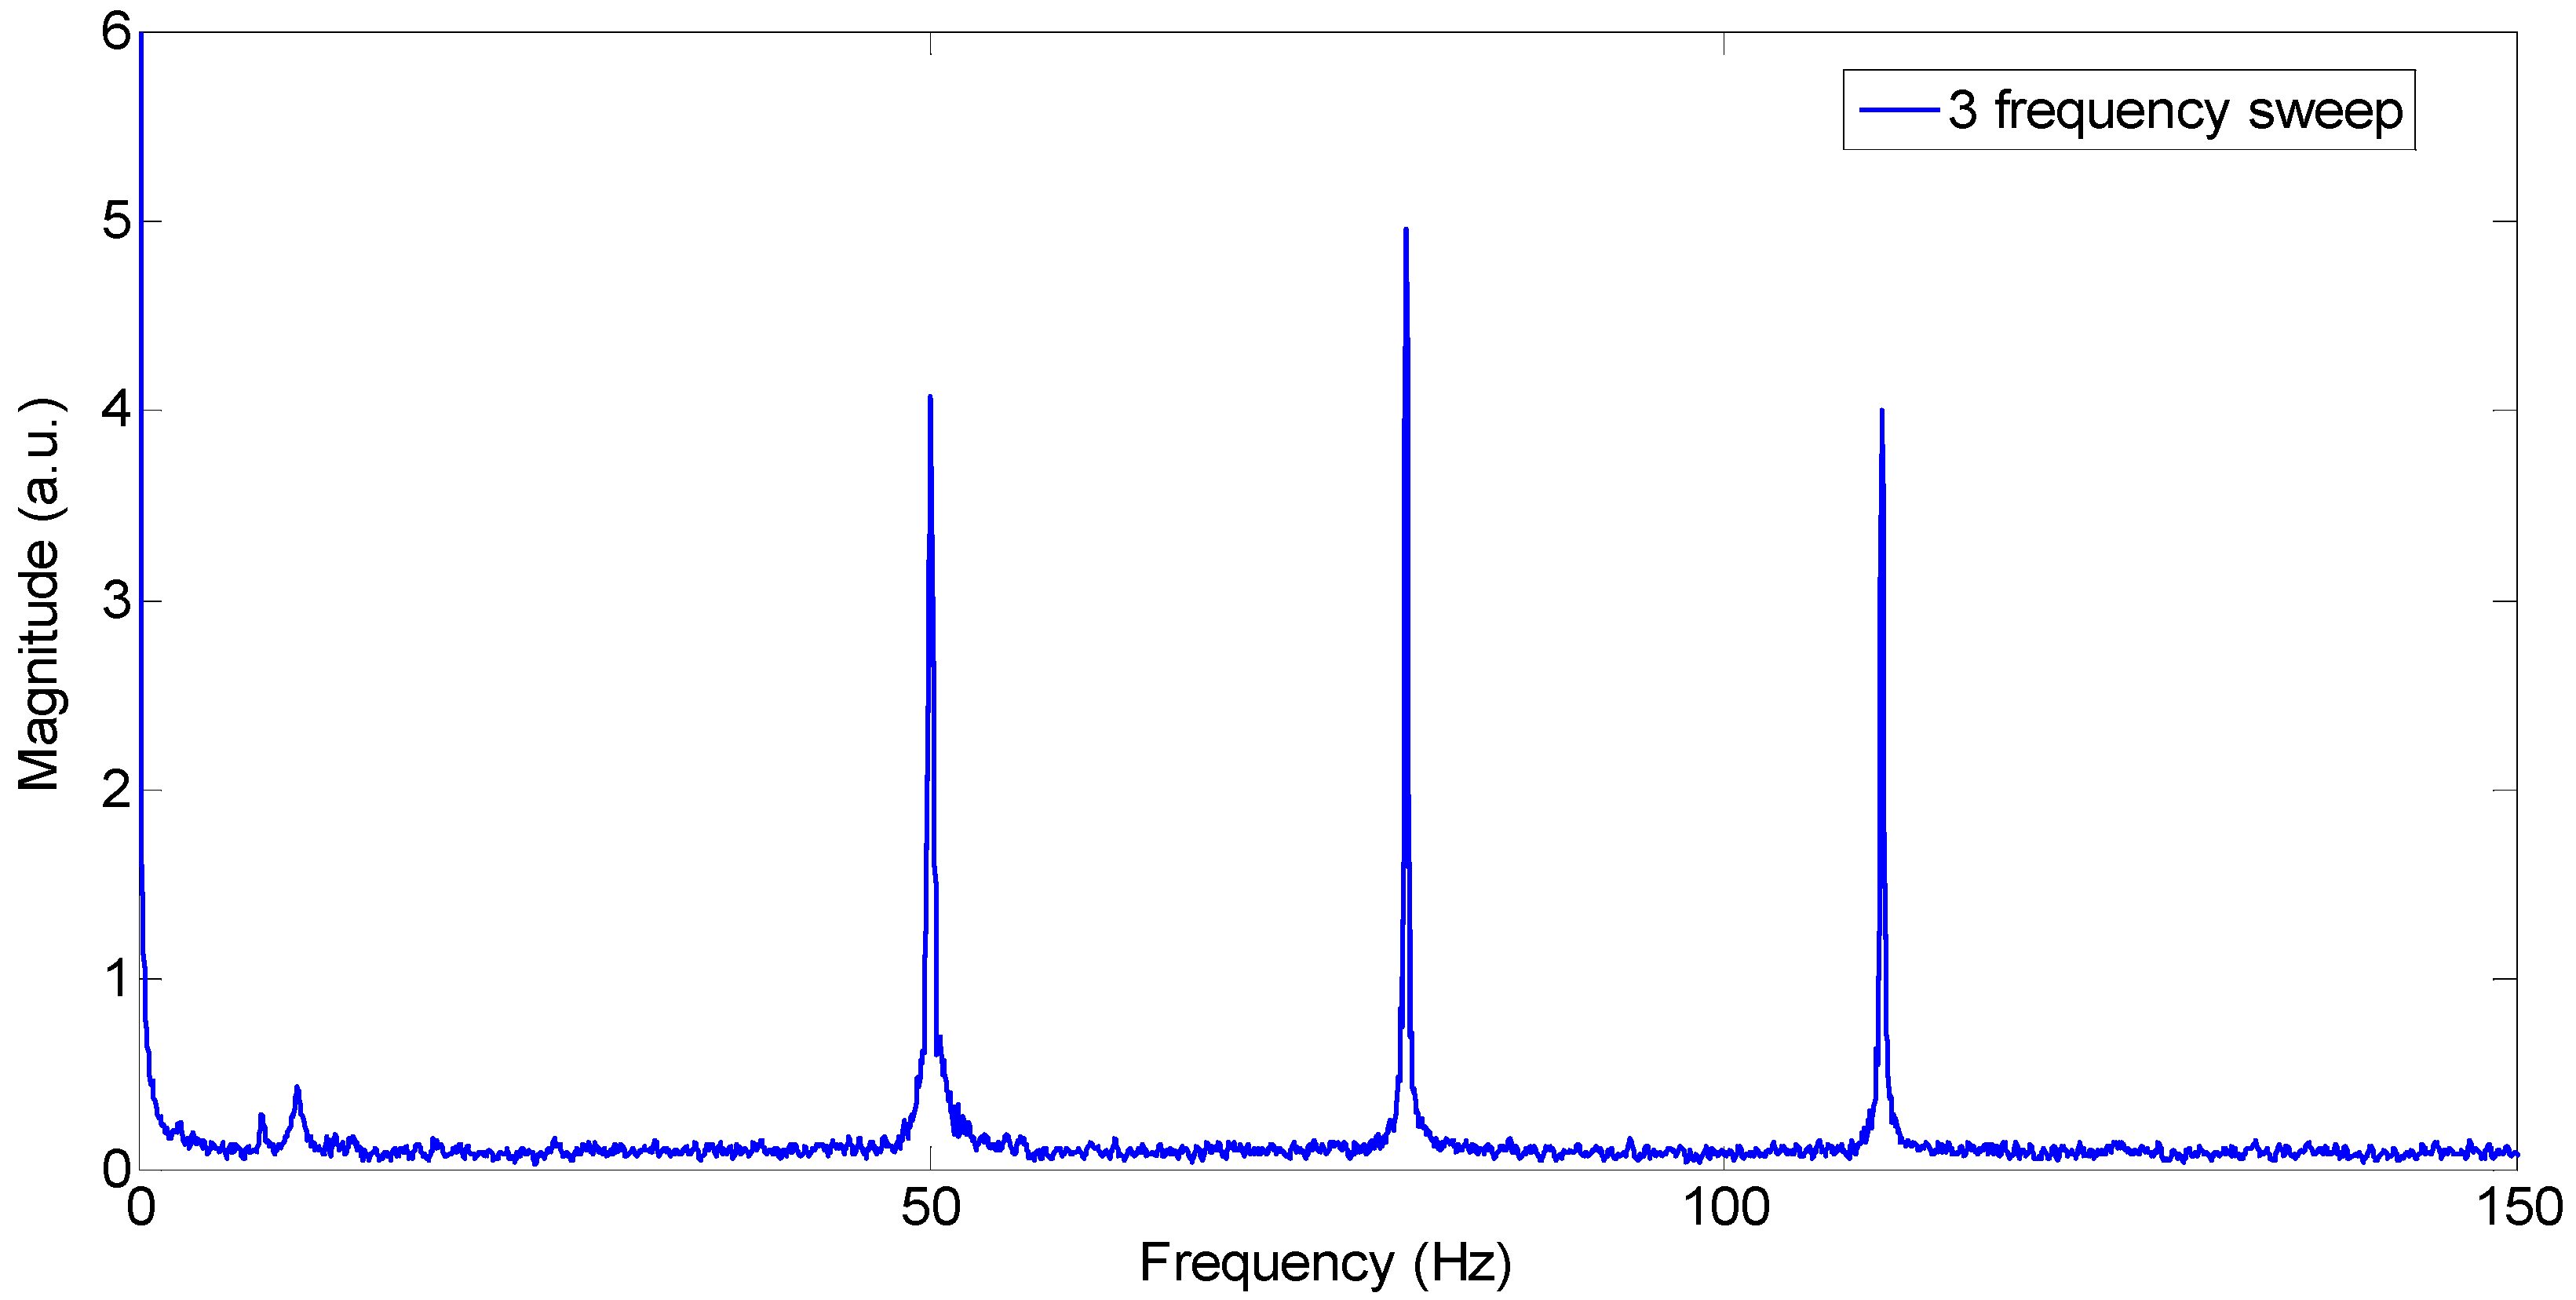
Figure 5 shows the FFT of the wavelength shift data. In this case, the frequencies of 50 Hz, 80 Hz and 110 Hz were swept one after the other after using the speaker for different periods of time. The difference in the number of samples results in different magnitudes although all three frequencies are detected. The sensing beam oscillation is negligible in comparison throughout the three-frequency sweep, which is shown as the small peak under 10 Hz. Due to the experimental arrangement and flexibility of the beam 2, the ends are touching the table. However, the FBG detects the forced vibrations.
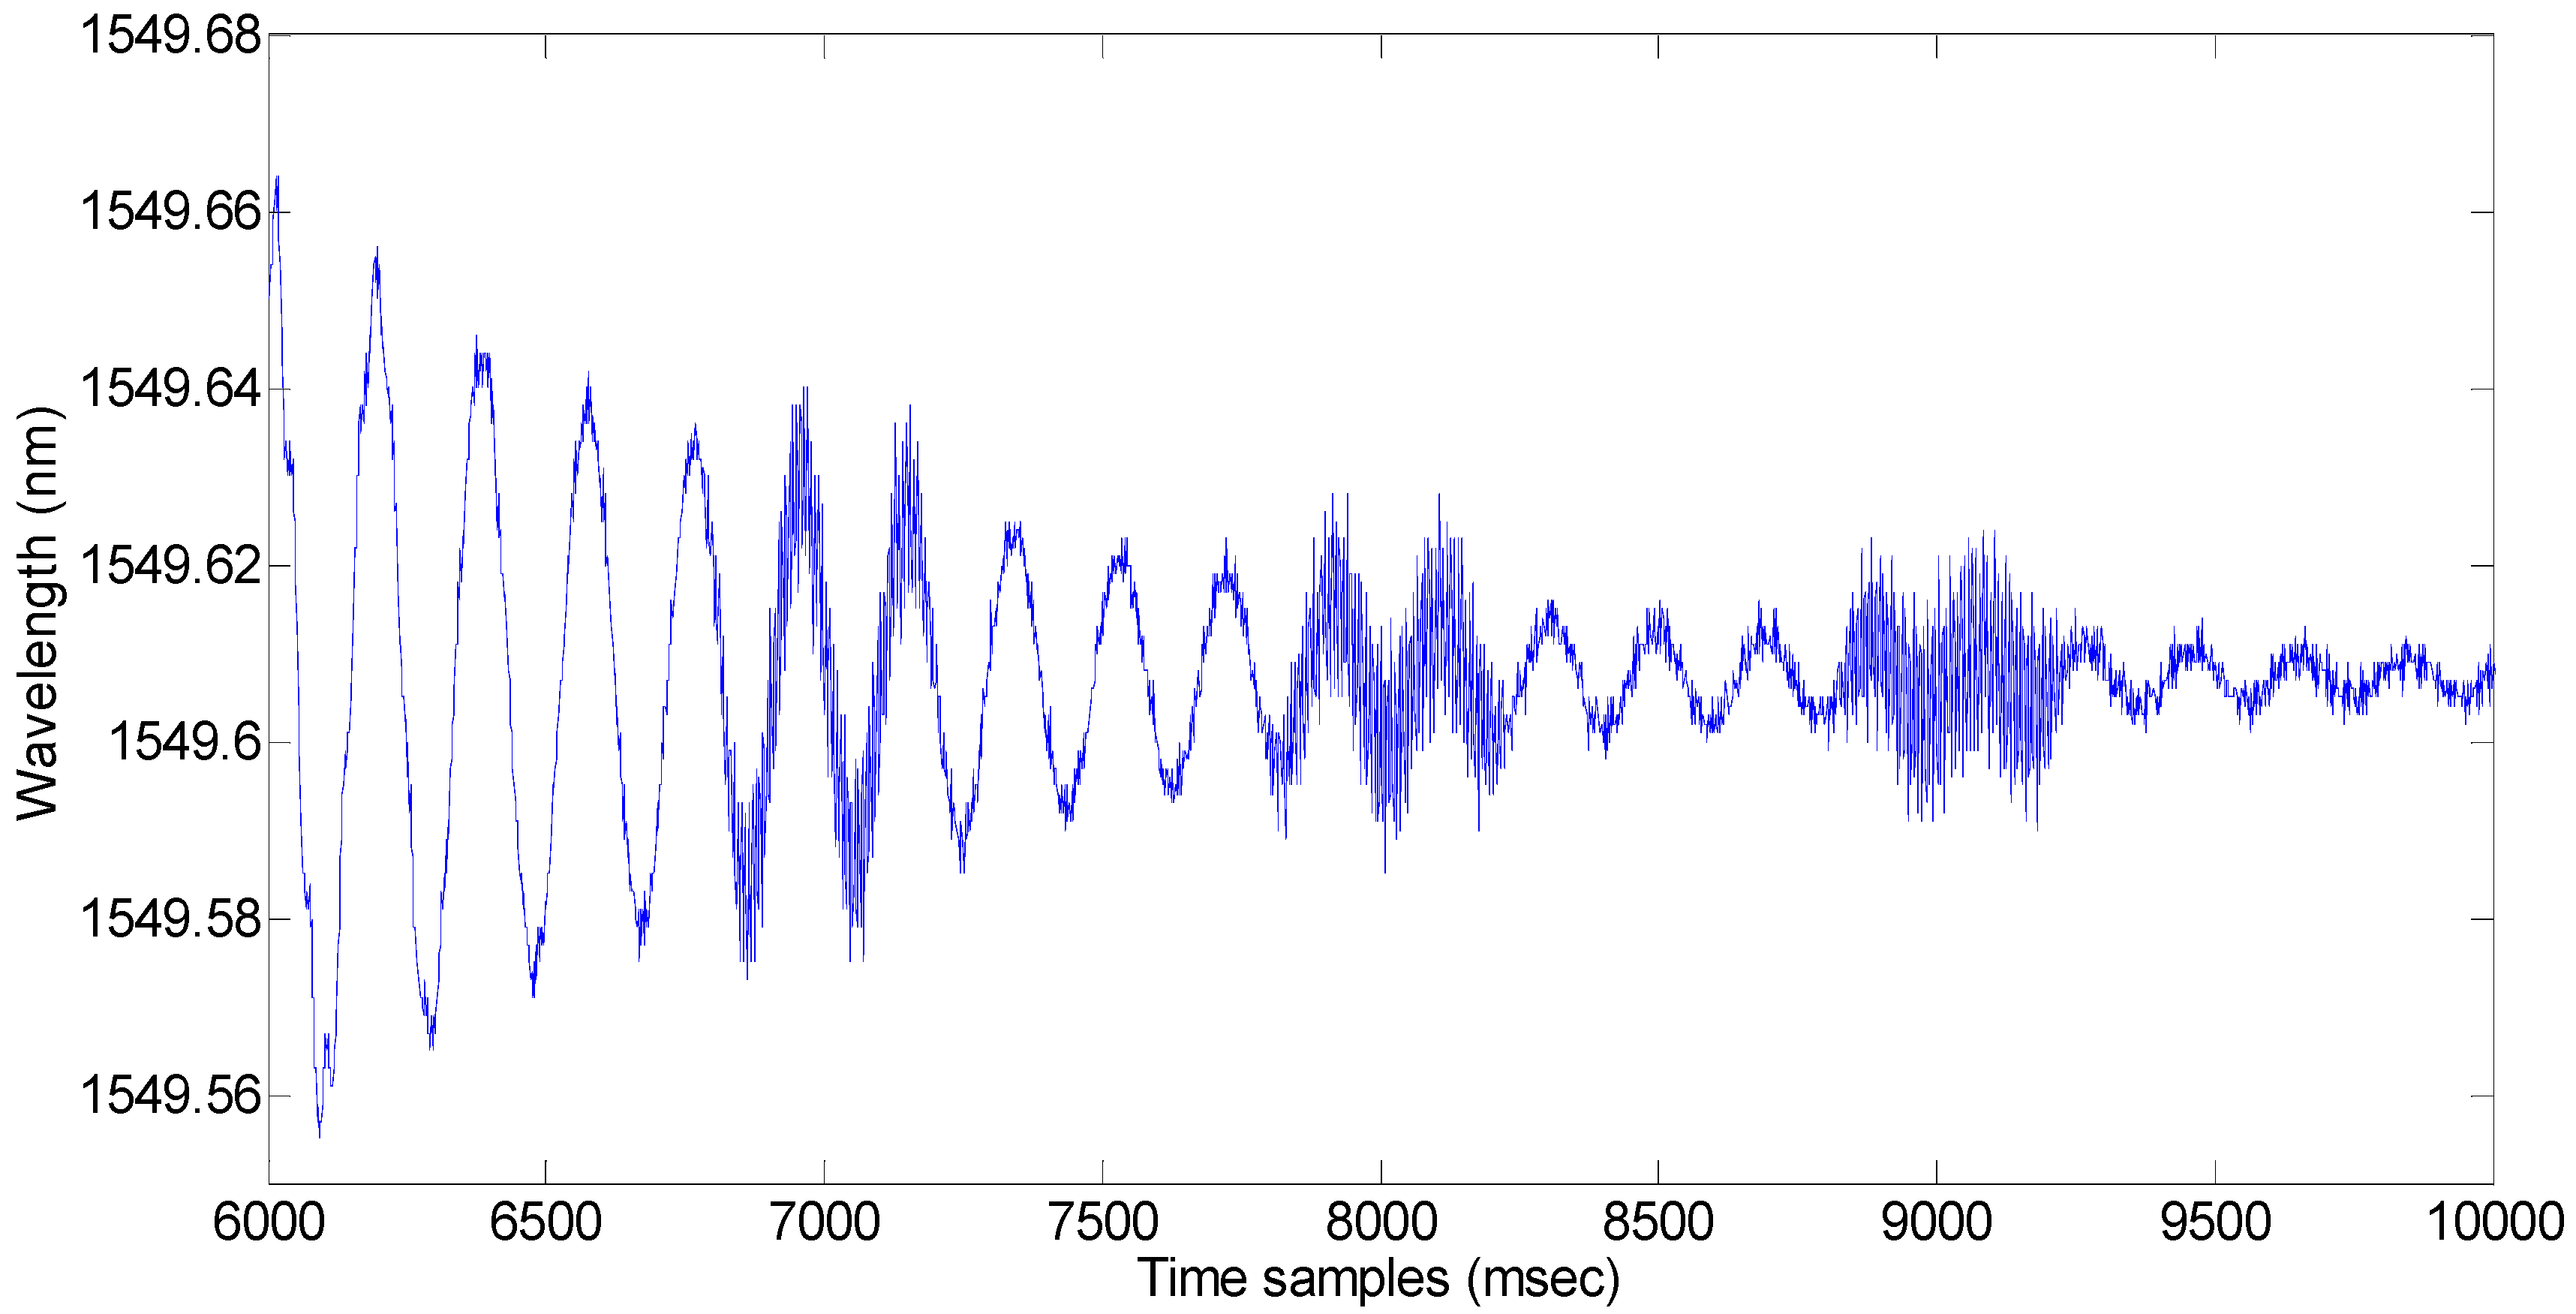
Figure 6 shows the time-dependent oscillation of the sensing beam with the pulsed vibrations that are superposed. The oscillation was generated by gentle tapping of the free end of beam 2 (
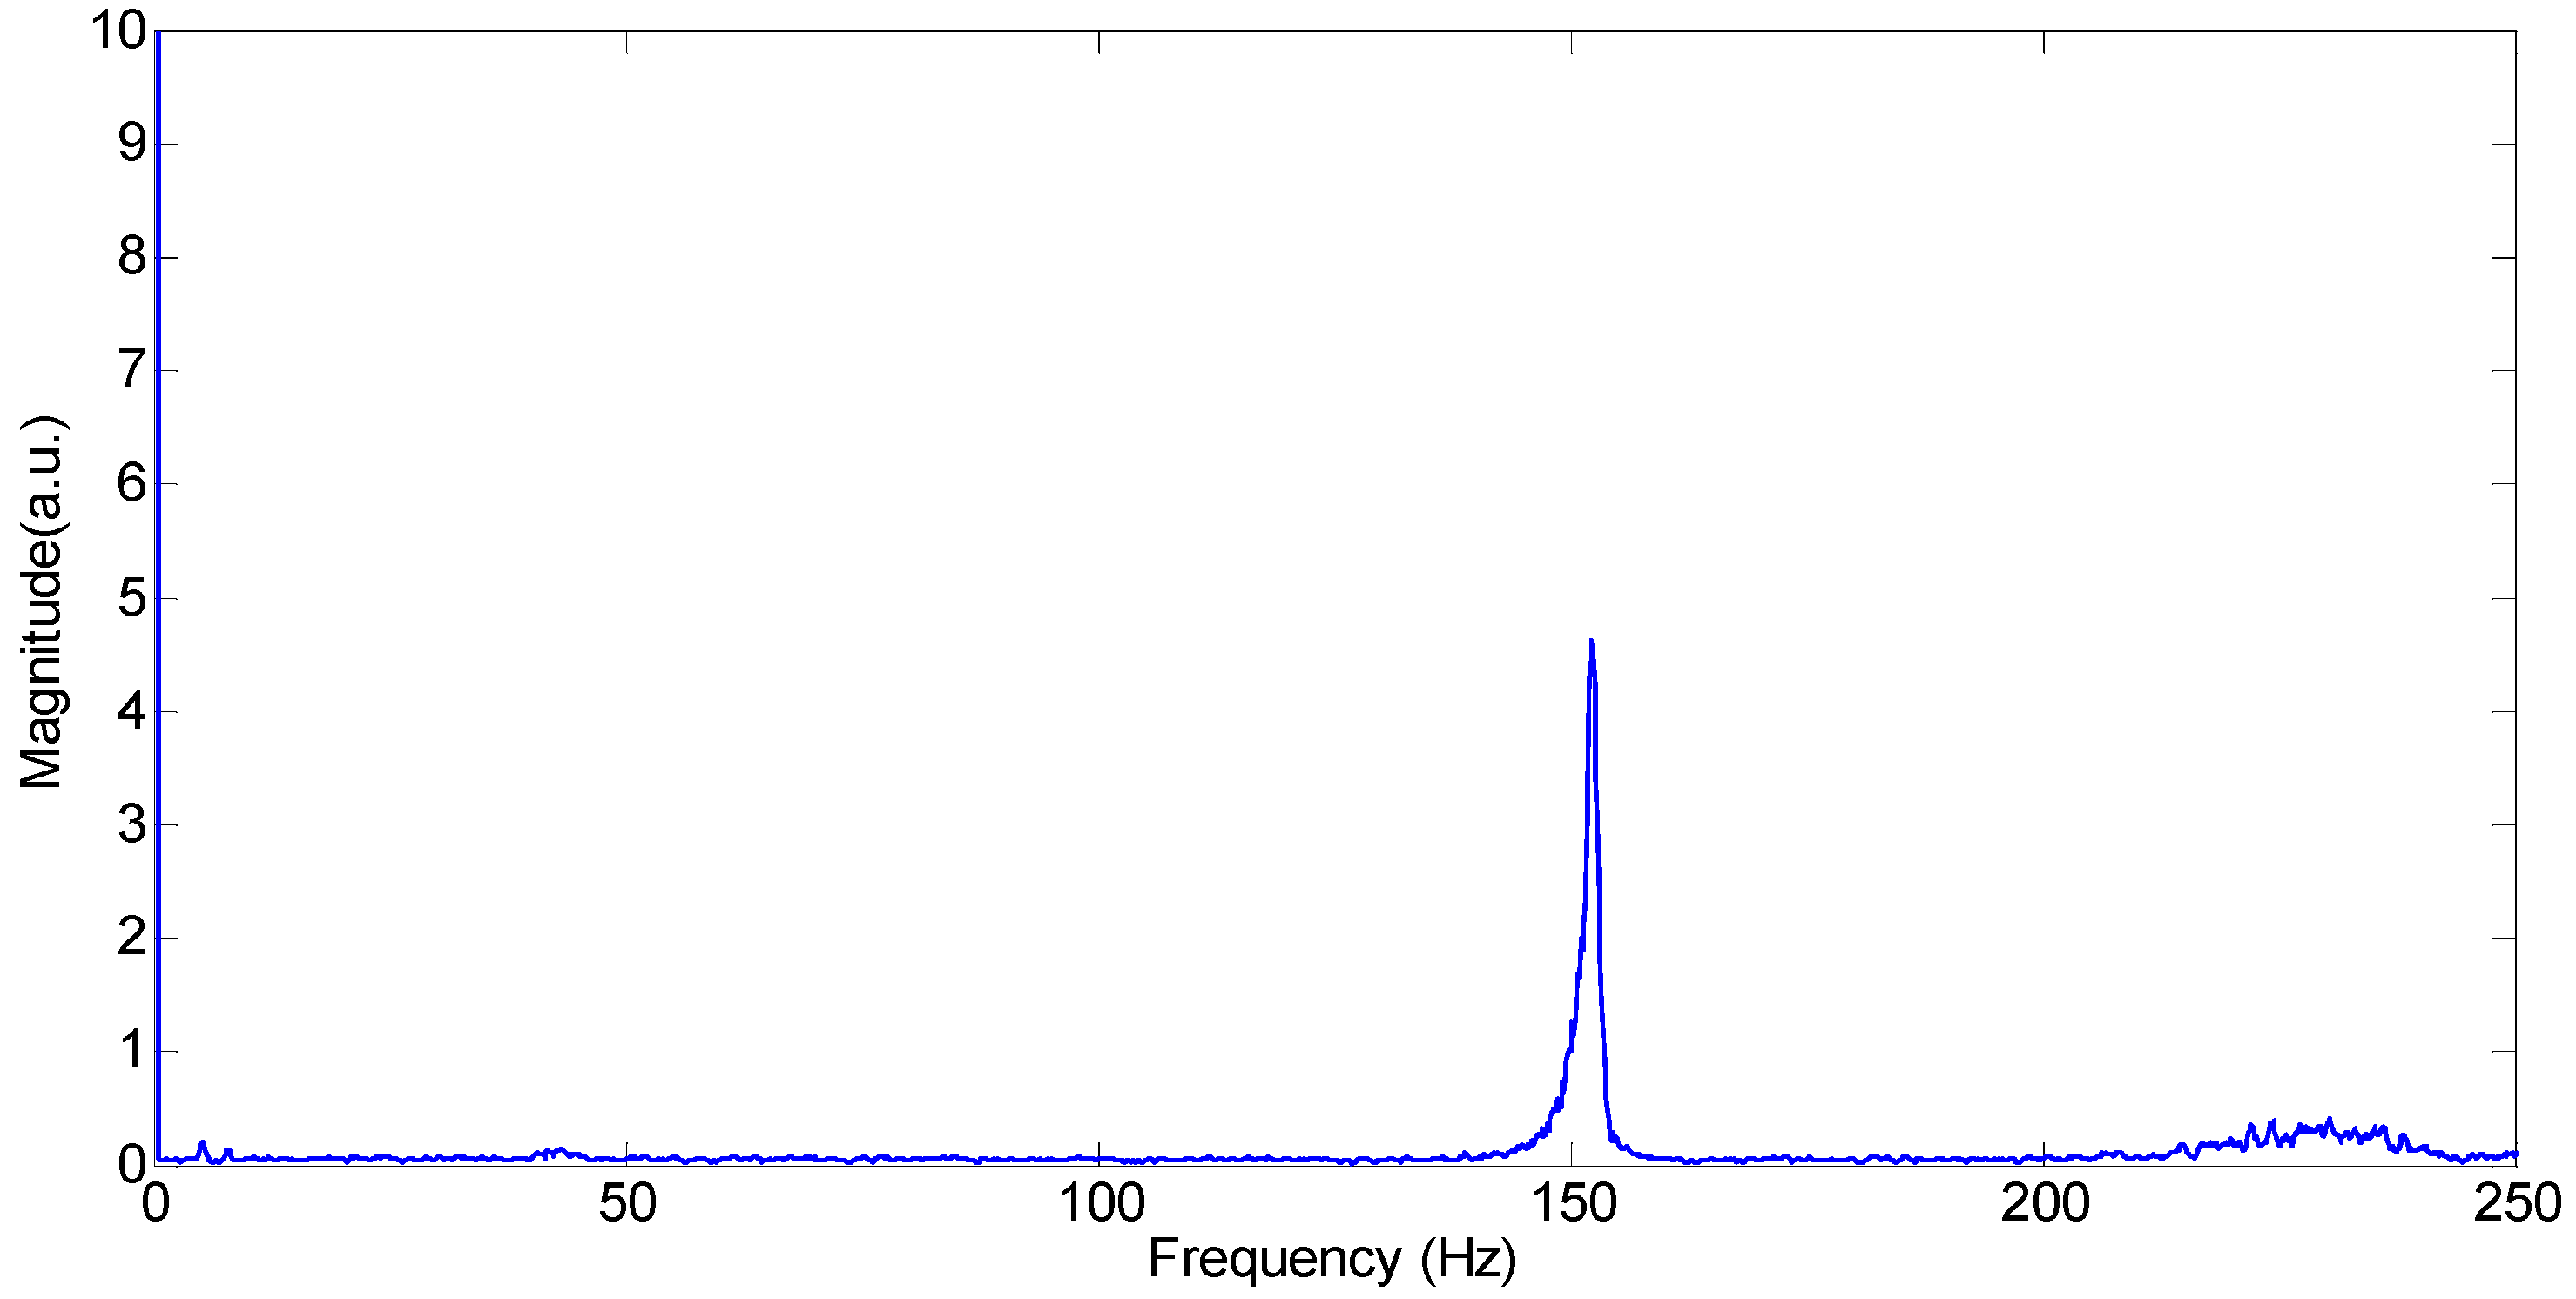
Figure 2). In this case (case 2), the wedge end had a phone vibrating in beeps. The vibration was automatically superposed on the cantilever oscillation although there was a gap of several cm on beam 1. The vibration was applied in pulses due to the pattern of beeps selected as the cantilever was oscillating. When the cantilever oscillates at its natural frequency, the vibration is at frequencies of around 7–15 Hz, which depends on the length of the beam that is unconstrained. However, the superposed phone vibration is around 150 Hz. The forced vibration is detected by the sensor although it occurs together with the low frequency oscillation. The phone vibration was identified separately with a National Instruments (NI, Austin, TX, USA) accelerometer connected to NI SignalExpress system (2012). The PSD (power spectrum distribution) showed that the peak frequency of the vibration beeps was near 150 Hz.
Figure 7 shows the FFT of the time-domain signal that is plotted in
Figure 6. In this case, the relative magnitude of the low frequency peak due to oscillation is higher than the forced vibration at 150 Hz (phone vibration). However, when the cantilever oscillation dies down and the pulsed vibration of the phone continues (
Figure 8), the FFT data shows that the 150 Hz peak from the phone is the dominant peak (
Figure 9). The section of the time spectrum that is selected in
Figure 8 is the part where the phone vibration is dominant. Due to the low stiffness of the sensing beam, the high frequency vibrations are measured although there is no obvious or visible oscillation of the sensing beam.
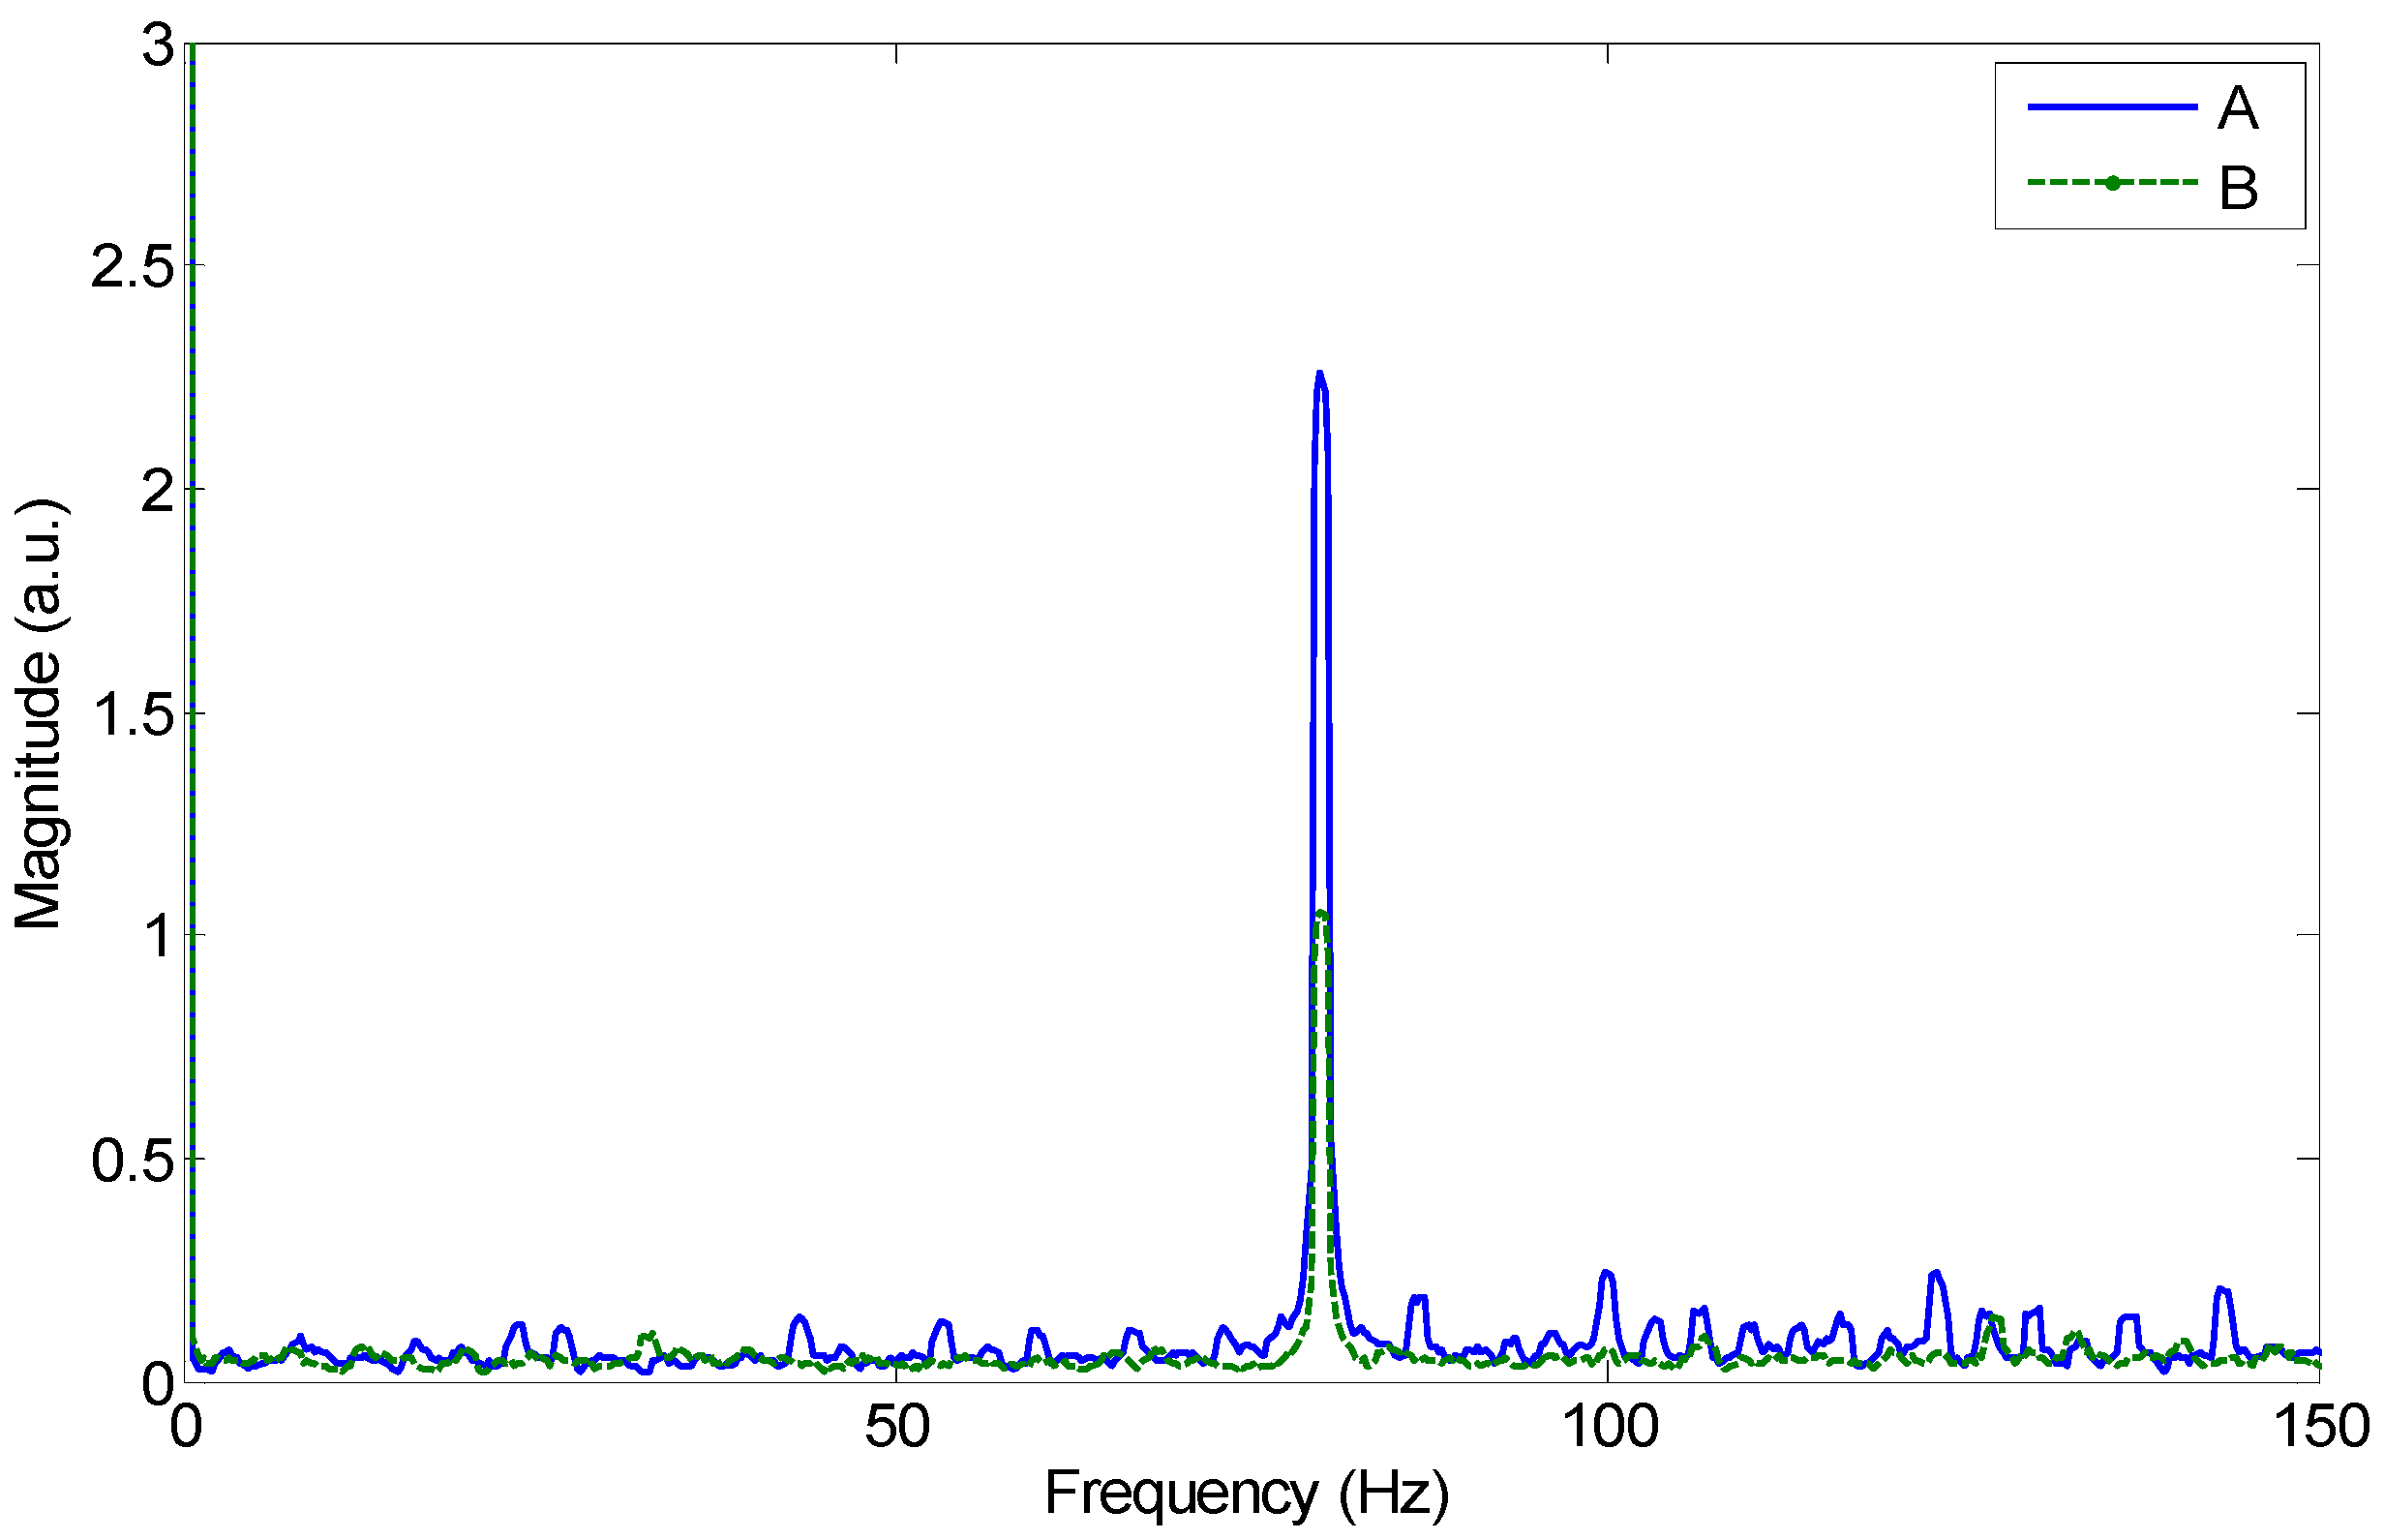
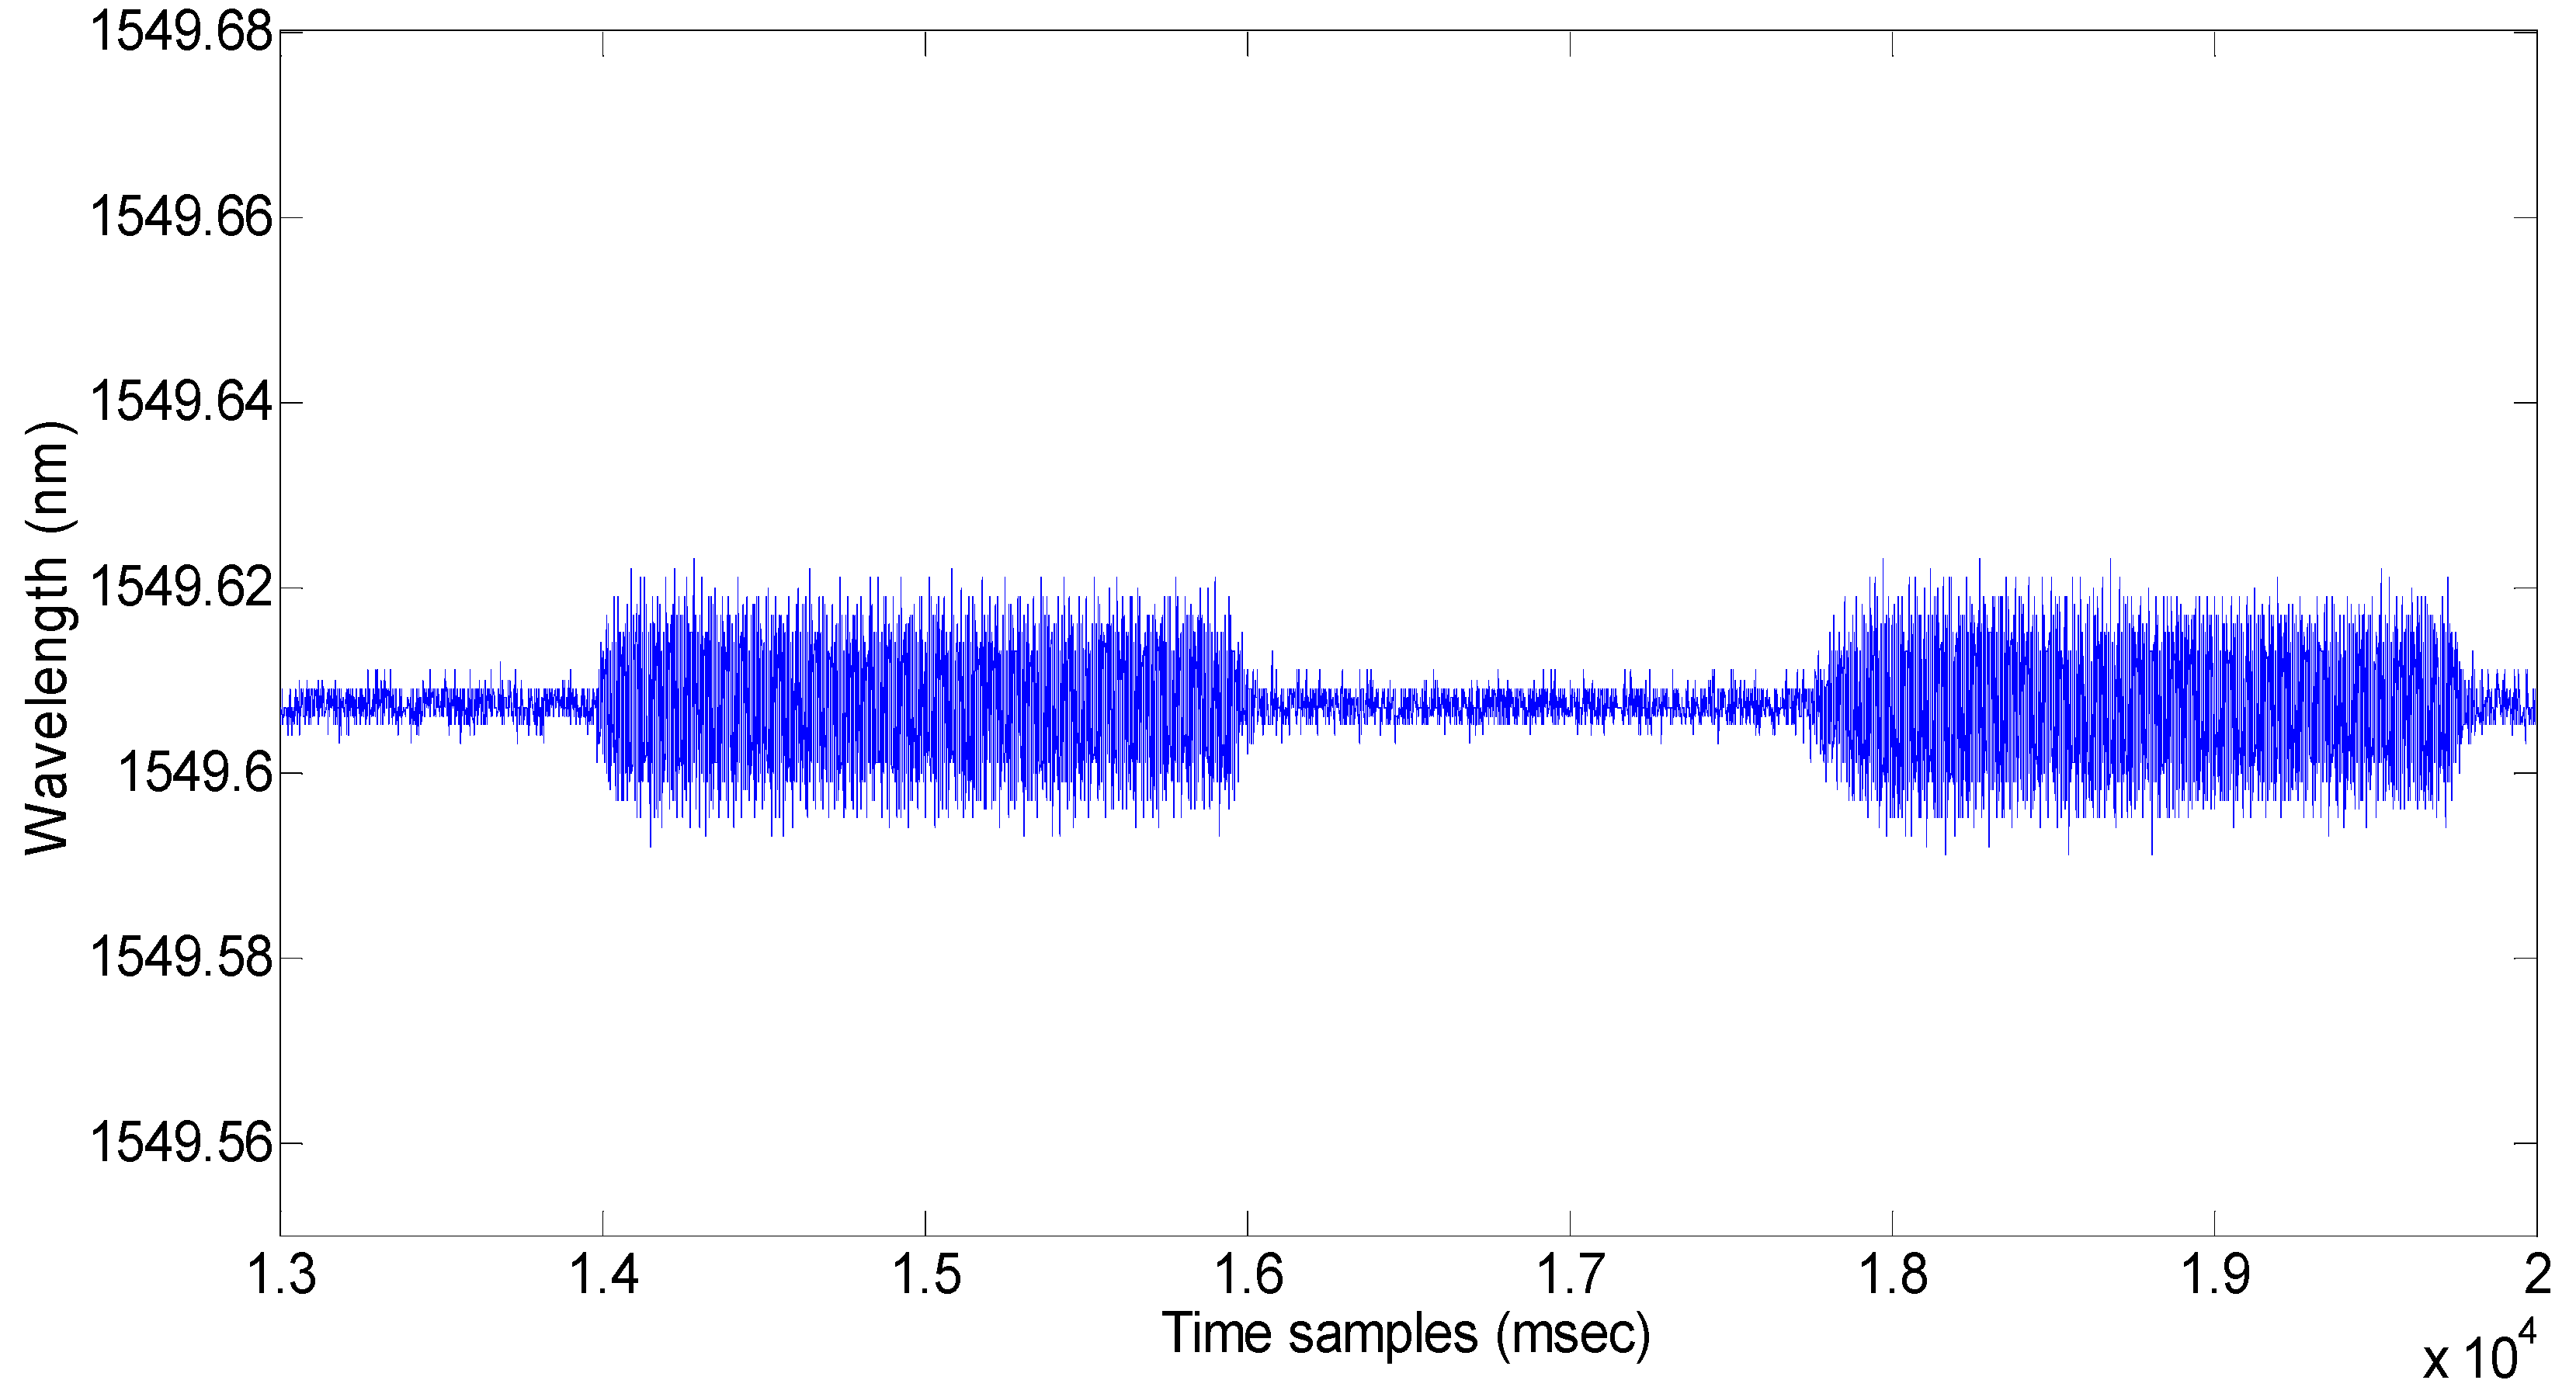
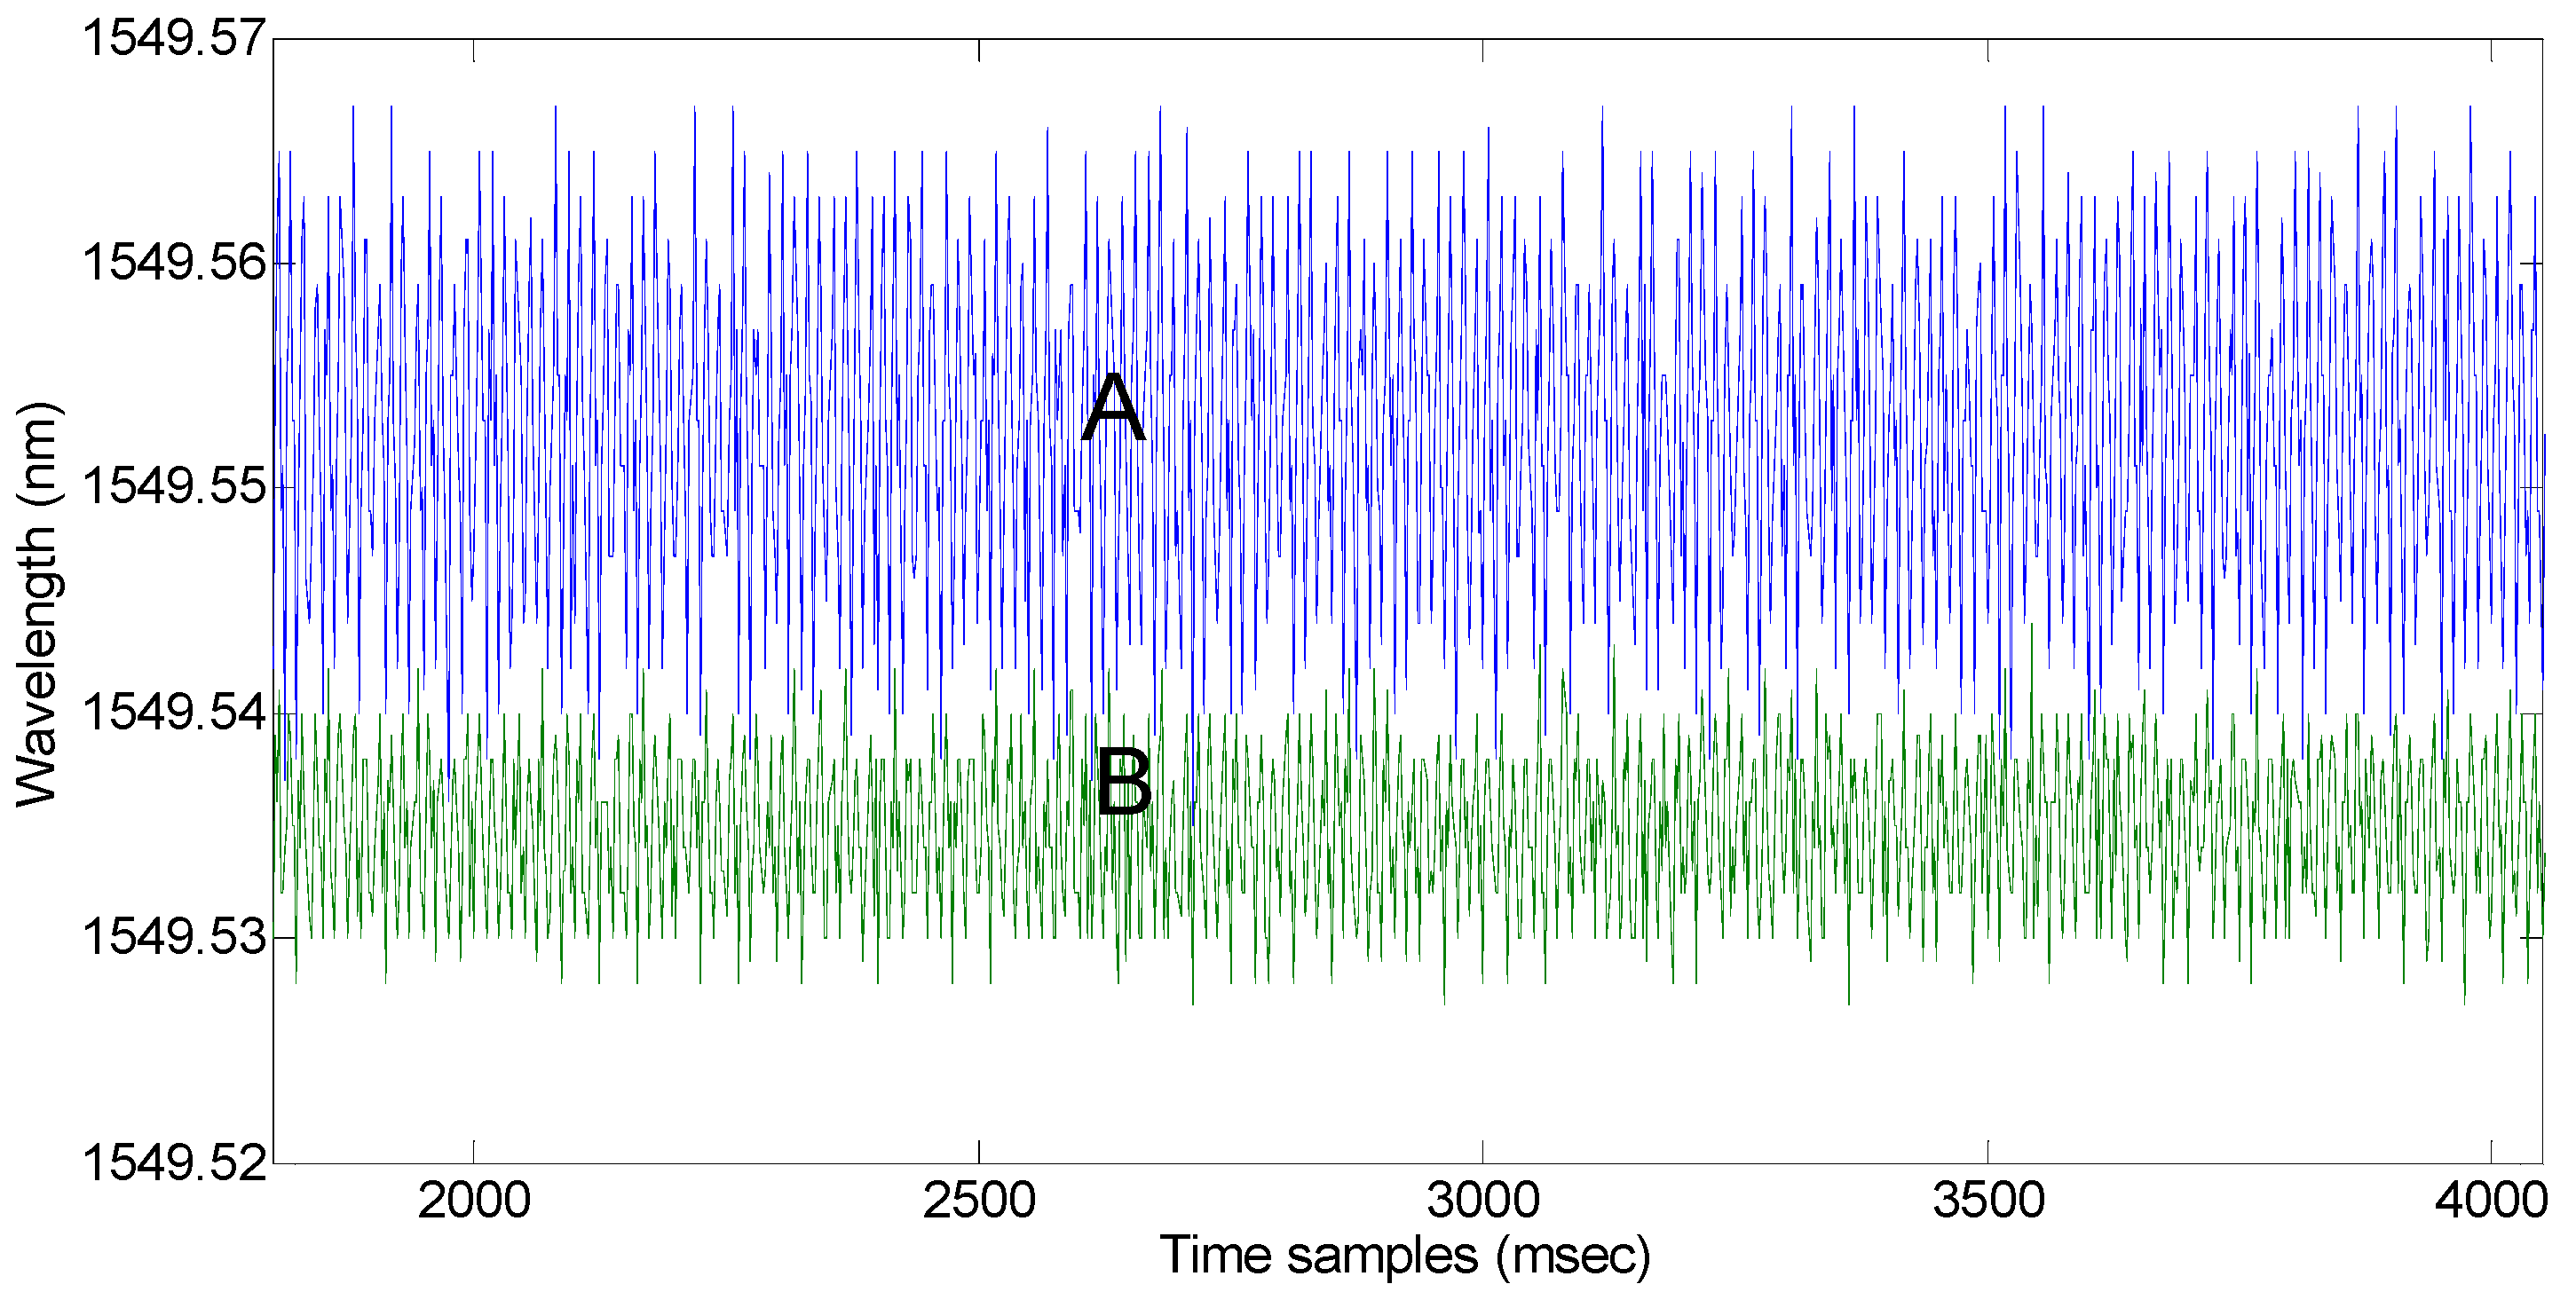
Figure 3 shows the measurement configuration used, with the sensing beam placed a few cm away from the free end (case 3). This configuration introduces a higher tensile pre-strain in the FBG, which causes the baseline to shift (
Figure 10) to a higher wavelength by approximately 0.02 nm. The two spectra marked A and B denote the wavelength shift measured at positions A and B of the sensing beam, respectively. When an 80 Hz signal was used to test both cases with the speaker, the lower baseline had a relatively lower peak than the higher baseline (
Figure 11). This may be because the sensor was effectively moved closer to the acoustic source and received a higher amplitude. The same number of samples was used to calculate the FFT in both cases. Normalizing the two signals with reference to the central wavelength also yielded similar spectra. In this case, there is also no oscillation of the beam and no peak located around 10 Hz. These tests have been successfully repeated in several configurations and with different types of wedges and plates. When the gap is in the range of 10 cm, the sensor can detect frequencies up to 200 Hz. These results prove that the sensor can be attached to vibrating structures with metal conduits to measure the vibrational frequencies. All the beams and plates used were made of aluminum. Beam 1 was also tested as a sensing beam but its stiffness was higher and it was not sensitive to the forced vibrations. Thus, we may conclude that increasing the thickness or reducing the length can contribute to higher stiffness. Furthermore, when beam 2 was completely flat on the optical table and the speaker was placed on top of it at 10 cm from the FBG location, the sensitivity was zero. Thus, it is important to place the sensing beam in a position where it can flex in both directions to allow for the presence of compressive and tensile stresses.
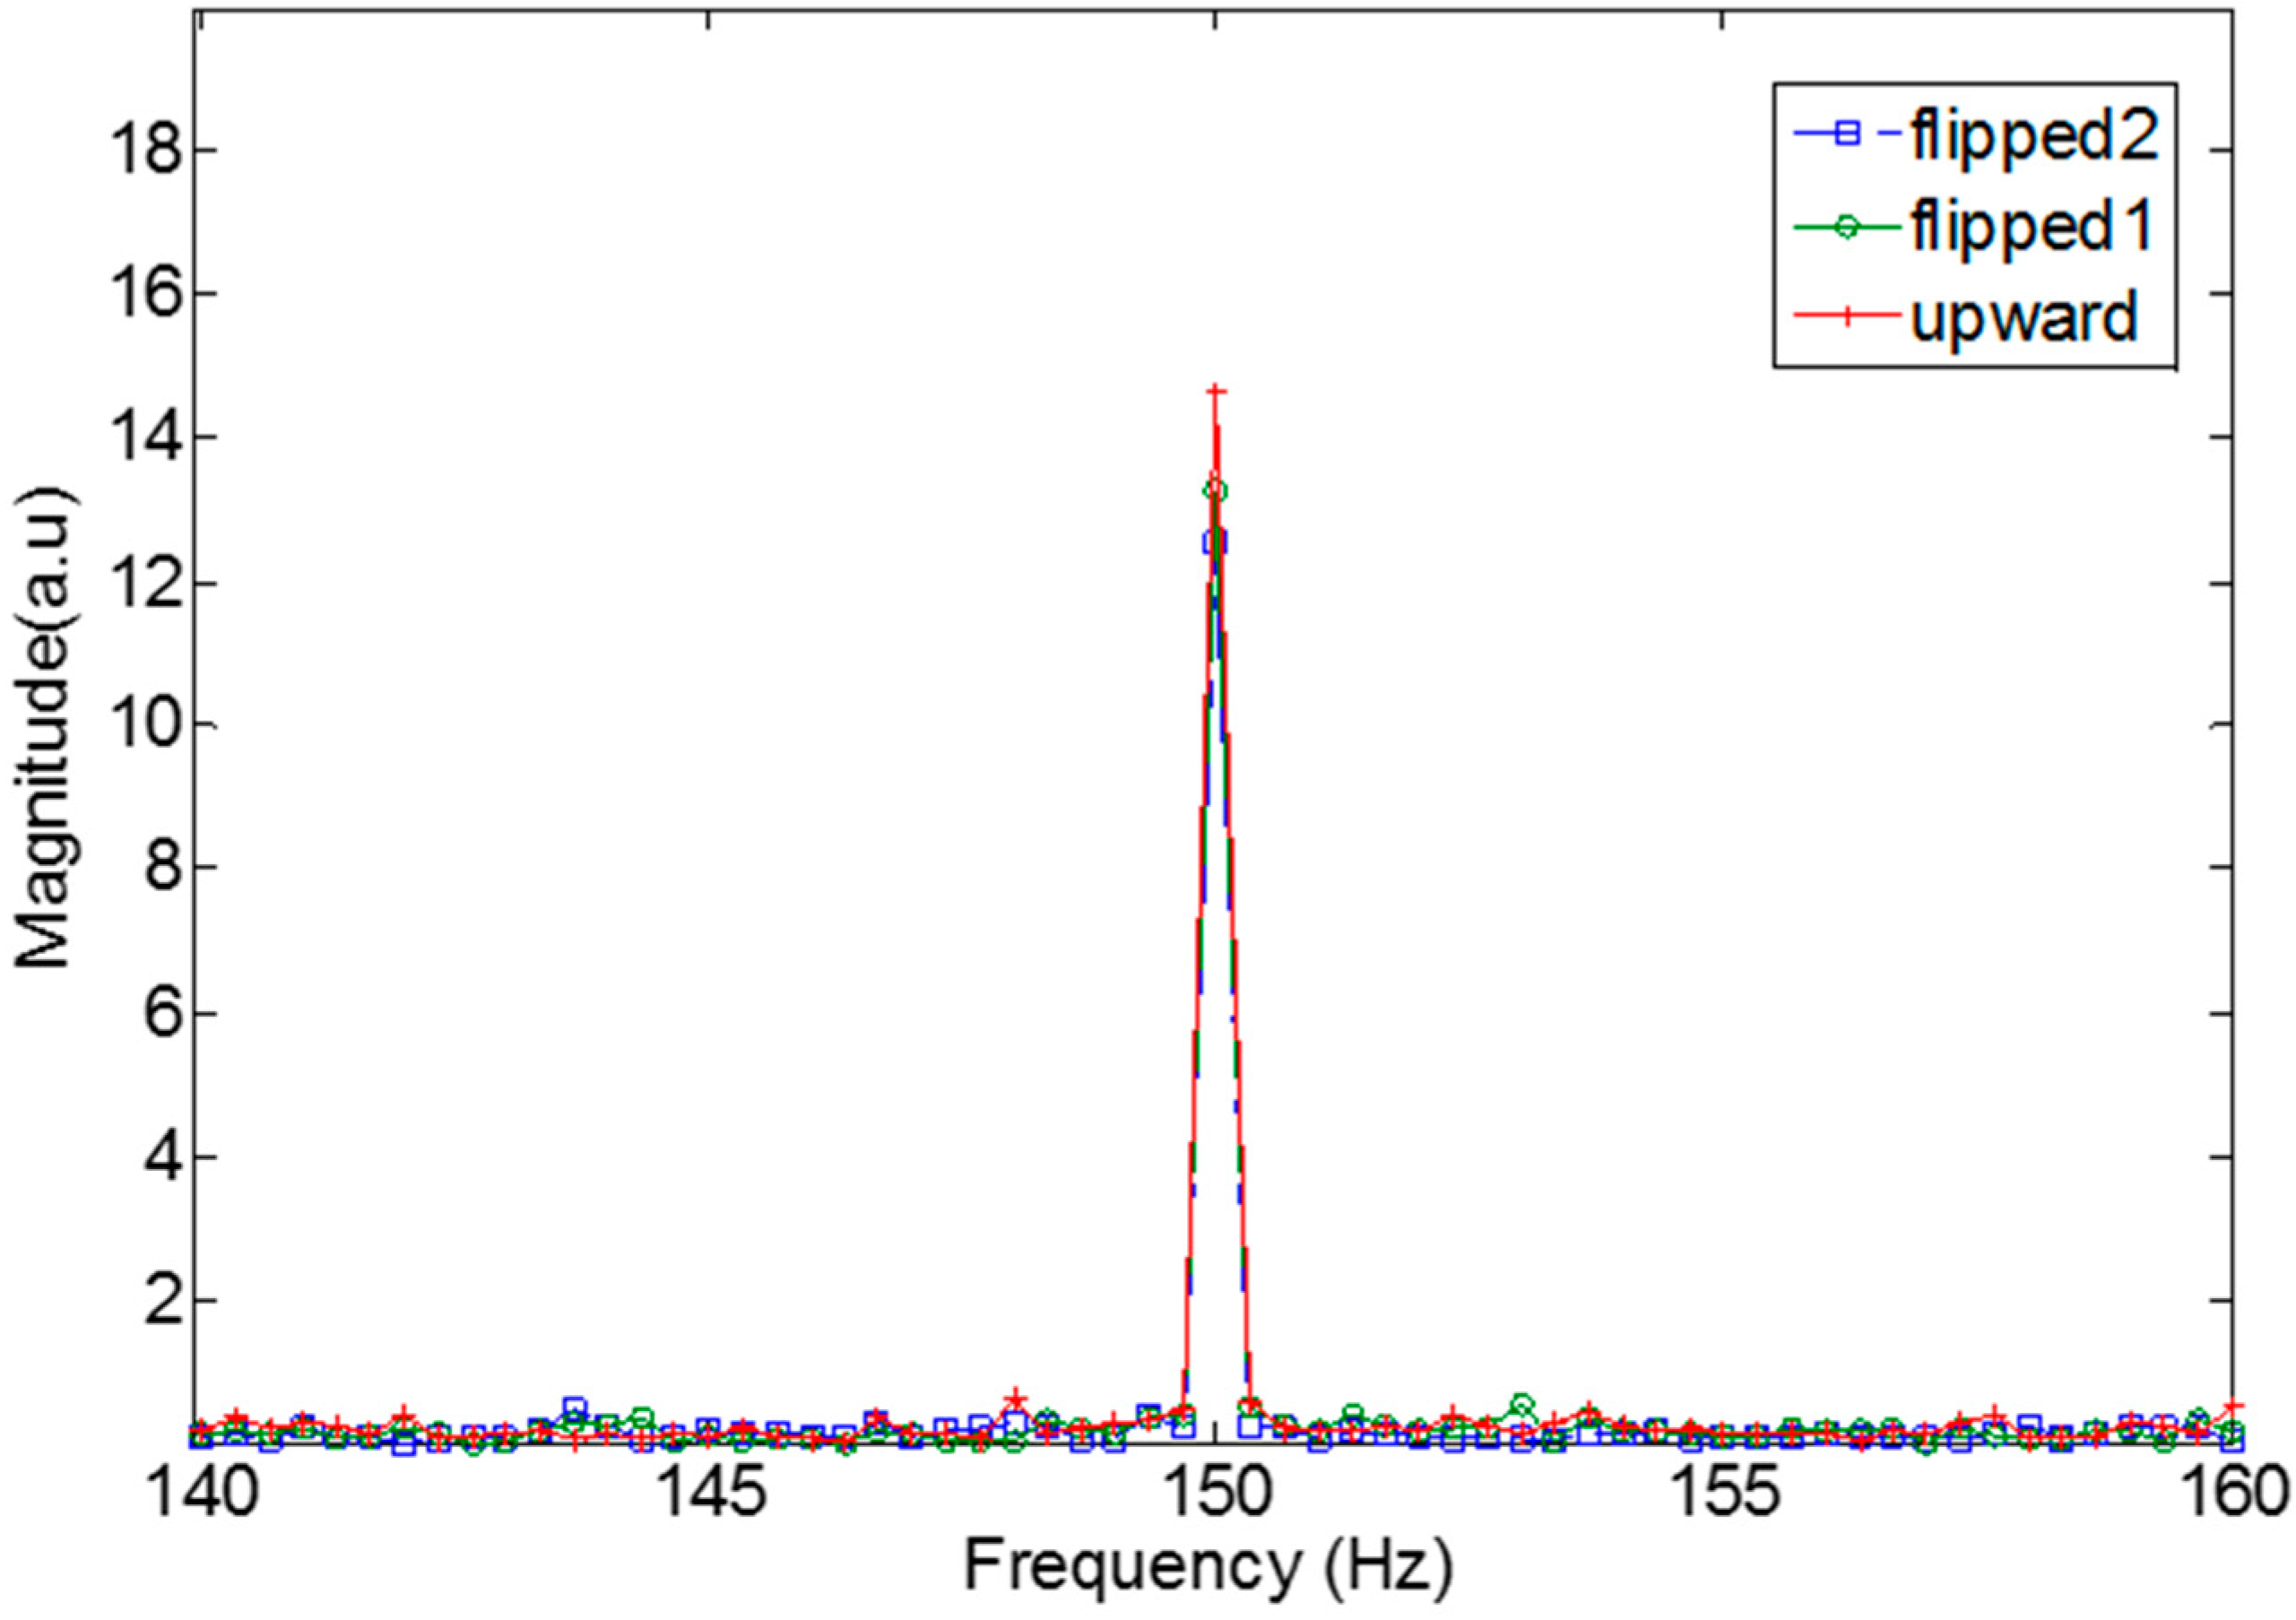
Figure 12 shows the FFT data of three tests (case 4). A frequency tone of 150 Hz was used to test the effect of vibrations when the FBG bearing surface was facing upwards with a central wavelength that is near 1549.72 nm. After this, the sensing beam was flipped at the same location and the central wavelength of the grating was shifted to 1549.68 nm. However, the repeated measurements showed that the forced vibrations were detected with a similar magnitude.
We outline the possible reasons for the sensor response in the following paragraph. As the length of the beam is significantly greater than the width and thickness, the stiffness of the beam is low. The sensing beam does not behave as a single uniformly strained cantilever but as several sections that behave as smaller cantilever-type sections. When the sensor beam was wedged near the center and was free to vibrate on both ends, dual peaks were obtained that were both under 20 Hz.
The sensing capability is possible in this type of wedged design because it creates a pre-strain. This allows vibrations to induce compression and extension on the fiber grating periods. Thus, its sensitivity to vibrations increases, while the FBG is unable to compress or expand freely when it is stuck or glued to metallic surfaces. The flexibility of the beam allows the signals to pick up multiple vibrational frequencies in the same region as the FBG. The acoustic sources (phone and speaker) used in the experiments act as strong sources of forced vibrations. Thus, the theory and analysis of the sensor may depend on the forced vibrations coupled to the flexible beam and its stiffness.
To support the above-mentioned concept, the response of the sensor can be analyzed using the principle of forced vibrations [
16]. The acoustic force is assumed to be a time-varying tone of frequency
ωf at a given amplitude
F0, which can be described as:
The acoustic wave propagates through the base plate or beam 1, before the vibration is coupled to the sensing beam.
The steady state solution [
16] for such a forced vibration is given by
x in the equation below. In this case, an undamped solution is considered as there was a continuous source of the forced vibrations (speaker)
F.
where the moment of inertia can be described as:
and the stiffness is:
The following parameters were used for the simulation (E = 70 × 109 N/m2, L = 0.47 m, b = 0.015 m and h = 0.0003 m). The value of f in ω was taken as 10 Hz for all cases. The steady state waves for 150 Hz and 200 Hz were calculated for two different values of stiffness. As shown after substituting Equations (6) and (7) in Equation (5), h and L have a significant role to play in determining the amplitude of the steady state solution. Hence, a high stiffness results in low amplitude and this low amplitude does not allow for sufficient flexion of the FBG to sense the vibrations at high frequencies. Thus, a beam of low stiffness is more sensitive.
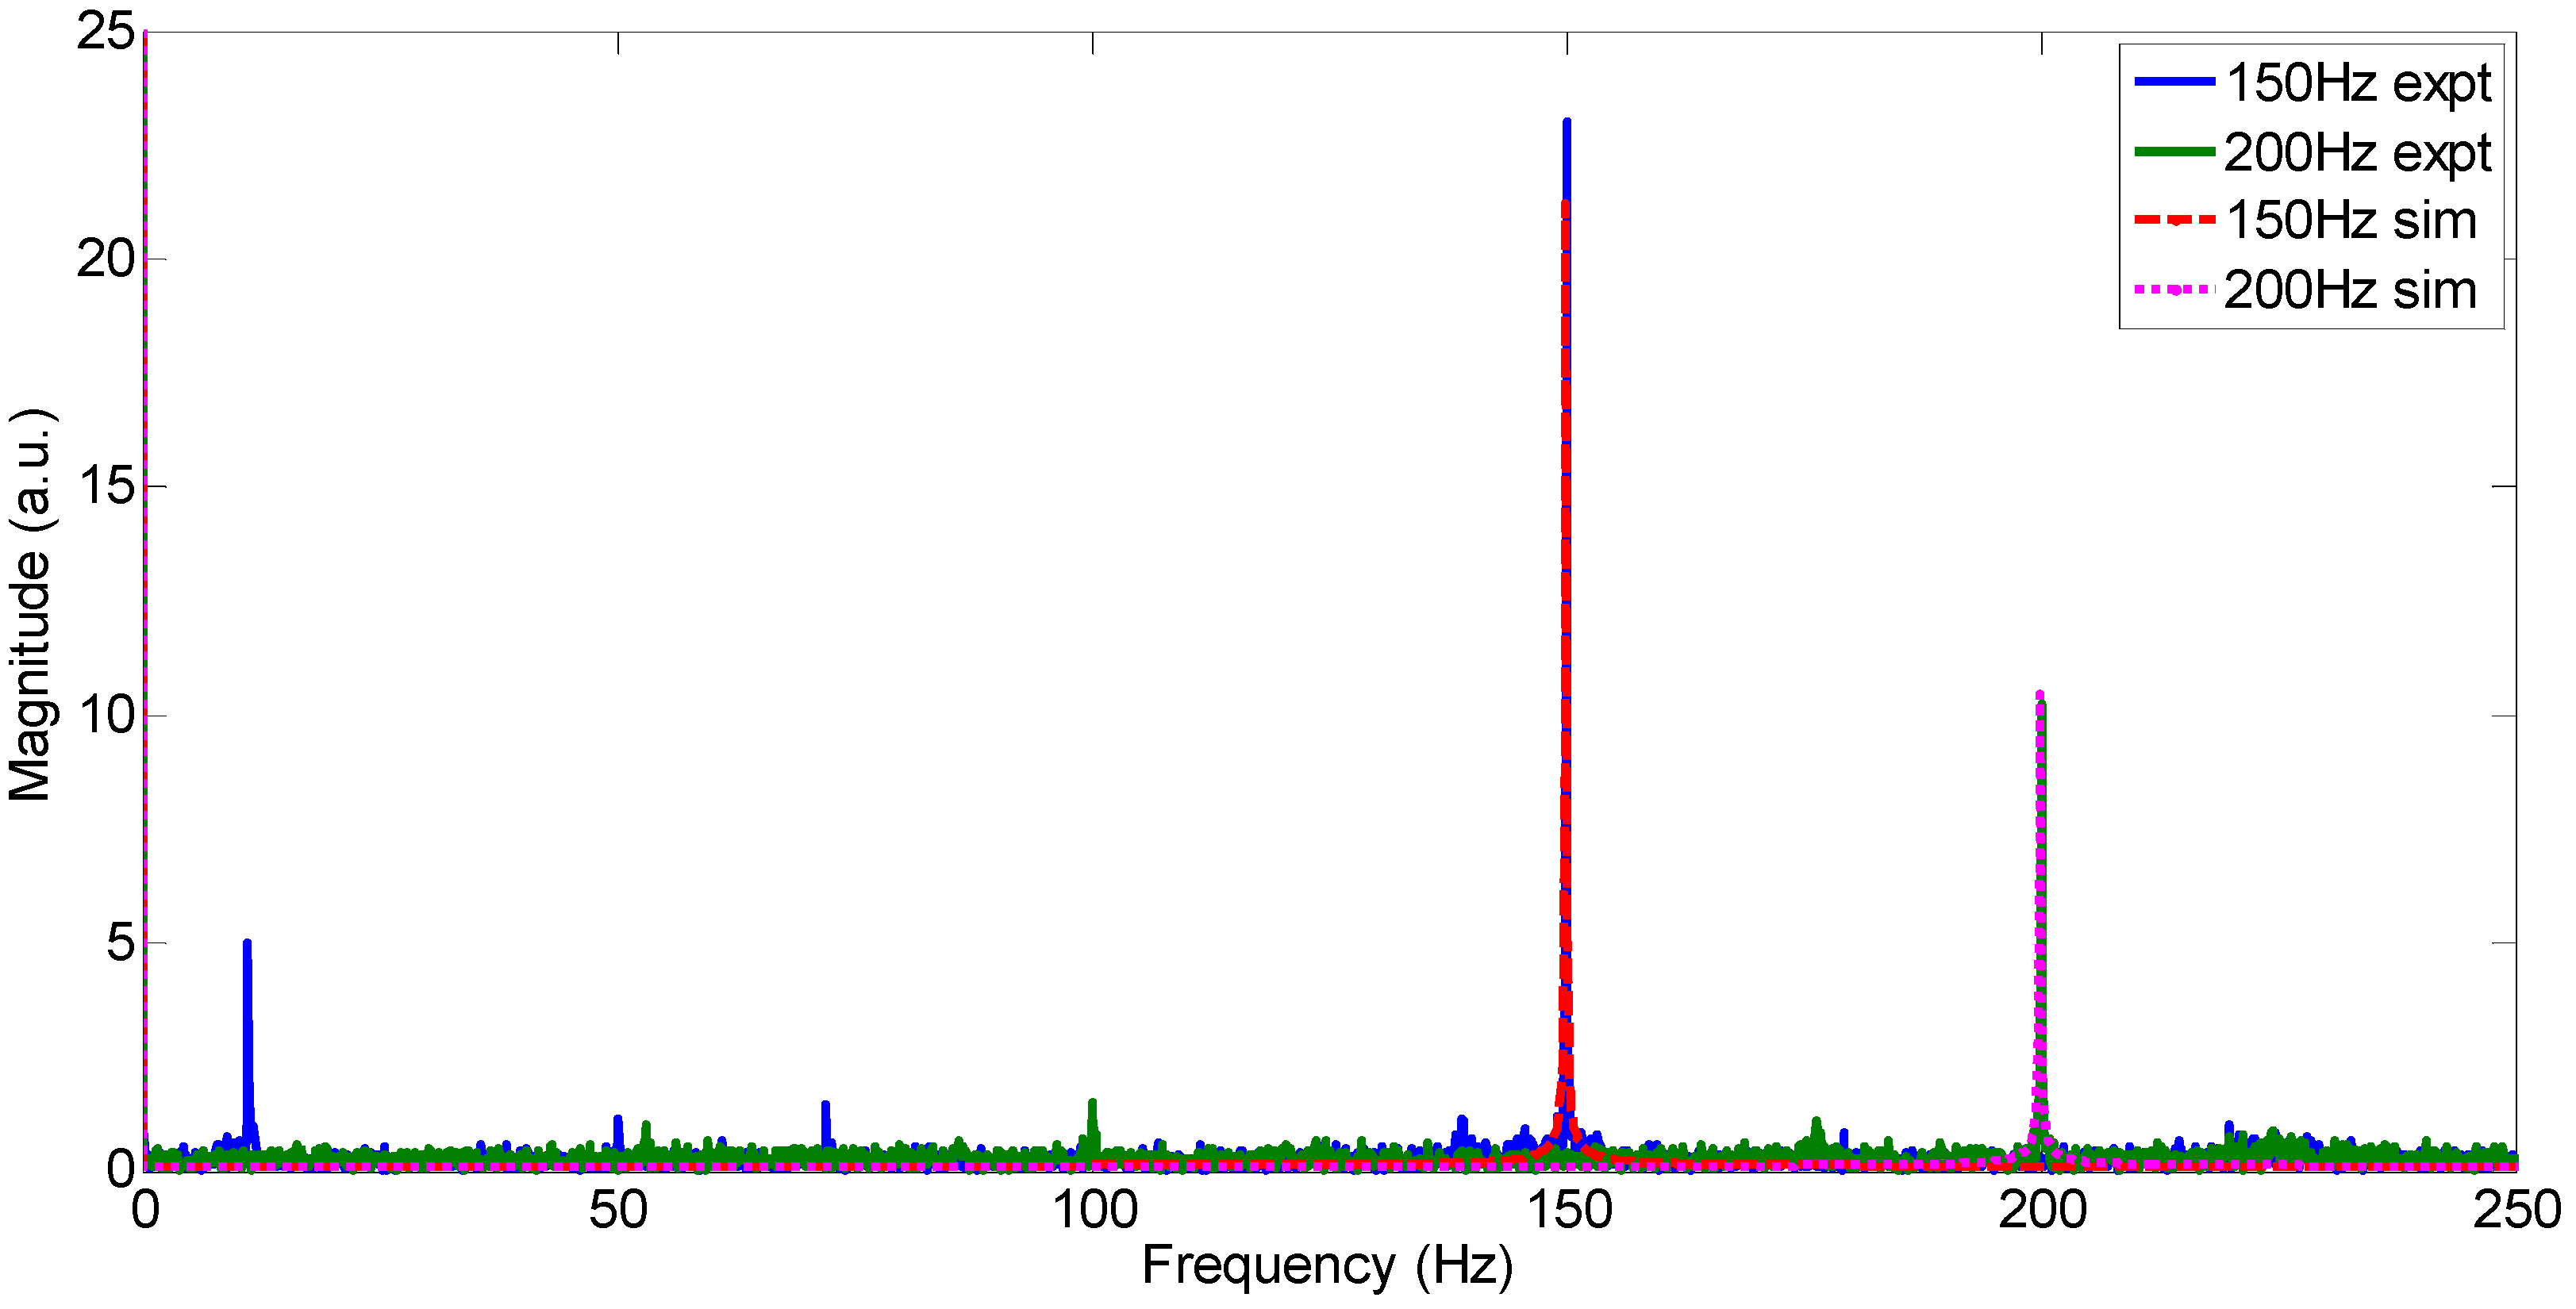
These calculated data were compared with experimental results from case 5 (
Figure 4). The experimental and simulated data were compared using the same number of samples (4000) in
Figure 13. The experimental data shows the main peak at the speaker frequency. Smaller peaks are present at multiples of the main frequency, which shows the presence of other modes. For 150 Hz, the amplitude was sufficiently strong to generate oscillations (near 10 Hz) in the freely suspended end of the beam. The simulated data were obtained from the FFT of the steady state waves. The value of
F0 has been normalized to obtain the closest fit (0.2 N). The simulation was conducted separately for 150 Hz and 200 Hz.
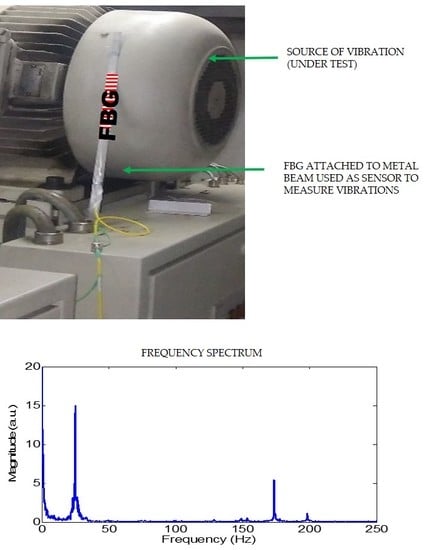
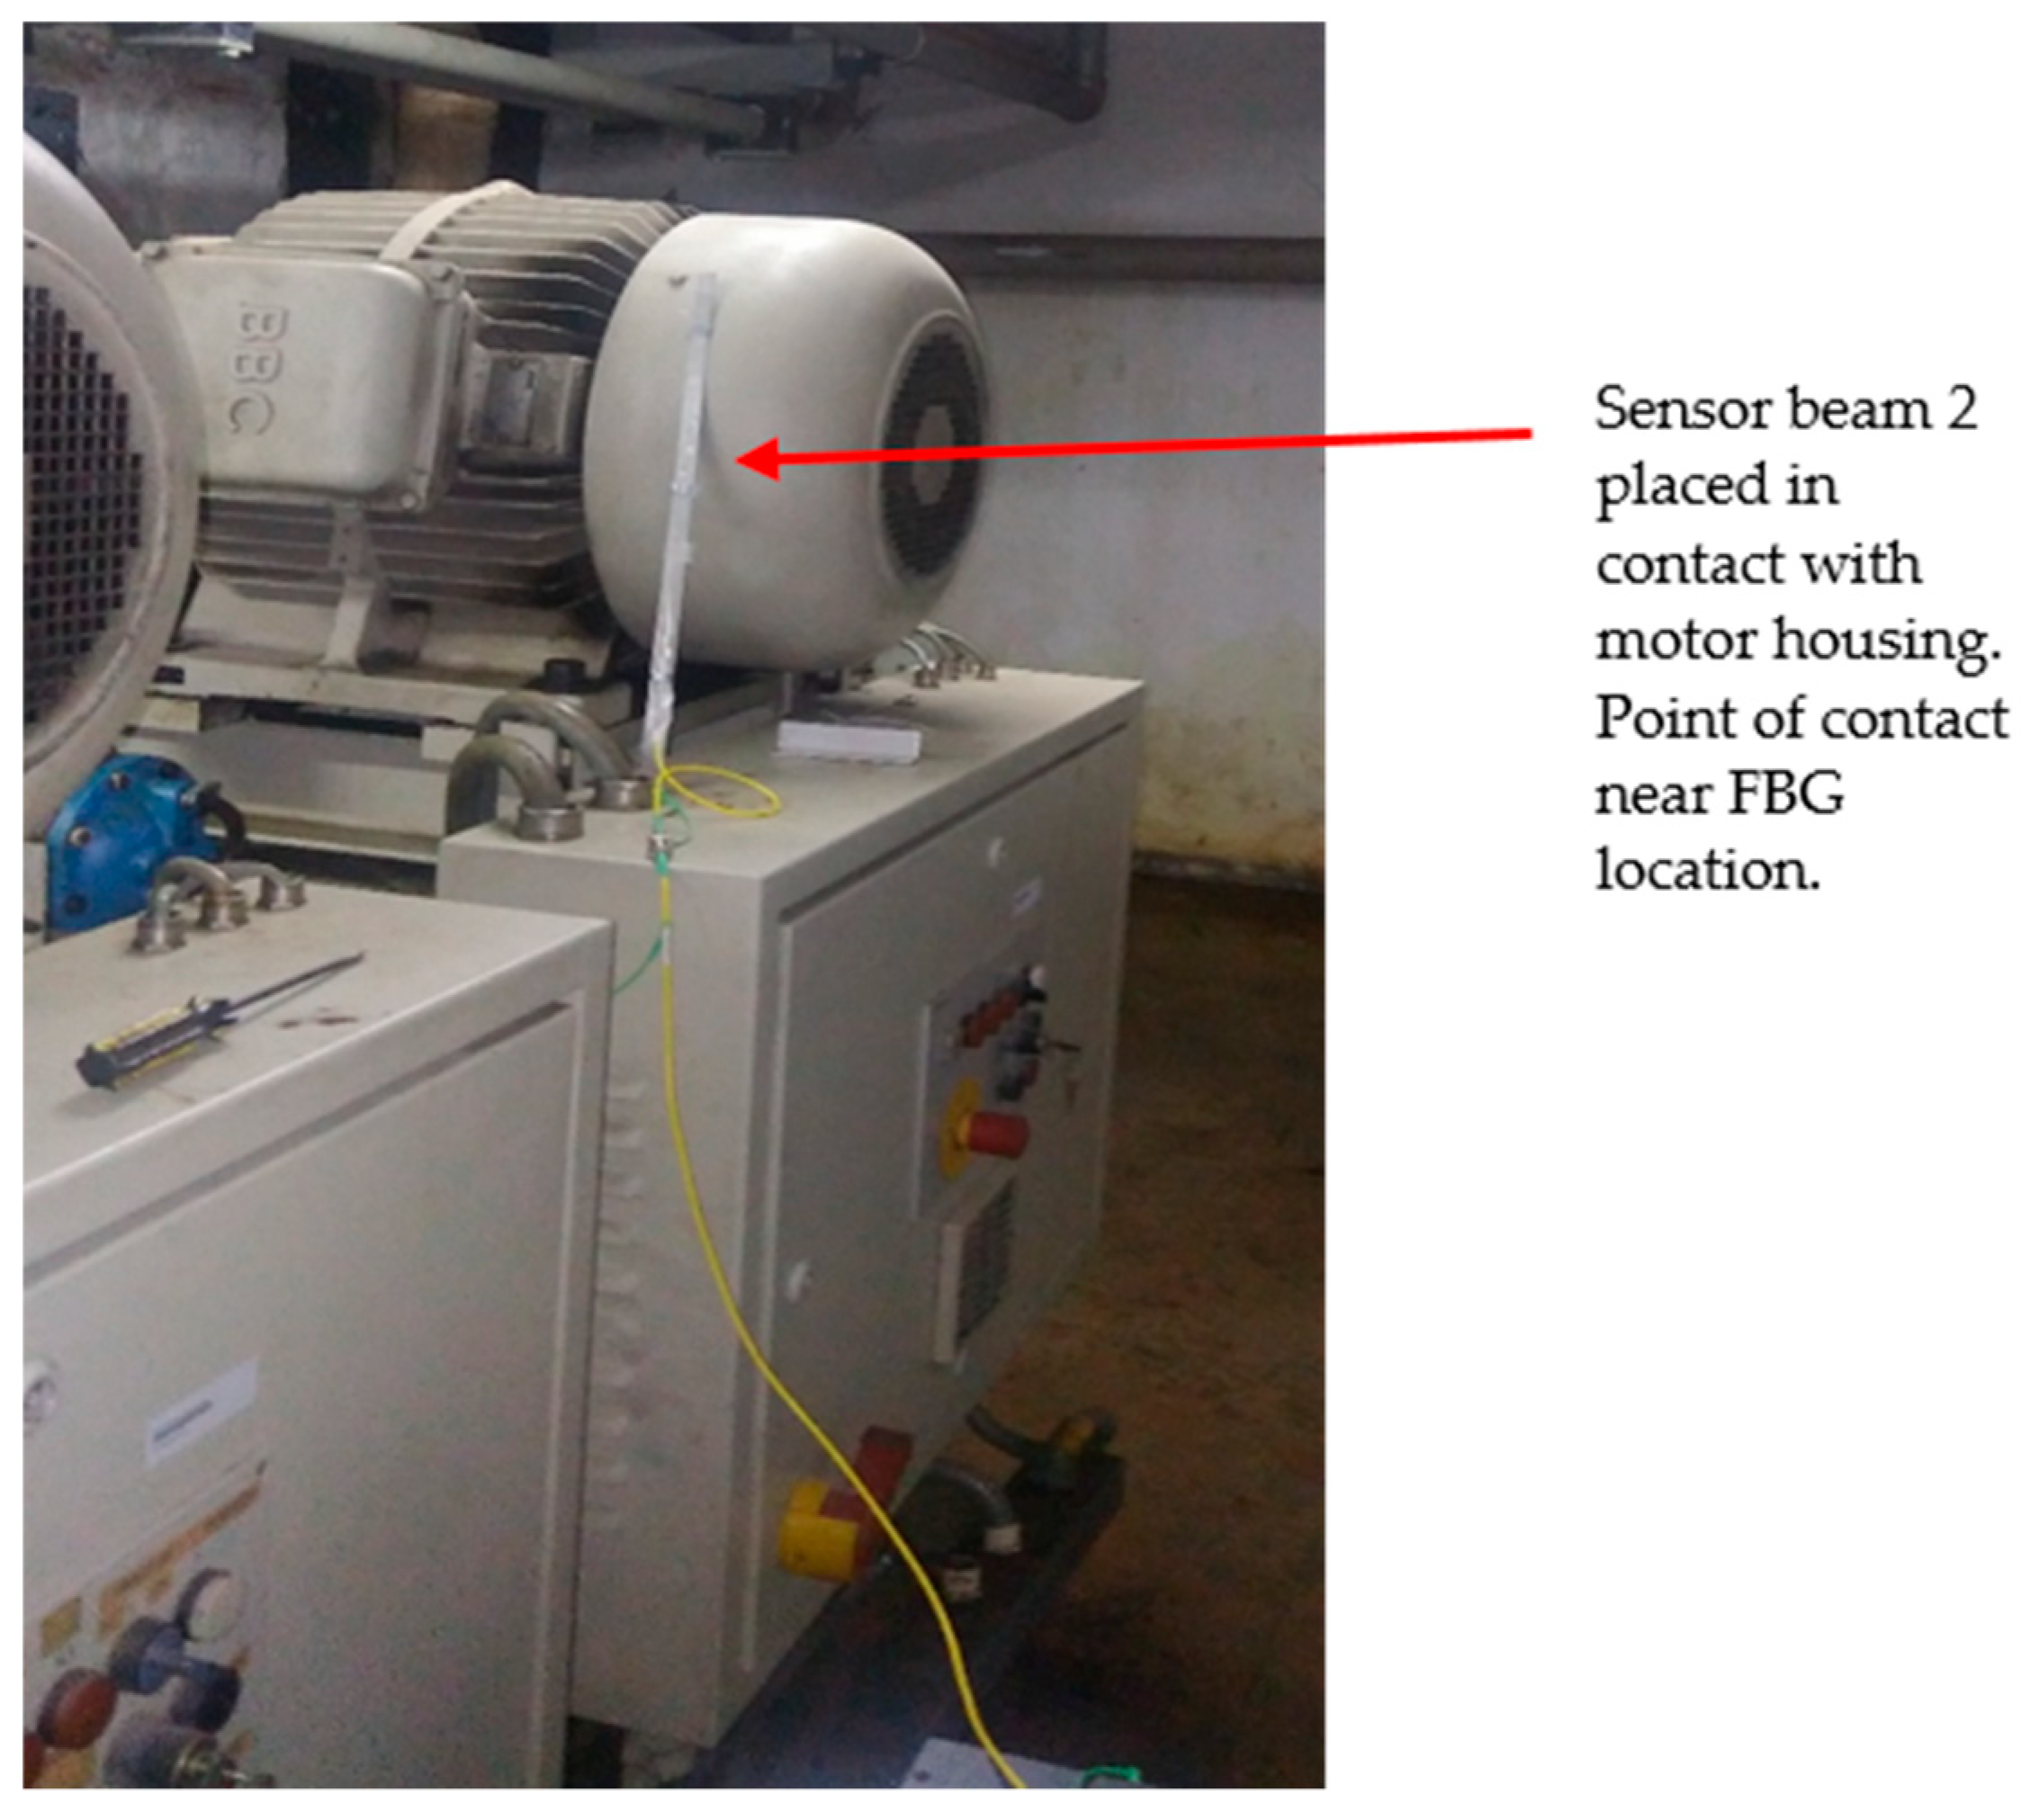
To validate the assumption that the sensor can be used to detect vibrations caused by dynamic loads, the sensor has also been tested (case 6) on a three-phase motor (55 kW) of 1475 rpm. Without any prior preparation of surfaces, the sensing beam was propped on the motor housing (
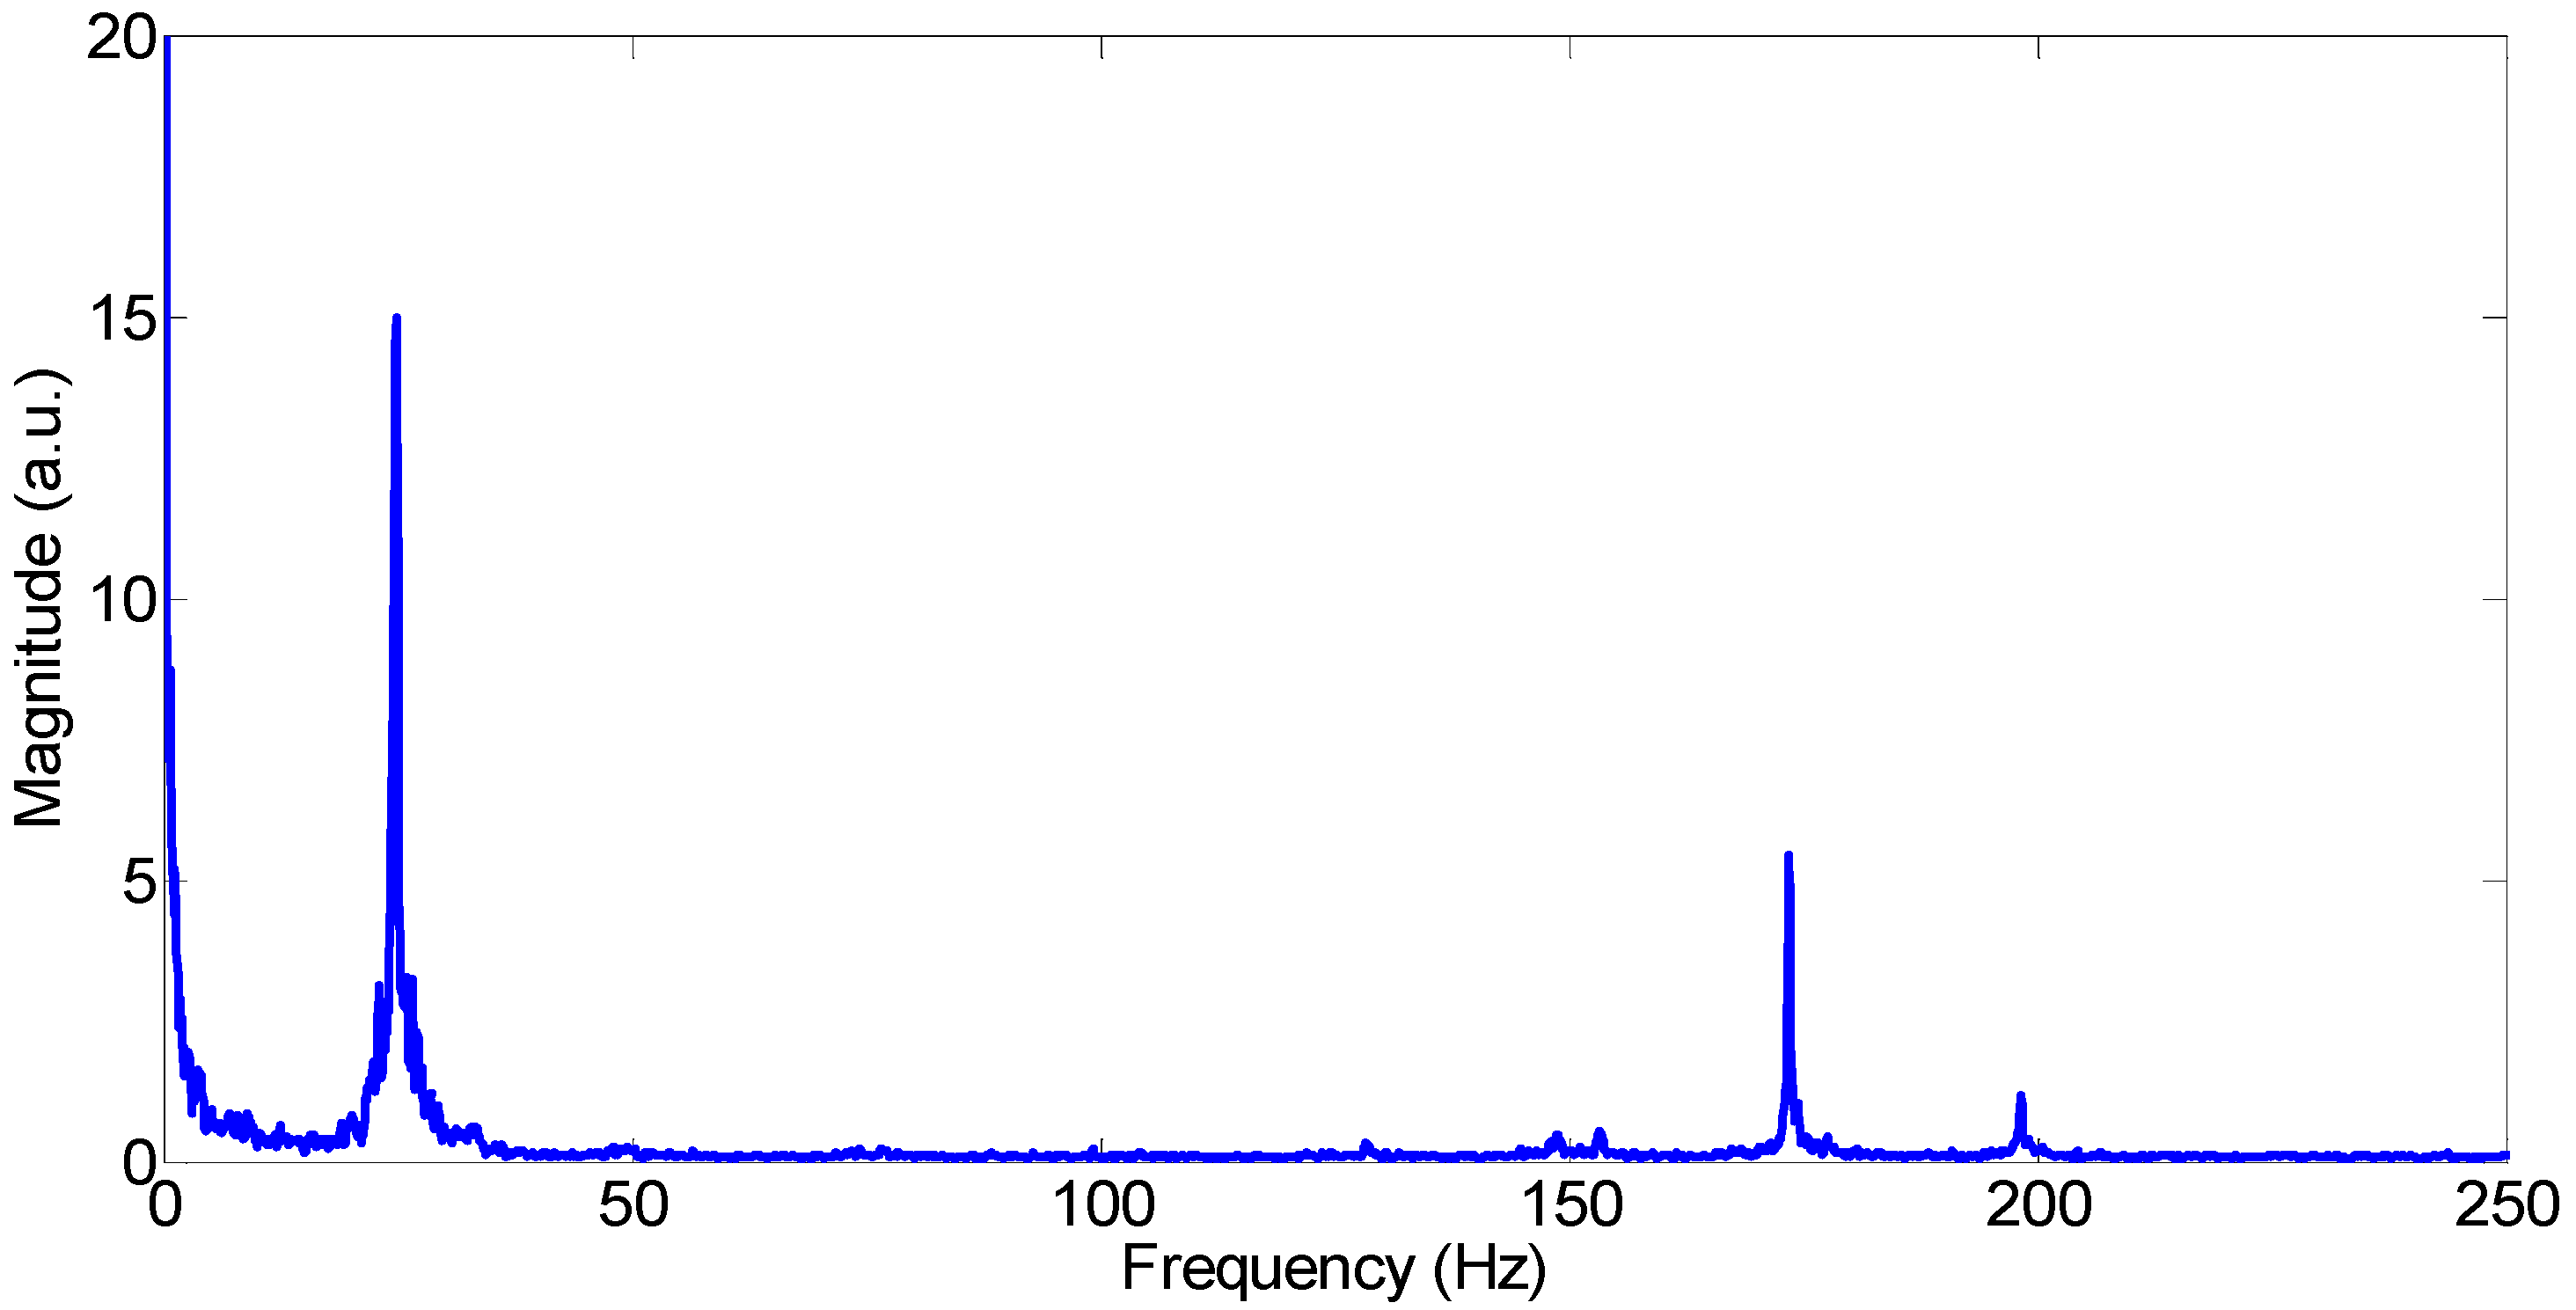
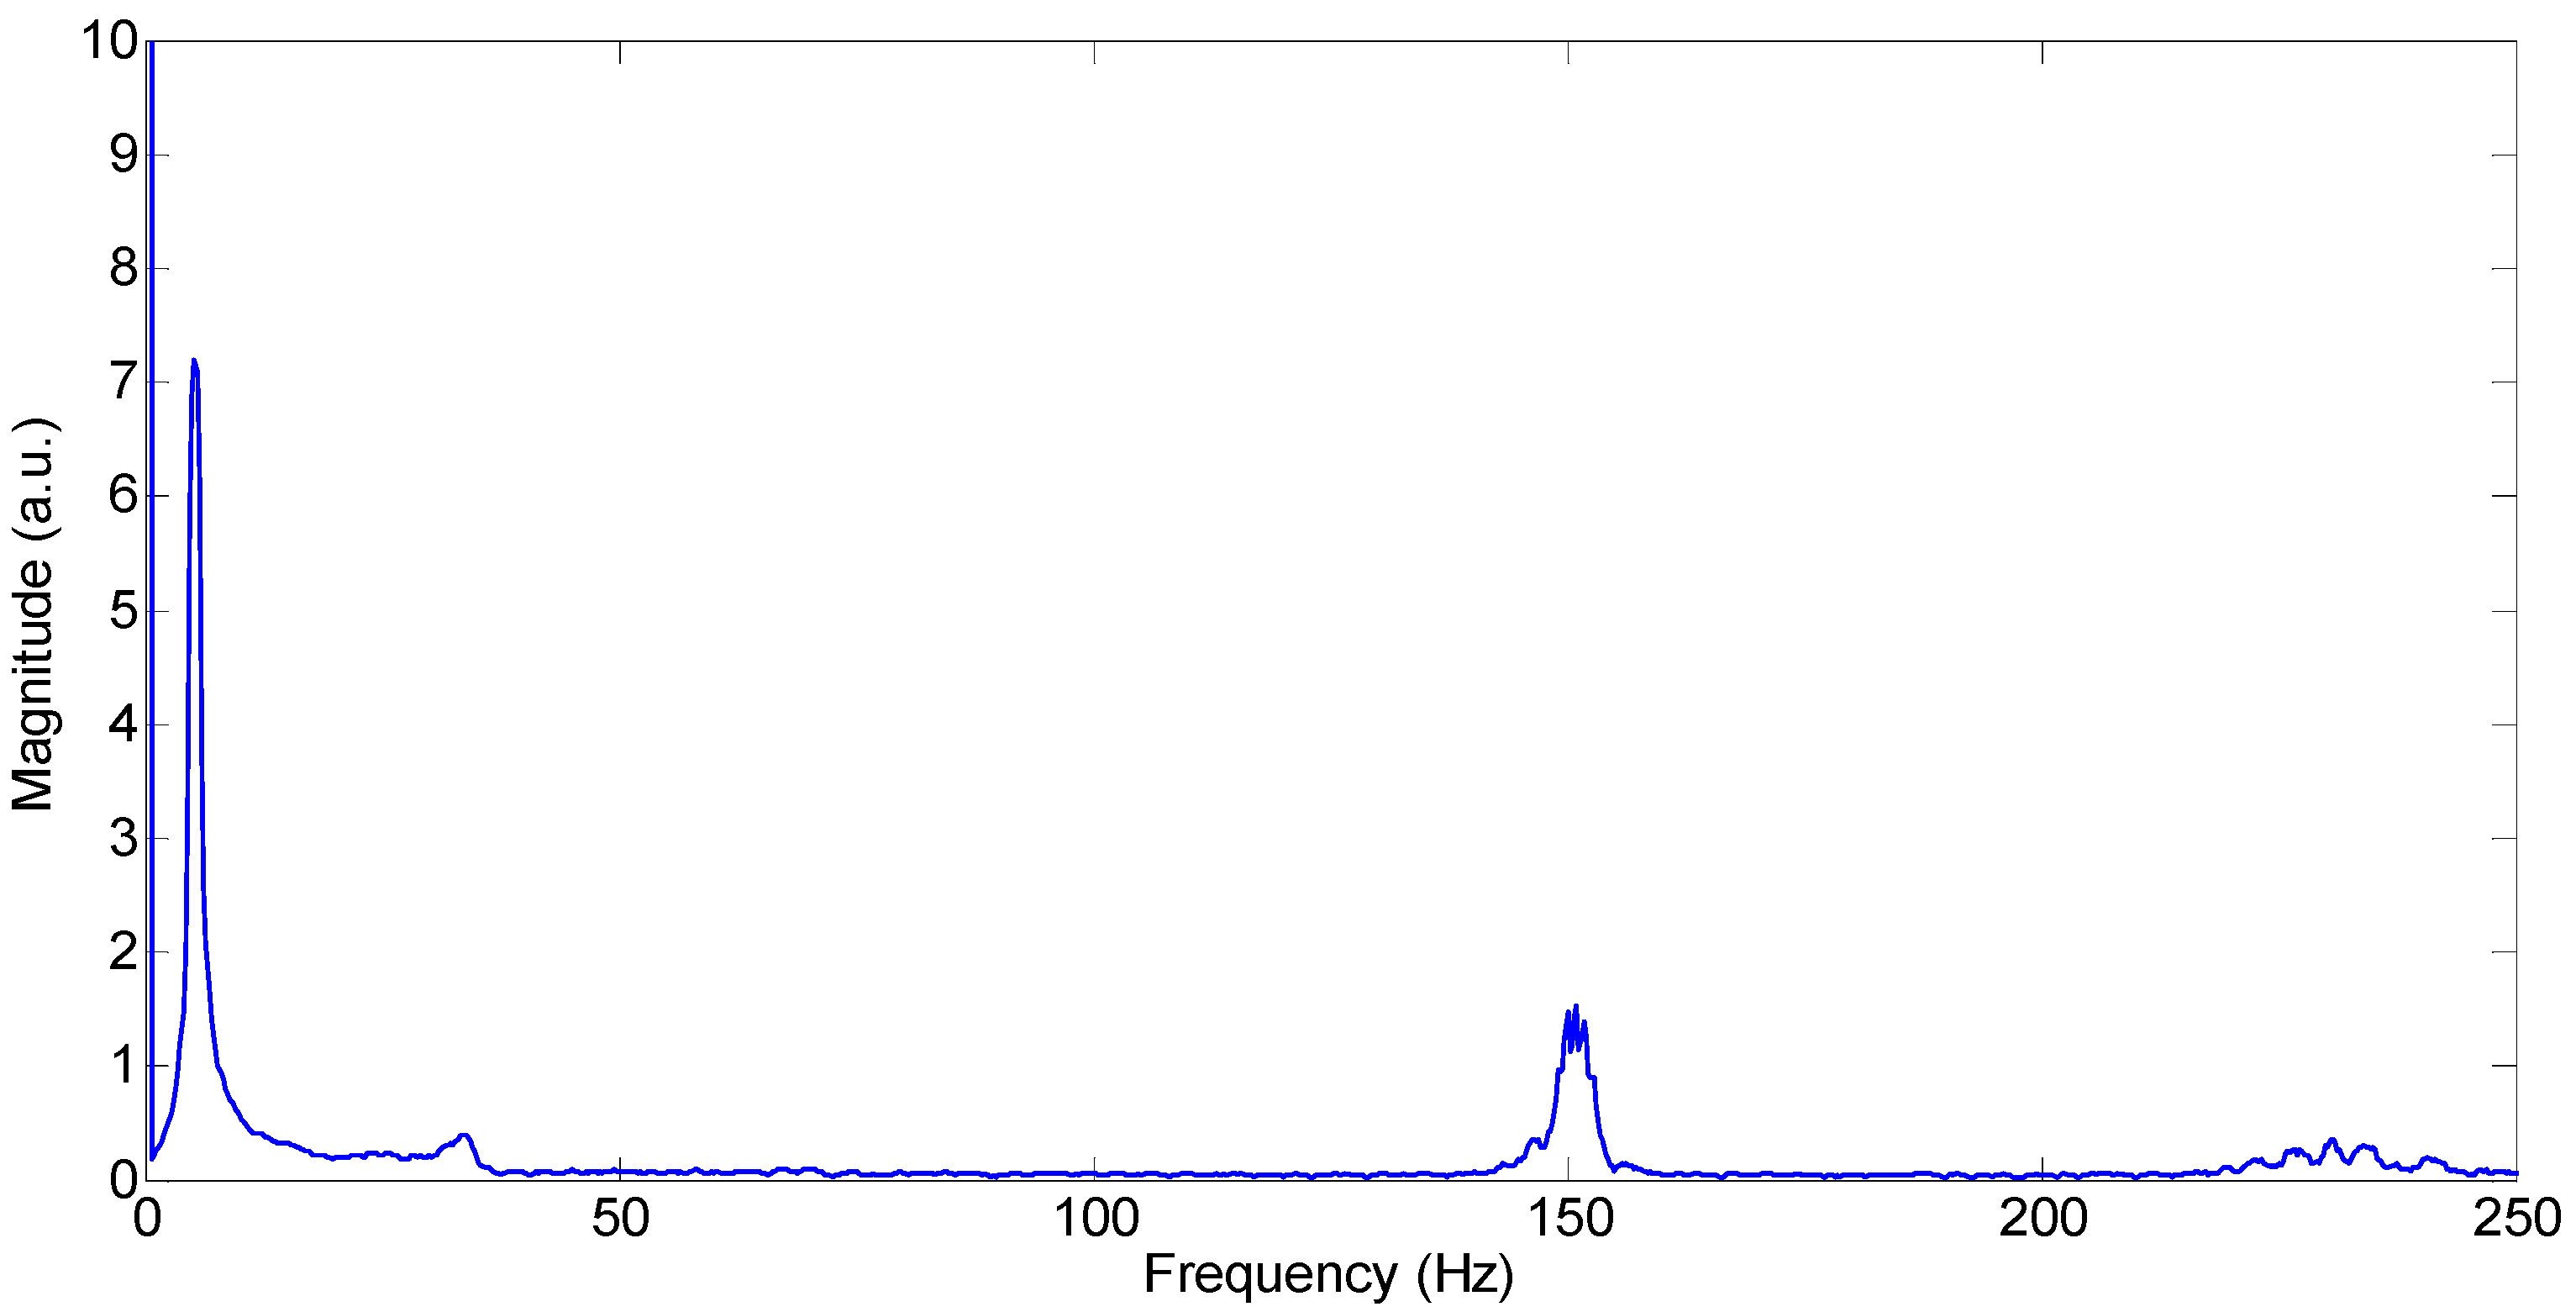
Figure 14) to measure the vibrations generated by the operation of the motor.
Figure 15 shows the frequency spectrum of this sensor. A peak was identified at 24.8 Hz, which is due to the rotation of the motor at 1475 m
−1. Another peak was noted at 173.4 Hz due to the 7th harmonic, which is often observed in motor vibration [
17]. Multiple tests show that the peak at 173.4 Hz was present in all data.
These results show that the FBG is an effective vibration sensor and is easy to implement. However, the key property determining the FBG capability to detect vibrations is its ability to expand and contract. A thin, long and flexible aluminum beam works as the appropriate conduit. Tests were repeated for 50, 60, 80, 100, 110, 150, 180 and 200 Hz. Continuous sweeps of frequency have also been recorded. The results of the case study support the selection of a low-stiffness beam as the sensing material. The sensor does not have a complex design. However, it can be successfully retrofitted on metal beams, cylinders and plates to pick up peripheral vibration frequencies. The metallic wedge can be chosen to be a cylindrical metallic pipe, a solid rectangular wedge or any other shape that supports a pre-strain in the FBG by allowing deformation. This leaves room for the sensor to expand and compress according to the vibrational frequency. Several tests have been repeated with a triangular wedge instead of beam 1. For the motor test, no wedge or intermediate beam was present as the sensing beam was simply placed in contact with the housing. Instead of a complex design that is difficult to maintain, this sensor consists of a simple low-stiffness beam so that the configuration is similar to that of a bridge and can consistently be strained.
Modal studies related to the vibrations of the metal plate and cantilever have been carried out by several groups. However, in the case of this sensor, the boundary conditions are not limited to a specific orientation or alignment. Thus, the (theoretical) modal analysis is not specific to the sensor but to the application or the case study where a definite mounting method may be used to detect the vibrations. In the analysis, although
ω and
L may have interdependence, the sensor will have similar responsivity for different values of
ωf. The underlying principle used in this type of test is that the vibrations from the metal beam attached with FBG act as a source of forced vibrations, which are detected by the FBG sensor. The frequency of the detected vibrations is the same as the source of the forcing vibration. The vibrating body forces/couples its own vibration on/to the passive beam bearing the FBG. The results are consistent with the general principle of harmonic forced vibration [
18] where the detected frequency is unchanged but the measured amplitude varies with the stiffness and design. This FBG sensor can be applied to many areas requiring vibration measurements, such as measuring the vibrations near railway tracks, near drilling sites and on suspension bridges.


