Abstract
Structural health monitoring is of great importance for the application of composites in aircrafts. Fiber Bragg grating (FBG) sensors are very suitable for structure strain measurement. However, the strain measured by FBG sensors is different from the original strain in host materials. The relationship between them is defined as strain transfer. As composites are anisotropic, the traditional strain transfer model, which regards the elasticity modulus of host materials as a constant, is inadaptable. In this paper, a new strain transfer model is proposed for FBG sensors bonded to the surface of carbon fiber reinforced polymer (CFRP) laminates. Based on the measurement structure, the model is established and the transfer function is derived. The characteristics influencing the strain transfer are analyzed. The stacking directions, stacking numbers, and stacking sequences of CFRP laminates have a distinct effect on the transfer efficiency, which is different from the isotropy host materials. The accuracy of the proposed model was verified by experiments on a nondestructive tensile system, and the maximum model error is less than 0.5%. Moreover, the model was applied to the strain measurement of CFRP wing skin, which indicates that measurement errors decrease by 11.6% to 19.8% after the compensation according to the model.
1. Introduction
The composite laminates have extraordinary mechanical properties such as high strength, light weight, strong corrosion resistance and low temperature distortion [1]. Thus, the application of composite laminates in lieu of traditional alloys has significantly increased in aircraft manufacturing [2]. Specifically, carbon fiber reinforced polymer (CFRP) laminates have been widely used in the manufacture of the wing skin. The CFRP laminates are made of a number of carbon-fiber fabrics impregnated with polymer. The fabrics are stacked together in specified orientations and formed at a high temperature and a high pressure. The transverse damage resistance of CFRP laminates is weak due to the lack of through-thickness reinforcement [3]. The damage mechanism of the CFRP wing skin is much more complex compared with the traditional alloy skin [4,5]. Strain testing is important for composite structural health monitoring [6]. Once wing skin strain under different loads is measured accurately, aircraft designers and engineers can obtain its ultimate limit states, which is important for reducing the risk of composite structural failures. Therefore, the accurate strain measurement for CFRP laminates is of great importance [7,8,9,10].
Fiber Bragg grating (FBG) sensors, a type of optical fiber sensor, have been recognized as ideal choices for aviation structure strain measurement [11]. FBG sensors have many advantages such as their small size, high sensitivity, multiplexing capability and immunity to electromagnetic interference [12,13,14]. FBG is made by inscribing grating in an optical fiber core. The refractive index of the grating experiences a periodic modulation, which makes the fiber act as a band-pass filter. When lights of different wavelength are launched into the fiber, the grating reflects the light of one particular wavelength, named the Bragg wavelength. The reflection wavelength of the FBG sensor is determined by the Bragg condition [15]. When the diffraction order is equal to 1, the Bragg condition can be described as follows:
where neff is the effective refractive index of the fiber core and Λ is the grating period. The grating period represents the geometrical distance between two consecutive repeated alterations of refractive index in a Bragg grating [16]. The Bragg wavelength can be detected by an FBG interrogator [17]. A scanning diode laser combined with a photoelectric detector is a common design for a standard commercial interrogator. A tunable narrow band light is generated by a diode laser. The wavelength of the light is adjusted by a scanning voltage, which changes periodically. The light is launched into the optical fiber. The light with Bragg wavelength can be reflected by FBG sensors, and then detected by the photoelectric detector. At the moment, the scanning voltage is recorded, and the Bragg wavelength can be obtained according to relationship between the scanning voltage and the wavelength of the light. FBG sensors are sensitive simultaneously to both temperature and strain changes [18]. When environmental temperature varies, the reflection wavelength of an FBG sensor will also change. The relationship between the reflection wavelength shift, represented by ∆λT, and the temperature variation, represented by ∆T, can be described [19] according to
where α and ζ represent the thermal-expansion and thermo-optical coefficients, respectively. When axial strain is applied to the optical fiber, the wavelength shift of the FBG sensor, represented by ∆λε, can be calculated [20,21] according to
where εms represents the axial strain and ν is the Poisson’s ratio. p11 and p12 are elastic-optical constants which respectively describe the longitudinal and lateral refractive index changes when longitudinal strain is applied to an optical fiber [22]. For the FBG sensor under both temperature and strain changes, the overall shift of Bragg wavelength is given by the summation of the two effects [19] as follows:
To compensate the effect of temperature changes during the strain measurement, a same FBG sensor can be placed in the measurement area as a temperature compensation sensor. The temperature compensation sensor is subjected to the same thermal load but free from mechanical load. The wavelength shift ∆λT caused by the change of temperature can be eliminated from the overall wavelength shift ∆λB, and the wavelength shift ∆λε resulted from the strain change can be obtained based on (4). Then, the strain sensed by the FBG sensor can be calculated according to (3). With the help of adhesive, a bare FBG sensor is bonded to the surface of a host material. The strain of the host material is transferred to the adhesive layer, which leads to the deformation of the FBG sensor wrapped inside. Since the mechanical properties of the FBG sensor, the adhesive layer and the host material are different, the interactions among them are complicated [23,24]. When a host material deforms, part of the strain will be absorbed by the adhesive layer. The measurement structure can also counteract the original strain in the host material. Therefore, the strain measured by FBG sensors is different from the original strain in the host material [25]. The transfer efficiency between the measured strain and the original strain can be defined as a strain transfer ratio.
Several studies have investigated this problem theoretically and experimentally. Tai-Wan Kai [26] performed the Fourier amplitude sensitivity test based on an empirical mechanical model to identify the most critical parameter influencing the strain transfer ratio. Shiuh-Chuan Her [27] developed a theoretical model to evaluate the effect of adhesive and bonding length on the strain transfer. Li Sun [28] conducted a strain transfer analysis of a clamped fiber Bragg grating sensor. She discussed the influences of gauge ratio and interlayer thickness on the strain transfer ratio. Yang-yang Sun [29] proposed a method to measure surface strain with polyimide fiber Bragg gratings. It was demonstrated that polyimide FBG sensors work well even in dynamic surface strain measurements. Yue-gang Tan [30] gave the strain transfer function of the attached FBG sensor under ultrasonic excitation and realized nondestructive testing. Accurate strain measurement results were obtained in the reported studies. However, in most of the studies, it was assumed that the elasticity modulus of host materials was a constant. In fact, this hypothesis can be only valid for isotropic host materials. As for composites, such as CFRP laminates, the elasticity modulus changes with directions and material characteristics vary among different layers. Therefore, a strain transfer characteristic analysis is needed to improve the strain measurement accuracy of CFRP laminates.
In this paper, a strain transfer model is proposed for FBG sensors bonded to the surface of CFRP laminates. The influences of CFRP laminates on the strain transfer are investigated and the model is applied to the measurement of the wing skin. The content of this paper is organized into five sections. The strain transfer model is established and the transfer function is derived in Section 2. The strain transfer influential factors are analyzed in Section 3, and the relationship between the CFRP laminate configuration and the strain transfer efficiency is discussed in detail. In Section 4, the accuracy and practicality of the proposed transfer model are verified according to the experimental results. Finally, conclusions are summarized in Section 5.
2. Theoretical Model of the Strain Transfer Ratio
The measurement structure of an FBG sensor is shown in Figure 1. The structure consists of an optical fiber, adhesive layer and CFRP laminates. The optical fiber is composed of fiber core, cladding, and coating. The fiber core and cladding are both made of silica and have the same mechanical properties [26]. Thus, they can be regarded as silica core. The silica core is protected by polyimide coating. The optical fiber and CFRP laminates are bonded together using an epoxy resin adhesive layer. The length of the adhesive layer is 2L, and the width of the adhesive layer is D. ha represents the thickness of adhesive above the optical fiber.
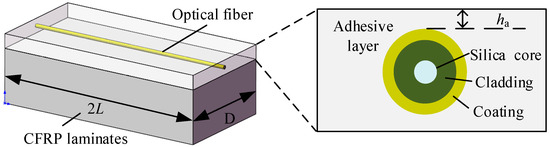
Figure 1.
Measurement structure of a Fiber Bragg Grating (FBG) sensor bonded to the surface of carbon fiber reinforced polymer (CFRP) laminates.
CFRP laminates can be regarded as an anisotropic multilayered structure [31,32]. Each layer of carbon-fiber fabrics is orthotropic and its elasticity modulus along the fiber direction is significantly higher than the elasticity modulus along other directions. The configuration of CFRP laminates is shown in Figure 2. The fabrics are placed with certain stacking sequences and can be described by their fiber directions as [θ1/θ2/···/θn]s, where the symbols in the square bracket indicate the stacking sequence and directions (angles in degree) of the carbon-fiber fabrics in CFRP laminates and the subscript s means symmetric arrangement. Each fabric layer has three principal axes represented by 1, 2 and 3. The principal axes 1 and 2 are both in the fabric layer, and the principal axis 1 is along the fiber direction. The principal axis 2 is perpendicular to the principal axis 1. The principal axis 3 is perpendicular to the fabric layer. There is no relative slip between two fabric layers for intact CFRP laminates.
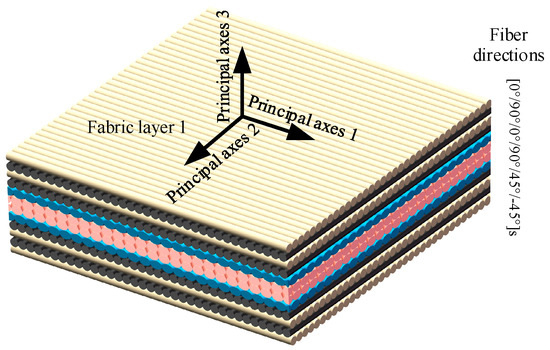
Figure 2.
Configuration of CFRP laminates.
The measurement structure is abstracted into four parts, which are the silica core, coating, adhesive layer, and CFRP laminates. Two hypotheses are applied to this study as treated in some published references [24,33]:
Hypothesis 1.
Silica core, coating, and adhesive layer are linear elastic isotropic materials.
Hypothesis 2.
The bonds between all the interfaces are perfect and there is no relative slip.
The Hypothesis 1 describes the mechanical properties of the optical fiber and adhesive layer, and the Hypothesis 2 indicates the integrity of the measurement structure. If the hypotheses do not hold, it manifests that the adhesive layer is not fully cured or there are cracks in the measurement structure. Theoretically, the mathematical model of the measurement structure can be discontinuous in this case, and there will be no specific functional relation between the measured strain and the original strain, and this uncertainty should be avoided in the measurement.
A coordinate system is set up for the measurement structure as shown in Figure 3. The x axis is set along the central axis of the optical fiber and the y axis is along the vertical symmetry axis of the measurement structure. Only the first quadrant is shown in the figure because this structure is symmetric. L represents the half length of the adhesive layer; ys and yc are the radiuses of the silica core and coating; ya is the distance between the x axis and the lower surface of the adhesive layer; k is a positive integer, and yk is the distance between the x axis and the lower surface of the k-th fabric layer. The CFRP laminates are subjected to an original normal stress σm. Correspondingly, σs, σc, and σa represent the normal stress of the silica core, the coating, and the adhesive layer, respectively; τs(x, ys) is the shear stress at the interface between the silica core and the coating; τc(x, y), τa(x, y), and τCF(x, y) are the shear stress in the coating, the adhesive layer, and the CFRP laminates, respectively.
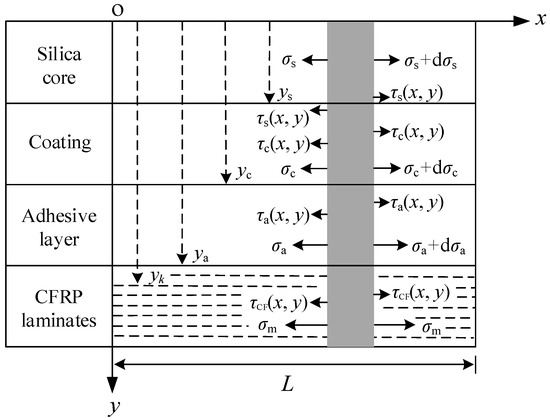
Figure 3.
Coordinate system of the measurement structure.
Each fabric layer in CFRP laminates is orthotropic. According to Hooke’s law, the relationship between stress and strain can be defined as
where {ε}m = [ε11 ε22 ε33 γ12 γ23 γ31] and {σ}m = [σ11 σ22 σ33 τ12 τ23 τ31] are the strain and stress matrixes, respectively. The elastic matrix [C]m is described as follows:
where E1, E2 and E3 are the elasticity modulus of fabric layer along principal axes 1, 2 and 3. G12 is the shear modulus in the plane formed by principal axes 1 and 2. G23 is the shear modulus in the plane formed by principal axes 2 and 3, and G31 is the shear modulus in the plane formed by principal axes 3 and 1. μ12, μ21, μ31, μ13, μ23, and μ32 represent the corresponding Poisson’s coefficients. If the fiber direction of a fabric layer is θ in the coordinate system, the transformation matrix [T] can be expressed as
According to (6) and (7), the elastic matrix can be described in the coordinate system as
The external forces are parallel to the x axis, and the measurement structure is symmetrical about the x-y plane. Hence, τ23 is equal to 0. Equation (8) is introduced to Hooke’s law, and the relationship between shear strain and shear stress in x-y plane can be derived as follows:
where γCF and τCF represent the shear strain and shear stress of the fabric layer. Besides this, mechanics equations can be established in the coordinate system for each part of the measurement structure according to their stress state. For the silica core, the equation can be derived as
In the coating, the equation is obtained as
In the adhesive layer, the equation can be described as
In the CFRP laminates, the equation can be derived as
The CFRP laminates are very thin, and there is no shear stress on the lower surface of the laminates. Hence, the boundary condition can be applied as follows:
where yn is the thickness of the CFRP laminates. By substituting (12) and (14) into (13), an equation can be derived as follows:
Based on the Hypothesis 1, Hooke’s law σ = Eε is suitable for the silica core, the coating, and the adhesive layer. The adhesive layer thickness is much smaller than the gauge length, and bonds between all the two interfaces are intact according to the Hypothesis 2. Hence, the strain gradients of the four parts are expected to be of the same order [24], which can be described as
where εs, εc, and εa are the normal strain of the silica core, the coating, and the adhesive layer, respectively. The relationship between displacement u and shearing strain γ can be derived based on shear-lag theory [34,35,36] as follows:
where k is a positive integer and not greater than n; y0 is equal to ya; γc and γa are the shear strain of the coating and the adhesive layer; γCF is the shear strain of the fabric layer. Then, Equation (9) is substituted into (17). Hooke’s law τc = Gcγc and τa = Gaγa are applied to the coating and adhesive layer, where Gc and Ga represent the shear modulus of coating and adhesive layer. By taking the derivative with respect to x, it can be obtained as
where θk is the direction of the k-th fabric layer. By introducing Hooke’s law σ = Eε and Equations (11), (12), and (15) into (18), the following equations can be derived:
where Es, Ec and Ea are the elasticity modulus of the silica core, coating, and adhesive layer, respectively. Sum over all the terms in (19), and a differential equation can be obtained as follows:
where
The fiber core is not loaded directly or loaded by the adhesive layer beyond both ends of the measurement structure. Hence, the strain value is zero at the both ends of fiber core, which can be described as
Besides this, ε(x,ys) is equal to the strain of the fiber core εs(x), and ε(x,yn) is equal to the host material original strain εm(x). According to (20), (21), and (22), the strain transfer distribution ratio along the x axis is derived as
Because the strain transfer varies at different points of the optical fiber, the strain transfer distribution ratio β(x) describes the ratio, between the measured strain and the host material strain, at a certain coordinate point x [37]. Generally, the strain measured by an FBG sensor is the average strain over the gauge length of the fiber. The average strain transfers ratio of the FBG sensor can be expressed by the following form:
The average strain transfer ratio is defined as the average value of the strain transfer distribution ratio along the whole gauge length [38] as calculated in (24). The average strain transfer ratio can evaluate the difference between the strain measured by FBG sensors and the original strain in the host material for the whole gauge length. The value of the average strain transfer ratio varies from 0 to 1. When the average strain transfer ratio is close to 1, most of the strain in the host material is transferred to FBG sensors, and a relatively accurate strain measurement result will be obtained. If the average strain transfer ratio is close to 0, most of the strain is lost for the strain transfer, and the strain measurement accuracy is relatively low. Therefore, the average strain transfer ratio indicates the strain transfer efficiency. In addition, as the average strain transfer ratio is the ratio between the strain measured by FBG sensors and the strain in the host material, the ratio can be used to compensate the strain transfer loss during the strain measurement.
3. Analysis of Strain Transfer Influential Factors
The strain transfer characteristics are decided by coefficient ω and bonding length L according to Equations (23) and (24). The coefficient ω contains geometrical and mechanical parameters of the measurement structure, and it is the synthesis of δ1, δ2, and δ3 according to (21). Coefficient δ1 includes the parameters of the silica core and the coating which are regarded as constants for a certain FBG sensor. Coefficient δ2 indicates the interactions between the FBG sensor and adhesive layer. The coefficient δ2 can be influenced by geometrical parameters and the elasticity modulus of the adhesive layer, which has been investigated in previous papers [22,28]. Coefficient δ3 mainly describes the interactions between the adhesive layer and the CFRP laminates. The configuration of CFRP laminates influences the coefficient δ3 by changing strain transfer characteristics. According to the analysis in Section 2, the configuration is determined by stacking direction, stacking number, and stacking sequence. Therefore, the effect of the three factors on the strain transfer characteristics is further analyzed. In this paper, the fabric layers are placed in three kinds of directions: 0°, ±45°and 90°. The ±45° layers come in pairs to keep the symmetry of CFRP laminates. Table 1 shows the geometrical and mechanical parameters (at 20 °C) of the measurement structure.

Table 1.
Mechanical and geometrical parameters of the measurement structure.
3.1. The Influence of Stacking Directions
To analyze the influence of the stacking directions, CFRP laminates with stacking directions [0/0/0/0]4s, [45/−45/45/−45]4s, and [90/90/90/90]4s are separately applied to (21) and (23). The strain transfer distribution ratio curves with the three stacking directions are shown in Figure 4. The curves are exhibited from 0 mm to 5 mm as the measurement structure is axisymmetric. The maximum values of the three curves are all observed at 5 mm, and the curves rapidly decrease as they approach 0 mm. Hence, most of the strain can be transferred to the fiber core at 5 mm, and the differences between the strain measured by FBG sensors and the original strain in the CFRP laminates gradually enlarge when it is close to the endpoint (0 mm). The figure denotes that the stacking directions have a big influence on the strain transfer. The curve with stacking direction [0/0/0/0]4s is the highest while the curve with stacking direction [90/90/90/90]4s is the lowest in the figure. The average strain transfer ratios with stacking directions [0/0/0/0]4s, [45/−45/45/−45]4s, and [90/90/90/90]4s are 85.1%, 78.6%, and 73.7%, respectively. It indicates that the configuration of more ±45° and 90°stacking directions reduces the x-direction stiffness of CFRP laminates, which is disadvantageous for the strain transfer. Evidently, the CFRP laminates with bigger stacking directions have lower average strain transfer ratios. Carbon-fiber fabrics are orthotropic and their elasticity modulus along carbon-fiber direction is significantly higher than the elasticity modulus along other directions. When carbon-fiber fabrics in CFRP laminates have bigger stacking directions, the angles between carbon-fiber directions and the x-direction (the optical fiber direction) will increase. Hence, the x-direction elasticity modulus decreases with the stacking directions enlarging. According to the previous study [28], the host material of low elasticity modulus is disadvantageous for the strain transfer, and therefore CFRP laminates with more ±45° and 90°stacking directions have lower average strain transfer ratios. The theoretical analysis above is consistent with the model calculation results, as shown in Figure 4.
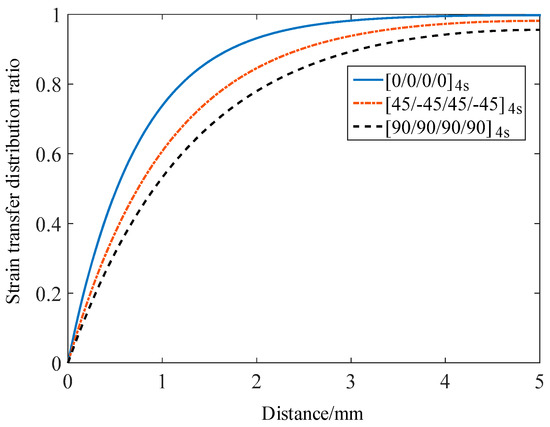
Figure 4.
Strain transfer distribution ratio curves with stacking directions [0/0/0/0]4s, [45/−45/45/−45]4s, and [90/90/90/90]4s.
3.2. The Influence of Stacking Numbers
The average strain transfer ratios are compared by changing the stacking numbers of CFRP laminates. Stacking numbers are set to be 4, 8, 12, 16, and 20 which are commonly used for the fabrication of CFRP laminates. To improve the universality of the comparison, the configuration of CFRP laminates is designed by repeating three kinds of stacking units [0/0/0/0], [45/−45/45/−45], and [90/90/90/90] separately. The average strain transfer ratios are calculated with different stacking numbers as shown in Figure 5. It can be observed that the ratios are significantly affected by the stacking numbers. All of the three curves show downward trends with the stacking numbers increasing, but the trends weaken gradually. The ratio of [0/0/0/0] stacking unit is the highest, while the ratio of [90/90/90/90] stacking unit is the lowest for the same stacking number. When stacking numbers increase from 4 to 20, the ratios fall by 7.2%, 11.9%, and 15.4% for stacking units [0/0/0/0], [45/−45/45/−45], and [90/90/90/90] respectively. Therefore, it can be concluded that the average strain transfer ratios decrease with the increase of stacking numbers, and the decreasing trend is sharper for CFRP laminates with bigger direction angles.
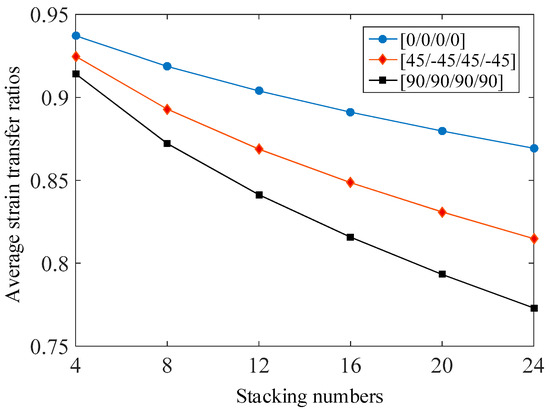
Figure 5.
Average strain transfer ratios of stacking units [0/0/0/0], [45/−45/45/−45], and [90/90/90/90] under different stacking numbers.
3.3. The Influence of Stacking Sequences
Stacking sequences describe the arrangement order of carbon-fiber fabric layers in CFRP laminates. To analyze the influence of the stacking sequences, the average strain transfer ratios of CFRP laminates [08/908], [0/90]8, [90/0]8, and [908/08] are calculated according to (21) and (24) as theoretical results, which are 87.1%, 85.1%, 84.6%, and 82.9%, respectively. The stacking numbers and stacking directions of the four CFRP laminates are the same. However, CFRP laminates whose 90° fabric layers are closer to the adhesive layer tend to have lower average strain transfer ratios. To verify the conclusion, the measurement structure was simulated in the ANSYS 15.0 software as shown in Figure 6a. The simulation parameters were set according to Table 1. The same strain value was applied to all of the four CFRP laminates by setting displacement boundary conditions. The average strain transfer ratios according to the simulation analysis are obtained as simulation results. The simulation results are 87.3%, 85.2%, 84.5%, and 83.0% for CFRP laminates [08/908], [0/90]8, [90/0]8, and [908/08], respectively. The average strain transfer ratios according to both the theory model and the simulation analysis are shown in Figure 6b. The errors between theoretical results and simulation results are less than 0.3%, which indicates a good consistency.
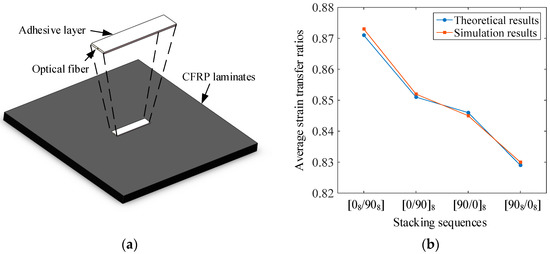
Figure 6.
Finite element simulation of strain transfer. (a) Measurement structure simulated in the ANSYS 15.0 software; (b) Comparison of average strain transfer ratios between theoretical results and simulation results.
The strain fields of measurement structures with stacking sequences [08/908], [0/90]8, [90/0]8, and [908/08] are exhibited from Figure 7a–d, respectively. It shows that the adhesive layers have a reaction to CFRP laminates. The reaction reduces the strain field intensity, which is more distinct from Figure 7a–d. The x-direction stiffness in the surfaces of the CFRP laminates declines when more 90° fabrics stack in the upper layers. The reaction effect is more significant with relatively low surface stiffness, and the average strain transfer ratios become lower. Therefore, the stacking sequences influence the strain transfer by changing the surface stiffness of CFRP laminates.
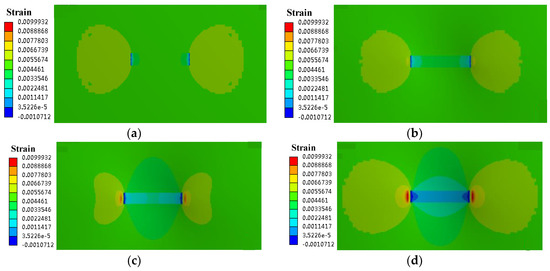
Figure 7.
Simulation results of measurement structures with different stacking sequences. (a) Strain field for stacking sequence [08/908]; (b) Strain field for stacking sequence [0/90]8; (c) Strain field for stacking sequence [90/0]8; (d) Strain field for stacking sequence [908/08].
3.4. The Influence of Temperature
In the strain measurement using FBG sensors, the cross-sensitivity with temperature is a major issue to be addressed. As FBG sensors are sensitive to both strain and temperature, the effect of temperature changes on the strain measurement should be compensated. In this paper, an FBG sensor with same mechanical and optical characteristics is used as the temperature compensation sensor. As the thermal expansion coefficients of FBG sensors and CFRP laminates are different, the temperature sensitivity of FBG sensors may change after the installation. Therefore, the compensation sensor is installed on another CFRP laminate sample which has the same configuration as the CFRP laminates under test, and the installation parameters for the temperature compensation sensor are also equal to the installation parameters for the strain measuring sensor. The compensation structure is at the same temperature as the strain measuring sensor, but it is free from mechanical load. Hence, the temperature changes cause the identical wavelength shift for both the strain measuring sensor and the compensation sensor. Then, the wavelength shift of the compensation sensor is subtracted from that of the strain measuring sensor according to (4), and the cross-sensitivity with temperature in the strain measurement can be compensated. In fact, the strain measuring sensor and the compensation sensor are in the same environment, and the mechanical load is the only difference between them. Therefore, the sensitivity of the strain measuring sensor to other environmental parameters can also be eliminated by this compensation.
The strain transfer is also affected by the temperature which is indirectly incorporated in the strain transfer model. The values of elastic modulus and shear modulus in the model change with the temperature variation, and therefore there is an influence on the average strain transfer ratio. To analyze the influence, the average strain transfer ratios at four different temperatures, 20 °C, 40 °C, 60 °C, and 80 °C are calculated by substituting corresponding mechanical parameters into (21) and (24). The geometric parameters of the measurement structure are shown in Table 1 and its mechanical parameters at different temperatures are listed in Table 1 and Table 2.
Table 2.
Mechanical parameters at 40 °C, 60 °C, and 80 °C.
CFRP laminates [0/0/0/0]4s, [45/−45/45/−45]4s, and [90/90/90/90]4s are used for the calculation, and their average strain transfer ratios at different temperatures are shown in Figure 8. It indicates that the average strain transfer ratio of CFRP laminates [0/0/0/0]4s is the highest while the average strain transfer ratio of CFRP laminates [90/90/90/90]4s is the lowest at each temperature. With temperature rising from 20 °C to 80 °C, average strain transfer ratios enhance from 85.07% to 85.41%, from 78.63%to 79.16%, and from 73.74% to 74.40% for CFRP laminates [0/0/0/0]4s, [45/−45/45/−45]4s, and [90/90/90/90]4s, respectively. The values of elastic modulus and shear modulus decrease with temperature increasing. As the modulus of the silica core declines more than that of other three materials according to Table 2, the optical fiber is relatively more ductile at a higher temperature, which is beneficial to the strain transfer. Therefore, temperature can affect the strain transfer ratio by changing the elastic modulus. Besides, since the thermal expansion coefficients of silica core, coating, adhesive layer, and CFRP laminates are different, the temperature changes can generate residual stress in the measurement structure, which will cause the distortion of FBG sensor spectra [18]. To avoid this, the installation of FBG sensors and their strain measurement experiments should be kept in the same temperature environment.
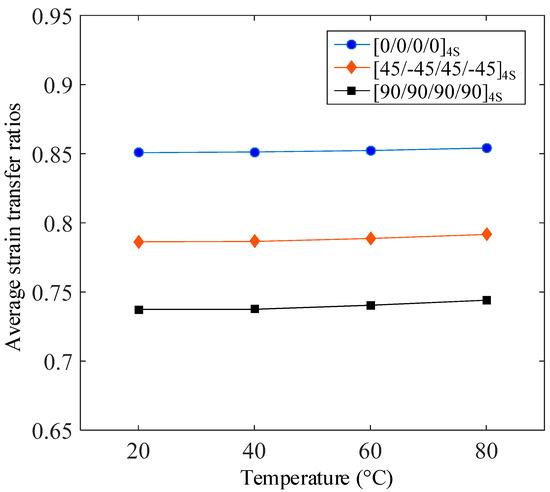
Figure 8.
Average strain transfer ratios at 20 °C, 40 °C, 60 °C and 80 °C.
4. Experimental Verification
4.1. Accuracy Validation for the Proposed Strain Transfer Model
A strain transfer experiment was conducted to verify the accuracy of the strain transfer model. The experiment was carried out on a nondestructive tensile system. The system contains three basic instruments, which are the strain applying unit SC300 (Zolix Instruments Co., Ltd., Beijing, China), the laser interferometer XL-80 (Renishaw plc, Wotton-under-Edge, UK) and the interrogator SM-130 (Micron Optics, Inc., Atlanta, USA) as shown in Figure 9a.
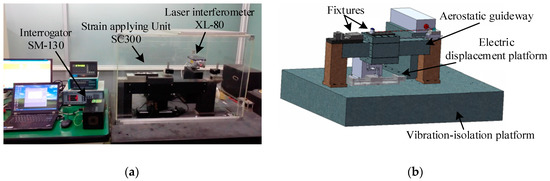
Figure 9.
Strain transfer experimental facilities. (a) Nondestructive tensile system; (b) Schematic of strain applying unit.
The strain applying unit SC300 is a material stretching instrument which can cause the deformation of CFRP laminates. The strain applying unit consists of a vibration-isolation platform, an aerostatic guideway, an electric displacement platform and two fixtures, as shown in Figure 9b. The aerostatic guideway is installed on the vibration-isolation platform and driven by the electric displacement platform. The laser interferometer XL-80 is a displacement measurement instrument, and the moving distance of the fixture can be measured by XL-80.
The interrogator SM-130 is the standard FBG interrogator, which is used to detect the signal of FBG sensors. The interrogation scheme of the SM-130 is based on the tunable Fabry-Perot filter [39]. The Fabry-Perot filter converts a broadband light into a single wavelength light to illuminate FBG sensors. A ramp scanning voltage drives the Fabry-Perot filter to change the wavelength of the light, and therefore the wavelength has a specific relationship with the value of scanning voltage. When the wavelength of the light is the same as the Bragg wavelength, the light is reflected by the FBG sensors. The photoelectric detector detects the reflected light, and the Bragg wavelength can be interrogated according to the value of scanning voltage at the moment. To compensate temperature changes, the strain measuring sensor and the temperature compensation sensor are separately connected to the two optical-fiber signal channels of the interrogator. The wavelength shifts of the strain measuring sensor and the temperature compensation sensor are detected simultaneously and recorded respectively as ΔλB and ΔλT. Then, the wavelength shift caused by strain is obtained according to (4), and the measured strain can be calculated according to (3).
Three kinds of CFRP laminate specimens were used in the experiment as shown in Figure 10a. The stacking sequence of the specimen 1 is [45/0/−45/90/45/0/−45/0/45/0/−45/90/45/0/−45/0]s, and the stacking sequence of the specimen 2 is [45/0/−45/90/45/0/−45/90/45/0/−45/0]s. The stacking sequence is [45/0/−45/90]2s for specimen 3. These CFRP laminate specimens can be used in the manufacture of aircraft skins. The specimens are rectangle-shaped with loading areas at the two endpoints, and the loading areas are reinforced to be completely clamped. The distance between the loading areas is l. The CFRP laminate specimens were fixed on the strain applying unit by clamping both sides of loading areas with the two fixtures. The homogeneous strain was applied to the specimens when one of fixtures moved along the aerostatic guideway. The moving distance Δl was measured by the laser interferometer, and the applied strain εm was calculated according to
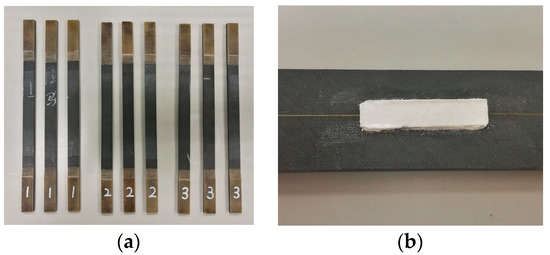
Figure 10.
Specimens and the measurement structure. (a) Three kinds of CFRP laminate specimens; (b) FBG sensor bonded to a specimen.
FBG sensors were bonded to specimens with Loctite epoxy adhesive 1C-LV (Henkel AG & Co., KGaA, Duesseldorf, Germany). The measurement structure and its characteristic parameters are exhibited in Figure 10b and Table 1. The environmental temperature during the installation of FBG sensors and their experiments is kept as close as possible to 20 °C. The FBG sensor is made of germanium-doped silica optical fiber. The effective refractive index of the optical fiber neff is 1.456; the Poisson’s ratio ν is 0.170; the elasto-optical coefficients P11 and P12 are 0.121 and 0.270, respectively. The optical wavelength is 1550 nm. When tensile load was applied to specimens, the strain of specimens was transferred to the FBG sensors. The interrogator recorded the wavelength shift, and the measured strain can be calculated. Moreover, in the experiment, the hypotheses (1) and (2) should be satisfied by fully curing the adhesive layer and preventing the damage of the measurement structure. In fact, when the hypotheses are not satisfied, there can be cracks in the measurement structure, and the FBG sensors may have been damaged. In that case, the measured strain is significantly different from the original strain, and the measurement results are inauthentic.
In the experiment, the applied strain εm was set to be 500 με, 1000 με, 1500 με, 2000 με, 2500 με, and 3000 με by changing moving distances of the fixture. The experiment was conducted with the specimens 1, 2, and 3. Three samples of each kind of specimen were used to repeat the experiment. The strain of the three samples was sensed by the FBG sensors, and the influence of temperature changes was compensated as described in Section 3.4. The average value of the strain recorded by the sensors under the same moving distance was regarded as corresponding measured strain εs to reduce random errors. The relationship between the measured strain εs and the applied strain εm is shown in Figure 11. The experimental data of the three stacking sequences were fitted by the linear regression functions. All the regression correlation coefficients R2 are more than 0.99, which indicates a good linear relationship between the measured strain εs and the applied strain εm. The slopes of the linear regression functions indicate average strain transfer ratios. They are 79.6% for specimen 1, 82.6% for specimen 2, and 85.3% for specimen 3. The experimental results illustrate that average strain transfer ratios are inconsistent for CFRP laminates with different stacking sequences. The theoretical average strain transfer ratios for specimen 1, specimen 2, and specimen 3 are 80.0%, 82.3%, and 84.9%, respectively. The maximum error between the theoretical and experimental results is less than 0.5%. This demonstrates that the theoretical results are coincident with experimental results for all the three stacking sequences. Therefore, the accuracy of the proposed strain transfer model can be verified.
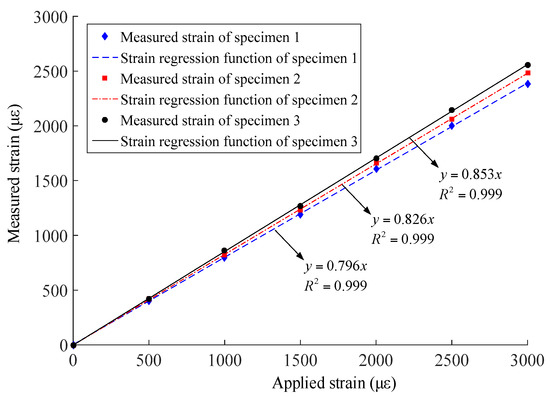
Figure 11.
Relationship between the measured strain and the applied strain.
4.2. Practicality Validation in the Strain Measurement of the CFRP Wing Skin
The strain testing of aviation structures is very important for aircraft design and manufacture. Another strain measurement experiment was conducted on the aircraft wing skin made of CFRP laminates to verify the practicality of the proposed strain transfer model. The wing was fixed on a static steel frame as shown in Figure 12a. To simulate the deformation of the wing in flight, four loading positions were evenly distributed on the lower surface of the wing. The loading positions were connected to a tensile tester with a two-stage transmission mechanism. The force at each loading position is a quarter of the total loading force applied by the tensile tester. Thus, the deformation of the wing can be controlled by changing the loading force of the tensile tester. FBG sensors 1, 2, and 3 were respectively bonded to the installing points 1, 2, and 3 on the surface of the wing skin as shown in Figure 12b. The stacking sequences of the CFRP laminates at the installing points are same as the stacking sequences of the three specimens in Section 4.1, and 3 FBG sensors were respectively bonded to the specimens 1, 2, and 3 as temperature compensation sensors. The geometrical and mechanical parameters of the adhesive layer and optical fiber are shown in Table 1. The protective paint at the installing points was removed to improve the measurement accuracy. The wavelength of all the FBG sensors is 1550 nm, and the wavelength shifts were detected by interrogator SM-130. The loading force was set to 2000 N, 4000 N, 6000 N, 8000 N, and 10000 N. The measured strain obtained by FBG sensors 1, 2, and 3 was recorded. According to Section 4.1, the measured strain of FBG sensors 1, 2, and 3 was compensated based on the theoretical average strain transfer ratios 80.0%, 82.3%, and 84.9%, respectively.
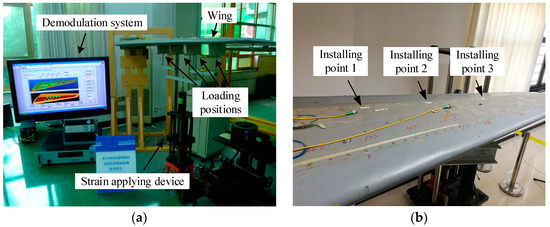
Figure 12.
Strain measurement experiment on the aircraft wing skin (a) Loading and measuring system; (b) Installing points of FBG sensors.
To obtain the strain field of the wing skin under different load conditions, a finite element model was established in strict accordance with the wing structure. The 3D wing model is shown in Figure 13a. The wing skeleton and the wing skin are made of aluminum alloy and CFRP laminates, respectively. The length of the wing is 2.40 m. The width is 0.96 m to 0.48 m, and the thickness is 0.13 m to 0.07 m. The simulation was conducted with ANSYS 15.0 finite element analysis software. Hexahedral grids were generated for the model. The fixed constraint was applied to the junction surface between the wing and the static steel frame, and the loading force constraints were applied to the four loading positions of the wing. The strain field of the wing skin was generated as shown in Figure 13b, and the strain at the installing points 1, 2, and 3 was obtained correspondingly.
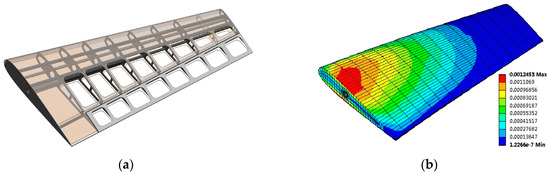
Figure 13.
Aircraft wing finite element simulation. (a) Aircraft wing 3D model; (b) Strain field of the wing skin.
The wavelength shift of FBG sensor 1, 2, or 3 is denoted by ΔλB, and the wavelength shift of corresponding temperature compensation sensor is represented by ΔλT. The measured strain can be obtained according to (3) and (4). Besides, the modified strain can be calculated based on the definition of the average strain transfer ratio as follows:
where εms is measured strain. ?β represents theoretical average strain transfer ratios which are 80.0%, 82.3%, and 84.9% for FBG sensors 1, 2, and 3, respectively. The comparison among the measured strain, simulated strain and modified strain at installing points 1, 2, and 3 is shown in Figure 14. The strain of the wing skin decreases from the root part to the leading edge according to both the experimental results and the simulation results. The measured strain, simulated strain, and modified strain all ascend with the increase of the loading force. However, the maximum relative errors between measured strain and simulated strain are 21.4%, 19.1%, and 16.4% for FBG sensors 1, 2, and 3. By compensating the measured strain with corresponding strain transfer ratios, the modified strain is more consistent with the simulation results. The maximum relative errors reduce to 1.9%, 1.7%, and 1.9% for FBG sensors 1, 2, and 3. The comparison results indicate that the measurement errors decrease by 11.6% to 19.8% based on the compensation with corresponding transfer ratios. Therefore, the proposed strain transfer model is practical and suitable for compensating the strain measurement errors of FBG sensors bonded to CFRP laminates.
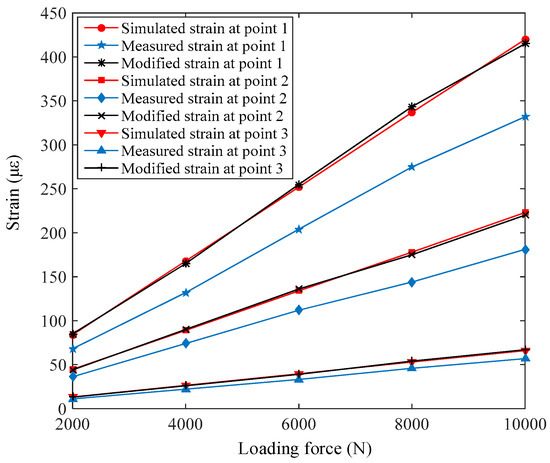
Figure 14.
Comparison among measured strain, modified strain, and simulated strain at the three installing points.
5. Conclusions
In this paper, a strain transfer model has been proposed for FBG sensors bonded to the surface of CFRP laminates. The measurement structure was abstracted into the silica core, coating, adhesive layer, and CFRP laminates, and the CFRP laminates were regarded as an anisotropic multilayered structure. A coordinate system was set up for the measurement structure, and the strain transfer function was derived according to the shear-lag theory.
The strain transfer characteristics were analyzed according to the transfer function. The stacking directions, stacking numbers, and stacking sequences of CFRP laminates have a distinct influence on the strain transfer efficiency. The CFRP laminates with bigger direction angles, larger stacking numbers, and lower surface stiffness are disadvantageous for the strain transfer. The effect of the cross-sensitivity on strain measurement was compensated and the influence of temperature on the strain transfer model was discussed.
The accuracy of the proposed model was verified by experiments on a nondestructive tensile system using three kinds of CFRP laminate specimens. The maximum error between theoretical calculation and experimental results is less than 0.5%. Besides, the model was applied to the strain measurement of the CFRP wing skin. The experimental results indicate that the proposed model can significantly compensate strain measurement errors. The measurement errors decrease by 11.6% to 19.8% after the compensation. The work can be used as a reference to enhance the strain measurement accuracy of CFRP laminates.
Author Contributions
Conceptualization, Z.W. and H.L.; Data curation, J.X.; Investigation, H.L and L.Z.; Methodology, H.L.; Resources, J.X.; Supervision, L.Z. and J.X.; Visualization, H.L.; Writing—original draft, H.L.; Writing—review & editing, Z.W.
Funding
This research was funded by [National Key Research and Development Plan of China] grant number [2016YFF0203801] and [Natural Science Foundation of China] grant number [No.51575032].
Conflicts of Interest
The authors declare no conflict of interest.
References
- Jandejsek, I.; Jakubek, J.; Jakubek, M.; Prucha, P.; Krejci, F.; Soukup, P.; Turecek, D.; Vavrik, D.; Zemlicka, J. X-ray inspection of composite materials for aircraft structures using detectors of Medipix type. J. Instrum. 2014, 9, C05062. [Google Scholar] [CrossRef]
- Mueller, E.M.; Starnes, S.; Strickland, N.; Kenny, P.; Williams, C. The detection, inspection, and failure analysis of a composite wing skin defect on a tactical aircraft. Compos. Struct. 2016, 145, 186–193. [Google Scholar] [CrossRef]
- Shrestha, P.; Park, Y.; Kim, C.G. Low velocity impact localization on composite wing structure using error outlier based algorithm and FBG sensors. Compos. Part B Eng. 2017, 116, 298–312. [Google Scholar] [CrossRef]
- Karimi, N.Z.; Minak, G.; Kianfar, P. Analysis of damage mechanisms in drilling of composite materials by acoustic emission. Compos. Struct. 2015, 131, 107–114. [Google Scholar] [CrossRef]
- Reifsnider, K. Fatigue behavior of composite materials. Int. J. Fract. 1980, 16, 563–583. [Google Scholar] [CrossRef]
- Kim, J.H.; Park, Y.; Kim, Y.Y.; Shrestha, P.; Kim, C.G. Aircraft health and usage monitoring system for in-flight strain measurement of a wing structure. Smart Mater. Struct. 2015, 24, 105003. [Google Scholar] [CrossRef]
- Ferreira, M.S.; Vieira, J.; Frias, C.; Frazão, O. Simultaneous measurement of strain and temperature using fiber bragg grating sensors embedded in hybrid composite laminates. Meas. Sci. Technol. 2011, 22, 045206. [Google Scholar] [CrossRef]
- Konka, H.P.; Wahab, M.A.; Lian, K. The effects of embedded piezoelectric fiber composite sensors on the structural integrity of glass-fiber-epoxy composite laminate. Smart Mater. Struct. 2012, 21, 015016. [Google Scholar] [CrossRef]
- Sierra-Perez, J.; Guemes, A.; Mujica, L.E.; Ruiz, M. Damage detection in composite materials structures under variable loads conditions by using fiber Bragg gratings and principal component analysis, involving new unfolding and scaling methods. J. Intell. Mater. Syst. Struct. 2015, 26, 1346–1359. [Google Scholar] [CrossRef]
- Ashrafi, M.; Tuttle, M.E. High strain gradient measurements in notched laminated composite panels by digital image correlation. In Composite, Hybrid, and Multifunctional Materials; Springer: Cham, Switzerland, 2015; Volume 4, pp. 75–81. [Google Scholar]
- Choi, B.H.; Kwon, I.B. Residual strain sensor using Al-packaged optical fiber and Brillouin optical correlation domain analysis. Opt. Express 2015, 23, 6867–6877. [Google Scholar] [CrossRef] [PubMed]
- Rezayat, A.; Pauw, B.D.; Lamberti, A.; El-Kafafy, M.; Nassiri, V.; Ertveldt, J.; Arroud, G.; Vanlanduit, S.; Guillaume, P. Reconstruction of impacts on a composite plate using fiber Bragg gratings (FBG) and inverse methods. Compos. Struct. 2016, 149, 1–10. [Google Scholar] [CrossRef]
- Kwon, I.B.; Im, J.; Choi, K.S.; Kim, M.; Hwang, T.K. Aluminum-thin-film packaged fiber Bragg grating probes for monitoring the maximum tensile strain of composite materials. Appl. Opt. 2014, 53, 3615–3620. [Google Scholar]
- Lu, S.; Jiang, M.; Sui, Q.; Sai, Y.; Jia, L. Damage identification system of CFRP using fiber Bragg grating sensors. Compos. Struct. 2015, 125, 400–406. [Google Scholar] [CrossRef]
- Li, R.; Chen, Y.; Tan, Y.; Zhou, Z.; Li, T.; Mao, J. Sensitivity Enhancement of FBG-Based Strain Sensor. Sensors 2018, 18, 1607. [Google Scholar] [CrossRef] [PubMed]
- Torres, B.; Payá-Zaforteza, I.; Calderón, P.A. Analysis of the strain transfer in a new FBG sensor for Structural Health Monitoring. Eng. Struct. 2011, 33, 539–548. [Google Scholar] [CrossRef]
- Dunphy, J.R.; Ball, G.A.; D’Amato, F.X. Instrumentation development in support of fiber grating sensor arrays. In Distributed and Multiplexed Fiber Optic Sensors III; SPIE: Washington, DC, USA, 1993; pp. 2–12. [Google Scholar]
- Dunphy, J.R.; Meltz, G.; Varasi, M.; Vannucci, A.; Signorazzi, M.; Ferraro, P.; Imparato, S.I.; Voto, C. Embedded Optical Sensor Capable of Strain and Temperature Measurement Using a Single Diffraction Grating. U.S. Patent 5,399,854, 21 March 1995. [Google Scholar]
- Ferraro, P.; Natale, G.D. On the possible use of optical fiber Bragg gratings as strain sensors for geodynamical monitoring. Opt. Lasers Eng. 2002, 37, 115–130. [Google Scholar] [CrossRef]
- Hu, D.; Guo, Y.; Chen, X.; Zhang, C. Cable force health monitoring of Tongwamen bridge based on fiber Bragg grating. Appl. Sci. 2017, 7, 384. [Google Scholar] [CrossRef]
- Leduc, D.; Lecieux, Y.; Morvan, P.A.; Lupi, C. Architecture of optical fiber sensor for the simultaneous measurement of axial and radial strains. Smart Mater. Struct. 2013, 22, 075002. [Google Scholar] [CrossRef]
- Duan, D.; Huang, D.; Zhao, H. Fiber Bragg grating-based plane strain monitoring of aerostat envelope structures. Appl. Opt. 2013, 52, 4631–4639. [Google Scholar]
- Luyckx, G.; Voet, E.; De-Waele, W.; Degrieck, J. Multi-axial strain transfer from laminated CFRP composites to embedded Bragg sensor: I. parametric study. Smart Mater. Struct. 2010, 19, 105017. [Google Scholar] [CrossRef]
- Her, S.C.; Huang, C.Y. Effect of Coating on the Strain Transfer of Optical Fiber Sensors. Sensors 2011, 11, 6926–6941. [Google Scholar] [CrossRef] [PubMed]
- Shen, W.; Wang, X.; Xu, L.; Zhao, Y. Strain transferring mechanism analysis of the substrate-bonded FBG sensor. Opt.-Int. J. Light Electron Opt. 2018, 154, 441–452. [Google Scholar] [CrossRef]
- Wan, K.T. Quantitative Sensitivity Analysis of Surface Attached Optical Fiber Strain Sensor. IEEE Sens. J. 2014, 14, 1805–1812. [Google Scholar] [CrossRef]
- Her, S.C.; Huang, C.Y. The Effects of Adhesive and Bonding Length on the Strain Transfer of Optical Fiber Sensors. Appl. Sci. 2016, 6, 13. [Google Scholar] [CrossRef]
- Sun, L.; Li, C.; Li, J.; Zhang, C.; Ding, X. Strain Transfer Analysis of a Clamped Fiber Bragg Grating Sensor. Appl. Sci. 2017, 7, 188. [Google Scholar] [CrossRef]
- Sun, Y.; Liu, J.; Wang, Y. Principles and Application of Polyimide Fiber Bragg Gratings for Surface Strain Measurement. Appl. Sci. 2017, 7, 995. [Google Scholar] [CrossRef]
- Tan, Y.; Meng, L.; Zhang, D. Strain sensing characteristic of ultrasonic excitation-fiber Bragg gratings damage detection technique. Measurement 2013, 46, 294–304. [Google Scholar] [CrossRef]
- Huang, B.; Kim, H.S.; Yoon, G.H. Modeling of a partially debonded piezoelectric actuator in smart composite laminates. Smart Mater. Struct. 2015, 24, 075013. [Google Scholar] [CrossRef]
- Singh, R.K.; Ramadas, C.; Balachandra-Shetty, P.; Satyanarayana, K.G. Identification of delamination interface in composite laminates using scattering characteristics of lamb wave: Numerical and experimental studies. Smart Mater. Struct. 2017, 26, 045017. [Google Scholar] [CrossRef]
- Wan, K.T.; Leung, C.K.Y.; Olson, N.G. Investigation of the strain transfer for surface-attached optical fiber strain sensors. Smart Mater. Struct. 2008, 17, 035037. [Google Scholar] [CrossRef]
- Toll, S. Second order shear lag theory. Compos. Sci. Technol. 2012, 72, 1313–1317. [Google Scholar] [CrossRef]
- Wang, H.; Jiang, L.; Xiang, P. Improving the durability of the optical fiber sensor based on strain transfer analysis. Opt. Fiber Technol. 2018, 42, 97–104. [Google Scholar] [CrossRef]
- Ojo, S.O.; Paggi, M. A 3D coupled thermo-visco-elastic shear-lag formulation for the prediction of residual stresses in photovoltaic modules after lamination. Compos. Struct. 2016, 157, 348–359. [Google Scholar] [CrossRef]
- Wang, Q.; Qiu, Y.; Zhao, H. Analysis of strain transfer of six-layer surface-bonded fiber Bragg gratings. Appl. Opt. 2012, 51, 4129–4138. [Google Scholar] [CrossRef] [PubMed]
- Li, H.; Zhu, L.; Dong, M. Analysis on strain transfer of surface-bonding FBG on Al 7075-T6 alloy host. Opt.-Int. J. Light Electron Opt. 2016, 127, 1233–1236. [Google Scholar] [CrossRef]
- Zhang, W.; Li, Y.; Jin, B.; Ren, F.; Wang, H.; Dai, W. A fiber Bragg grating interrogation system with self-adaption threshold peak detection algorithm. Sensors 2018, 18, 1140. [Google Scholar] [CrossRef] [PubMed]
© 2018 by the authors. Licensee MDPI, Basel, Switzerland. This article is an open access article distributed under the terms and conditions of the Creative Commons Attribution (CC BY) license (http://creativecommons.org/licenses/by/4.0/).