1. Introduction
Object detection represents a significant focus of research in the field of computer vision [
1] that can be applied in driverless cars, robotics, video surveillance and pedestrian detection [
2,
3,
4]. Traditional object detection methods are primarily based on establishing mathematical models according to prior knowledge; such methods include the Hough transform method [
5], the frame-difference method [
6], the background subtraction method [
7], the optical flow method [
8], the sliding window model method [
9] and the deformable part model method [
10]. Specifically, the first four of these methods all operate in a mode based on feature extraction and mathematical modeling, which utilizes certain features of the data to build a mathematical model and then obtains the object detection results by solving that model, whereas the latter two methods operate in a mode based on feature extraction and classification modeling, which combines hand-crafted features (such as SIFT, Scale Invariant Feature Transform [
11]; HOG, Histogram of Oriented Gradients [
12]; and Haar [
13] features) with a classifier (such as SVM [
14] or AdaBoost [
15]) to obtain the object detection results by classifying the features. Recently, deep learning techniques have revolutionized the object detection field by improving object detection accuracy and robustness. Because deep neural networks can automatically learn different features, object detection based on deep learning is characterized by more abundant features and stronger feature representation capabilities than are possible with traditional hand-crafted features [
16].
Currently, the models used in object detection methods based on deep learning can be subcategorized into detection models based on region proposals and detection models based on regression. Models for deep-learning-based object detection based on region proposals first extract candidate regions in the detection area in preparation for subsequent feature extraction and classification. Typical examples of such models include the R-CNN (Regions with CNN features) [
17], SPP-net (Spatial Pyramid Pooling Networks) [
18], Fast R-CNN [
19], Faster R-CNN [
20] and R-FCN (Region-based Fully Convolutional Networks) [
21] models. By contrast, models for deep-learning-based object detection based on regression divide a feature map using certain rules and establish relationships among the predicted bounding boxes, the default bounding boxes and the ground truths for training. Typical examples of models based on regression include YOLO (You Only Look Once) [
22] and SSD (Single Shot Multibox Detector) [
23]. Compared with methods based on region proposals, regression-based methods usually achieve better real-time performance. Although the accuracy of regression-based method generally is poorer than that of region-proposals method, the accuracy gap between them is not always large. For example, the accuracy of SSD is comparable to that of Faster RCNN on VOC 2007 test dataset [
23]. Therefore, if the accuracy and real-time performance are both taken into consideration, regression-based methods will be a good choice. Nevertheless, the detection performances of both YOLO and SSD on small objects are unsatisfactory [
24,
25]. The reason is that small objects may not even have any information at the very top layers of the deep learning model and rich representations are difficult to learn from their poor-quality appearance and structure. Therefore, small object detection is a challenge in the object detection based on deep learning.
This paper proposes a multi-view object detection approach based on deep learning, with the aim of improving the performance of regression-based deep learning models when detecting small objects. In the proposed multi-view approach, the object detection results for a set of divided views are merged to improve the object detection capability. Experimental results demonstrate that this design can substantially improve the detection capability for small objects, which is of great value for improving deep learning technology for further applications in object detection.
2. Disadvantage of Classical Object Detection Methods Based on Regression
Currently, the classical object detection methods based on regression are YOLO and SSD. YOLO is a single neural network that can perform object region detection and object classification simultaneously. Unlike early object detection methods based on region proposals, YOLO achieves end-to-end object detection without dividing the detection process into several stages. SSD is a single shot multibox detector that integrates the regression approach of YOLO with the anchor mechanism of Faster R-CNN [
20]. On the one hand, the regression approach can reduce the computational complexity of a neural network to improve the real-time performance. On the other hand, the anchor mechanism is helpful for extracting features at different scales and different aspect ratios. Moreover, the local feature extraction method of SSD is more reasonable and effective than the general feature extraction method of YOLO with regard to object recognition. Furthermore, because the feature representations corresponding to different scales are different, a multi-scale feature extraction method [
26] has been applied in SSD, thereby enhancing the robustness of object detection at different scales.
Because YOLO divides each image into a fixed grid, the number of detected objects will be limited. For example, consider a grid scale of S × S, where S = 7. Because each grid yields 2 predicted bounding boxes, only 98 predicted bounding boxes are observed in a single detection, which means that no more than 98 objects can be detected at one time. Moreover, because one grid cell can produce predictions for only one class, when objects of two or more classes are located in the same grid cell, they cannot simultaneously be identified. For example, if the input image scale is 448 × 448, then no more than two objects can simultaneously be identified in a single 64 × 64 grid cell, and their classes must be the same. In addition, with respect to YOLO, once the input image has passed through twenty-four convolution layers and four pooling layers, little detailed information can be observed in the resulting feature map. Therefore, YOLO has a relatively poor ability to detect dense small objects.
Unlike YOLO, SSD adopts a multi-scale approach, which means that the feature maps that are used to detect different objects are at different scales. Because each feature map is produced from convolution results at the same level, the convolution receptive fields of the different levels must be different in size. In particular, the receptive field of a high-level convolution layer is significantly larger than those of lower layers, and the extracted information corresponding to a high-level feature layer is more abstract. The more abstract the feature extraction information is, the less detailed the information will be; thus, SSD detection is also insensitive to small objects.
The formula for calculating the convolution receptive field is as follows:
where
is the size of the convolution receptive field of the
-th layer,
is the step length, and
is the size of the filter.
SSD adopts the anchor mechanism, for which the detection results are directly related to the size of the default bounding box produced from the anchors. The ratio of the default bounding box to the input image can be calculated according to the formula given in [
23]. Furthermore, the relationship between the default bounding box and the input image can then be used to determine the region mapped to the input image. To measure the detection capability of a feature map, the minimal default bounding box scale is selected to observe the minimal region mapped to the input image in the feature map.
The mapping of the default bounding box coordinates to the original image coordinates on the feature map is as follows:
where
denotes the center coordinates of the default bounding box,
is the height of the default bounding box,
is the width of the default bounding box,
is the height of the feature map,
is the width of the feature map,
is the size in the
-th feature map,
is the height of the original image,
is the width of the original image, and
denotes the mapping coordinates of the default bounding box, which is centered at
and scaled to a height of
and a width of
in the
-th feature map.
If the SSD_300 × 300 model is adopted, such that the size of the input image is 300 × 300, the feature maps of the model are mainly produced from the Conv4_3, Conv7, Conv8_2, Conv9_2, Conv10_2, and Conv11_2 layers. The sizes of the convolution receptive field and the mapping region of the default bounding box on each feature map are shown in
Table 1.
Table 1 shows that at the Conv9_2 level, most feature points of the feature layer are produced by utilizing the information of the entire input image, which results in comparatively weak differentiation among different objects. Additionally, the mapping region of the default bounding box is more than half the size of the input image; thus, when several objects are simultaneously located in the same region, they cannot be distinguished. This problem is common in object detection based on regression. In such cases, small objects can be recognized and located only by using the information from the previous feature layers. Therefore, SSD has a weak object detection capability for small object detection.
3. Multi-View Modeling
3.1. Establishment of a Multi-View Model
This section may be divided by subheadings. It should provide a concise and precise description of the experimental results, their interpretation as well as the experimental conclusions that can be drawn.
To improve the small object detection performance of a regression-based deep learning model, a region segmentation operation is applied prior to object detection. Each region of the image can be treated as a separate view and magnified to produce more responses on the feature map of the model, in a manner similar to the imaging magnification process observed in the human eye when approaching an object. The details are shown in
Figure 1.
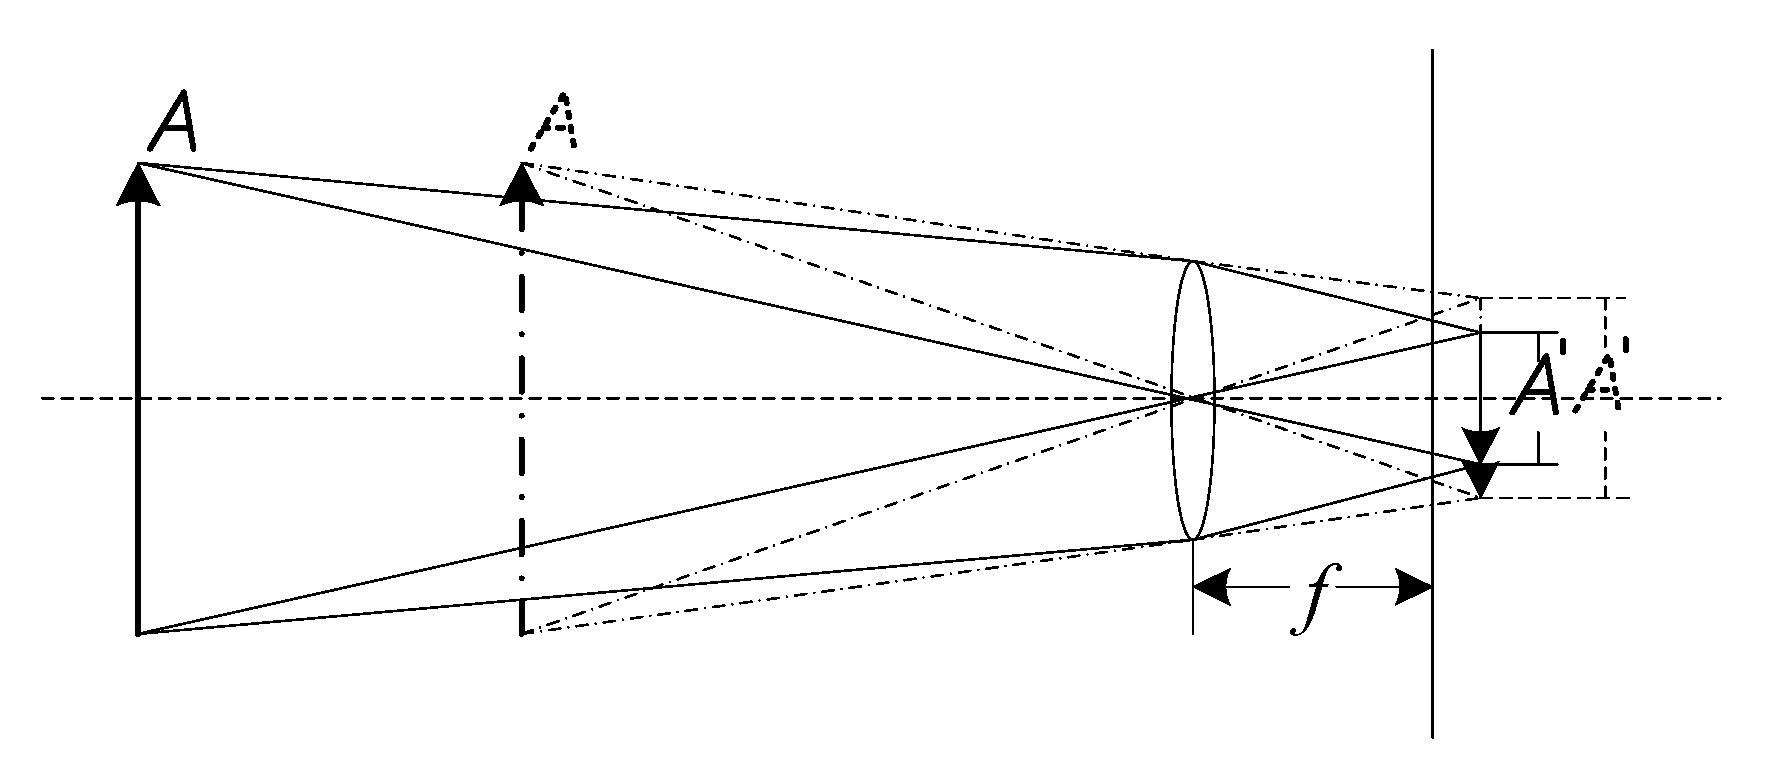
In
Figure 1, the initial imaging process in the human eye is shown by the solid lines, and
is the real image of object
after imaging. Suppose that the focus of the eye remains unchanged while object
moves a certain distance toward the eye; then, the second imaging process is as shown by the dotted lines. In these two processes, the scale of object
does not change, but the image
appears larger after the second imaging process. More visual nerve cells are triggered to generate a visual response, and the human eye can perceive more information about the object. If the perceived information is insufficient, the human eye will barely be able to recognize the object or may not even see it at all. Similarly, in object detection, objects are recognized and located based on the information contained in the feature map of the detection model. Therefore, increasing the information captured in the feature map is an effective means of improving object detection performance.
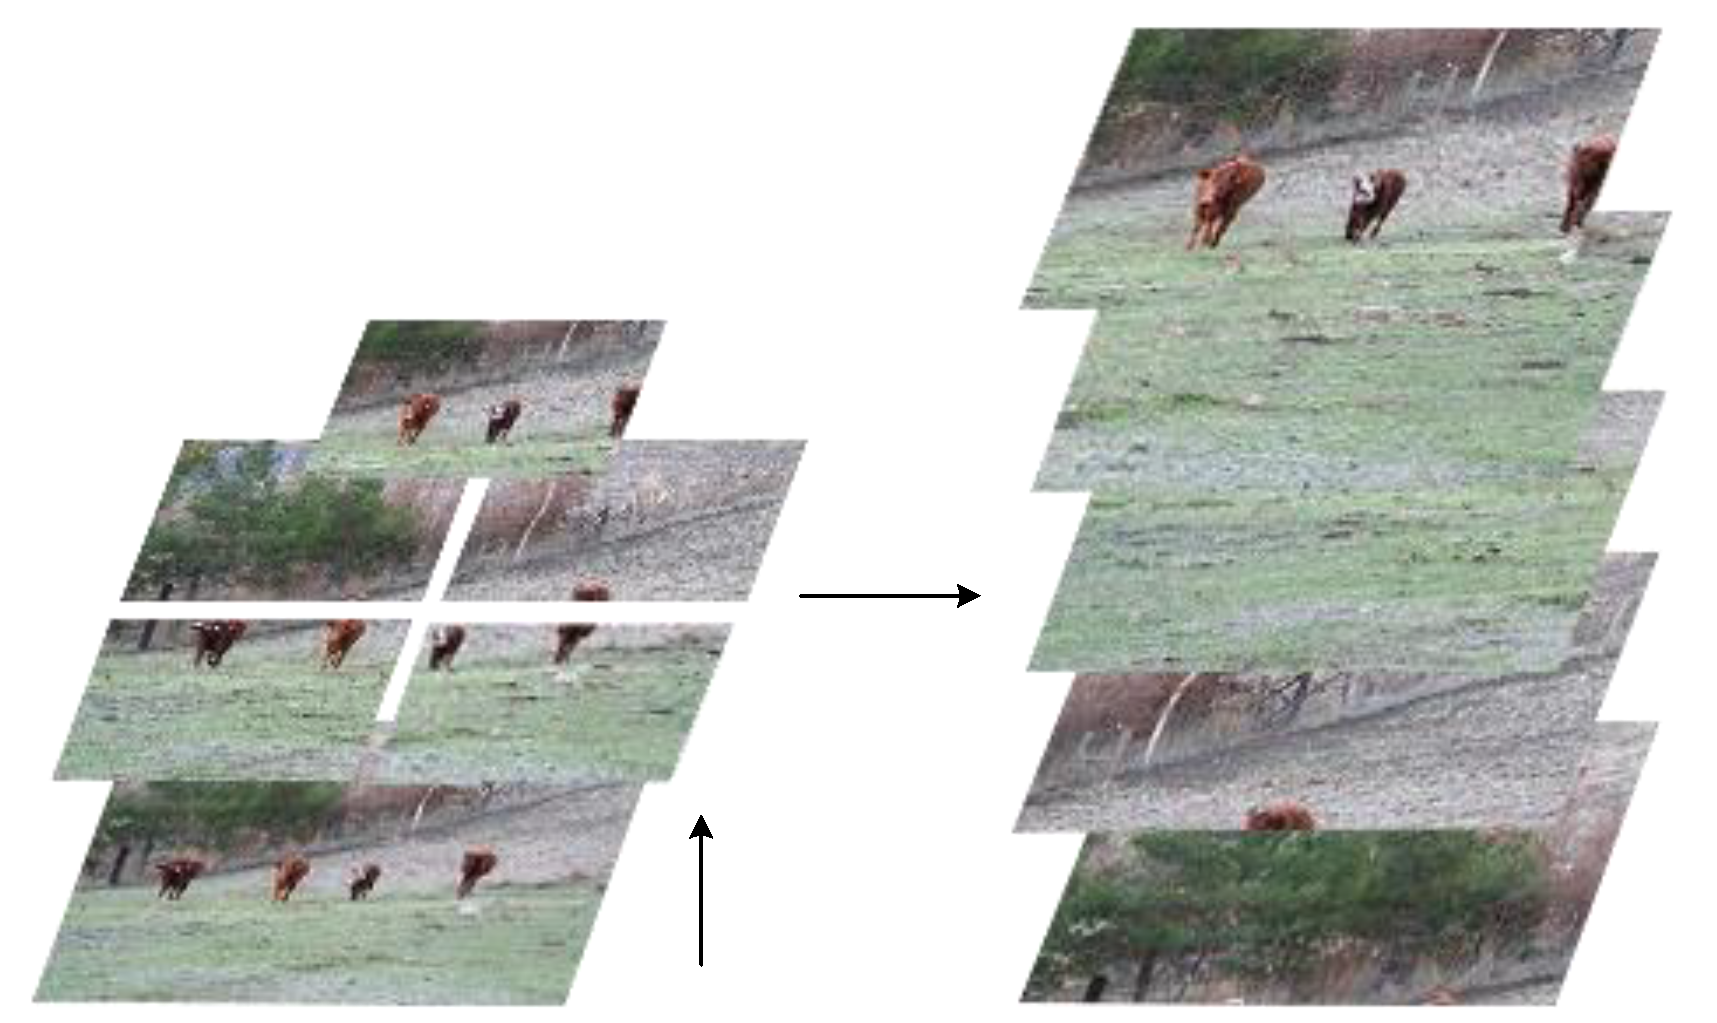
To achieve this purpose, a region magnification operation is applied to magnify the RoIs (regions of interest) of the input image. The input image is divided into four equal regions: upper left, upper right, bottom left and bottom right. In additional, because more salient information is usually contained in the central area, a center region is added along with the above four regions. The center region has the same center point as the input image and 1/2 its scale in both the horizontal and vertical directions. Finally, the five regions are interpolated to generate five images of the same size as the original image. Then, when the images are input into the deep learning model, more response will be obtained in the same level feature map. The details of magnification operation are shown in
Figure 2.
The module that performs the operation described above is called the multi-view module. During the detection process, a set of detection results will be acquired for each region after a single detection; thus, five sets of object detection results will be generated. Because the original image is cut into different regions, a cutting phenomenon will be observed in the detection results. Therefore, a merging module is needed at the end of the process. The merging module integrates the results obtained for each region to yield the final detection results. An overview of the entire detection model is shown in
Figure 3.
As shown in
Figure 3, when an image is input into the model, it first passes through the multi-view module and is cut into five detection regions. Then, these five detection regions are passed to the detection model (YOLO/SSD) for detection. Finally, the detection results are sent to the merging module, which applies the region splicing and region merging operations to obtain the final detection results. The applicability of the proposed multi-view approach is not restricted to YOLO and SSD; it can be applied in combination with some other regression-based detection models. Therefore, the approach is designed to improve the performance of the regression-based detection models.
3.2. Model Implementation
Because the multi-view object detection model mainly consists of the multi-view module and the merging module, the model is implemented using these two modules.
The multi-view module cuts the original image into five regions, each of which is 1/4 of the original image in size. Then, an interpolation algorithm is applied to magnify each region by a factor of four in equal proportions to ensure that the detected objects do not become deformed when they are passed to the detection model. Simultaneously, the interpolation algorithm is applied to provide more detail to the detection module rather than performing direct detection on the original image.
The integration process of the merging module consists of two stages. In the first stage, the bounding boxes satisfying the distance threshold of horizontal (or vertical) axis are picked out in adjacent views, and the bounding boxes that belong to the same object of them must be determined by combining the overlapping areas of adjacent boundaries. In the paper, the distance threshold of horizontal (or vertical) axis is 10 pixels and the overlapping threshold of adjacent boundaries is 0.3. For the bounding boxes of the same object, a splicing operation must be performed.
The formula for evaluating the line overlap
between two adjacent bounding boxes is as follows:
where
denotes the bounding line of the candidate box in one view near the horizontal (or vertical) axis and
denotes the bounding line of the candidate box in the adjacent view near the horizontal (or vertical) axis. The details are shown in
Figure 4.
As shown in
Figure 4, view
contains a car that is jointly detected with view
and a person that is jointly detected with view
, whereas another person is jointly detected in views
and
.
,
,
, and
are all marked in the figure. For each pair of adjacent views, the
results are calculated for the corresponding pairs of bounding boxes, and if the calculated
value between two bounding boxes satisfies the line overlap threshold, then those bounding boxes are regarded as representing the same object. Next, the region splicing operation is applied to the chosen bounding boxes to obtain the complete bounding box for each object.
Specifically, the region splicing process is first performed in one direction (such as along the horizontal axis); the splicing results are appended to the set of detected object bounding boxes, and the original object bounding boxes on which the splicing operation was performed are removed. Then, region splicing is conducted in the other direction.
In the second stage, the region merging algorithm selects object boxes from both the region splicing results of the first stage and the detection results from the center region. The first step of the region merging algorithm is to initialize the region-merged object box set , the object index set of , the overlap threshold , and the maximum overlap . The next step is to obtain the index set based on the order of the candidate bounding boxes, which are sorted by their coordinates. Then, while is not empty, a series of operations are performed as follows. The first operation is to set the suppressed bounding box set , which includes the last index of ; obtain the index (=) of ; and append the index to . Then, the operation is repeated to obtain the bounding box (where the index is in ) and calculate the overlap between the bounding box and the bounding box . When the overlap satisfies , the index of the current bounding box is appended to the suppressed bounding box set . Then, it must be determined whether the overlap is larger than . When the overlap is larger, is updated, and the area of the current bounding box is compared with the area of the bounding box . When , the last index in is removed, and the index is appended to . At the end of the current iteration, is removed from . Then, the next iteration begins. This process is repeated until is empty. Finally, the final object index set is obtained after the region merging operation. Then, according to the mapping relationship between and , the set of the selected object boxes after region merging is fetched from . The details of the entire process are shown in Algorithm 1.
| Algorithm 1 RM (Region merging) |
| 1: Input: Candidate bounding box set from stage one |
2: Output: Region-merged object box set
3: Initialize the region-merged object box set , the index set of , overlap threshold , overlap maximum , , , ,
4: Obtain the set of the indexes according to the order of candidate bounding boxes sorted by the coordinate
5: While is not null do
6: Obtain the last index of :
7: Set the suppressing bounding box set
8: Append the last index to :
9: Foreach index in do
10:
11: Calculate the overlap using the theory of IoU
12: If do
13: Append the index n to the set :
14: If do
15:
16: Calculate the area of and the area of
17: If do
18: Remove the last index in :
19: Append the index to :
20: Remove the suppressing bounding box set in :
21: Foreach in do
22: Extract the object bounding boxes : |
5. Conclusions
The disadvantage of deep learning object detection model based on regression in small object detection is for the reason that the details of high level feature map remain little. So, we have the idea of increasing the feature response of different image regions in order to improve the detection performance. Here, we proposed the multi-view method to enhance the feature information by producing more response in the same level feature map.
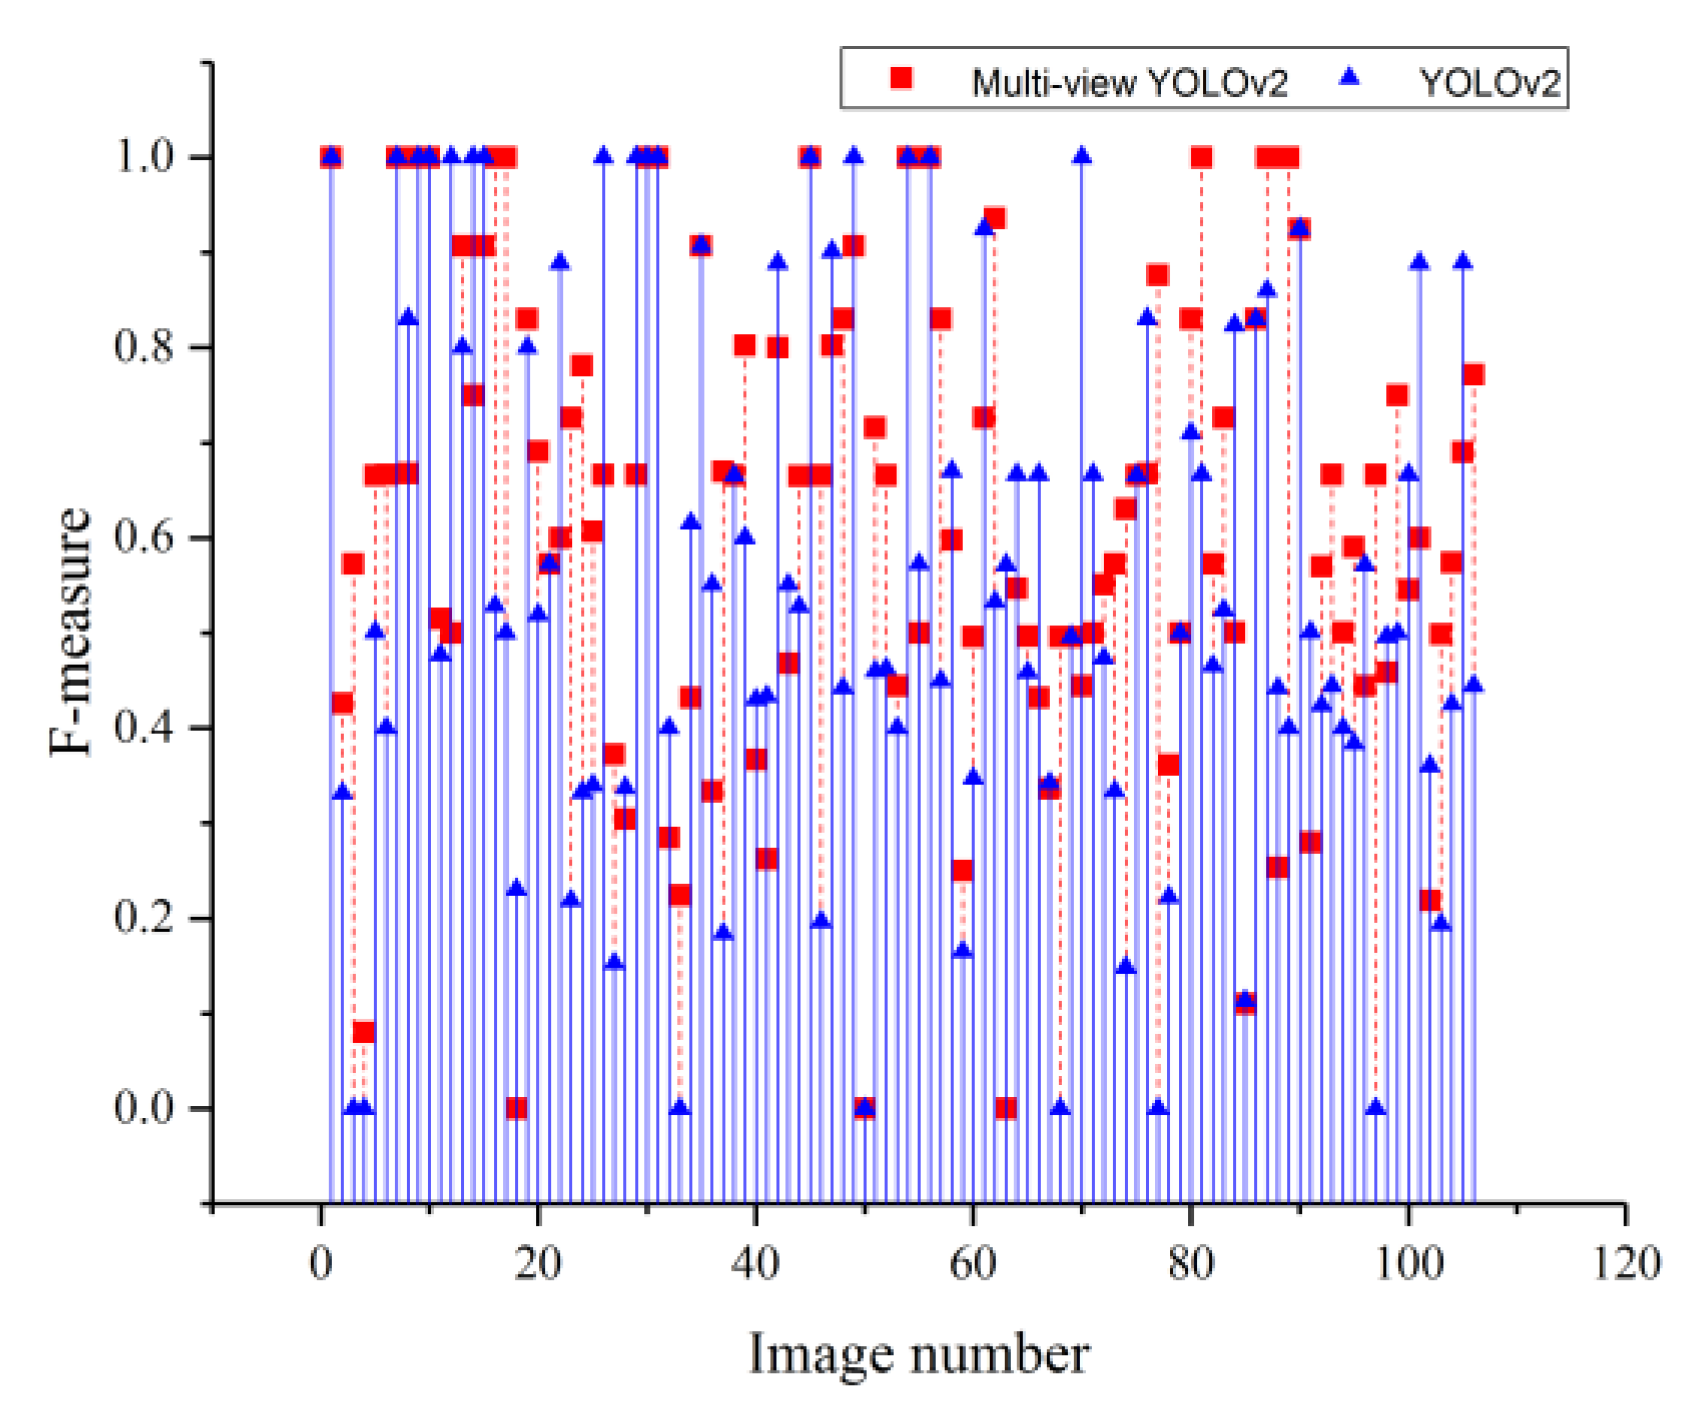
This paper proposes a multi-view object detection approach for small object detection. Experiments were performed using a small object dataset selected from the VOC 2007 dataset. The experimental results show that in terms of object retrieval capability, Multi-view YOLO, Multi-view YOLOv2, and Multi-view SSD achieve AF scores that are higher than those of their classical counterparts by 0.177, 0.06, and 0.169, respectively. Moreover, in terms of the detection accuracy, when difficult objects are not included, the mAP scores of the multi-view methods are higher than those of the classical methods by 14.3%, 7.4%, and 13.1%, respectively. The results show that both the object retrieval abilities and detection accuracies of multi-view methods are better than those of the corresponding classical methods, verifying the validity of the proposed approach. In addition, the applicability of the proposed multi-view approach is not restricted to YOLO and SSD; it can be applied in combination with some other regression-based detection models. This will further improve the performance of the regression-based detection models in small object detection. Therefore, the multi-view approach proposed in this paper offers an excellent solution for improving the small object detection capabilities of regression-based detection models. In our future work, the overall image information will be combined with the multi-view paradigm to enhance the algorithm’s performance.


