Topological Network Properties of Fractal-Like Metallic Nanoparticle Patterns and Their Effects on Optical Resonances


1
Department of Electronic Systems Engineering, The University of Shiga Prefecture, Shiga 522-8533, Japan
2
Department of Electronic Science and Engineering, Kyoto University, Kyoto 615-8510, Japan
*
Author to whom correspondence should be addressed.
Appl. Sci. 2018, 8(8), 1310; https://doi.org/10.3390/app8081310
Submission received: 7 July 2018
/
Revised: 30 July 2018
/
Accepted: 31 July 2018
/
Published: 7 August 2018
(This article belongs to the Special Issue Photonic Metamaterials)
Abstract
:Fractal-like nanoparticle two-dimensional patterns forming in diffusion-limited aggregation show variant spatial patterns. However, they have invariant statistical properties in their network topologies, even though their formation is completely in self-assembled processes. One of the outputs from these topological properties is optical resonances at invariant frequencies, which is a required feature of a metamaterial alternative. Fractal-like metallic patterns studied here in both experiments and theoretical models exhibit similar resonance frequencies in the infrared-ray range, and they depend on the unit length of nanoparticles composing arbitrary fractal-like structures. The scheme of analysis applied here using complex network theory does not only reveal the topological properties of the nanoparticle network, but points out their optical and possibly other physical potentials arising from their geometrical properties.
1. Introduction
Geometrical effects of metallic components in two- or three-dimensional space are key issues to control electromagnetic waves [1,2]. In the research of metamaterials, the designs of the spatial shapes of metals are being explored not only for microwaves or terahertz waves, but also for lights in the optical range [1,3,4,5,6,7,8,9,10]. A careful design of the structure in each metamaterial unit leads to extraordinary properties that are not realized in nature, such as negative-refractive-index states and cloaking phenomena. The structures proposed so far have been elaborately fabricated as spatial periodic patterns using a unit microstructure much smaller than the wavelength, and nano-size precision is required for control in optics. For future photonic devices that have a visible size, a large volume of metamaterial components with a huge number of nano-scale structures, in the millimeter scale for instance, is required; fabrication processes based on photo masks will cost too much to use such optical devices for daily uses. From this point of view, self-assembled configurations of nano-structures [11,12] are quite favorable for optical metamaterials or similar required media.
As a self-assembled structure with potential functions similar to regular metamaterials, in this report, we focus on fractals or fractal-like shapes [13,14] created without designed fabrication processes. There exist a number of structures in nature that form without artificial designs, but according to certain geometrical principles. Fractals are one of them, observed in the outer edges of clouds and ocean coasts for instance, and they have self-similarity structures at every scale. Although their optical properties have been investigated from several points of view [15], clear evidence for frequency characteristics similar to metamaterials has not been confirmed in general self-assembled fractal patterns. Regarding regular fractals designed artificially, several previous reports revealed their effects as being similar to metamaterials with spatial periodic structures [16,17]. Irregular fractal structures, which include patterns created by nano-particles [18,19,20,21] and by nano-pores [22,23,24,25], also indicate extraordinary optical properties, but the previous studies are related to resonances near the surface plasmons in which dipole coupling between particles is frequently important [18,19,20] or broad-band absorption [21], the property of which is far from the resonance features that are significant in metamaterials with negative permeability. Recently, we reported the effects of a fractal-like nanoparticle network structure with abnormal optical resonances [26], which triggers this study to reveal the potentials of self-assembled fractal structures for optical metamaterial alternatives.
As widely investigated, fractal structures with seemingly random shapes have some geometrical quantities that are common and constant, such as fractal dimension [13]; after its definition, the concept of the dimension becomes one of the general measures for the topological invariants for material microstructures, beyond fractal structures [14]. Further recognitions of common topological features may be possible by complex network theory [27,28,29], which describes both microscopical properties of constituent particles and their statistical ones in a macroscopic point of view. If the application of network theory is successful for optical solutions, this analysis scheme described below will be a new contribution of complex network theory.
In this report, we demonstrate theoretical analysis and experimental observations about the optical responses of two-dimensional (2D) fractal-like metallic structures. The absorption spectra have similar and constant resonance frequencies in all model structures with a fixed size of the individual unit and in every pattern created in the experimental procedure with a certain range of parameters. The results predict here that the size of the unit constituent is a key parameter for such features and may become an optical metamaterial alternative at a designed frequency. We investigate such observed features by applying network theory on nanoparticle structures, and suitable choices of centrality indices reveal common topological principles in random fractal-like structures and also can predict possible optical resonances without a rigorous numerical analysis of electromagnetic-wave propagation.
2. Theoretical Results on Structures Created in Diffusion-Limited Aggregation and Their Optical Responses
We consider fractal-like structures forming in the diffusion-limited aggregation (DLA) [14]. Our theoretical model in this study, described in our previous report [26], is simple and conventional; particles are mobile randomly by one grid step in every time on the 2D plane after setting an initial and fixed particle, and they stop if they arrive at a grid position that is adjacent to the one at which another particle has already stopped. For simplicity, we limit its mobile direction parallel to the two axes. After confirmation of one particle stopping on the edge of the particle group or going out of the model space, we put another at a random position. We impose absolutely no design for the final structure until the last particle stops. Such a procedure is consistent with the DLA model. One exceptional treatment is the addition of particles to remove checker-board structures [30], whose contact points are infinitely small and difficult to treat in the usual numerical electromagnetic calculations.
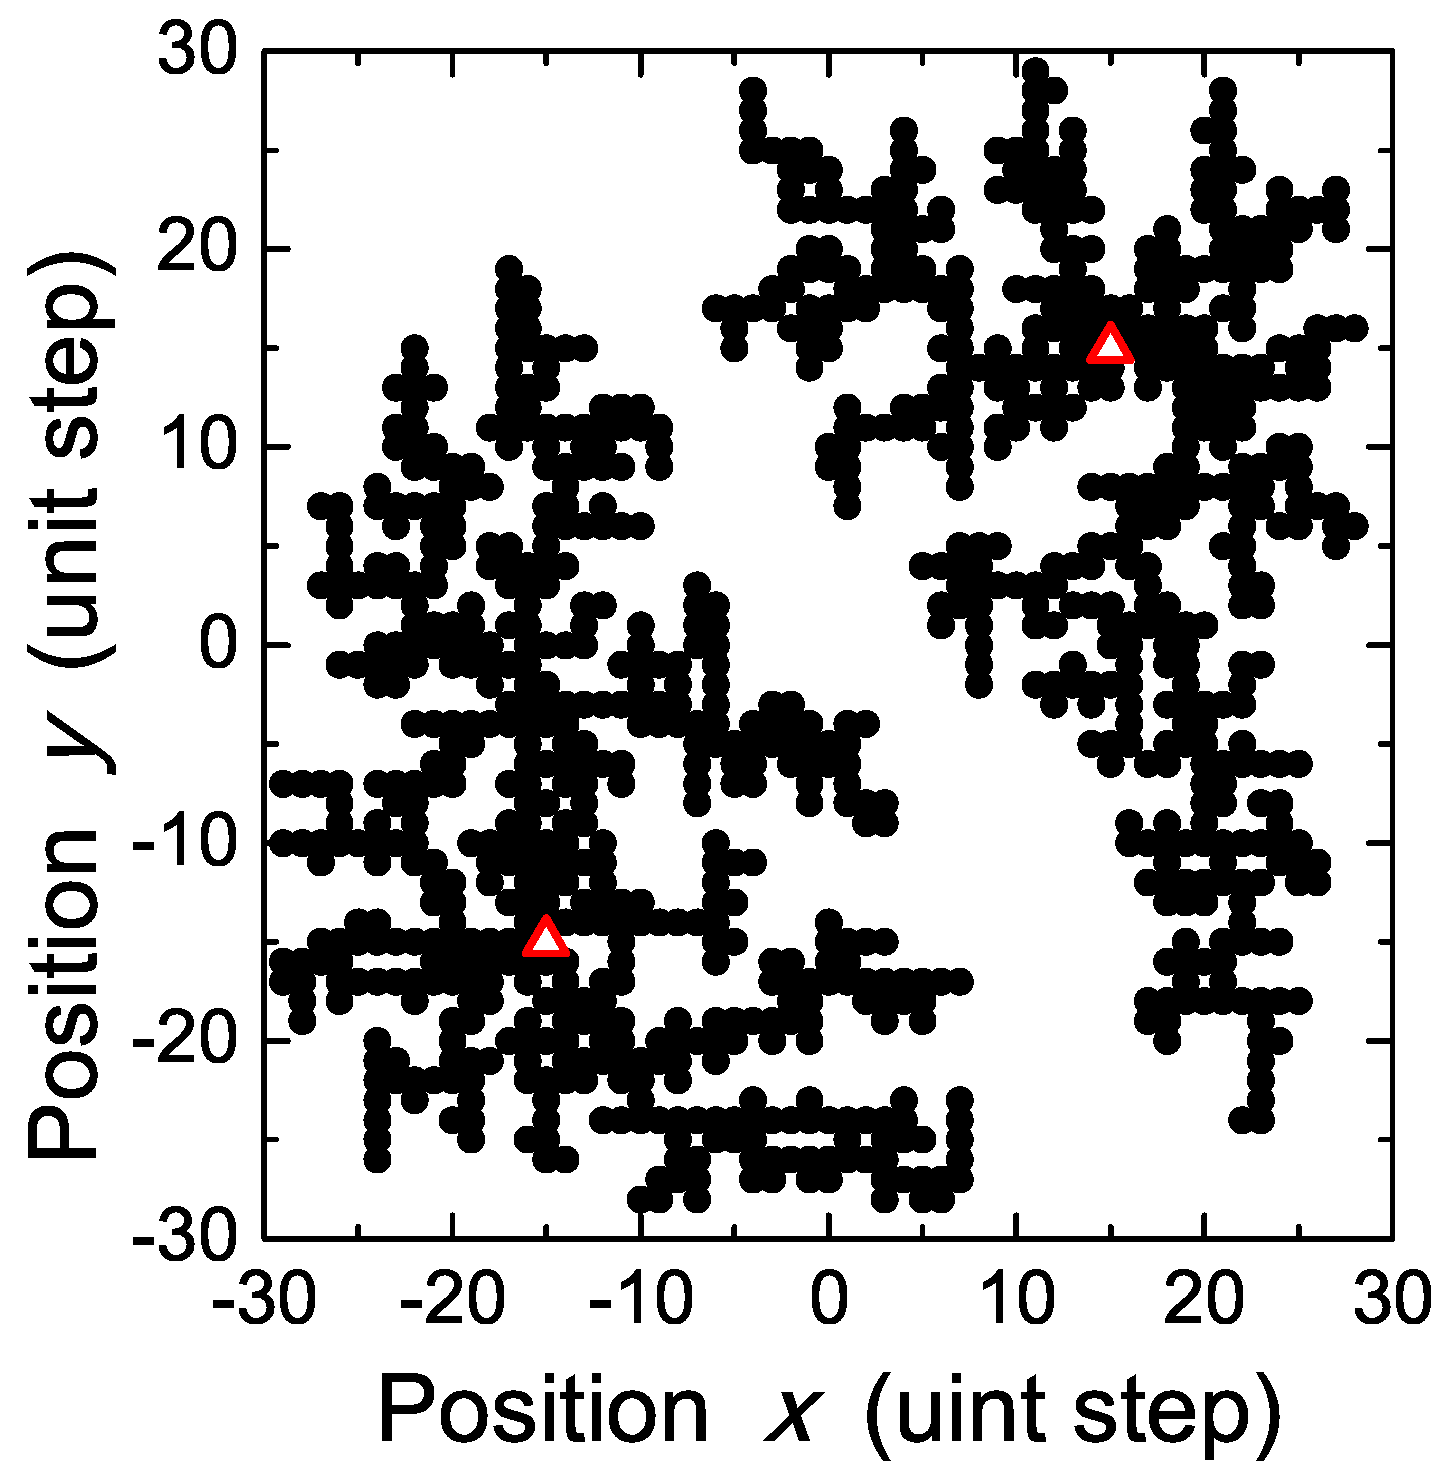
Figure 1 shows one example of a fractal-like structure forming in this DLA model. The fractal dimension of the created samples, measured by the box-counting method [14], ranges from 1.6 to 1.7, which are typical values of DLA structures [14]. We assume that a particle is a square with each side of 600 nm in our calculation hereafter. As shown in our previous report [26], when one fixed particle is initially set in the center of the model space, the final shape of the aggregates is a dendrite-type structure [21]. On the other hand, as shown in Figure 1, when two particles are given as initial ones, the final structures share their domains in the model space. That is, geometrical outlooks of the structures observed in calculations and in experiments depend on the number and positions of initial fixed seed particles or the number of growing systems in parallel.
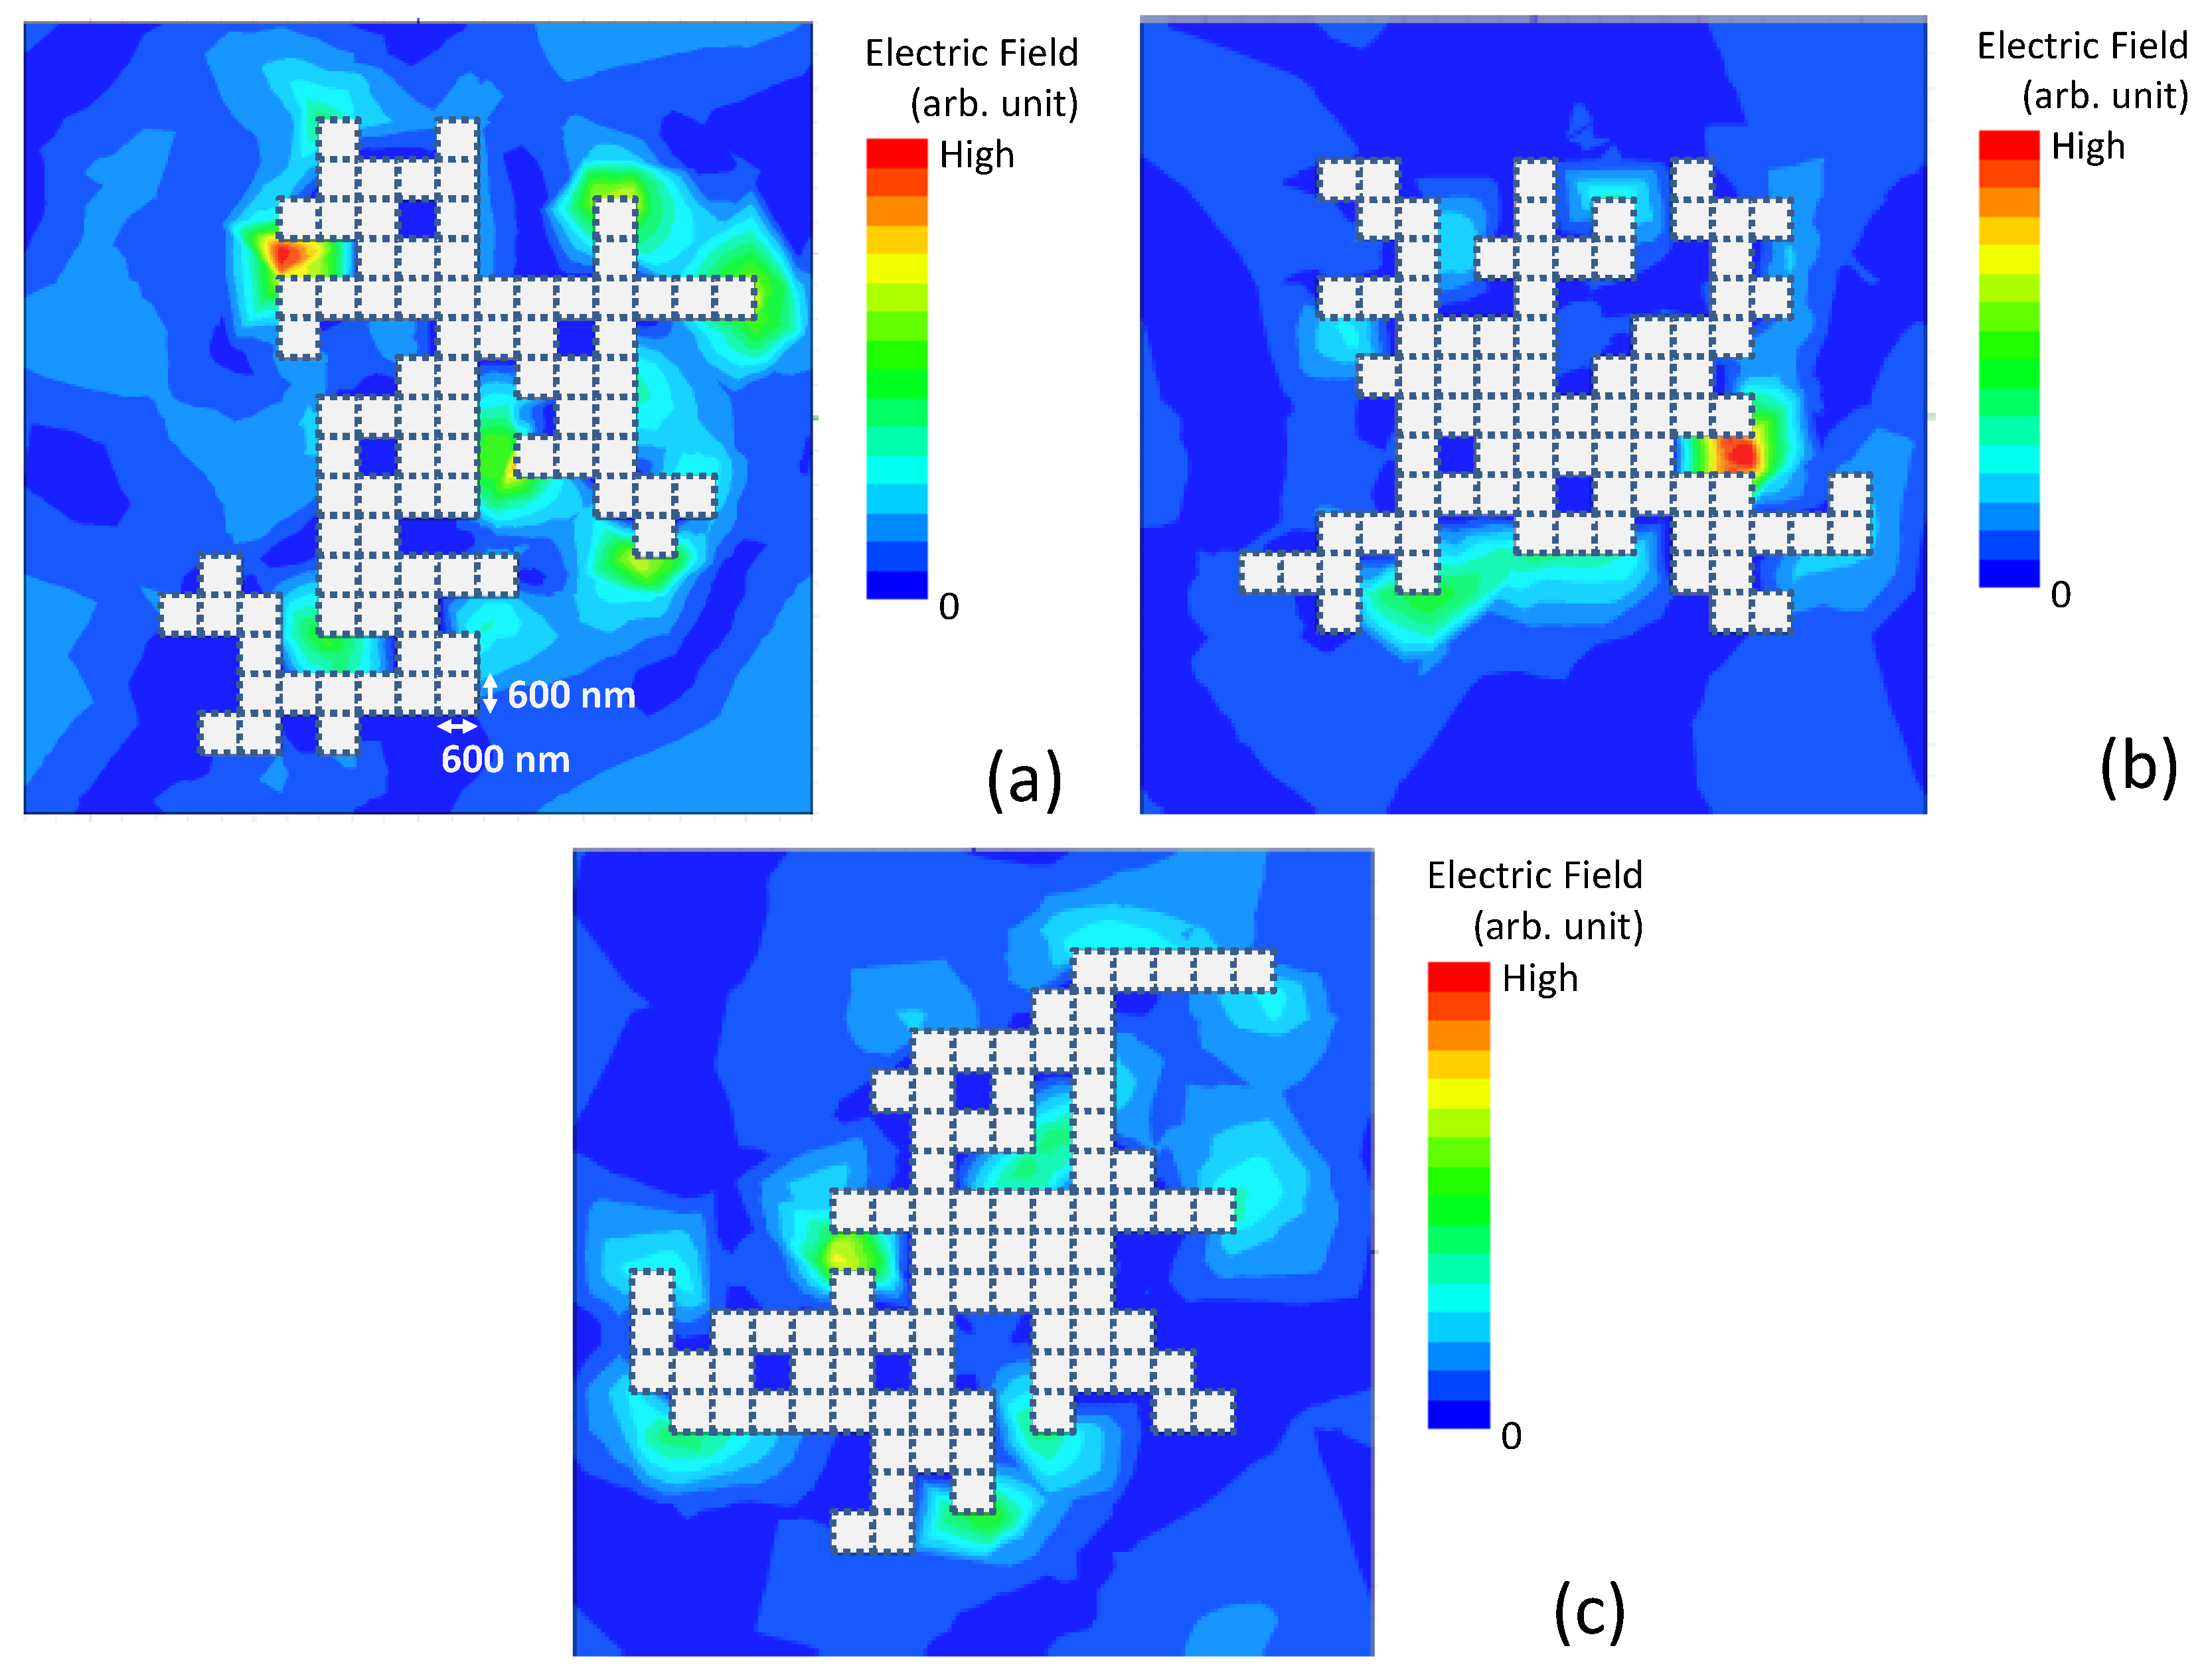
When these particles are metallic ones, we can expect significant effects for the propagation of electromagnetic waves. To investigate such responses, smaller structures are suitable for numerical analyses within reasonable calculation times. Figure 2 displays three patterns of the structure composed of 80 particles and created in the square region with 20 × 20 grids. These exhibit roughly fractal-like shapes with arbitrary variations, and values of measured by the box-counting method range from 1.64 to 1.67, which means that they keep common topological properties throughout the created samples. We use each structure, assuming that the components are perfect conductors, in the model of electromagnetic-wave propagation in which this 2D plane is perpendicular to the direction of the wave propagation. Using the commercially-available code based on the finite element method (FEM) (HFSS 12.1.0.1, Ansoft Corp.) and setting the periodic boundary condition on each boundary, transmittance is monitored at the output port, which is counter to the input port; both ports are set to be parallel to the 2D structure plane. Electromagnetic waves propagate in the transverse electric field (TE) mode, where electric fields are parallel to the 2D plane, while the magnetic field is perpendicular.
Figure 3 shows transmittance spectra in the calculation results, where transmittance is the intensity ratio of propagating waves to the output port in comparison with the constant waves from the input port. We observed several reduction peaks in the spectra, and we stress here that such spectra have approximately similar frequencies of reduction (as a wavelength , ∼6600 nm, ∼7800 nm, ∼9000 nm and ∼10,200 nm). Their period between the adjacent dips in is about 1200 nm. To reveal the origin of this scaling rule, we plot electric field profiles around = 6600 nm in Figure 2 for three patterns calculated arbitrarily. In every case, locations with concentrated electric fields are surrounded approximately by five particles, which is equal to the length of 3000 nm, almost half of . The increment of in 1200 nm corresponds to the addition of one particle for . From the above results, the dip spectra at the fixed wavelengths are mainly attributed to the resonant structures at , which are similar to half-wavelength dipoles and/or quadrupole closed waveguides composed of several numbers of the unit structure.
3. Experimental Results on Fractal-Like Metallic Nanoparticle Patterns
To confirm these theoretical predictions, experiments were performed using similar equipment under similar parameters described in our previous reports [26]. In brief, the atmospheric-pressure plasmas in the gas flow of the Ar and NH mixture yield NH with a concentration in the order of . NH is a reductant agent, and so far, we have observed the formation of Ag nanoparticles in AgNO aqueous solutions and their aggregation as a conductive layer; the structures were fractal-like ones in some range of experimental parameters, confirmed by the images from scanning electron microscopy (SEM). When we also observed Ag nanoparticle aggregates on Si substrates, some abnormal absorption spectra in the optical range were detected using the Fourier-transformed infrared (FT-IR) spectroscopy method (FT-720, Horiba), but its origins have not been identified yet. As a reference, in the case without NH treatment, absorption by AgNO [31], which is a residue of the solutes, was more or less observed at the spectrum around 7600 nm.
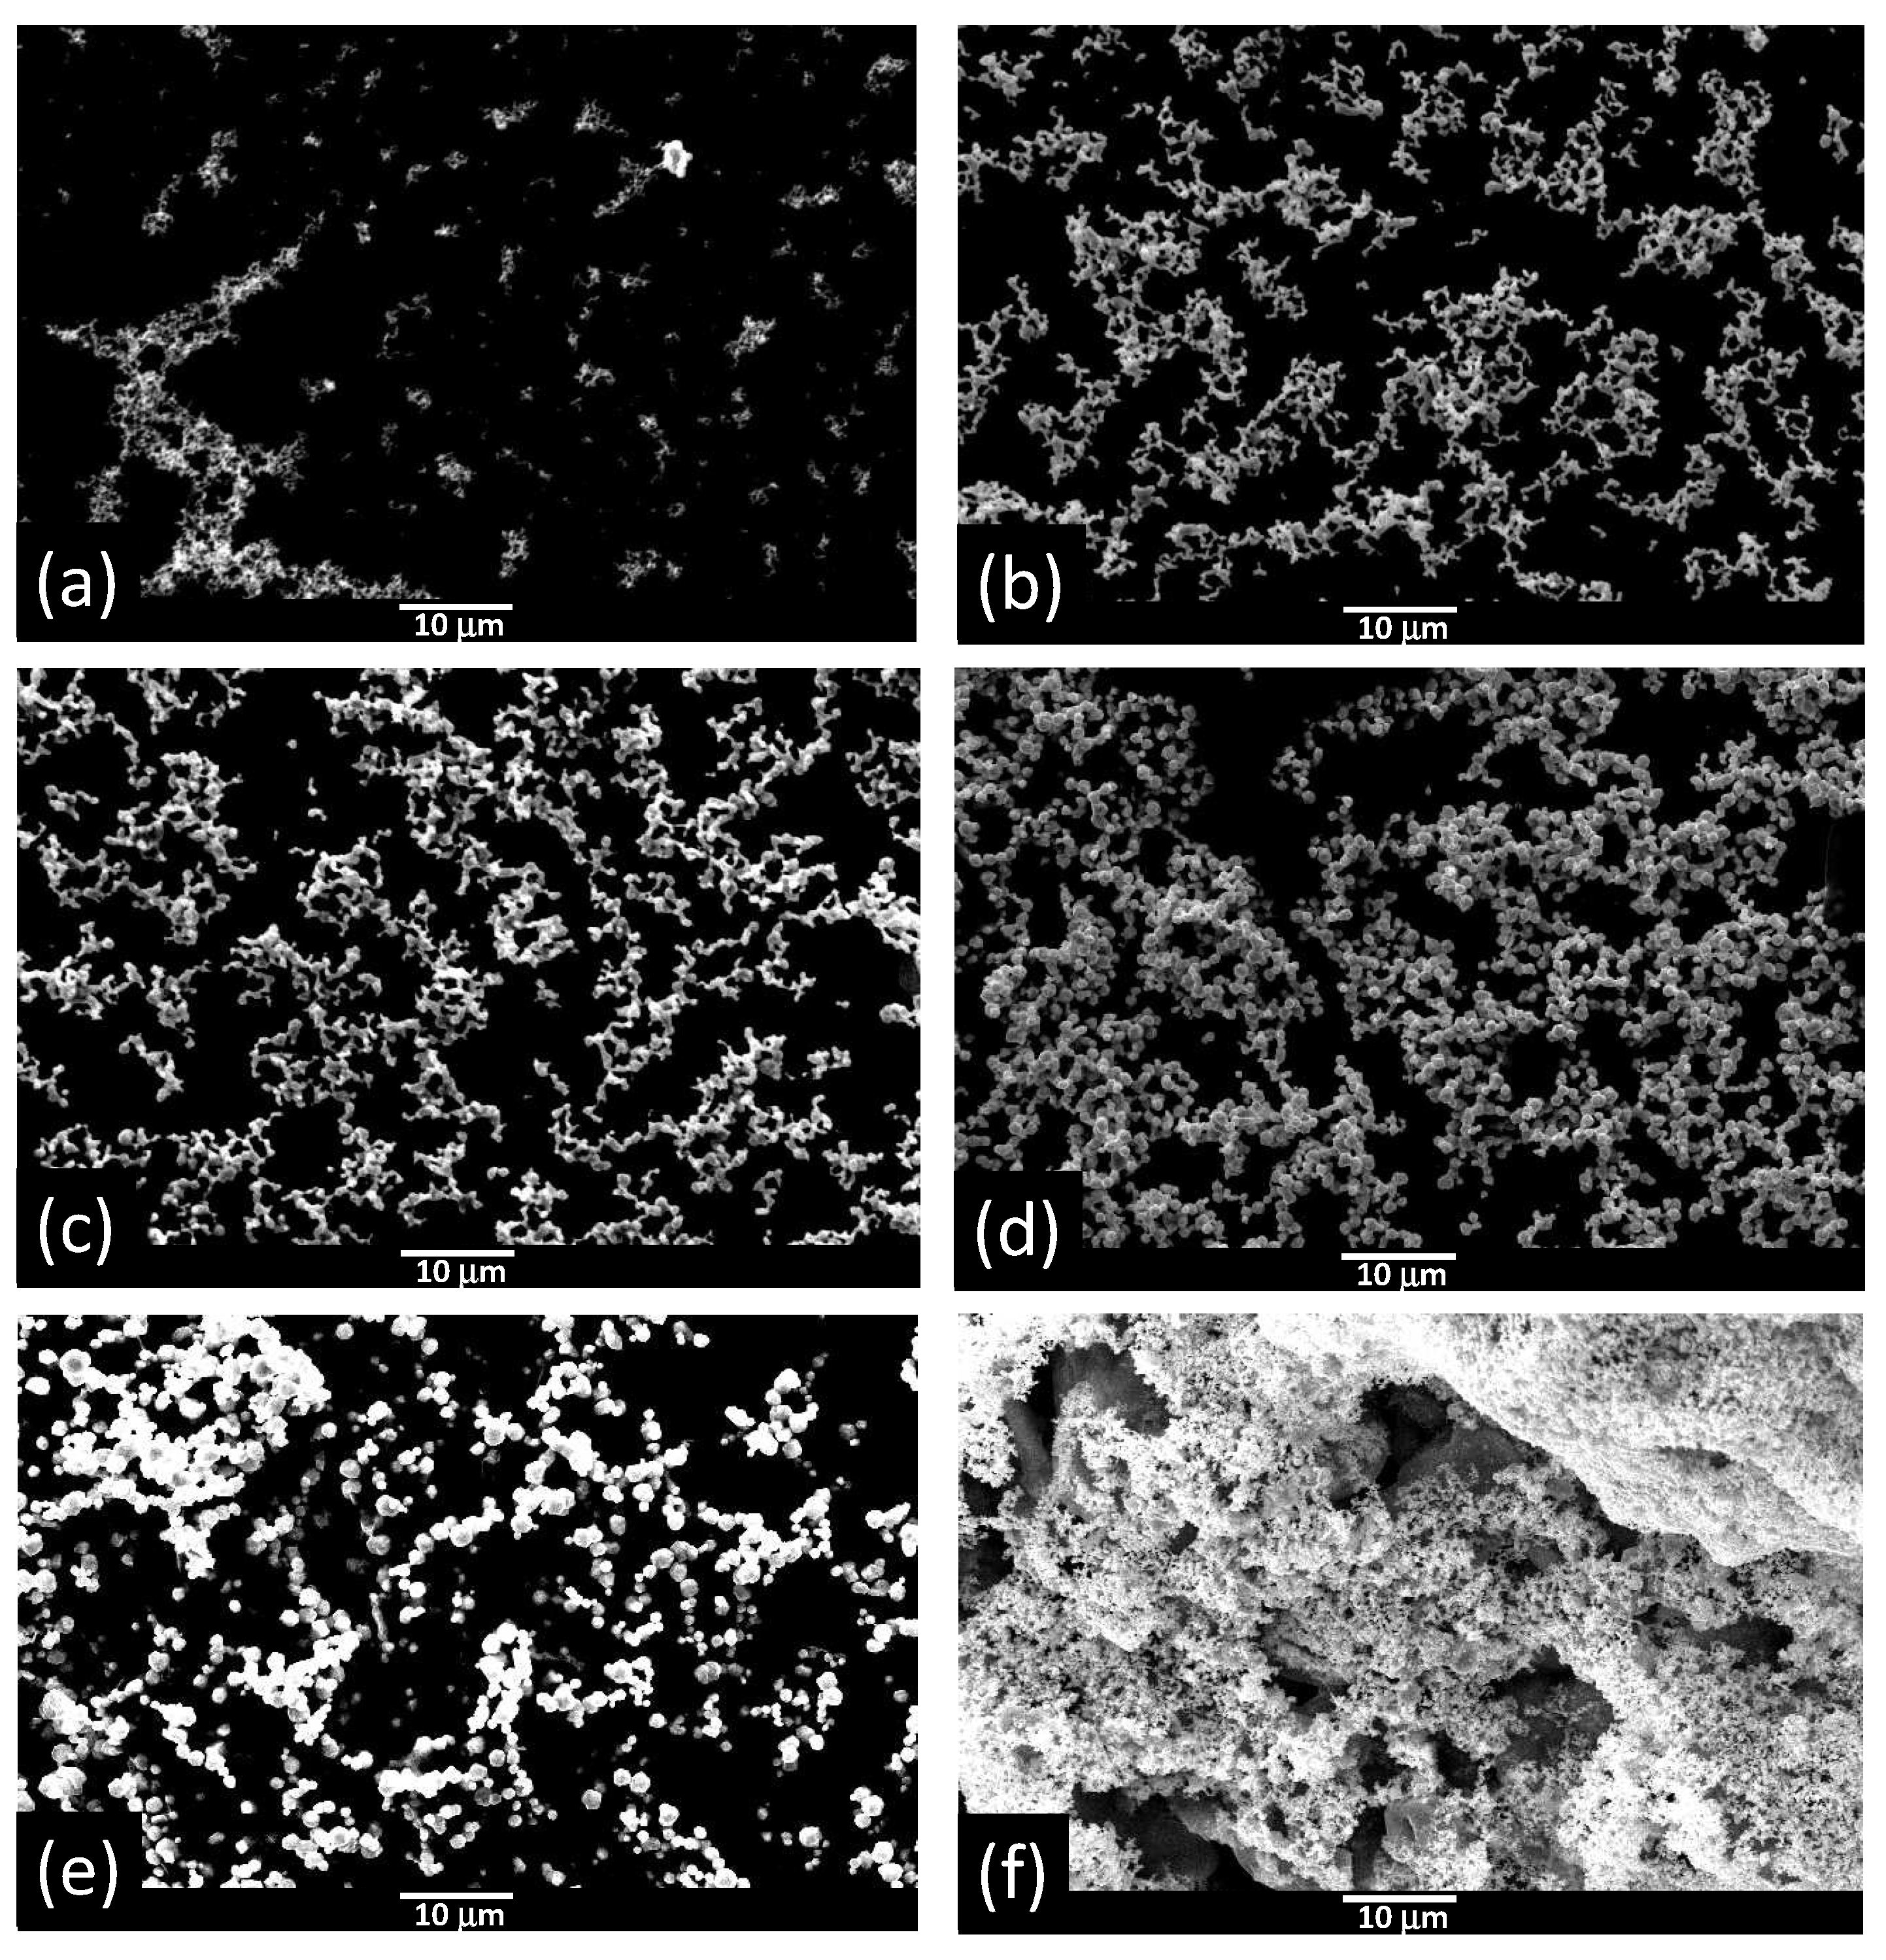
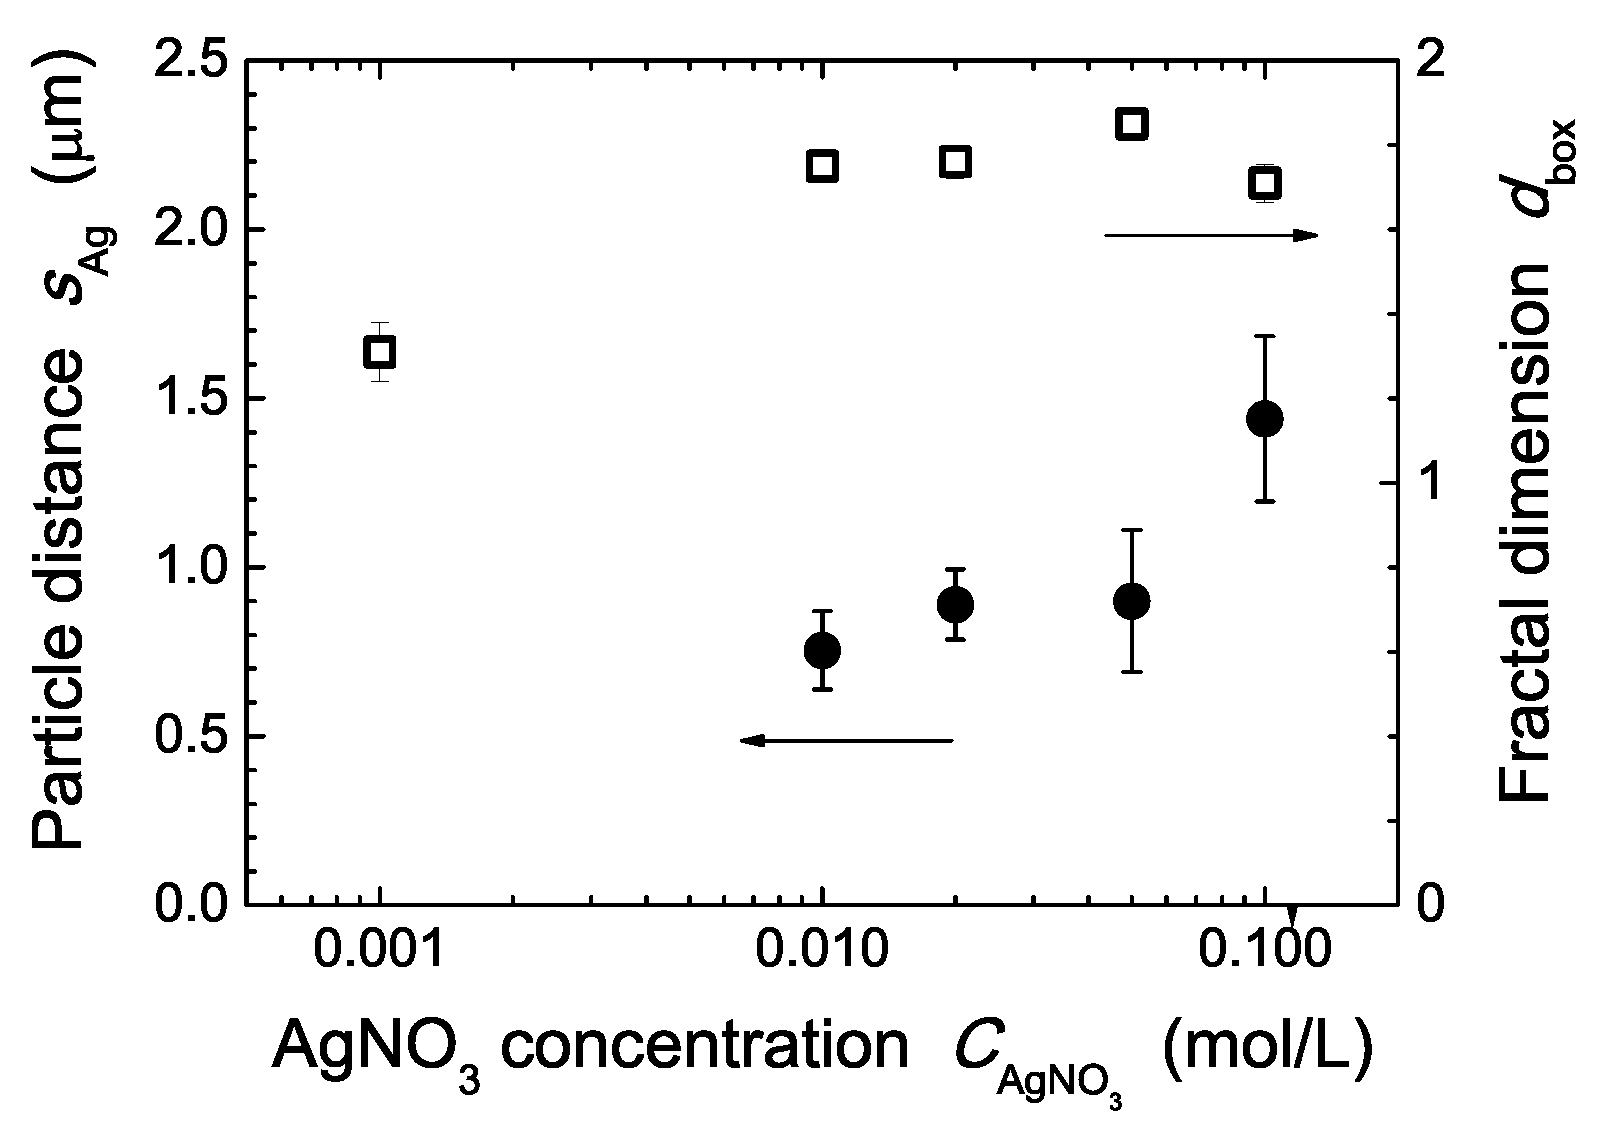
When we changed the AgNO concentration , several patterns emerged in the formation and aggregation of Ag particles. When was low (Figure 4a), no significant patterns existed and was near one (shown in Figure 5). As increasing up to = 0.1 mol/L, fractal-like patterns were observed (Figure 4b–d), and increased and got saturated around 1.8 to 1.9. Regarding the particle distance , measured from images in Figure 4 via particle allocation shown in Figure 6a and Figure 7, was almost constant for = 0.01 to 0.05 mol/L (although the particle size itself somewhat increased) and increased at = 0.1 mol/L (Figure 5). Figure 6 represents examples of the topological analysis proposed in this study for nanoparticle networks, and Figure 7 shows various results based on this analysis; the details of this analysis method will be described in Section 4.
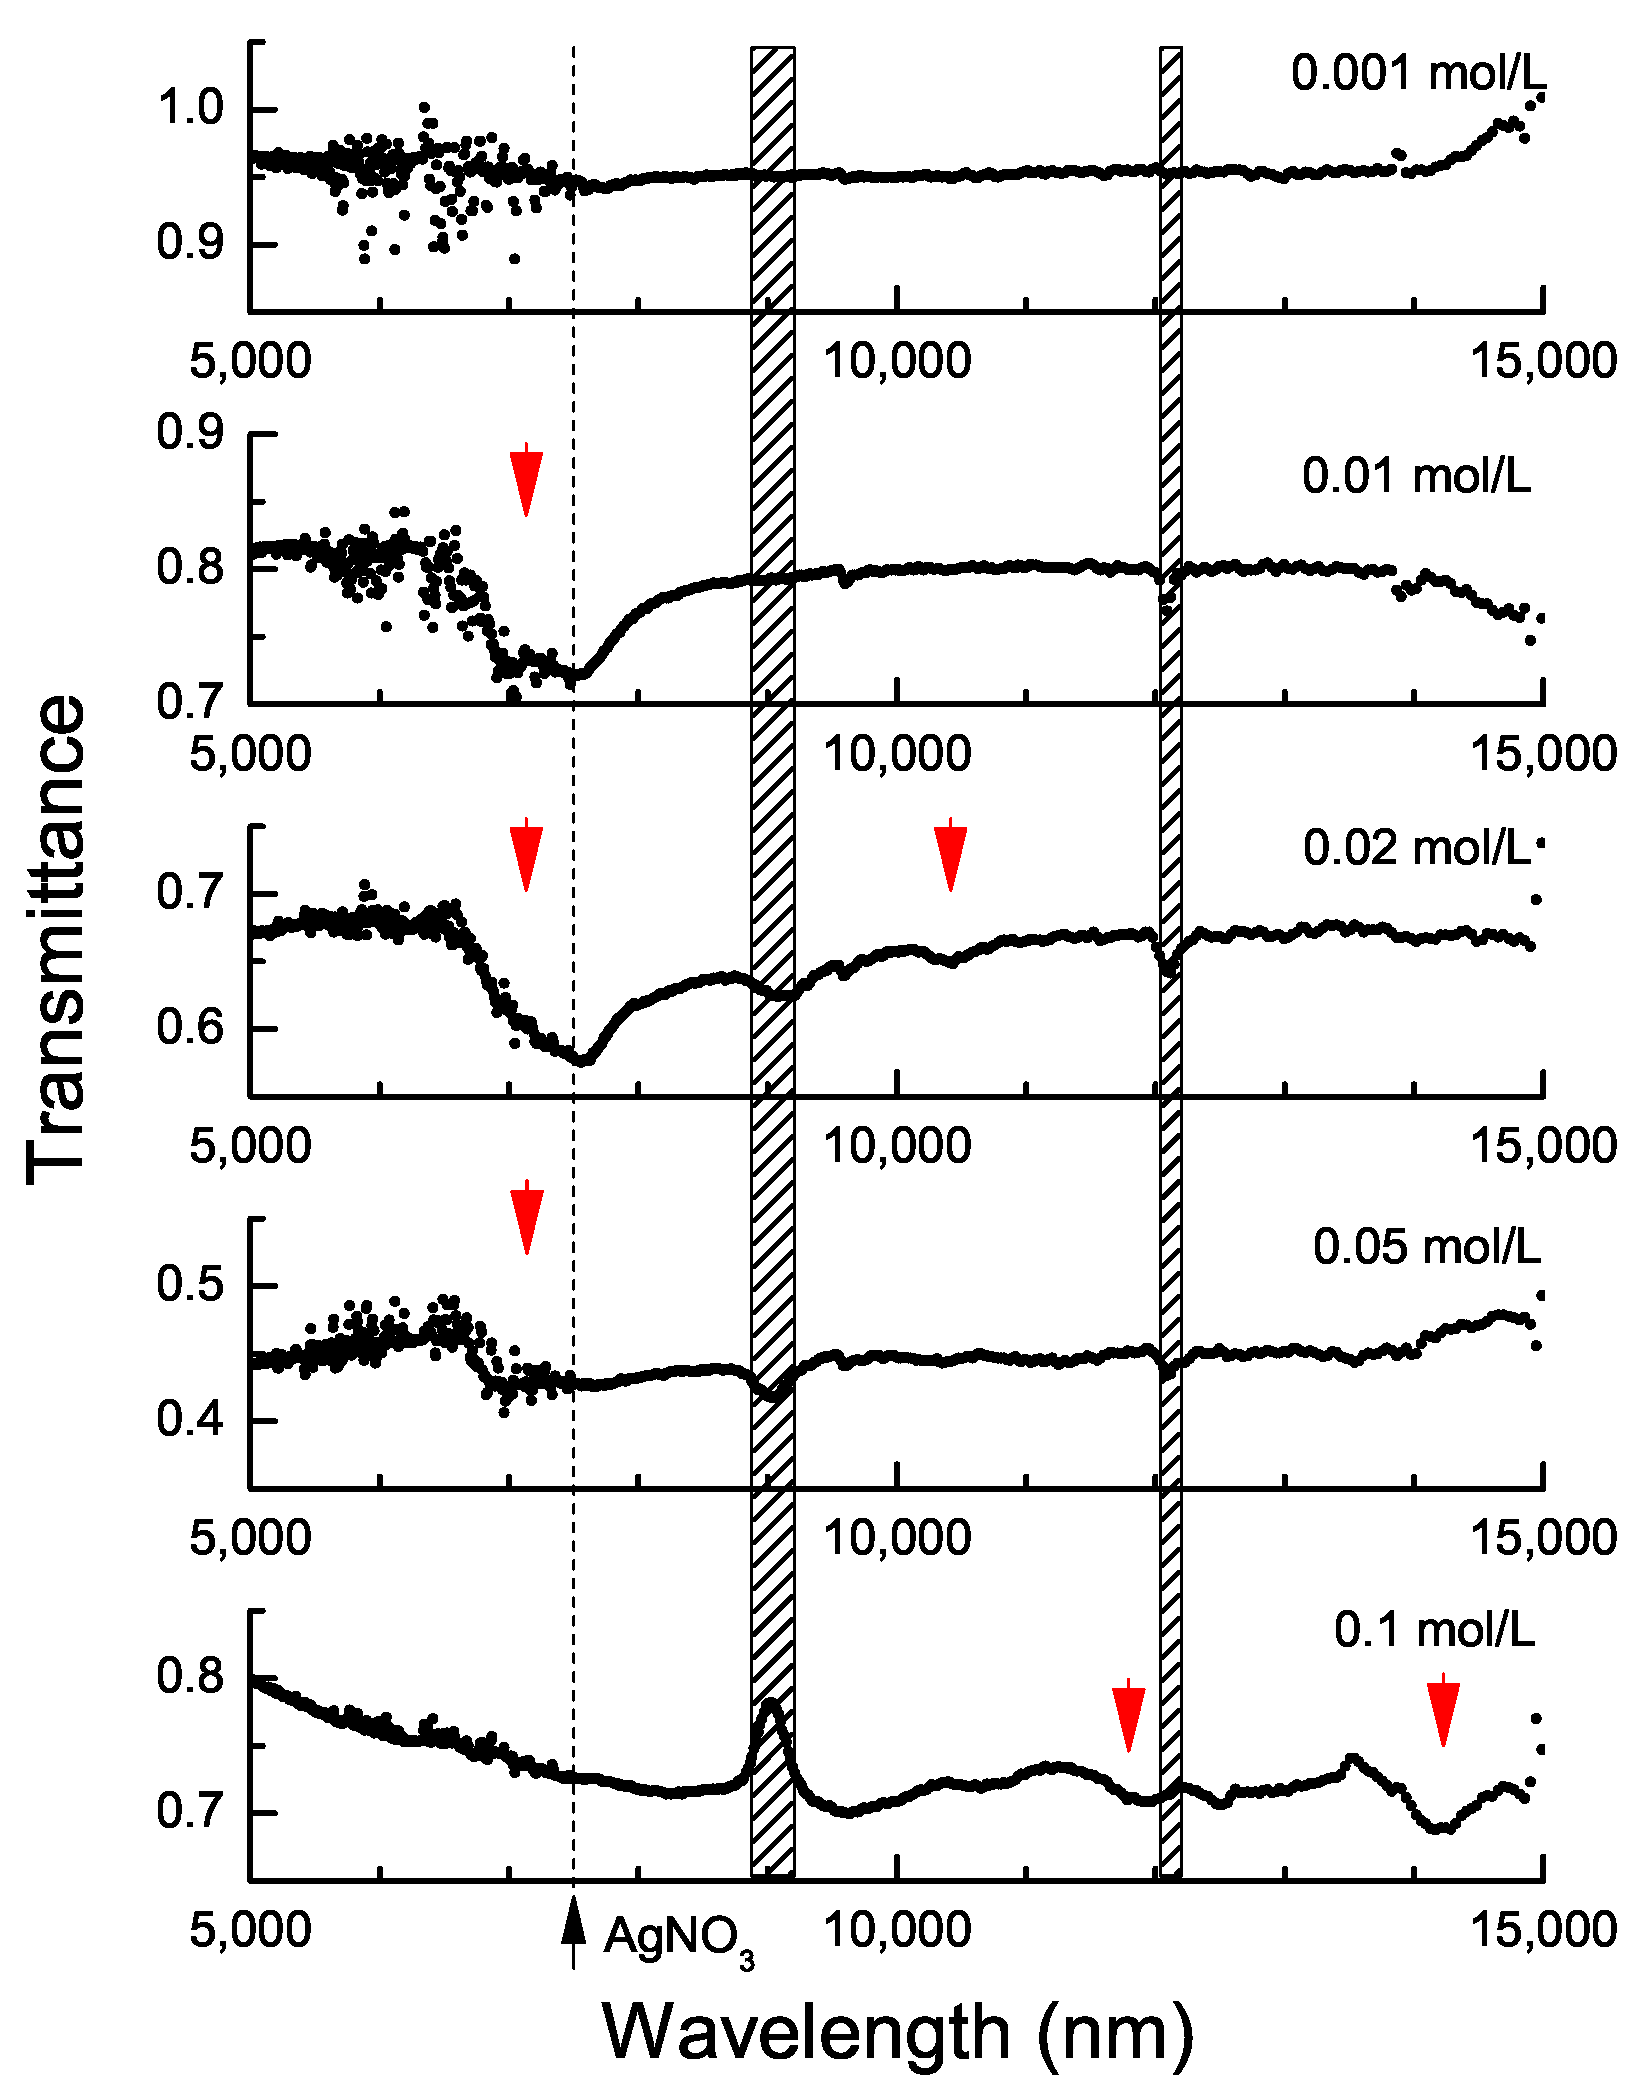
Figure 8 shows the transmittance spectra of these samples shown in Figure 4, measured by the FT-IR method as a function of . While was almost constant (700 to 900 nm) for = 0.01 to 0.05 mol/L, a significant abnormal absorption spectrum existed around 7300 nm. The wavelength was almost constant, and it showed twin peaks with the AgNO absorption around 7600 nm. On the other hand, when was raised to 0.1 mol/L and increased up to ∼1400 nm, the absorption spectra were located around 11,800 nm and 14,200 nm. The absorption spectra are in a different range from that of the conventional surface plasmon resonances around the visible light range [32] and also show narrow resonance features different from the broad ones [21].
As discussed in the theoretical predictions, resonances in fractal-like structures take place around of combined branches, composed of several particles. Rough consistency is found, as described in the following. In the cases with = 0.01 to 0.05 mol/L, for 7300 nm, four particles with 800 nm per each distance correspond to , and for 10,400 nm, six particles with 800 nm correspond to . In the case with = 0.1 mol/L, for 11,800 nm, four particles with 1400 nm correspond to , and for 14,200 nm, five particles with 1400 nm correspond to . We again note that this comparison shows imperfect matching, but these results indicate reasonable agreements with the theoretical comprehension described in Section 2, which predicts that structural resonances are possible using nanoparticle fractal-like patterns. Conventional spectra in the infrared ray range reported in the previous literature are almost attributed to fixed absorptions coming from atomic lattice structures like stretching or bending modes, and we can not identify the observed absorption peaks using such material-oriented absorptions in the literature.
We have dealt with the effects of self-assembled fractal-like structures on electromagnetic waves whose wavelengths are almost several factors or one order of magnitude larger than one particle size. Each resonant part in the structures is roughly identified. One may consider potential extrapolation of such effects to waves with much longer wavelengths, which are larger by two orders of magnitude than the particle size. Although the scale-free property is valid, the comprehension for possible resonances is more complicated since each resonant part includes a much smaller self-similar shape, which occupies some fractional area in itself. Another point we have to consider is that the theoretical calculations shown in Section 2 are based on assumptions of spatial periodicity; such cases take place when several initial particles that become the cores of the following growth exist in one given space. Such an approximate size of the entire structure forming in completion of the growth is a key factor for the maximum wavelength, which we can expect for similar resonance effects.
4. Derivation of Network Parameters from Experimental and Theoretical Nanoparticle Patterns
So far, we have investigated the effects of self-assembled fractal-like aggregates of metallic nanoparticles with extraordinary optical features for electromagnetic waves. The results have been analyzed mainly according to the empirical scaling. Here, to derive more common and general features that such nano-structures possess macroscopically and statistically, we analyze the fractal-like network properties of nanoparticles using centrality measures [29]. For several previous decades, besides the general definition of dimensions in the fractal structures [13,14] used in Figure 5, measures for network topology have been already proposed in bonding structures and reaction paths in chemical reactions, like the Wiener index and topological efficiency index [33,34,35], which might also work for the characterization of observed structures. Here, however, we use others, developed in network theory [29,36], closely relevant to and based on electric circuit models [37], by considering the importance of electric conductivity over nanoparticle network structures in our study. Since nanoparticles make contact with each other in fractal-like patterns, we define the nodes of a network by nanoparticles and edges by their adjacency. Although this analysis is based on network theory [29], another point this approach can clarify is the prediction of the possible presence of optical resonance structures in the observed nanoparticle patterns, as described below.
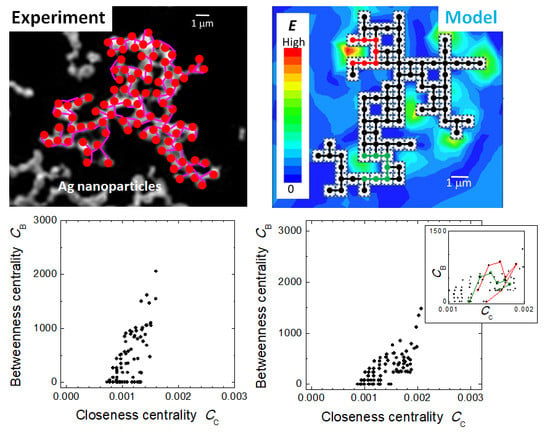
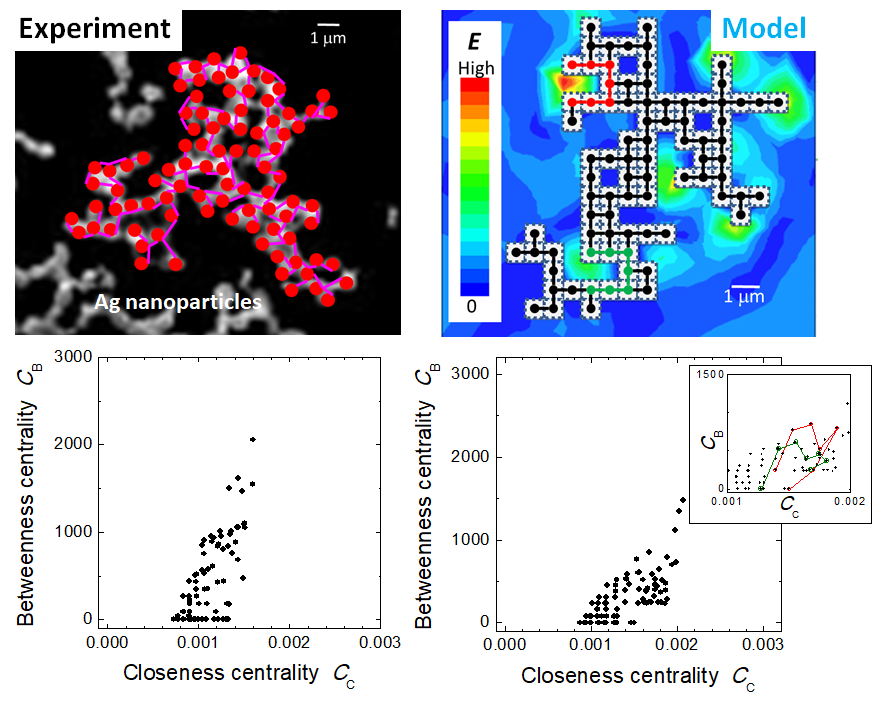
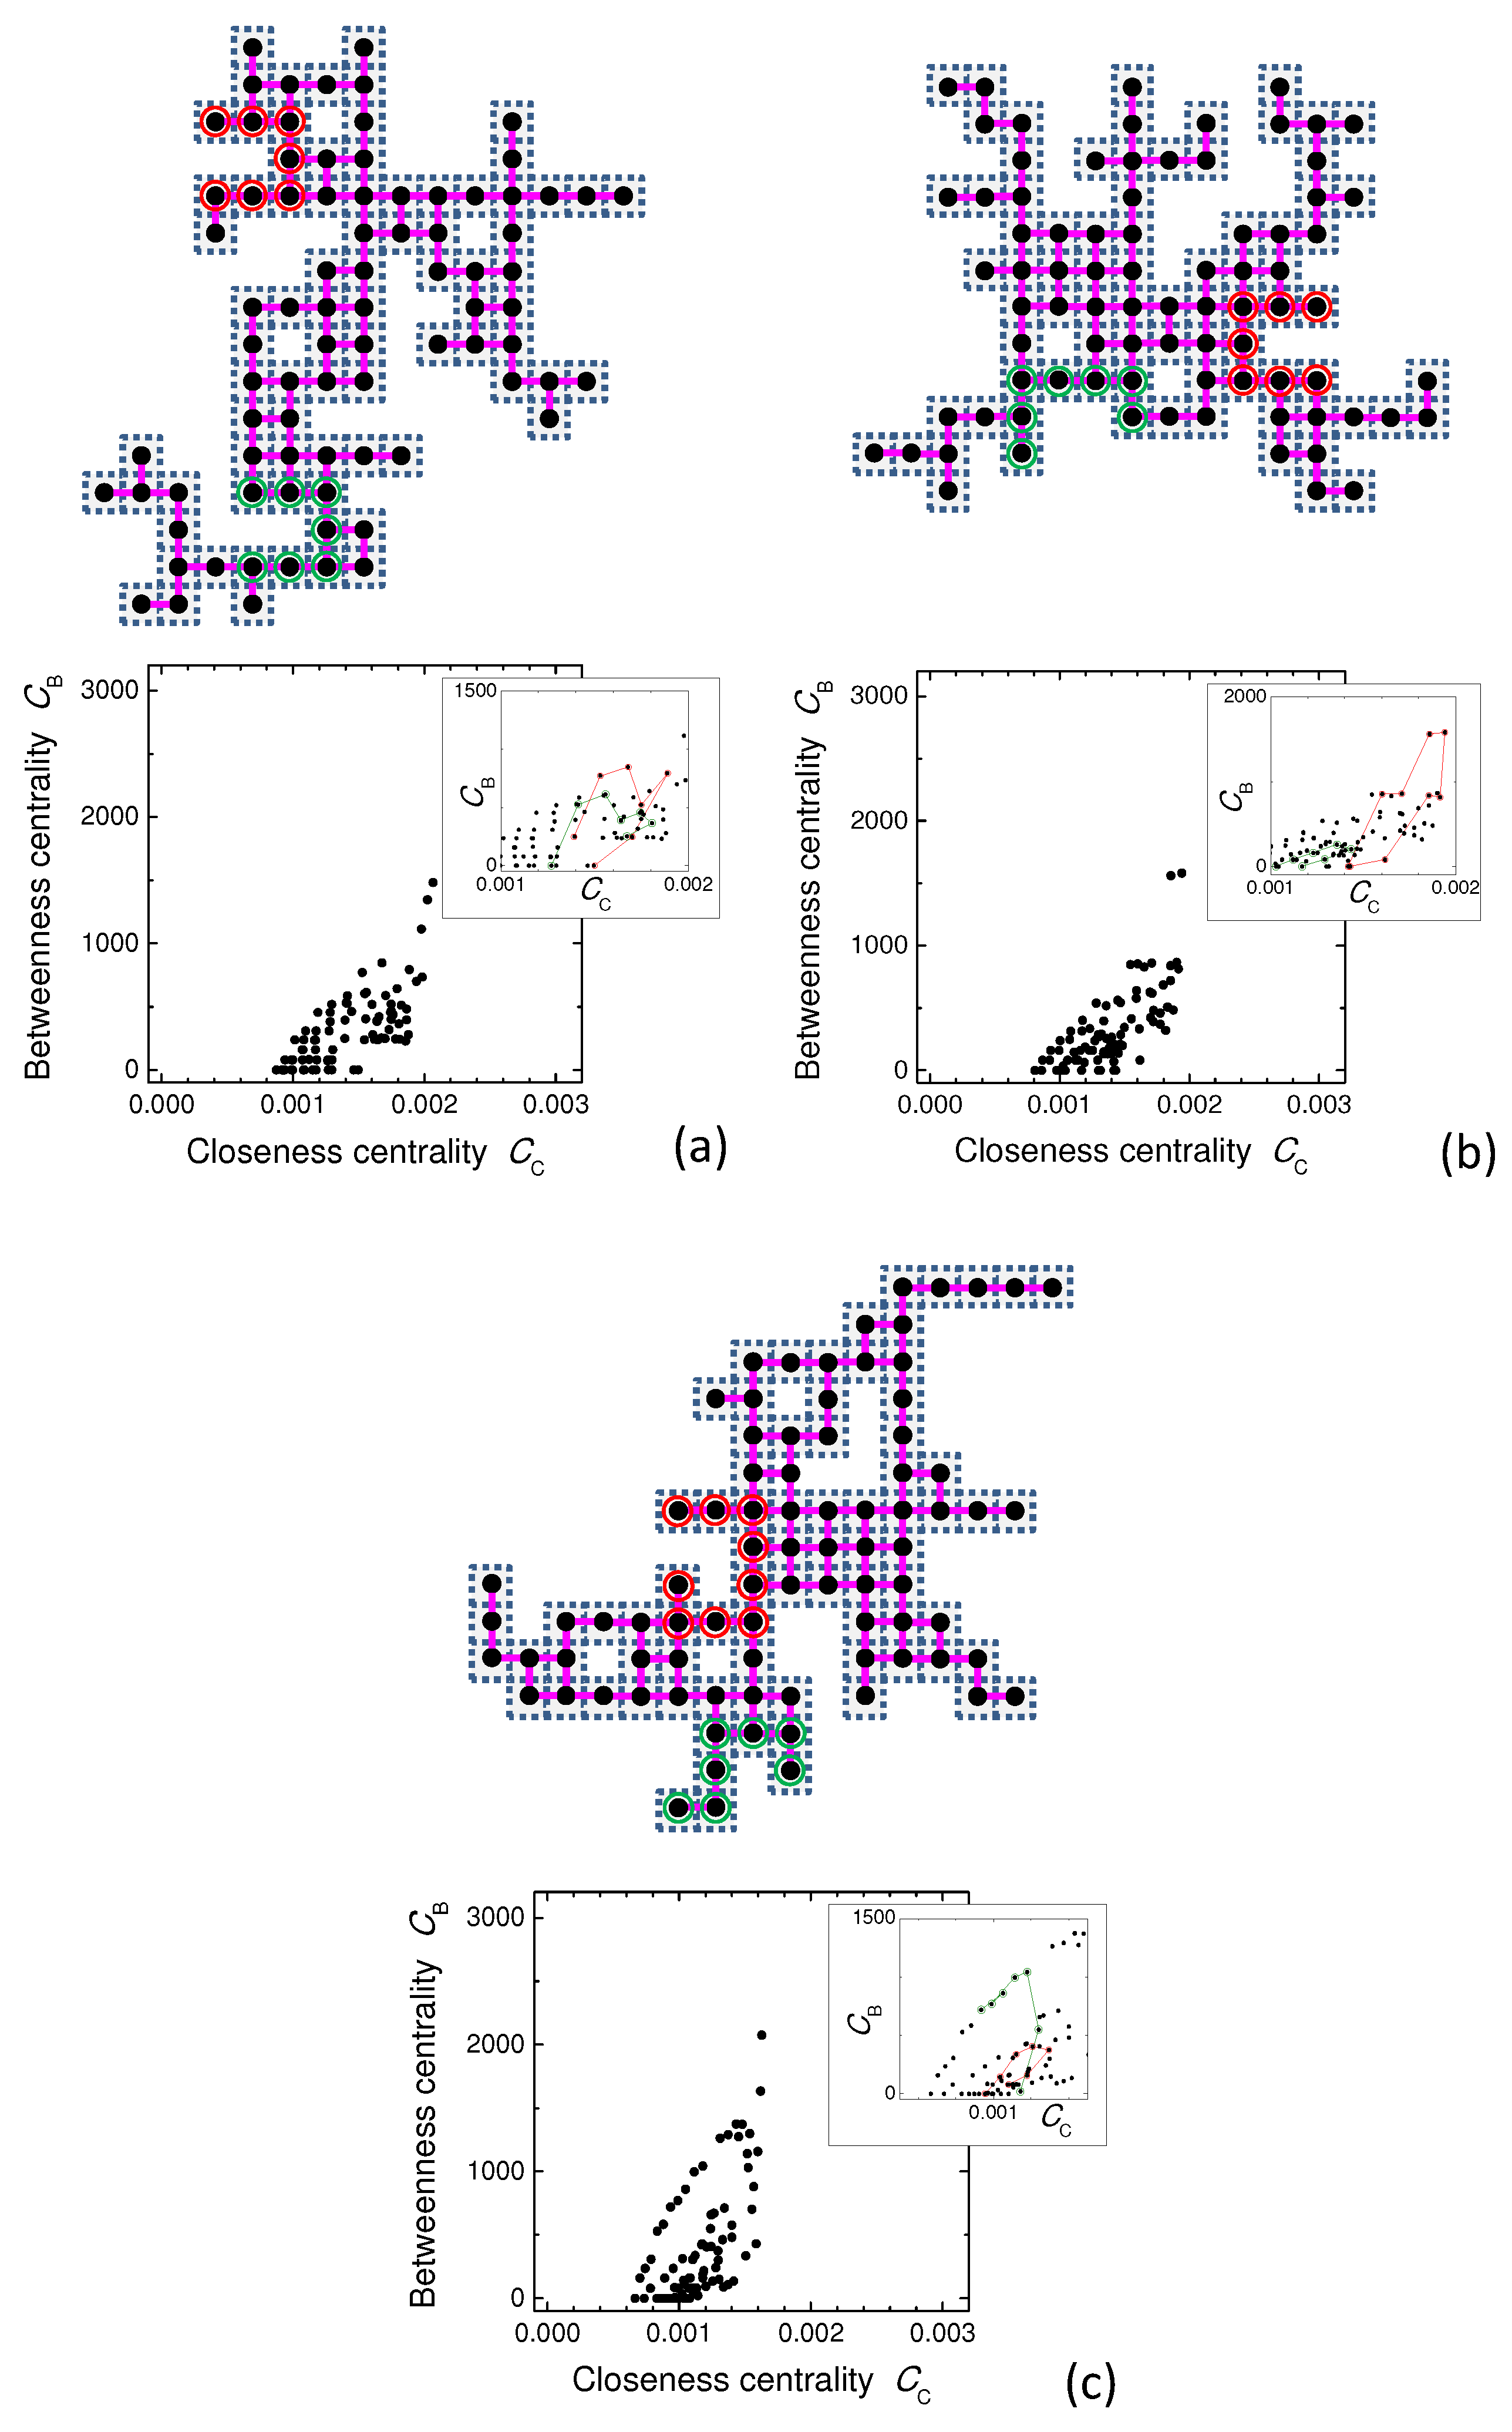
Examples of results obtained in this analysis are shown in Figure 6. The following is the procedure for analyzing nanoparticle networks. Picking up an isolated cluster and allocating nodes and edges to the observed nanoparticles, we calculate two network indices: closeness centrality and betweenness centrality [29]. The measure of closeness centrality for a given node is defined as an the inverse of the sum of path lengths between the node and the others; the measure becomes large if the node is located in the center of the network structure. The measure of betweenness centrality for a given node is defined as a relative probability of the occupation of a position along the shortest path among all nodes; becomes large when the node is located near the center and the channel of the network becomes narrow. In relative perspectives, is sensitive to the aspect ratio of the entire network configuration (e.g., square or rectangular shapes), whereas is sensitive to the deformation of the network configuration into singular patterns. We plot these two measures for all nodes in one 2D diagram, since correlation between and will clarify topological properties of nanoparticle networks. In the general analysis of complex networks, other statistical parameters like degree distributions and cluster coefficients also become measures of network topology, but a nanoparticle network in our cases has a restriction of 2D patterns in which the maximum degree or number of edges for each node is four at most, and shortcuts to remote nodes are prohibited; correlation between and will be favorable instead.
Figure 6a shows the case of the nanoparticle network with 33 nodes found in the SEM image shown in Figure 4c, with at 0.02 mol/L. The network shown here is not huge, but it contains typical topological parameters observed throughout the SEM images for analysis. In the diagram, we recognize a triangle area in which the dots corresponding to the nodes scatter in less regularity. Several microscopic views give us further information on the topological roles of nodes. For instance, the nodes with the number 16 and 17 are located near the top of the triangle, around the maximum values of both and . Near the left apex of the bottom side, the nodes with the numbers 1, 32 and 33 are located, which are far from the center of the structure with the largest distances. In contrast, although located on the bottom side, the node with the number 23 is around the right apex with a large value of , which means that it is near the center, but at the top of a chain structure. Inside the triangle, nodes scatter according to edge distributions that include similar structures in every scale, which is the definition of fractals.
In comparison, regularly-arranged patterns as a line (Figure 6b) and a square lattice (Figure 6c) show different dot distributions in the diagram. The line-shape linear network in Figure 6b includes 36 nodes, and all dots in the diagram are on one curve without dot scattering, which means that the roles of nodes as joints of the network are regular; as the sum of the distances from a given node (indicated by ) decreases as the probability as a node on the shortcut between arbitrary pairs of nodes increases (indicated by ). A similar regular arrangement is observed in the case of the square lattice, as shown in Figure 6c. The number of dots is smaller due to the symmetry in the square shape, and is larger since the dots are distributed in a compact space, but the dots are almost on one curved line. These facts indicate that the diagram in Figure 6a properly represents the geometrical properties of the fractal-like structure observed in the nanoparticle network.
Further analysis of experimentally-observed nanoparticle networks in Figure 4 is performed, as shown in Figure 7. In all of the diagrams, similar triangles to Figure 6a form with slight changes of the dot distributions. If the number of nodes is larger, ranges in smaller values since the closeness is less found in a large network, and the values of are larger due to the enhanced importance as connected joints because we consider fractal structures that have winner-take-all crossing points. Except these size effects, we can find similar triangles in the diagrams for fractal-like networks; there exist nodes in the center that are close to all points and edges that provide distributed nodes in every scale of one spatial structure.
In comparison, theoretical DLA patterns used for simulating local electric fields in Figure 2 are also analyzed, as shown in Figure 9. We also find similar triangles, which indicate that the DLA model used in this study imitates network structures observed in the nanoparticles networks in Figure 6a and Figure 7a–d. Using these diagrams, we can find the common rules in patterns that create local resonances. In each figure, we pick up intensified resonances with the surrounding nodes (in red and green circles) from Figure 2. The nodes form reversed ‘U’ shapes in all cases in the diagrams, indicated by connected lines in the corresponding colors. The nodes near the end of the resonance structure have low values of , and those in the center have larger values, while gradually changes along the resonance structure due to variation of distances to the center. These facts indicate that, using a diagram and searching for reversed U shapes in a series of nodes in a given network, the prediction of possible optical resonances may be possible in fractal-like metallic nanoparticle networks.
5. Conclusions
In this report, we verified that topological network properties of fractal-like metallic nanoparticle patterns affect optical resonances and showed their potentials as metamaterial alternatives. We stress three points that are clarified using experimental and theoretical results: self-assembly of structures with irregular shapes, invariant optical outputs based on an invariant nanoparticle network topology and possible predictions of optical properties using network topological parameters. The formation of aggregates is based on the DLA model, and irregular microscopic shapes include resonance structures at invariant optical frequencies of electromagnetic waves. The characteristic frequencies depend on particle distances in a nanoparticle network. Centrality indices developed in network theory generate a diagram for the macroscopic and geometrical properties of the nanoparticles’ network well, and the prediction of resonance microstructures may be partially possible without the calculation of electromagnetic-wave propagation. These three findings are neither focusing on self-assembled properties of nanoparticles, nor indicating design rules of optical metamaterials, but suggest the importance of interdisciplinary approaches (e.g., via complex network theory) when we consider phenomena related to a large number of nanoparticles.
Author Contributions
N.K. performed the experiments and theoretical analyses shown here and wrote the paper by drawing the figures. O.S. conceived of and designed the research activities, as well as wrote the paper.
Funding
This work was supported by a Grant-in-Aid for Scientific Research from the Japanese Ministry of Education, Culture, Sports, Science and Technology, Japan (JSPS KAKENHI Grant Numbers JP18H03690 and JP25600124).
Acknowledgments
The author thanks A. Iwai at Kyoto University for his fruitful comments on this study.
Conflicts of Interest
The authors declare no conflict of interest.
References
- Rotman, W. Plasma simulation by artificial dielectrics and parallel-plate media. IEEE Trans. Antennas Propag. 1962, 10, 82–95. [Google Scholar] [CrossRef]
- Awai, I. Artificial dielectric resonators for miniaturized filters. IEEE Microw. Mag. 2008, 9, 55–64. [Google Scholar] [CrossRef]
- Pendry, J.B.; Holden, A.J.; Stewart, W.J.; Youngs, I. Extremely low frequency plasmons in metallic mesostructures. Phys. Rev. Lett. 1996, 76, 4773–4776. [Google Scholar] [CrossRef] [PubMed]
- Pendry, J.B.; Holden, A.J.; Robbins, D.J.; Stewart, W.J. Magnetism from conductors and enhanced nonlinear phenomena. IEEE Trans. Microw. Theory Tech. 1999, 47, 2075–2084. [Google Scholar] [CrossRef] [Green Version]
- Shelby, R.A.; Smith, D.R.; Schultz, S. Experimental verification of a negative index of refraction. Science 2001, 292, 77–79. [Google Scholar] [CrossRef] [PubMed]
- Sihvola, A. (Ed.) Advances in Electromagnetics of Complex Media and Metamaterials; Kluwer: Dordrecht, The Netherlands, 2002. [Google Scholar]
- Schurig, D.; Mock, J.J.; Justice, B.J.; Cummer, S.A.; Pendry, J.B.; Starr, A.F.; Smith, D.R. Metamaterial electromagnetic cloak at microwave frequencies. Science 2006, 314, 977–980. [Google Scholar] [CrossRef] [PubMed]
- Shalaev, V.M. Optical negative-index metamaterials. Nat. Photo. 2007, 1, 41–48. [Google Scholar] [CrossRef]
- Soukoulis, C.M.; Wegener, M. Past achievements and future challenges in the development of three-dimensional photonic metamaterials. Nat. Photo. 2011, 5, 523–530. [Google Scholar] [CrossRef] [Green Version]
- Sakai, O.; Tachibana, K. Plasmas as metamaterials: A review. Plasma Sources Sci. Technol. 2012, 21, 013001. [Google Scholar] [CrossRef]
- Breger, J.C.; Buckhout-White, S.; Walper, S.A.; Oh, E.; Susumu, K.; Ancona, M.G.; Medintz, I.L. Assembling high activity phosphotriesterase composites using hybrid nanoparticle peptide-DNA scaffolded architectures. Nano Futures 2017, 1, 011002. [Google Scholar] [CrossRef] [Green Version]
- Choi, H.K.; Chang, J.B.; Hannon, A.F.; Yang, J.K.W.; Berggren, K.K.; Alexander-Katz, A.; Ross, C.A. Nanoscale spirals by directed self-assembly. Nano Futures 2017, 1, 015001. [Google Scholar] [CrossRef] [Green Version]
- Mandelbrot, B.B. The Fractal Geometry of Nature; Freeman: San Fransisco, CA, USA, 1982. [Google Scholar]
- Barabasi, A.L.; Stanley, H.E. Fractal Concepts in Surface Growth; Cambridge University Press: Cambridge, MA, USA, 1995. [Google Scholar]
- Kokhanovsky, A.A. Light Scattering Media Optics—Problems and Solutions (Third Edition); Springer: Berlin, Germany, 2010. [Google Scholar]
- Mejdoubi, A.; Brosseau, C. Reflectance and absorbance of all-dielectric metamaterial composites with fractal boundaries: A numerical investigation. J. Appl. Phys. 2009, 105, 024110. [Google Scholar] [CrossRef]
- Miyamaru, F.; Kubota, S.; Takeda, M.W. Terahertz response of split-ring resonators with fractal structures. Appl. Phys. Express 2012, 5, 072001. [Google Scholar] [CrossRef]
- Tsai, D.P.; Kovacs, J.; Wang, Z.; Moskovits, M.; Shalaev, V.M.; Suh, S.; Botet, R. Photon scanning tunneling microscopy images of optical excitations of fractal metal colloid clusters. Phys. Rev. Lett. 1994, 72, 4149–4152. [Google Scholar] [CrossRef] [PubMed]
- Buin, A.K.; de Chatel, P.F.; Nakotte, H.; Drachev, V.P.; Shalaev, V.M. Saturation effect in the optical response of Ag-nanoparticle fractal aggregates. Phys. Rev. B 2006, 73, 035438. [Google Scholar] [CrossRef]
- Wenseleers, W.; Stellacci, F.; Meyer-Friedrichsen, T.; Mangel, T.; Bauer, C.A.; Pond, S.J.K.; Marder, S.R.; Perry, J.W. Five Orders-of-magnitude enhancement of two-photon absorption for dyes on silver nanoparticle fractal clusters. J. Phys. Chem. 2002, 106, 6853–6863. [Google Scholar] [CrossRef]
- Borges, J.; Rodrigues, M.S.; Lopes, C.; Costa1, D.; Ferreira, A.; Pereira, R.M.S.; Costa, M.F.; Vasilevskiy, M.I.; Vaz, F. Ag fractals formed on top of a porous TiO2 thin film. Physica Status Solidi 2016, 10, 530–534. [Google Scholar] [CrossRef]
- Ruffato, G.; Romanato, F.; Garoli, D.; Cattarin, S. Nanoporous gold plasmonic structures for sensing applications. Opt. Express 2011, 19, 13164–13170. [Google Scholar] [CrossRef] [PubMed]
- Garoli, D.; Ruffato, G.; Zilio, P.; Calandrini, E.; Angelis, F.D.; Romanato, F.; Cattarin, S. Nanoporous gold leaves: preparation, optical characterization and plasmonic behavior in the visible and mid-infrared spectral regions. Opt. Mat. Express 2015, 5, 2246–2256. [Google Scholar] [CrossRef]
- Garoli, D.; Lovato, L.; Giustina, G.D.; Oliverio, M.; Francardi, M.; Zanchetta, E.; Brusatin, G.; Angelis, F.D. Directly nanopatternable nanoporous titania—Application to cell growth engineering. Microelectron. Eng. 2016, 155, 102–106. [Google Scholar] [CrossRef]
- Ma, K.; Corsi, J.S.; Fu, F.; Detsi, E. Origin of the volume contraction during nanoporous gold formation by dealloying for high-performance electrochemical applications. ACS Appl. Nano Mater. 2017, 1, 541–546. [Google Scholar] [CrossRef]
- Sakai, O.; Hiraoka, Y.; Kihara, N.; Blanquet, E.; Urabe, K.; Tanaka, M. Microdischarge-induced decomposition of ammonia and reduction of silver ions for formation of two-dimensional network structure. Plasma Chem. Plasma Process. 2016, 36, 281–294. [Google Scholar] [CrossRef]
- Albert, R.; Barabasi, A.L. Statistical mechanics of complex networks. Rev. Modern Phys. 2002, 74, 47–95. [Google Scholar] [CrossRef]
- Newman, M.E.J. The structure and function of complex networks. SIAM Rev. 2003, 45, 167–256. [Google Scholar] [CrossRef]
- Kolaczyk, E.D. Statistical Analysis of Network Data: Methods and Models; Springer: Berlin, Germany, 2009. [Google Scholar]
- Urade, Y.; Nakata, Y.; Nakanishi, T.; Kitano, M. Frequency-independent response of self-complementary checkerboard screens. Phys. Rev. Lett. 2015, 114, 237401. [Google Scholar] [CrossRef] [PubMed]
- Aguilar-Mendez, M.A.; Martin-Martinez, E.S.; Ortega-Arroyo, L.; Cobian-Portillo, G.; Sanchez-Espindola, E. Synthesis and characterization of silver nanoparticles: Effect on phytopathogen Colletotrichum gloesporioides. J. Nanopart. Res. 2011, 13, 2525–2532. [Google Scholar] [CrossRef]
- Forstmann, F.; Gerhardts, R.R. Metal Optics Near the Plasma Frequency; Springer: Berlin, Germany, 1986. [Google Scholar]
- Wiener, H. Structural determination of paraffin boiling points. J. Am. Chem. Soc. 1947, 1, 17–20. [Google Scholar] [CrossRef]
- Bultheel, A.; Ori, O. Topological modeling of 1-pentagon carbon nanocones—Topological efficiency and magic sizes. Fuller. Nanotub. Carb. Nanostruct. 2018, 26, 291302. [Google Scholar] [CrossRef]
- Temkin, O.N.; Zeigarnik, A.V.; Bonchev, D. Chemical Reaction Networks; CRC Press: Boca Raton, FL, USA, 1996. [Google Scholar]
- Mizui, Y.; Kojima, T.; Miyagi, S.; Sakai, O. Graphical classification in multi-centrality-index diagrams for complex chemical networks. Symmetry 2017, 9, 309. [Google Scholar] [CrossRef]
- Fox, J. (Ed.) Proceedings of the Symposium on Generalized Networks; Polytechnic Press: New York, NY, USA, 1966. [Google Scholar]
Figure 1.
Typical particle 2D aggregates created in the numerical simulation. Calculation is based on the diffusion-limited aggregation (DLA) model [26], and open triangles indicate two initial particles fixed at given positions.
Figure 1.
Typical particle 2D aggregates created in the numerical simulation. Calculation is based on the diffusion-limited aggregation (DLA) model [26], and open triangles indicate two initial particles fixed at given positions.

Figure 2.
Three metallic particle 2D patterns based on the DLA model for targets in the numerical calculation of electromagnetic-wave propagation in TE mode. Open dotted squares are particles of a perfect conductor, and the boundary in the shape of a square (12 × 12 m) is set to be periodic. Input and output ports for electromagnetic waves are 20 m apart from the 2D plane. Hereafter, patterns shown in (a–c) are inferred to be DLA(a), DLA(b) and DLA(c). Contours indicate the intensity of the electric field on the 2D plane at 6522 nm for (a), 6494 nm for (b) and 6383 nm for (c).

Figure 3.
Transmittance spectra calculated by finite element method (FEM) in infrared rays of 2D metallic nano-structures. From the top, the target nano-structure is DLA(a), DLA(b) and DLA(c), respectively. The last figure indicate superposed the effects of these three structures.
Figure 3.
Transmittance spectra calculated by finite element method (FEM) in infrared rays of 2D metallic nano-structures. From the top, the target nano-structure is DLA(a), DLA(b) and DLA(c), respectively. The last figure indicate superposed the effects of these three structures.

Figure 4.
SEM images of observed Ag nanoparticle structures in experiments of AgNO aq. reduction by NH gas. Cases with = 0.001 mol/L (a) 0.01 mol/L (b), 0.02 mol/L (c) (from [26]), 0.05 mol/L (d), 0.1 mol/L (e) and 1 mol/L (f).
Figure 4.
SEM images of observed Ag nanoparticle structures in experiments of AgNO aq. reduction by NH gas. Cases with = 0.001 mol/L (a) 0.01 mol/L (b), 0.02 mol/L (c) (from [26]), 0.05 mol/L (d), 0.1 mol/L (e) and 1 mol/L (f).

Figure 5.
Particle distance and fractal dimension measured in SEM images shown in Figure 4a to Figure 4e as a function of . Particle distance is deduced from the allocation of particles in SEM images as shown in Figure 6a and Figure 7.

Figure 6.
Closeness-betweenness centrality index () diagrams for fractal-like and regular shapes of node networks. (a) Irregular fractal-like case of part of Figure 4c, (b) the case of a line (or linear chain) and (c) the case of a square lattice.
Figure 6.
Closeness-betweenness centrality index () diagrams for fractal-like and regular shapes of node networks. (a) Irregular fractal-like case of part of Figure 4c, (b) the case of a line (or linear chain) and (c) the case of a square lattice.
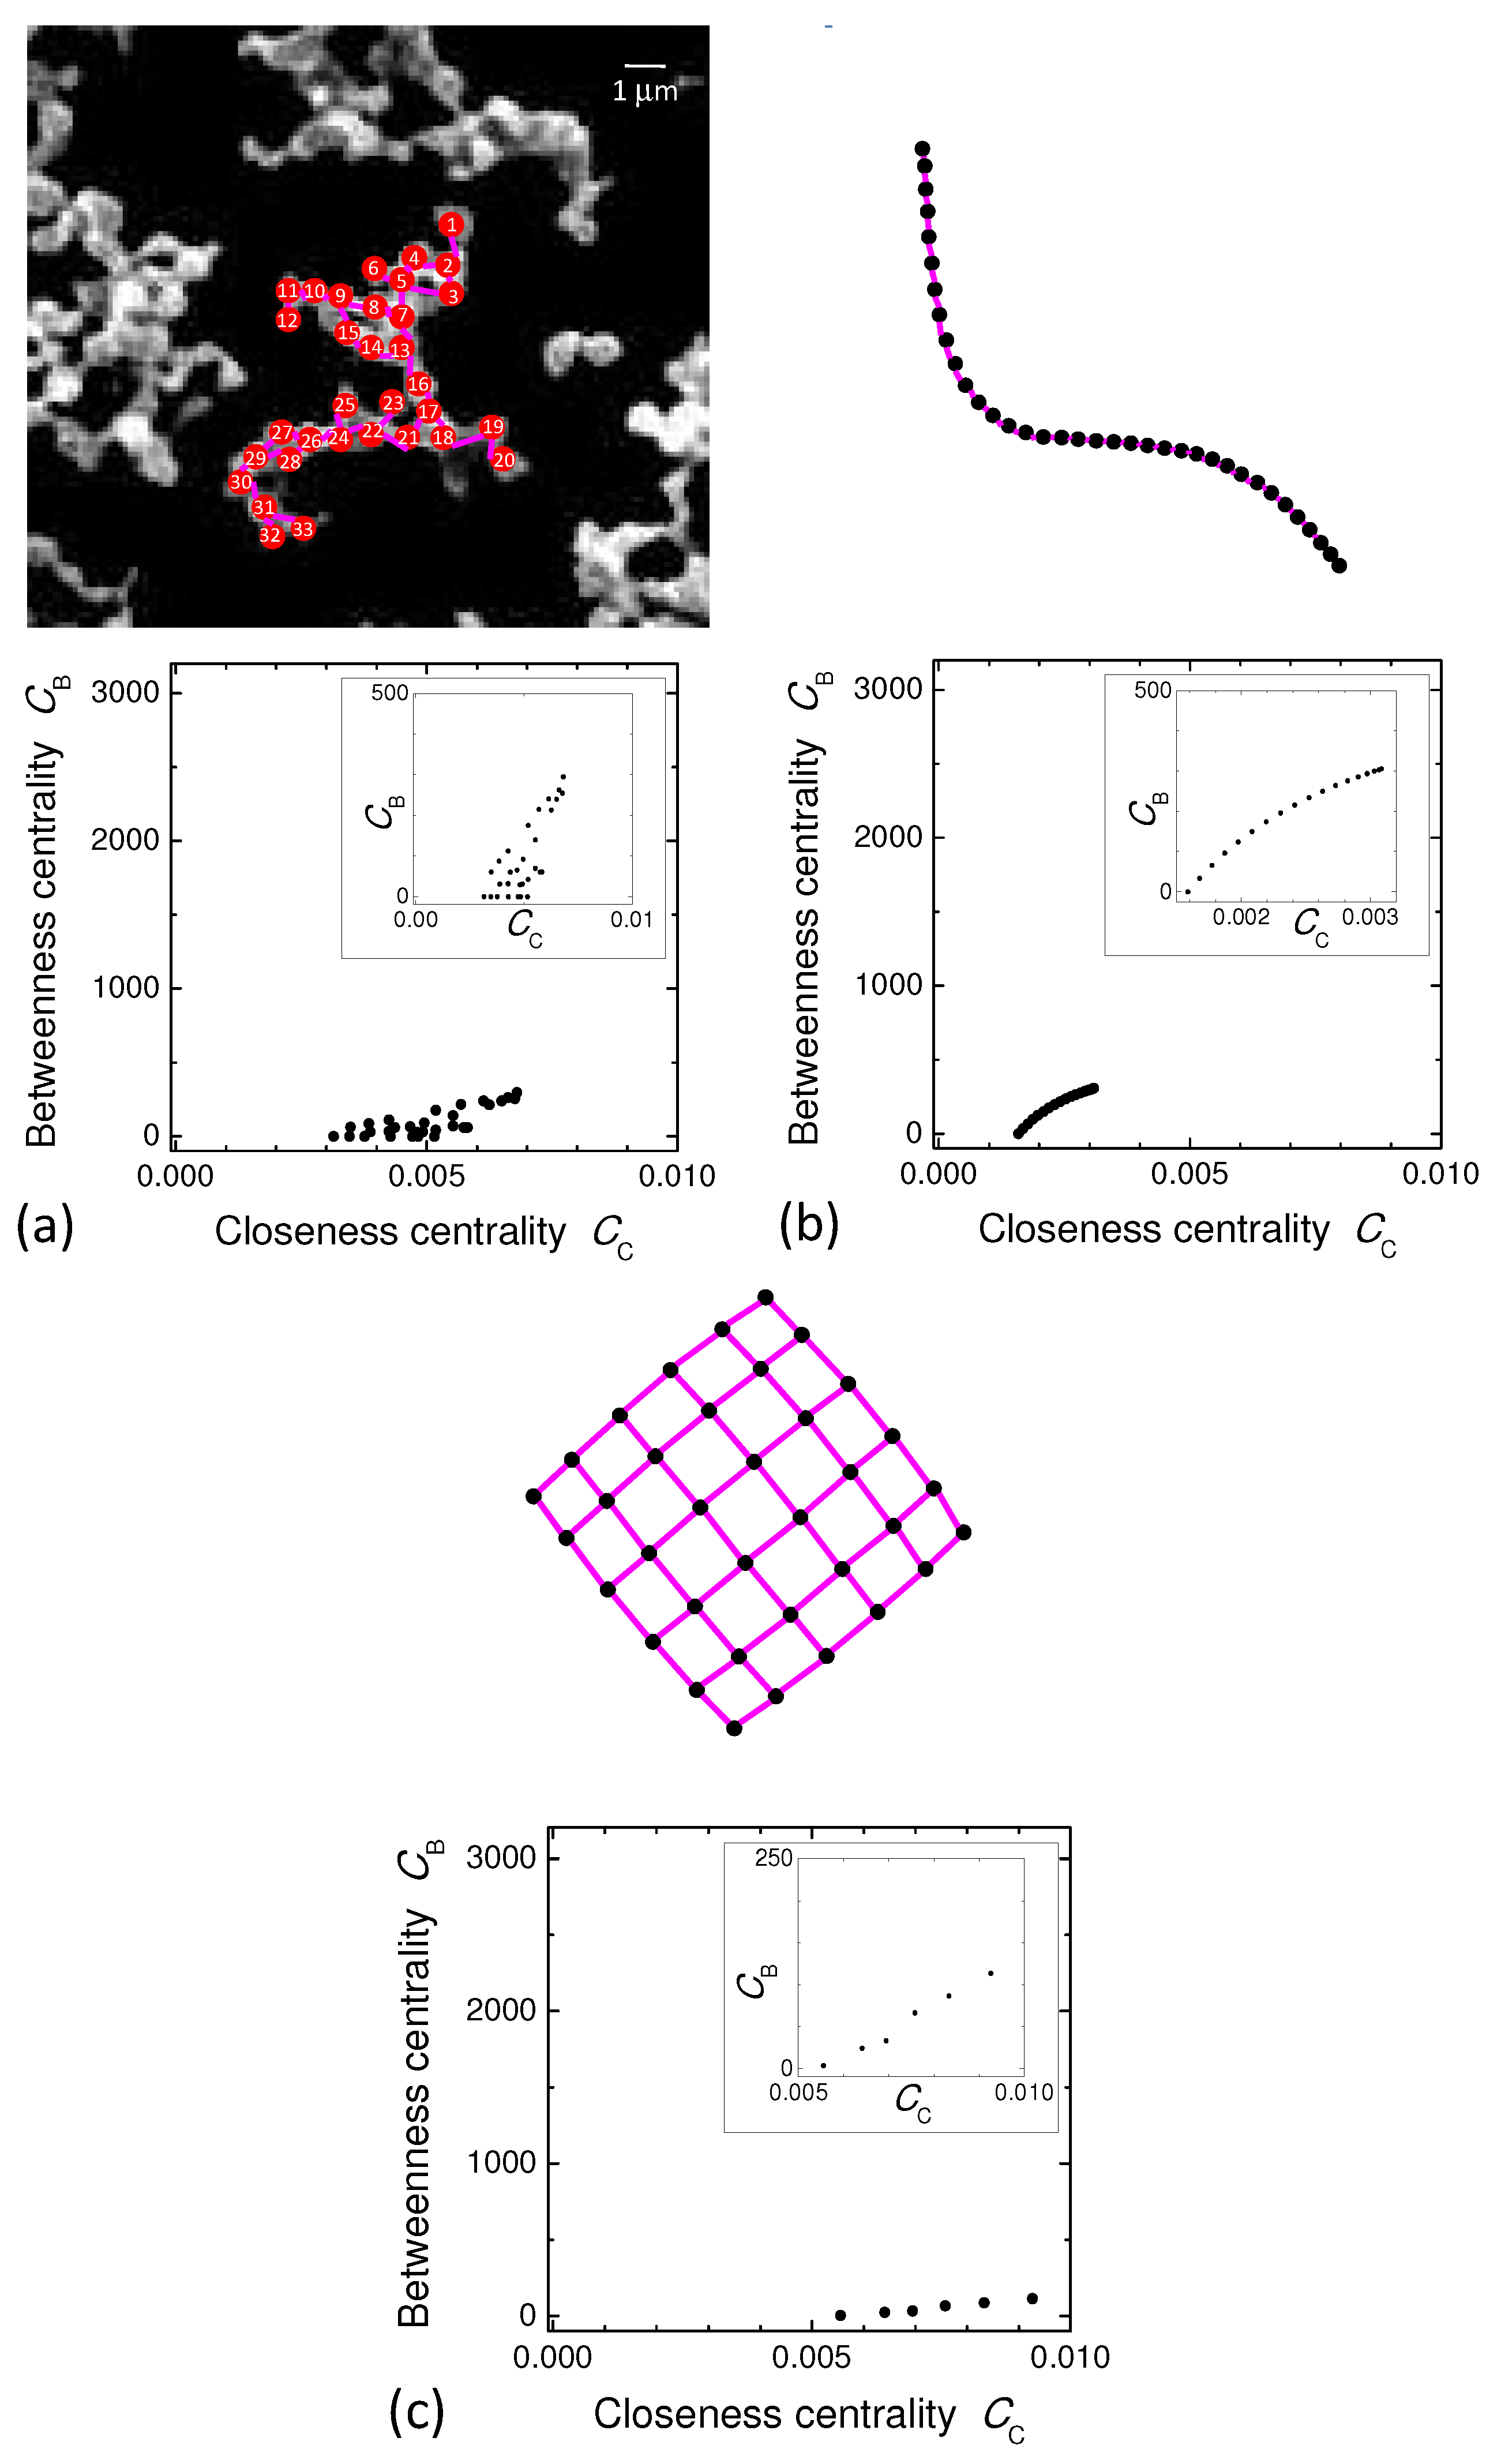
Figure 7.
diagrams for various conditions with specific nanoparticle networks used for analysis. Cases with = 0.01 mol/L (a) (analyzed with part of Figure 4b), 0.02 mol/L (b) (part of Figure 4c), 0.05 mol/L (c) (part of Figure 4d) and 0.1 mol/L (d) (part of Figure 4e).
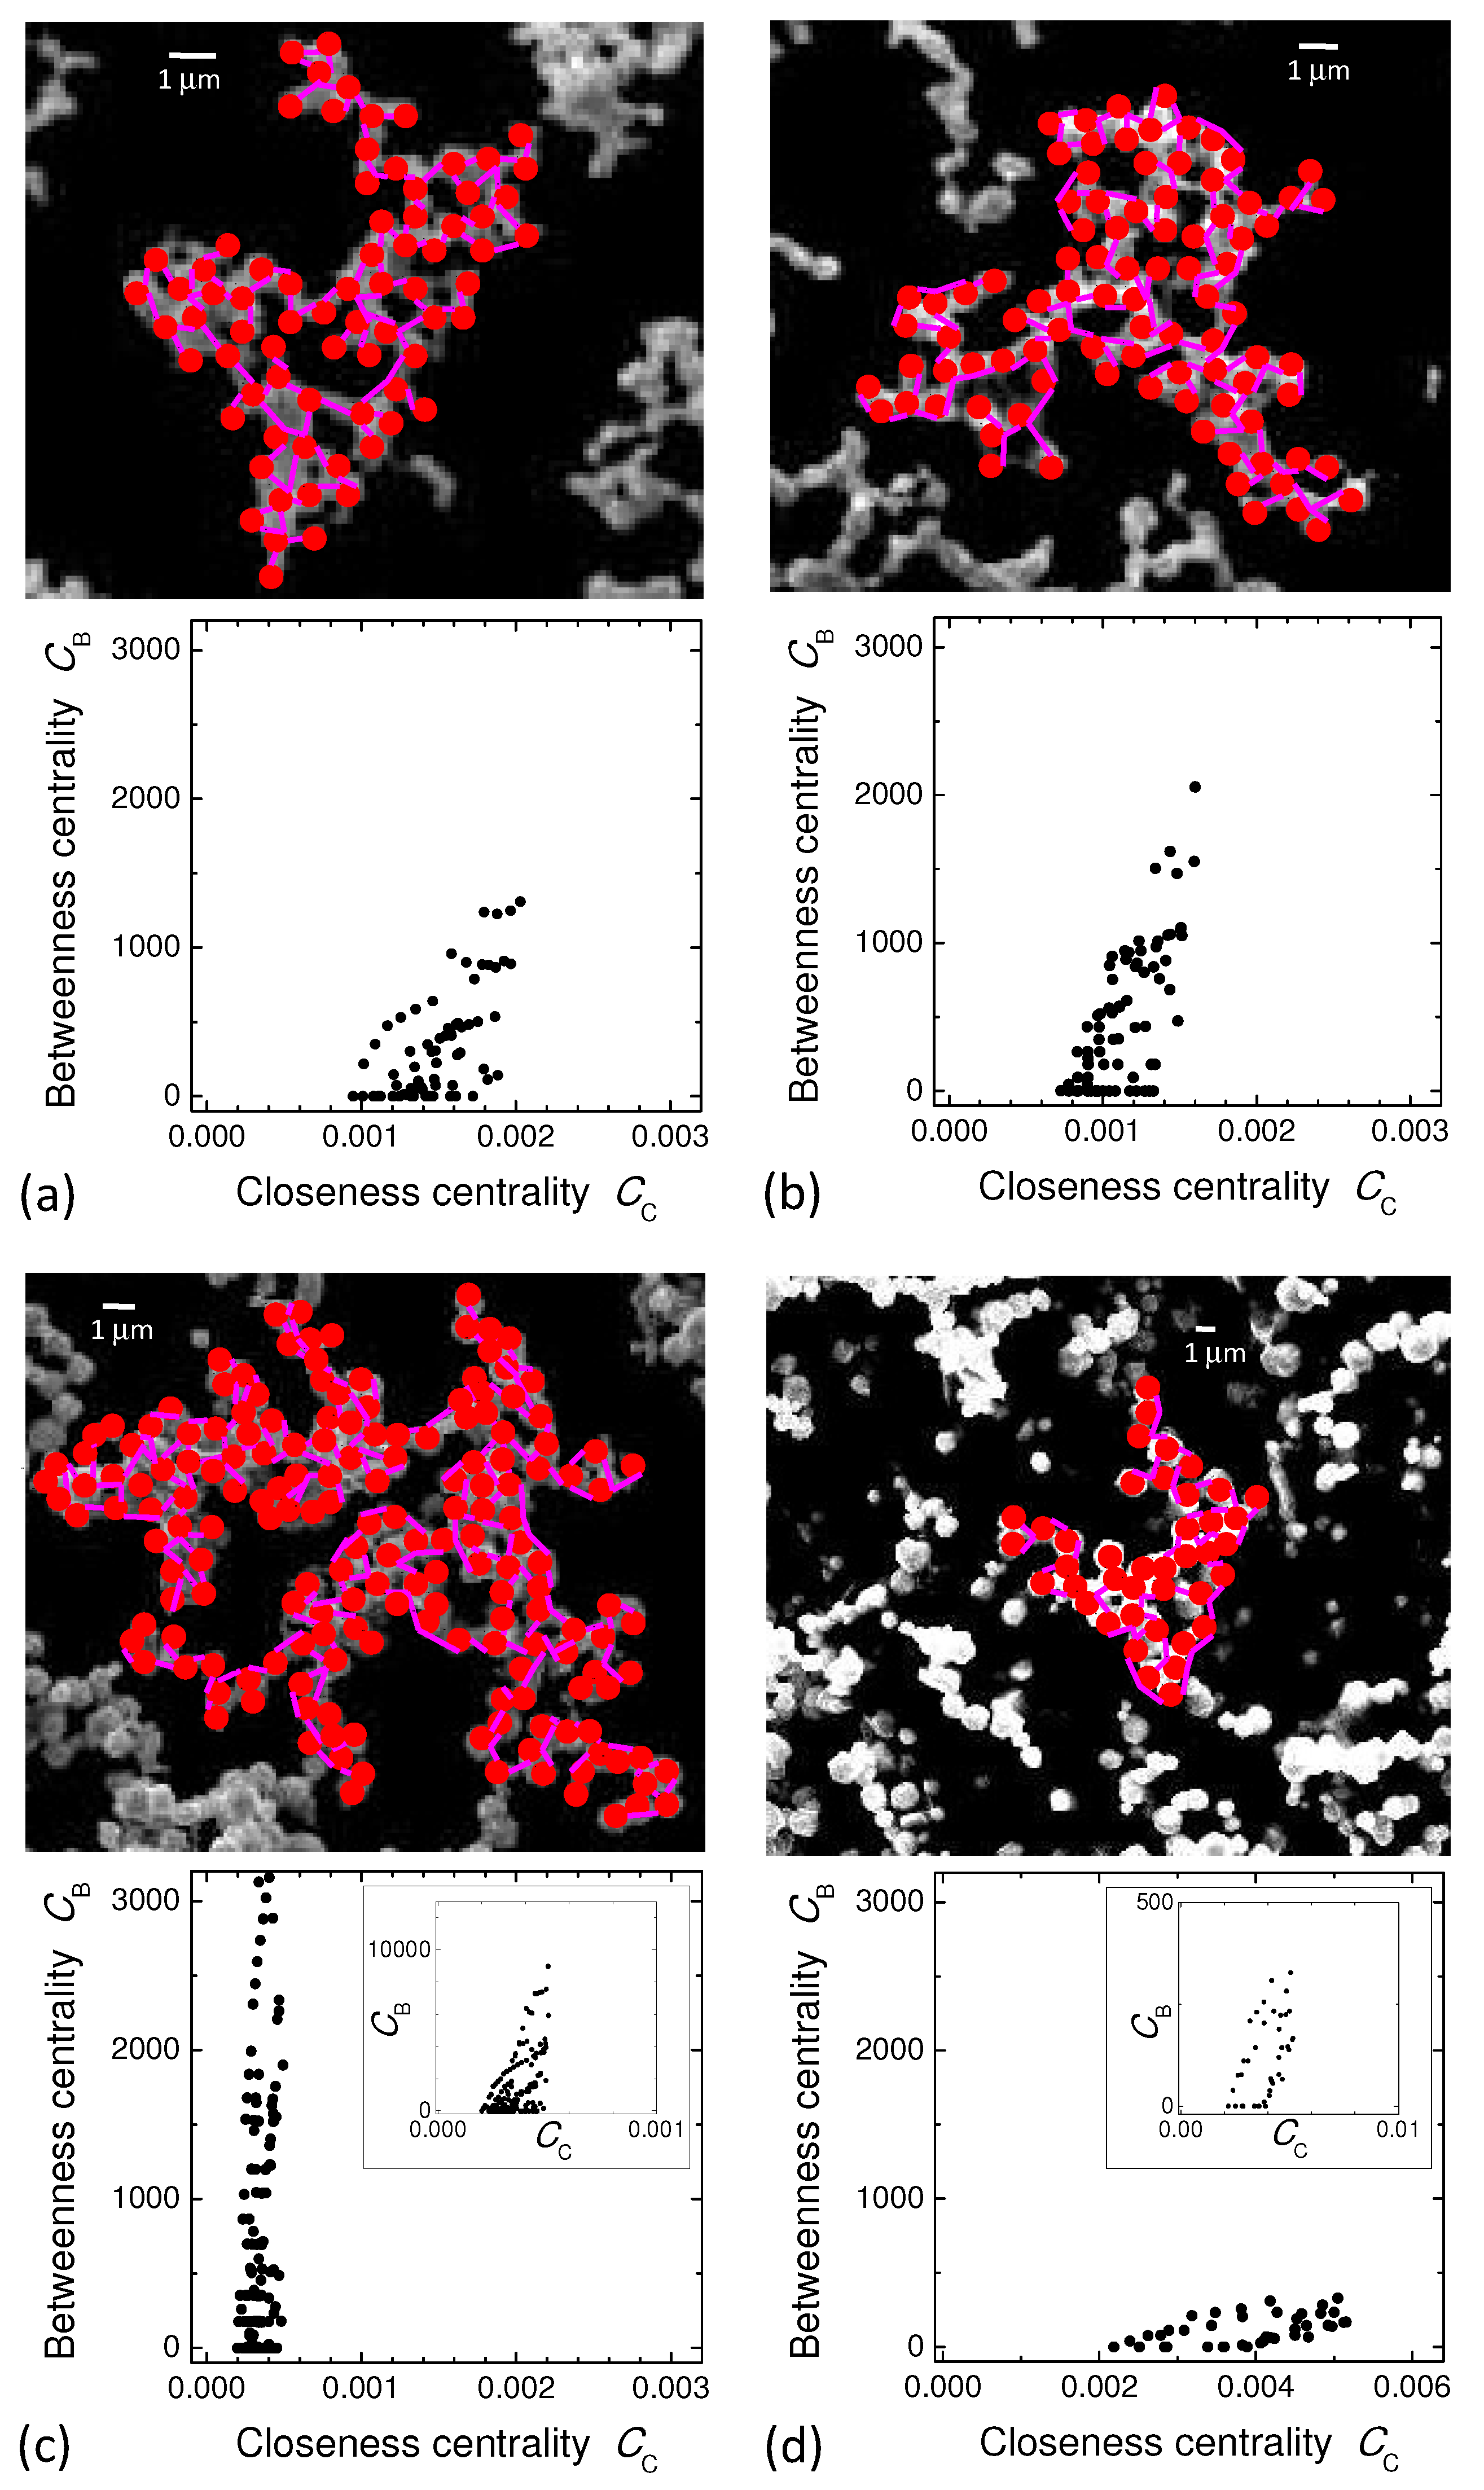
Figure 8.
Transmittance spectra of Ag nanoparticle patterns detected by the FT-IR method. From the top, target corresponds to cases of AgNO concentration = 0.001 mol/L, 0.01 mol/L, 0.02 mol/L, 0.05 mol/L and 0.1 mol/L in Figure 4. Arrows point out extraordinary absorption, and hatched regions indicate artifact signals mixed in the calibration procedure for removing background signals (HO, etc.). The spectrum with = 0.02 mol/L is from [26].

Figure 9.
diagrams for various theoretical cases with specific nanoparticle networks used for analysis. (a) Cases of DLA(a), (b) DLA(b) and (c) DLA(c). A red or green line in the diagram corresponds to a red or green circular mark in the network display.
Figure 9.
diagrams for various theoretical cases with specific nanoparticle networks used for analysis. (a) Cases of DLA(a), (b) DLA(b) and (c) DLA(c). A red or green line in the diagram corresponds to a red or green circular mark in the network display.

© 2018 by the authors. Licensee MDPI, Basel, Switzerland. This article is an open access article distributed under the terms and conditions of the Creative Commons Attribution (CC BY) license (http://creativecommons.org/licenses/by/4.0/).
Share and Cite
MDPI and ACS Style
Kihara, N.; Sakai, O. Topological Network Properties of Fractal-Like Metallic Nanoparticle Patterns and Their Effects on Optical Resonances. Appl. Sci. 2018, 8, 1310. https://doi.org/10.3390/app8081310
AMA Style
Kihara N, Sakai O. Topological Network Properties of Fractal-Like Metallic Nanoparticle Patterns and Their Effects on Optical Resonances. Applied Sciences. 2018; 8(8):1310. https://doi.org/10.3390/app8081310
Chicago/Turabian StyleKihara, Naoya, and Osamu Sakai. 2018. "Topological Network Properties of Fractal-Like Metallic Nanoparticle Patterns and Their Effects on Optical Resonances" Applied Sciences 8, no. 8: 1310. https://doi.org/10.3390/app8081310
Note that from the first issue of 2016, this journal uses article numbers instead of page numbers. See further details here.