Signal Intensity of Contrast Enhancement according to TE in 3.0T MRI T1 Imaging

Abstract
:1. Introduction
2. Materials and Methods
2.1. Phantom Study
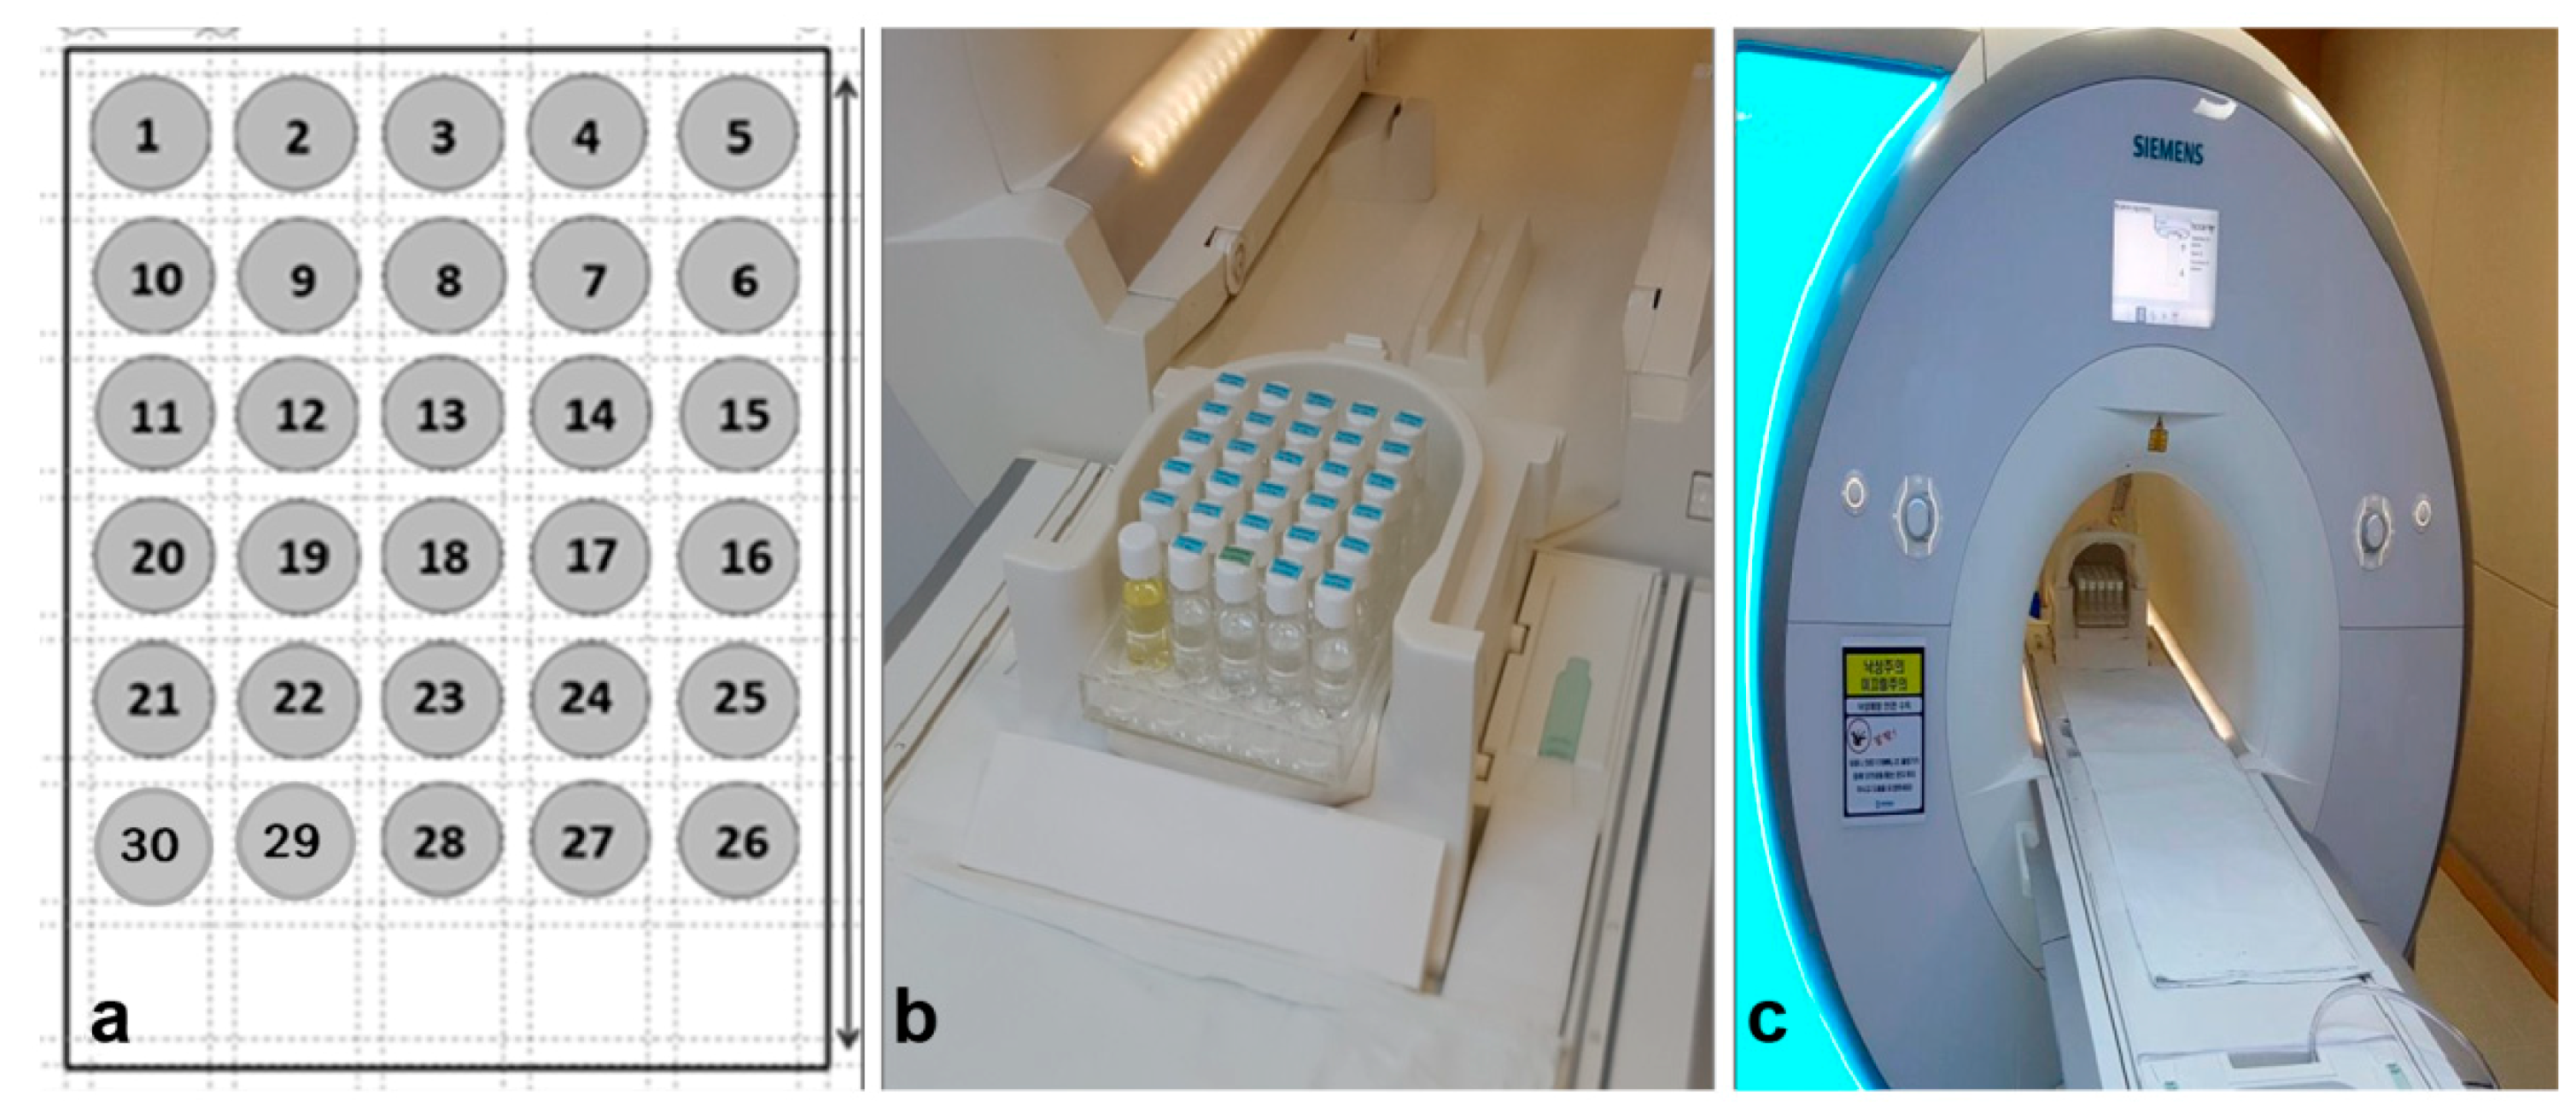
2.1.1. Preparation of GBCA and the MR Phantom
2.1.2. MRI Specification and Protocol
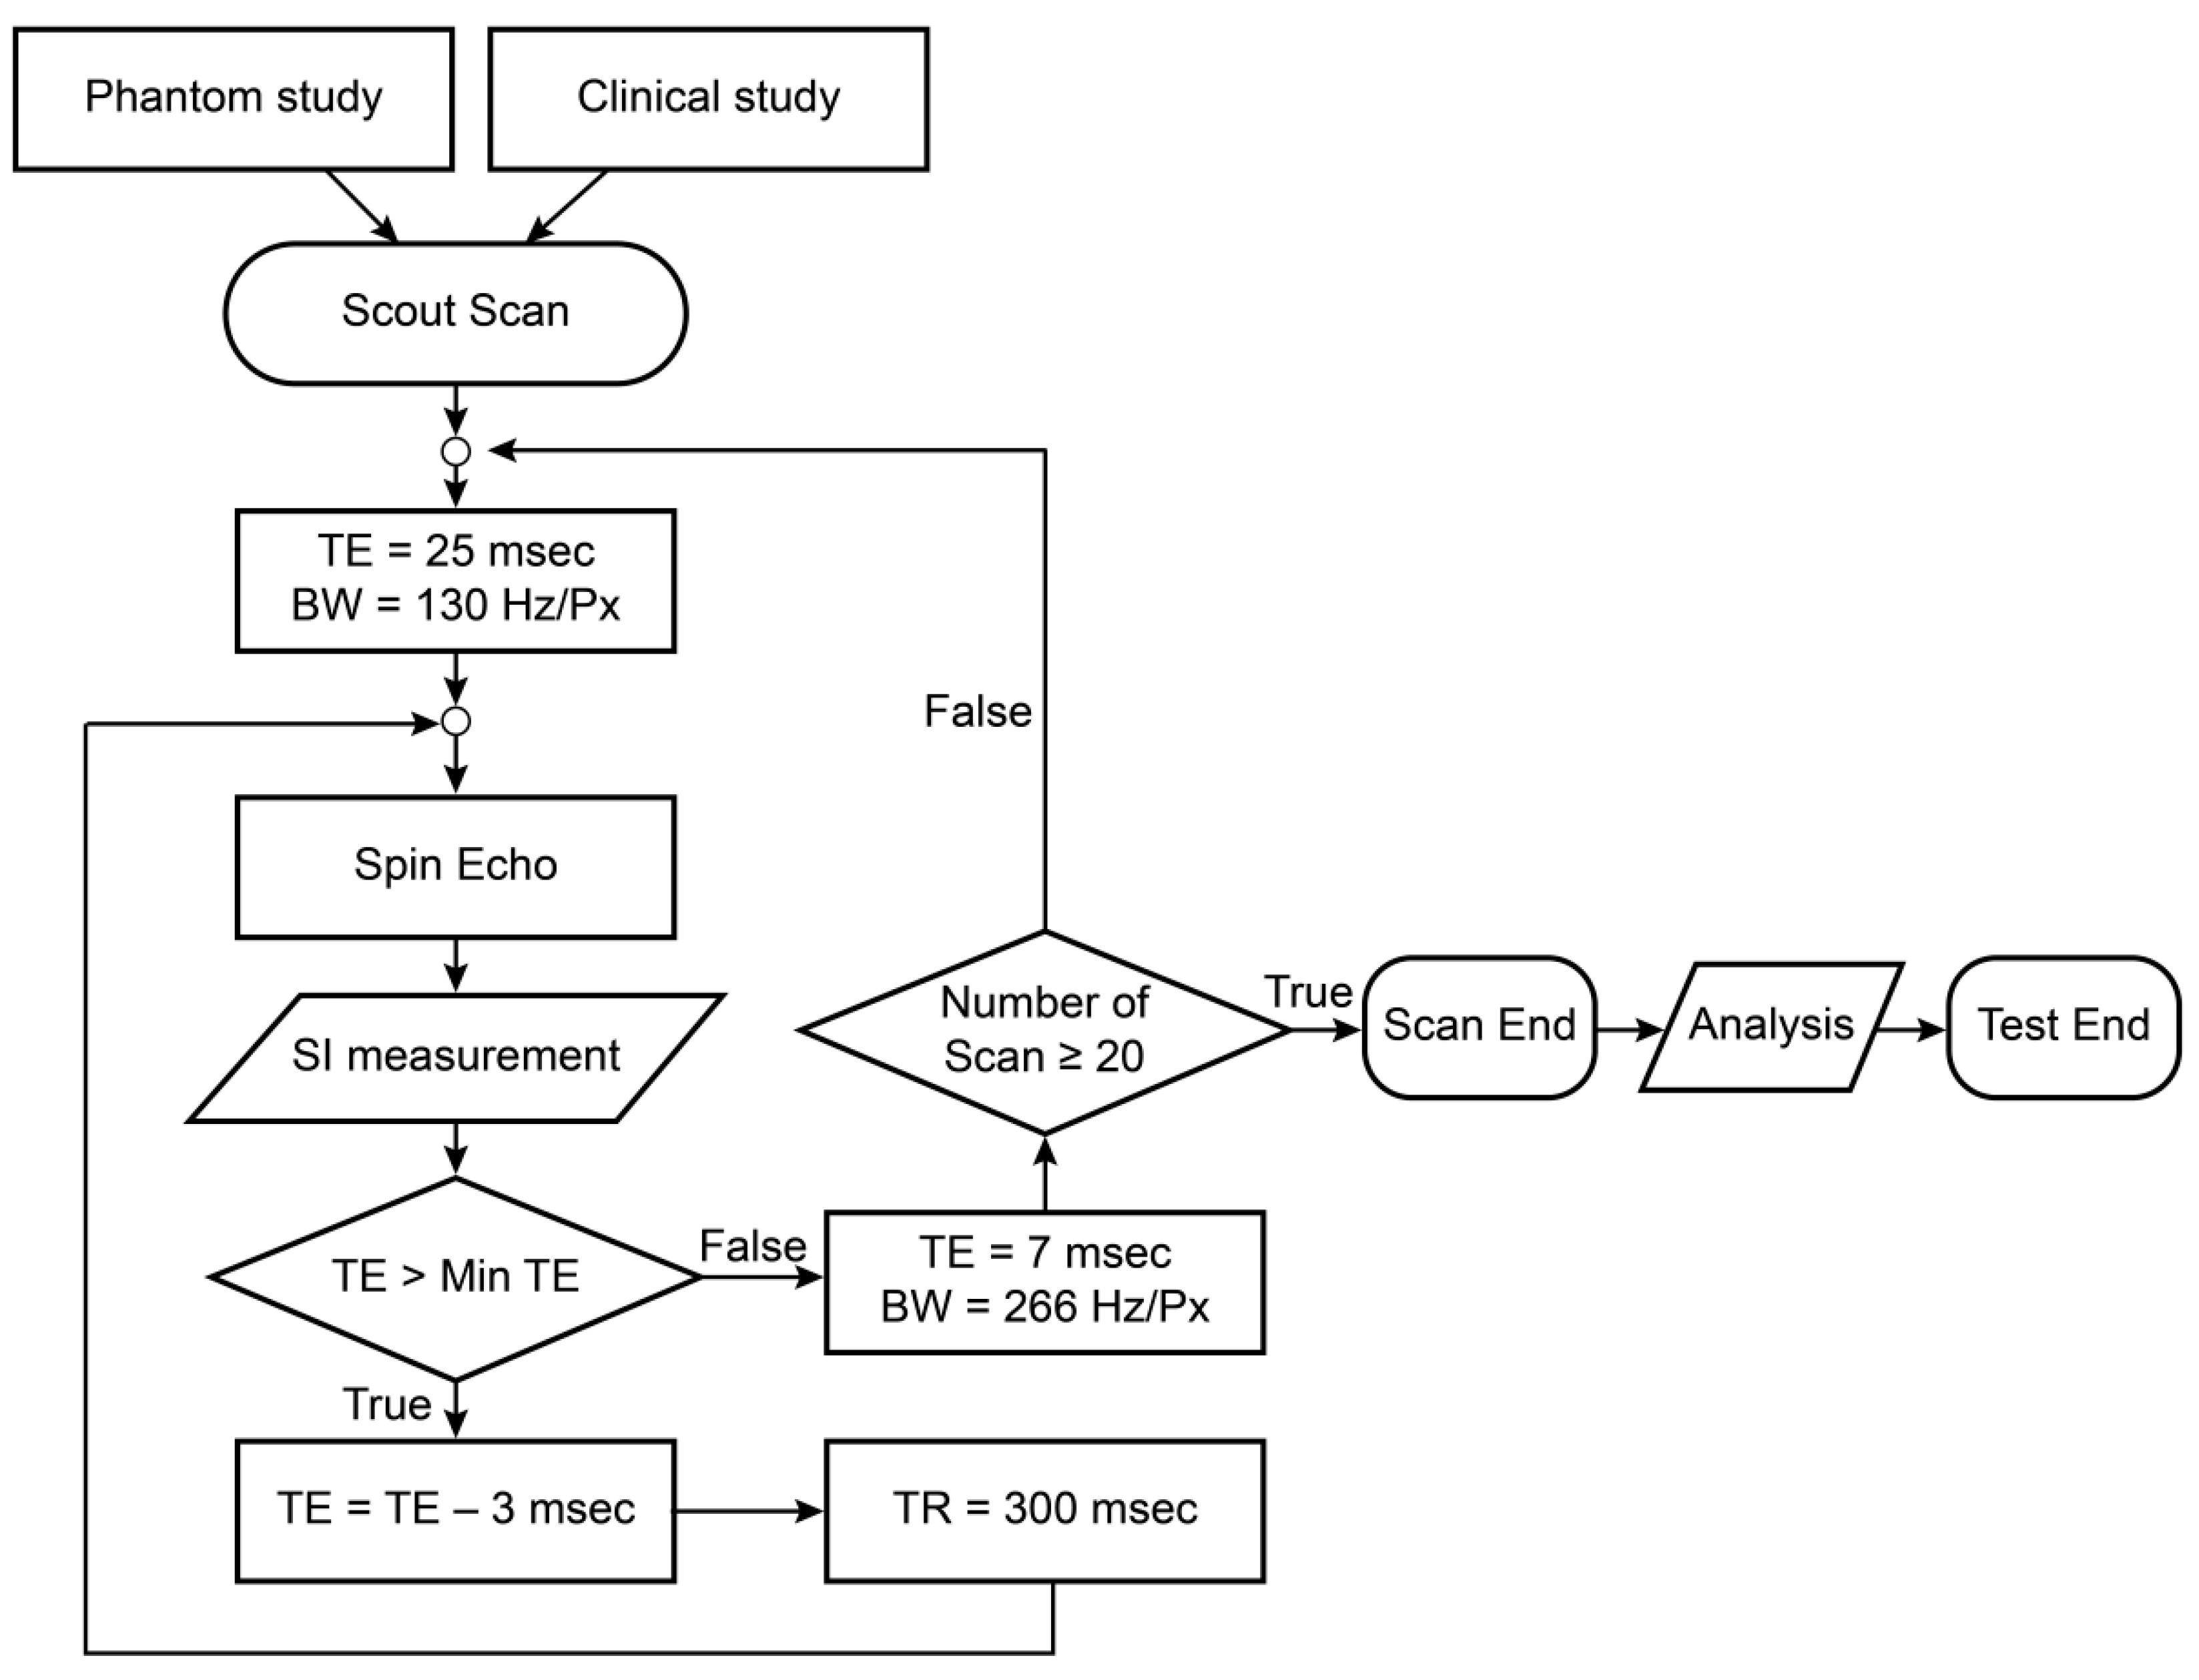
2.1.3. Experimental Procedure
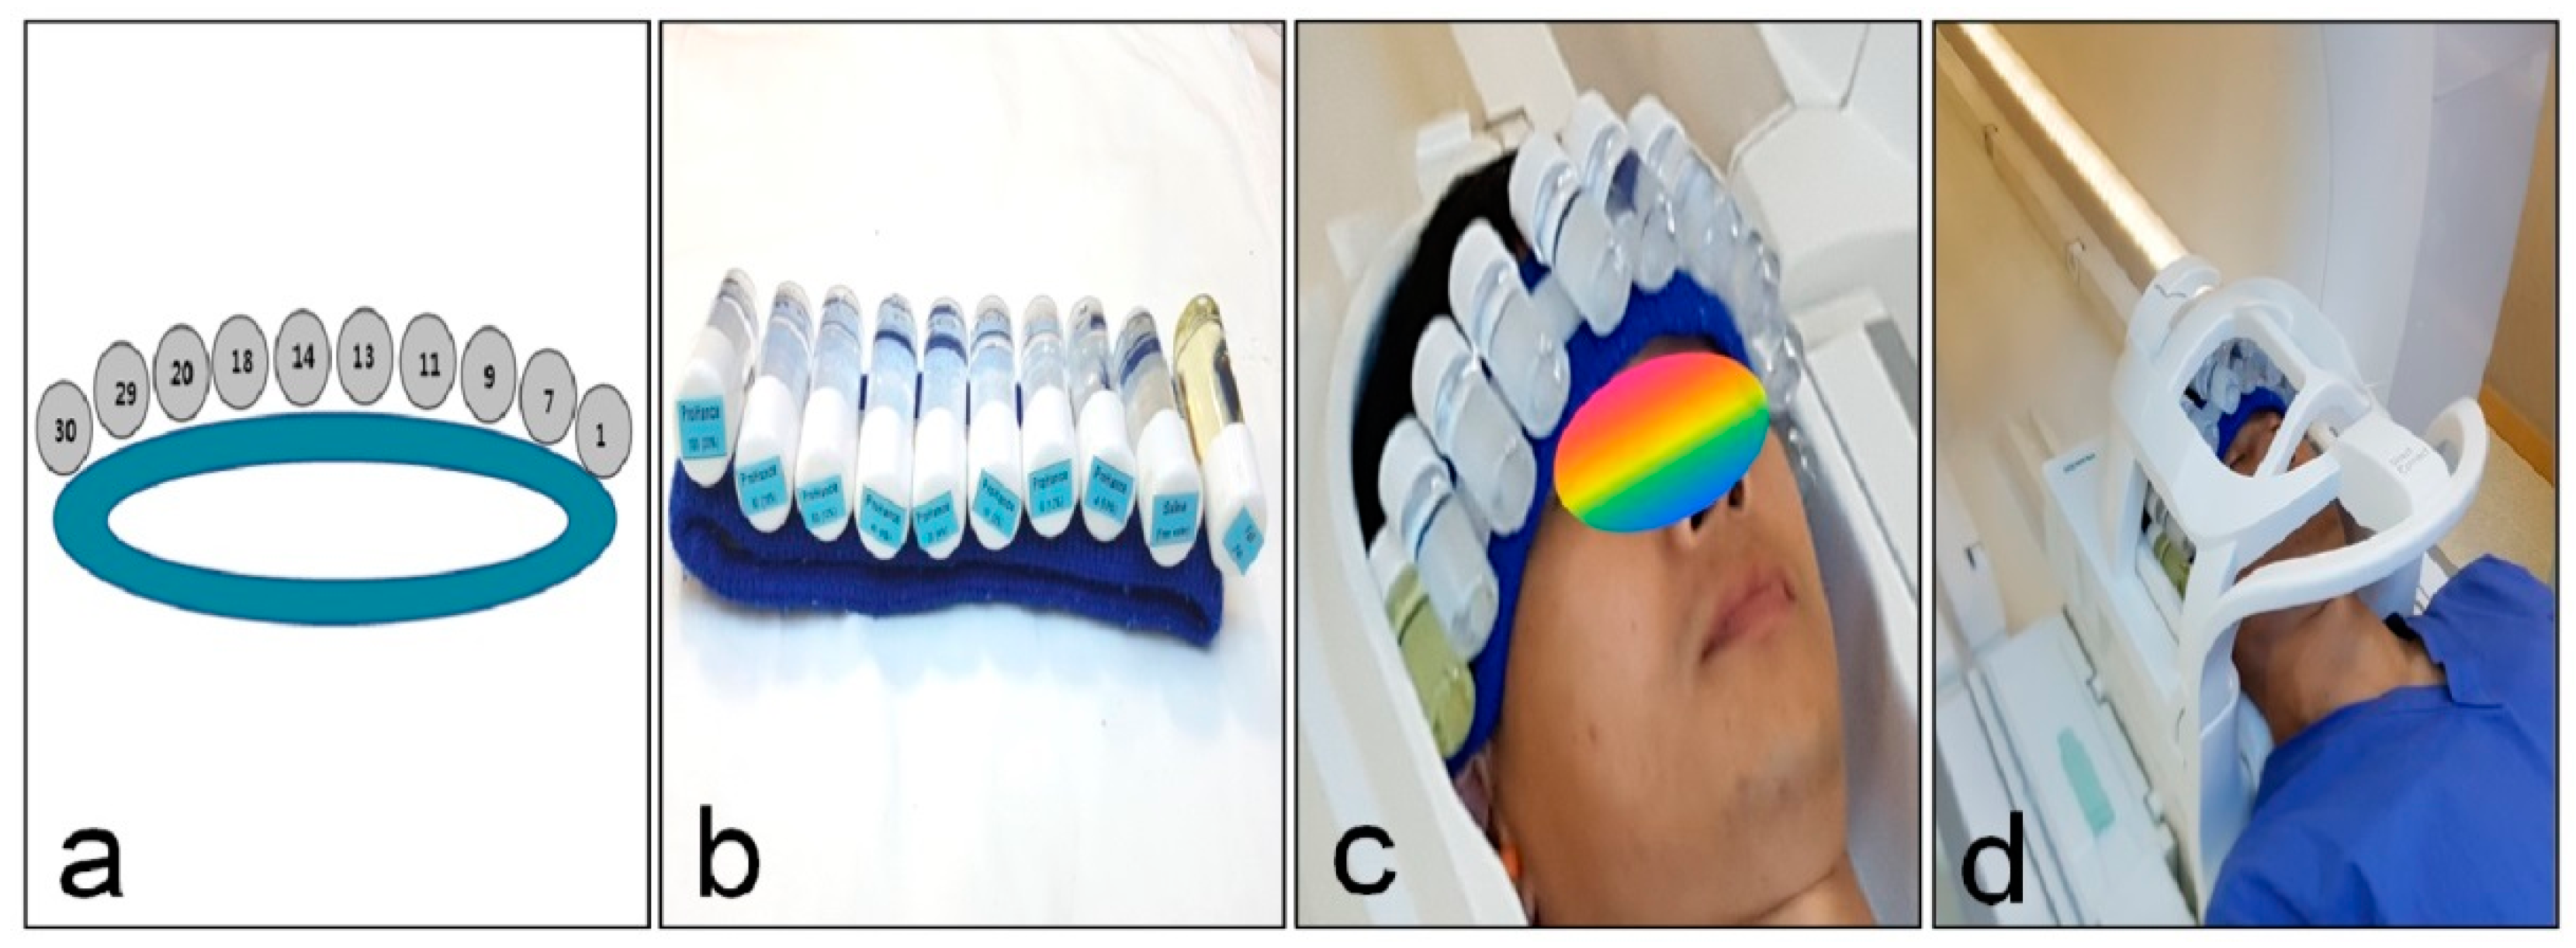
2.2. Clinical Study
2.3. Method of Analysis
2.4. Statistical Analysis
3. Results
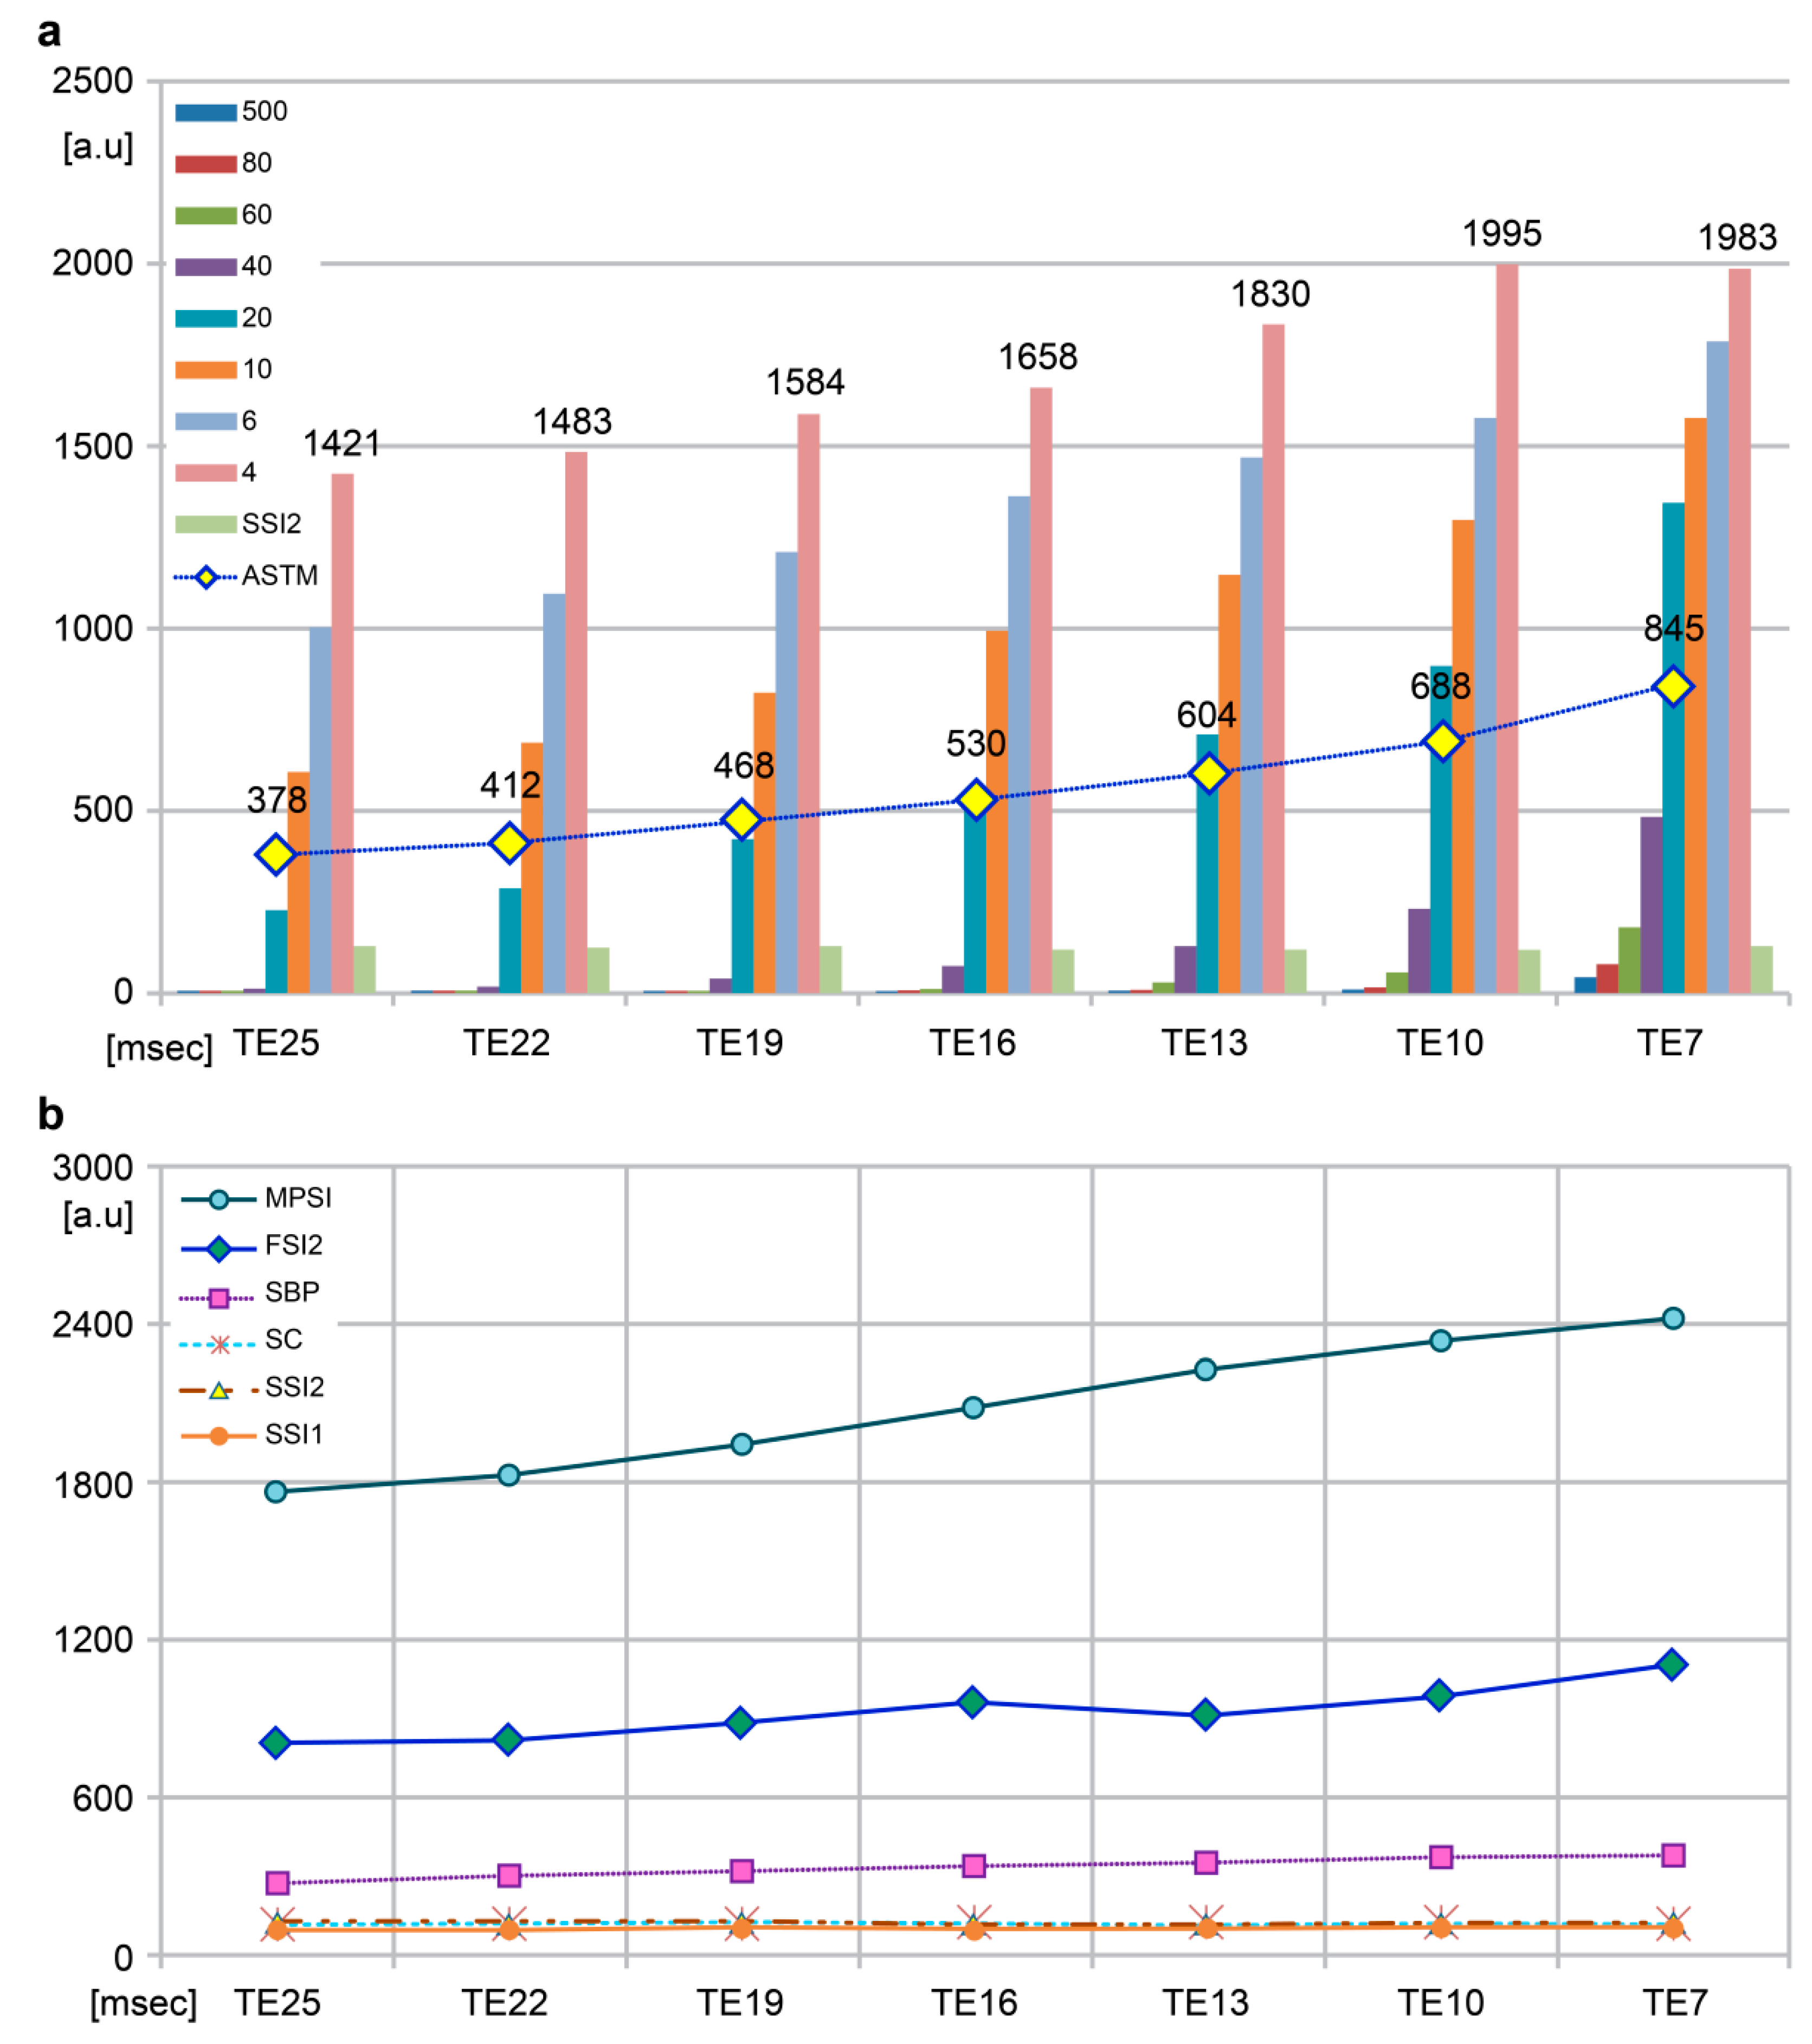
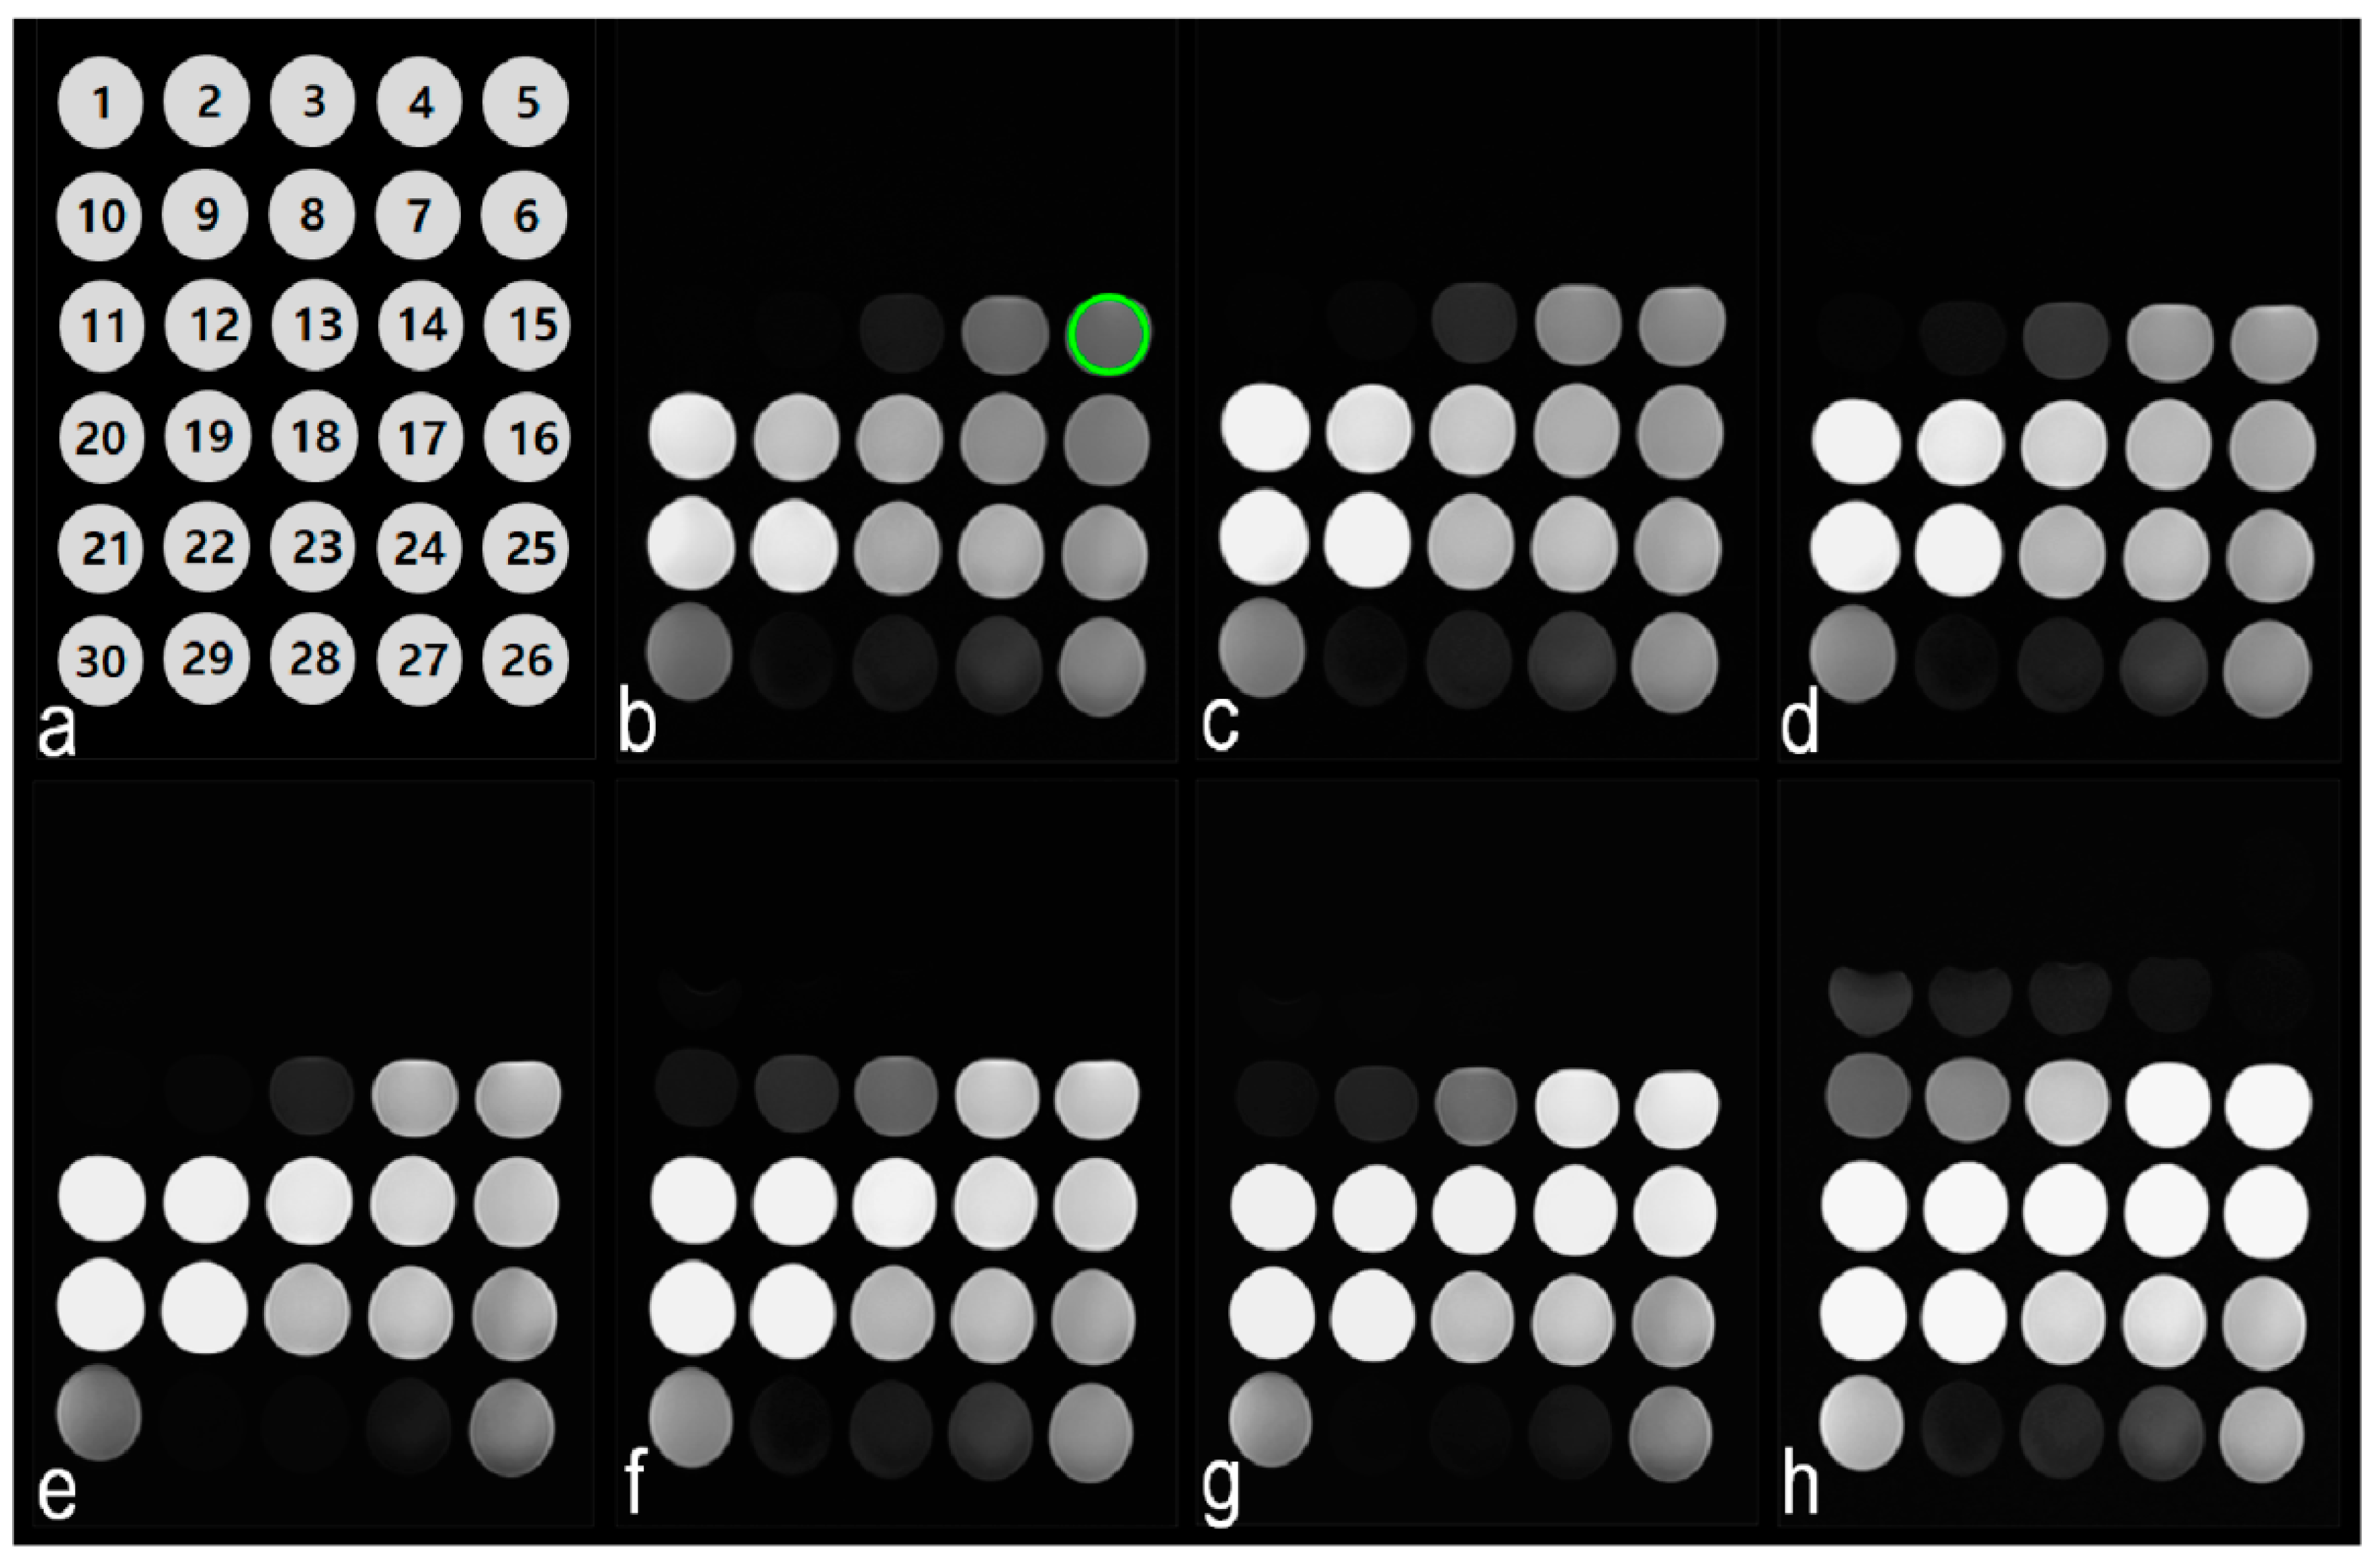
3.1. Phantom Study
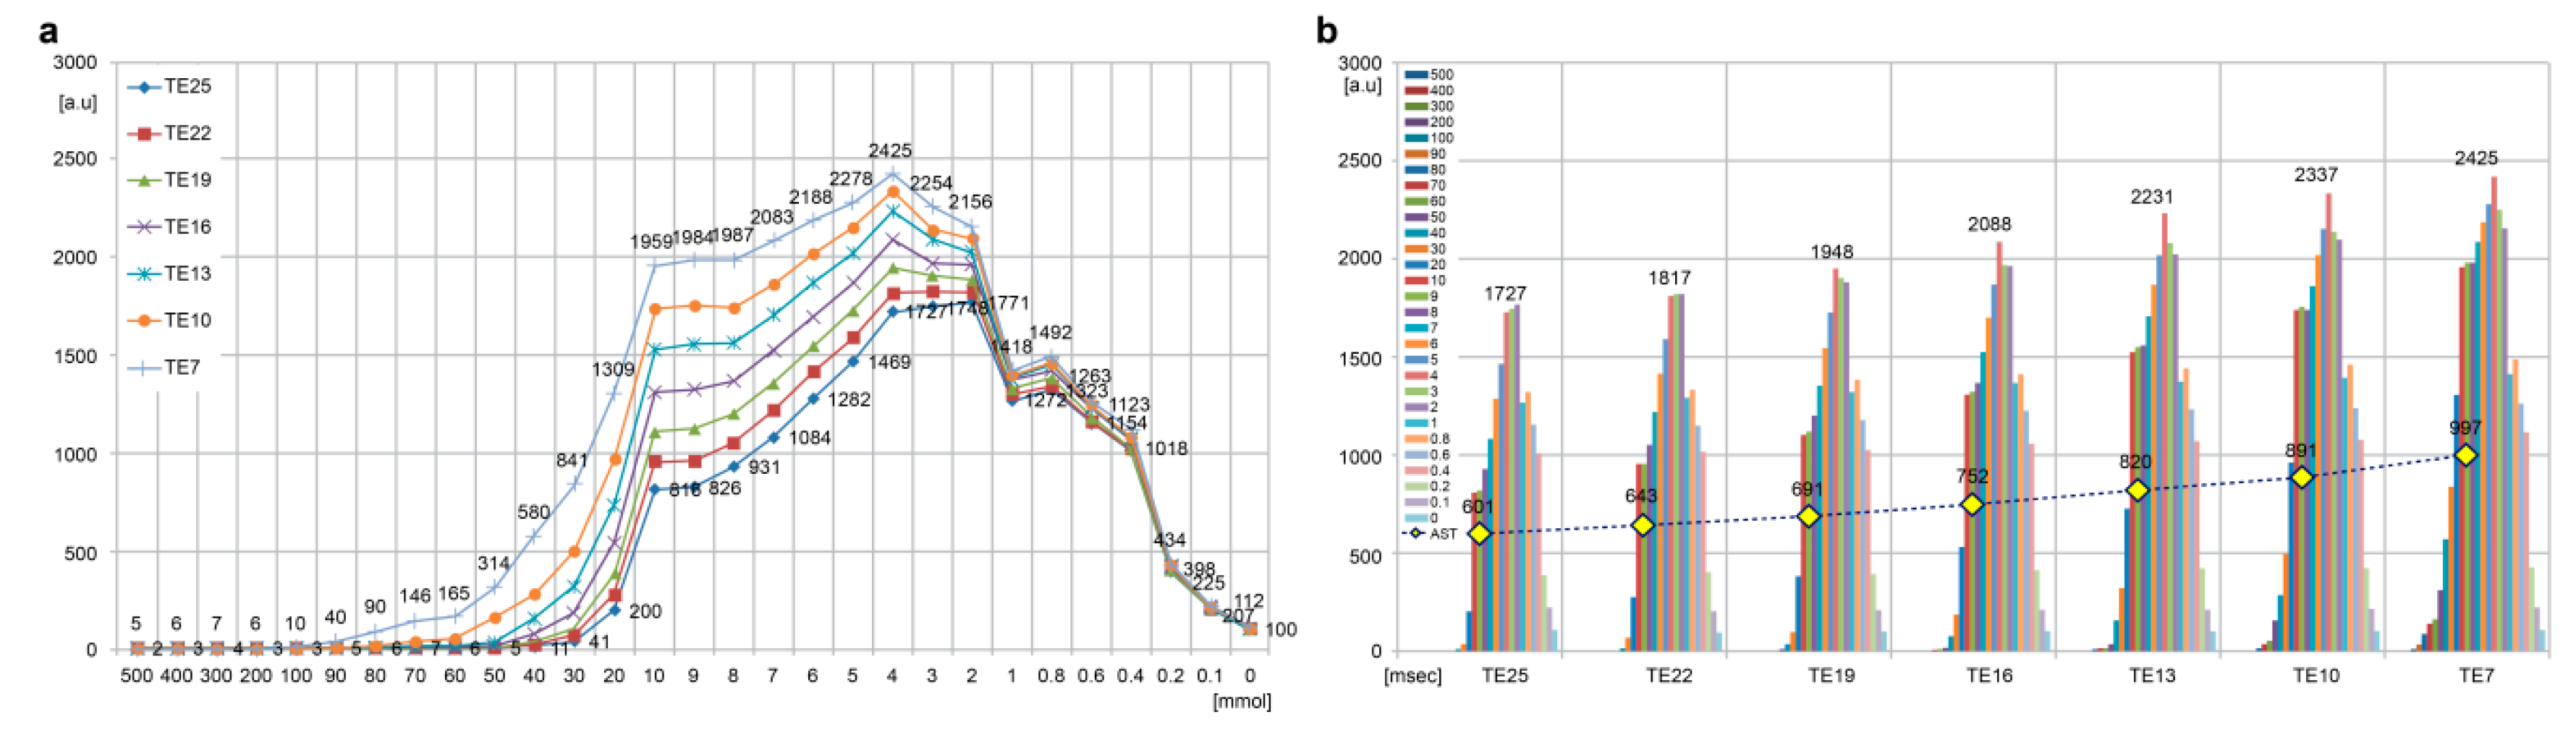
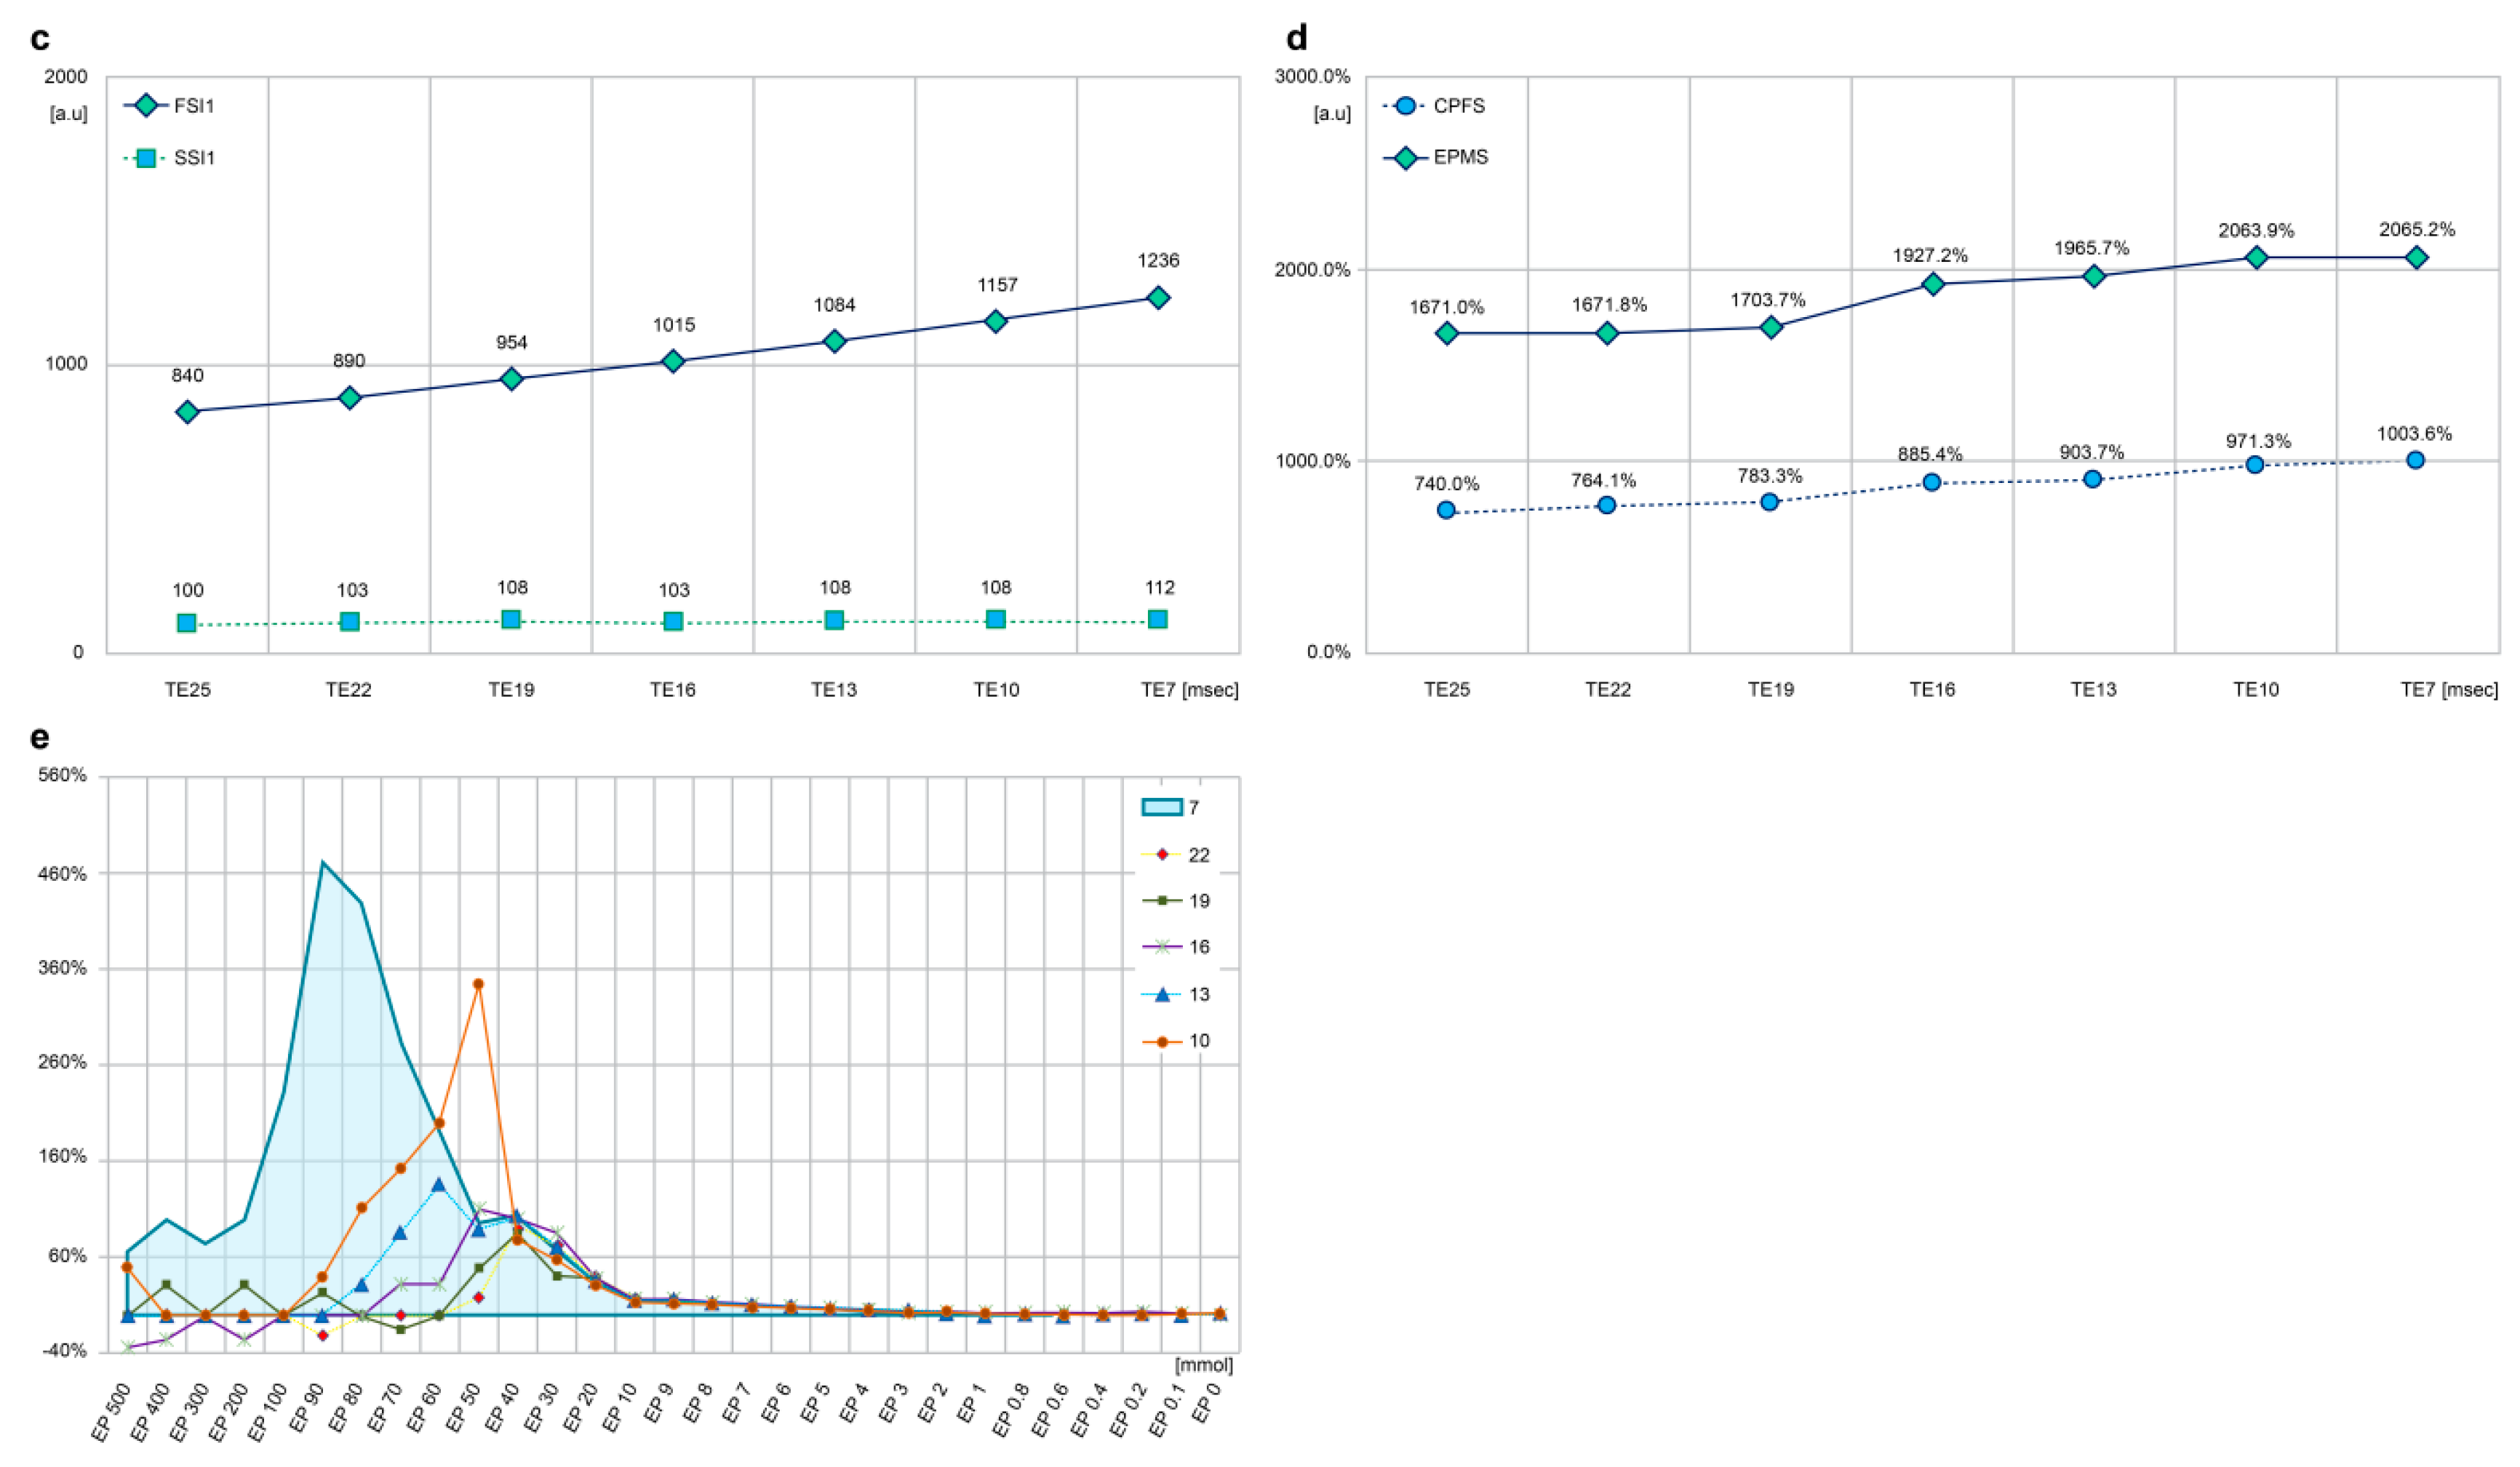
3.2. Changes in GBCA SI
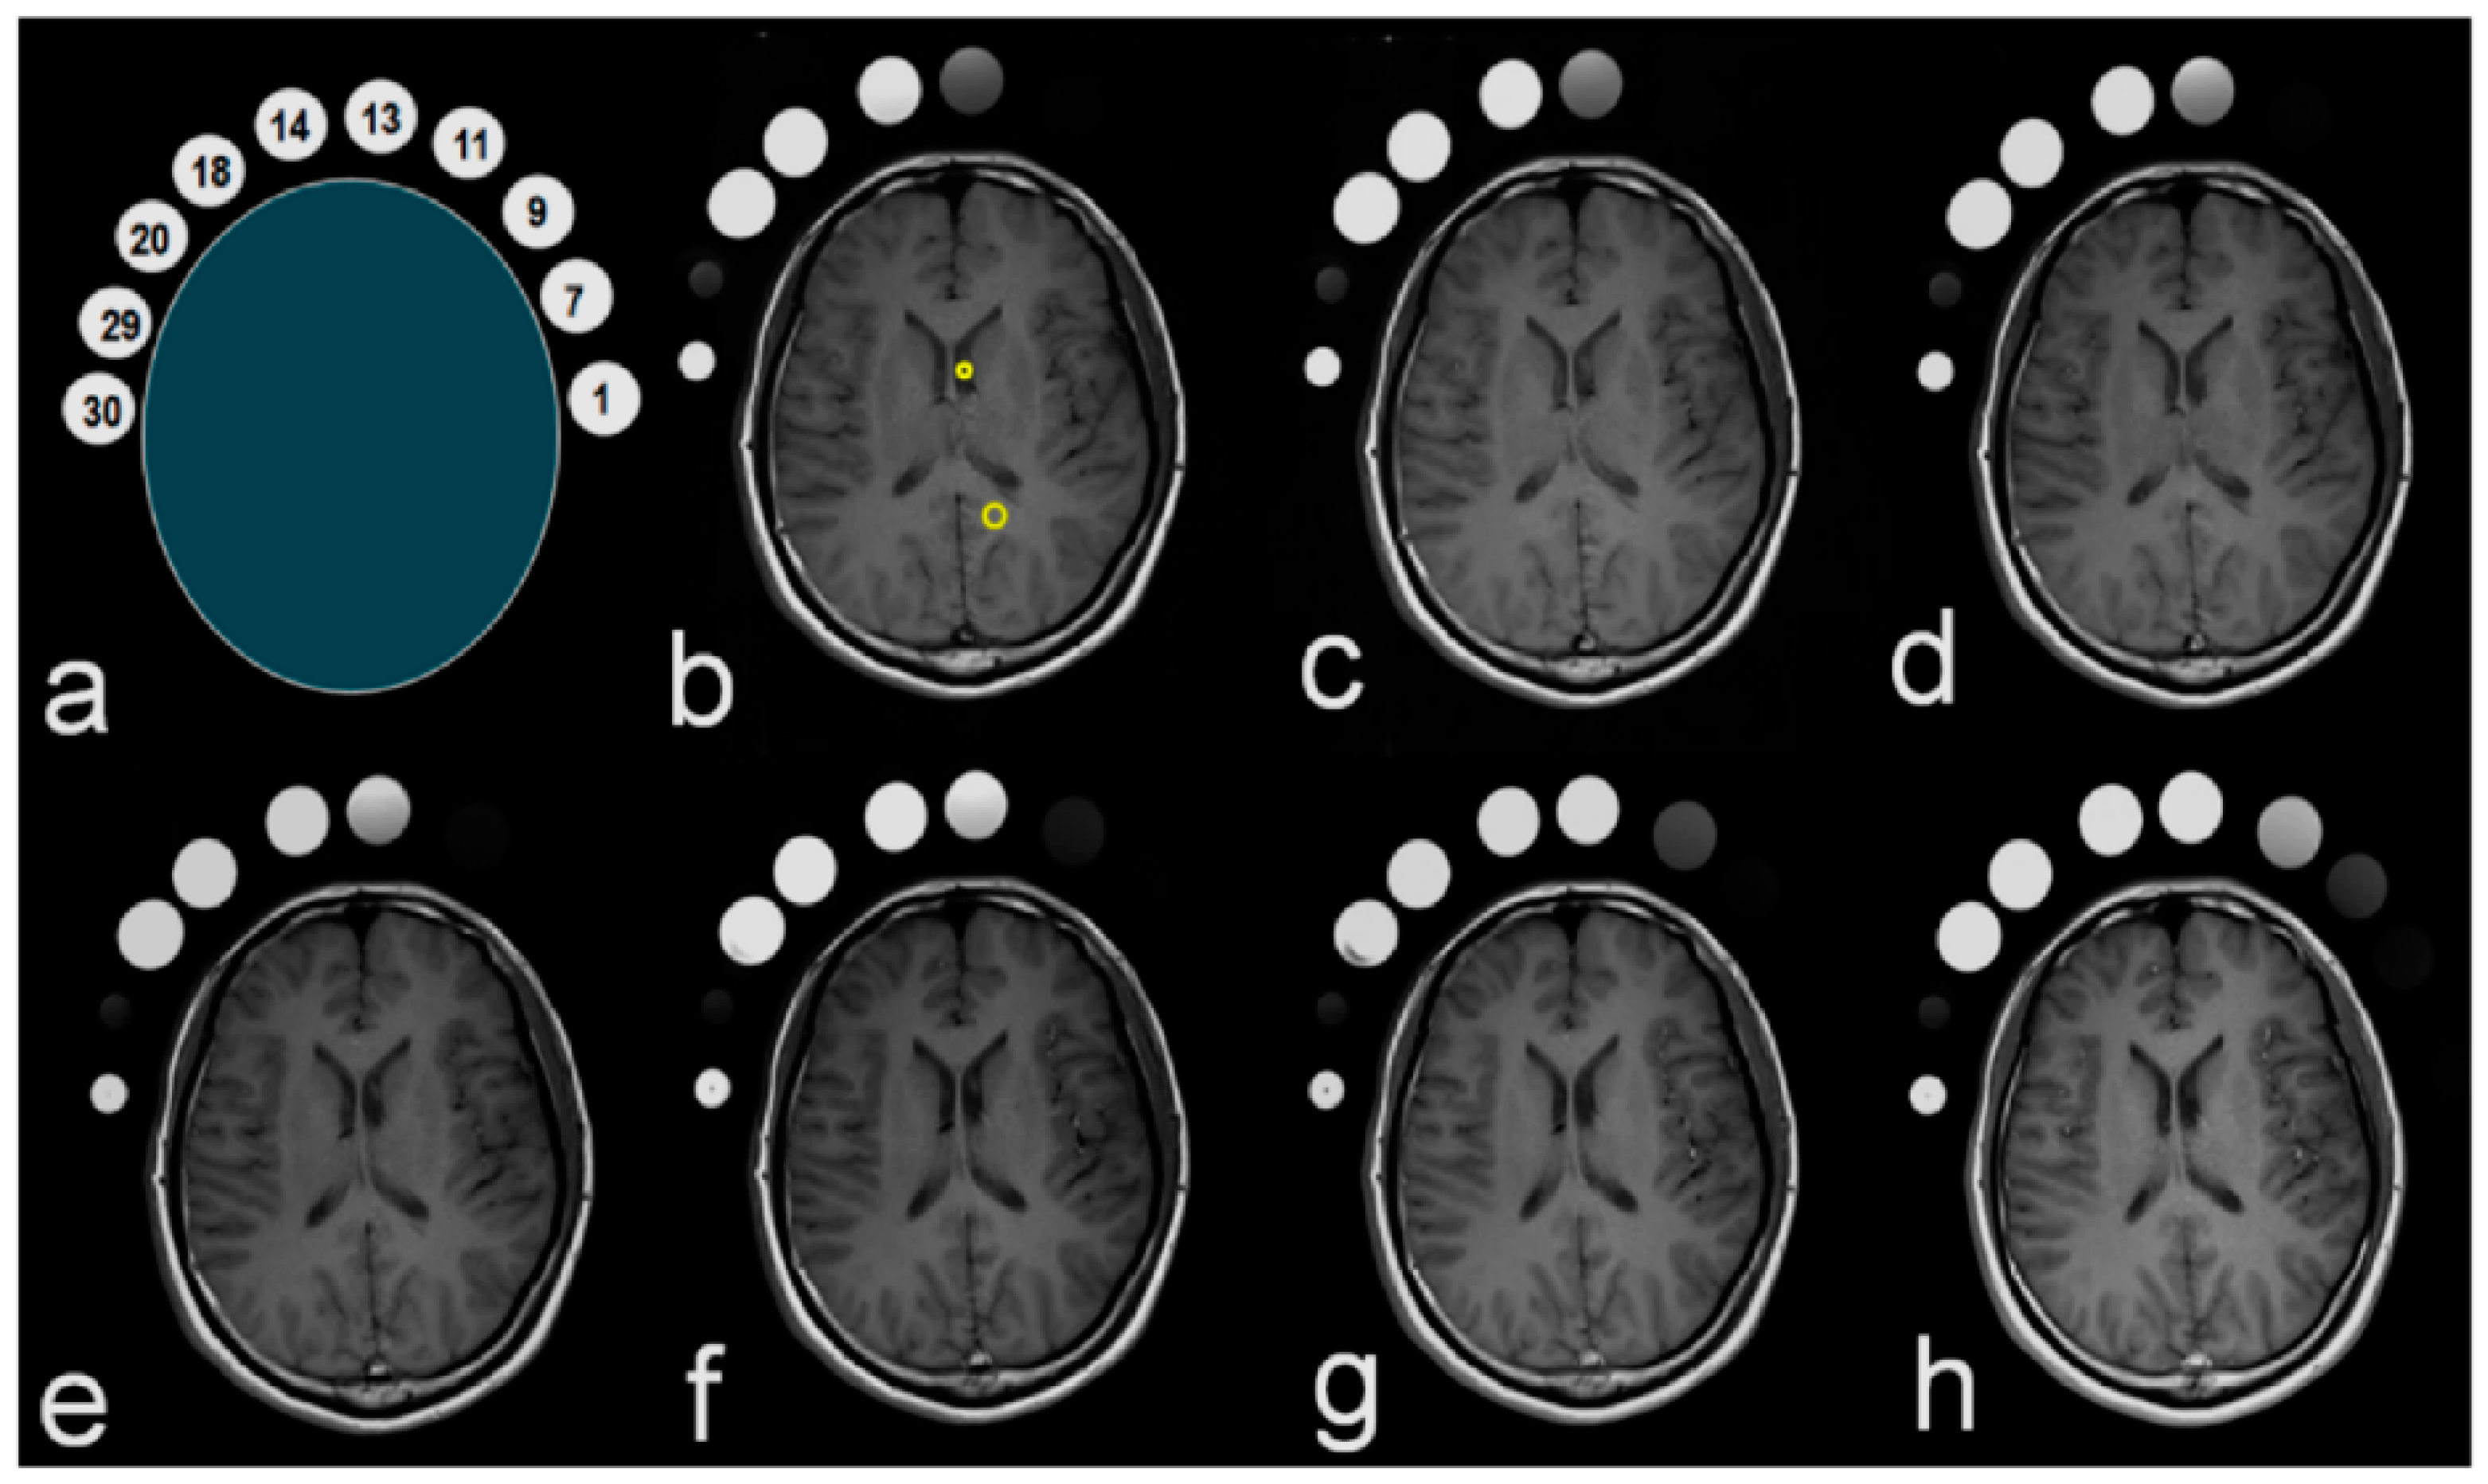
3.3. Clinical Study
4. Discussion
5. Conclusions
Author Contributions
Funding
Conflicts of Interest
References
- Hagberg, G.E.; Scheffler, K. Effect of r1 and r2 relaxivity of gadolinium-based contrast agents on the T1-weighted MR signal at increasing magnetic field strengths. Contrast Media Mol. Imaging 2013, 8, 456–465. [Google Scholar] [CrossRef] [PubMed]
- Seidl, Z.; Vymazal, J.; Mechl, M.; Goyal, M.; Herman, M.; Colosimo, C.; Pasowicz, M.; Yeung, R.; Paraniak-Gieszczyk, B.; Yemen, B.; et al. Does higher gadolinium concentration play a role in the morphologic assessment of brain tumors? Results of a multicenter intraindividual crossover comparison of gadobutrol versus gadobenate dimeglumine (the MERIT Study). AJNR Am. J. Neuroradiol. 2012, 33, 1050–1058. [Google Scholar] [CrossRef] [PubMed]
- Bloembergen, N.; Purcell, E.M.; Pound, R.V. Relaxation effects in nuclear magnetic resonance absorption. Phys. Rev. 1948, 73, 679. [Google Scholar] [CrossRef]
- Bloembergen, N. Proton relaxation times in paramagnetic solution. J. Chem. Phys. 1957, 27, 572. [Google Scholar] [CrossRef]
- Just, M.; Thelen, M. Tissue characterization with t1, t2, and proton density values: results in 160 patients with brain tumors. Radiology 1988, 169, 779–785. [Google Scholar] [CrossRef] [PubMed]
- Maravilla, K.R.; Smith, M.P.; Vymazal, J.; Goyal, M.; Herman, M.; Baima, J.J.; Babbel, R.; Vaneckova, M.; Žižka, J.; Colosimo, C.; et al. Are there differences between macrocyclic gadolinium contrast agents for brain tumor imaging? Results of a multicenter intraindividual crossover comparison of gadobutrol with gadoteridol (the TRUTH study). AJNR Am. J. Neuroradiol. 2015, 36, 14–23. [Google Scholar] [CrossRef] [PubMed]
- Maravilla, K.R.; San-Juan, D.; Kim, S.J.; Elizondo-Riojas, G.; Fink, J.R.; Escobar, W.; Bag, A.; Roberts, D.R.; Hao, J.; Pitrou, C.; et al. Comparison of gadoterate meglumine and gadobutrol in the MRI diagnosis of primary brain tumors: A double-blind randomized controlled intraindividual crossover study (the REMIND study). AJNR Am. J. Neuroradiol. 2017, 38, 1681–1688. [Google Scholar] [CrossRef] [PubMed]
- Van Walderveen, M.A.A.; Barkhof, F.; Hommes, O.R.; Polman, C.H.; Tobi, H.; Frequin, S.T.; Valk, J. Correlating MRI and clinical disease activity in multiple sclerosis: relevance of hypointense lesions on short-TR/short-TE (T1-weighted) spin-echo images. Neurology 1995, 45, 1684–1690. [Google Scholar] [CrossRef] [PubMed]
- Shen, W.C.; Cheng, T.Y.; Lee, S.K.; Ho, Y.J.; Lee, K.R. Disseminated tuberculomas in spinal cord and brain demonstrated by MRI with gadolinium-DTPA. Neuroradiology 1993, 35, 213–215. [Google Scholar] [CrossRef] [PubMed]
- Owen, N.J.; Sohaib, S.A.; Peppercorn, P.D.; Monson, J.P.; Grossman, A.B.; Besser, G.M.; Reznek, R.H. MRI of pancreatic neuroendocrine tumours. Br. J. Radiol. 2001, 74, 968–973. [Google Scholar] [CrossRef] [PubMed]
- Thomsen, H.S.; Morcos, S.K.; Almen, T.; Bellin, M.F.; Bertolotto, M.; Bongartz, G.; Clement, O.; Leander, P.; Heinz-Peer, G.; Reimer, P.; et al. Nephrogenic systemic fibrosis and gadolinium-based contrast media: updated ESUR Contrast Medium Safety Committee guidelines. Eur. Radiol. 2013, 23, 307–318. [Google Scholar] [CrossRef] [PubMed]


| No. | Saline (mL) | GBCA (mL) | Gadoteridol (mmol) | Dilution Rate (%) | No. | Saline (mL) | GBCA (mL) | Gadoteridol (mmol) | Dilution Rate (%) |
|---|---|---|---|---|---|---|---|---|---|
| 1 | 0.00 | 30 | 500 | 100 | 16 | 29.52 | 0.48 | 8 | 1.60 |
| 2 | 6.00 | 24 | 400 | 80 | 17 | 29.58 | 0.42 | 7 | 1.40 |
| 3 | 12.00 | 18 | 300 | 60 | 18 | 29.64 | 0.36 | 6 | 1.20 |
| 4 | 18.00 | 12 | 200 | 40 | 19 | 29.70 | 0.3 | 5 | 1.00 |
| 5 | 24.00 | 6 | 100 | 20 | 20 | 29.76 | 0.24 | 4 | 0.80 |
| 6 | 24.60 | 5.4 | 90 | 18 | 21 | 29.82 | 0.18 | 3 | 0.60 |
| 7 | 25.20 | 4.8 | 80 | 16 | 22 | 29.88 | 0.12 | 2 | 0.40 |
| 8 | 25.80 | 4.2 | 70 | 14 | 23 | 29.94 | 0.06 | 1 | 0.20 |
| 9 | 26.40 | 3.6 | 60 | 12 | 24 | 29.95 | 0.048 | 0.8 | 0.16 |
| 10 | 27.00 | 3 | 50 | 10 | 25 | 29.96 | 0.036 | 0.6 | 0.12 |
| 11 | 27.60 | 2.4 | 40 | 8 | 26 | 29.97 | 0.024 | 0.4 | 0.08 |
| 12 | 28.20 | 1.8 | 30 | 6 | 27 | 29.98 | 0.012 | 0.2 | 0.04 |
| 13 | 28.80 | 1.2 | 20 | 4 | 28 | 29.99 | 0.006 | 0.1 | 0.02 |
| 14 | 29.40 | 0.6 | 10 | 2 | 29 | 30.00 | 0 | 0 | 0.00 |
| 15 | 29.50 | 0.54 | 9 | 1.80 | 30 | fat |
| Unit | 1st | 2nd | 3rd | 4th | 5th | 6th | 7th | |
|---|---|---|---|---|---|---|---|---|
| Sequence | SE | SE | SE | SE | SE | SE | SE | |
| TE | msec | 25 | 22 | 19 | 16 | 13 | 10 | 7 |
| TR | msec | 300 | 300 | 300 | 300 | 300 | 300 | 300 |
| FOV | mm | 240 | 240 | 240 | 240 | 240 | 240 | 240 |
| Thickness | mm | 5 | 5 | 5 | 5 | 5 | 5 | 5 |
| Flip Angle | ° | 50 | 50 | 50 | 50 | 50 | 50 | 50 |
| Average | 1 | 1 | 1 | 1 | 1 | 1 | 1 | |
| BW | Hz/Px | 130 | 130 | 130 | 130 | 130 | 130 | 130 |
| Acquisition Time | 2:11 | 2:11 | 2:11 | 2:11 | 2:11 | 2:11 | 2:11 |
| TE | msec | 25 | 22 | 19 | 16 | 13 | 10 | 7 |
| SSI1 | [a.u] | 100 | 103 | 108 | 103 | 108 | 108 | 112 |
| FSI1 | [a.u] | 840 | 890 | 954 | 1015 | 1084 | 1157 | 1236 |
| CPFS | % | 740.0 | 764.1 | 783.3 | 885.4 | 903.7 | 971.3 | 1003.6 |
| RSP | mmol | 30 | 30 | 30 | 40 | 40 | 60 | 90 |
| % | 6 | 6 | 6 | 8 | 8 | 12 | 18 | |
| MPSI | [a.u] | 1771 | 1825 | 1948 | 2088 | 2231 | 2337 | 2425 |
| MPP | mmol | 2 | 3 | 4 | 4 | 4 | 4 | 4 |
| % | 0.4 | 0.6 | 0.8 | 0.8 | 0.8 | 0.8 | 0.8 | |
| EPMS | % | 1671.0 | 1671.8 | 1703.7 | 1927.2 | 1965.7 | 2063.9 | 2065.2 |
| AST | [a.u] | 600.8 | 642.5 | 690.9 | 751.9 | 820.2 | 891.3 | 996.6 |
| Factor (mmol, %) | 22 | 19 | 16 | 13 | 10 | 7 | ||
| EP 500 | 50.5 | 0.0 | −33.3 | 0.0 | 50.0 | 66.7 | ||
| EP 400 | 0.0 | 33.3 | −25.0 | 0.0 | 0.0 | 100.0 | ||
| EP 300 | 0.0 | 0.0 | 0.0 | 0.0 | 0.0 | 75.0 | ||
| EP 200 | 0.0 | 33.3 | −25.0 | 0.0 | 0.0 | 100.0 | ||
| EP 100 | 0.0 | 0.0 | 0.0 | 0.0 | 0.0 | 233.3 | ||
| EP 90 | −20.0 | 25.0 | 0.0 | 0.0 | 40.0 | 471.4 | ||
| EP 80 | 0.0 | 0.0 | 0.0 | 33.3 | 112.5 | 429.4 | ||
| EP 70 | 0.0 | −14.3 | 33.3 | 87.5 | 153.3 | 284.2 | ||
| EP 60 | 0.0 | 0.0 | 33.3 | 137.5 | 200.0 | 189.5 | ||
| EP 50 | 20.0 | 50.0 | 111.1 | 89.5 | 344.4 | 96.3 | ||
| EP 40 | 90.9 | 85.7 | 100 | 103.8 | 78.6 | 104.2 | ||
| EP 30 | 73.2 | 40.8 | 86.0 | 71.5 | 58.3 | 66.5 | ||
| EP 20 | 40.0 | 38.2 | 39.3 | 36.4 | 32.0 | 34.9 | ||
| EP 10 | 17.8 | 15.7 | 18.0 | 16.3 | 14.0 | 12.7 | ||
| EP 9 | 16.6 | 16.8 | 17.6 | 17.5 | 12.9 | 13.0 | ||
| EP 8 | 13.5 | 13.9 | 13.7 | 14.1 | 11.6 | 14.0 | ||
| EP 7 | 12.6 | 11.4 | 12.1 | 11.9 | 9.3 | 11.7 | ||
| EP 6 | 10.7 | 9.2 | 9.6 | 10.1 | 7.9 | 8.4 | ||
| EP 5 | 8.4 | 8.7 | 8.0 | 8.1 | 6.5 | 5.9 | ||
| EP 4 | 5.2 | 7.2 | 7.2 | 6.8 | 4.8 | 3.8 | ||
| EP 3 | 4.4 | 4.5 | 3.3 | 6.0 | 2.5 | 5.3 | ||
| EP 2 | 2.9 | 3.6 | 4.1 | 3.2 | 3.5 | 2.9 | ||
| EP 1 | 2.2 | 2.2 | 3.5 | 0.4 | 1.4 | 1.3 | ||
| EP 0.8 | 1.4 | 3.1 | 2.8 | 1.8 | 1.1 | 1.9 | ||
| EP 0.6 | 0.3 | 2.2 | 3.7 | 0.6 | 0.9 | 1.4 | ||
| EP 0.4 | 0.4 | 0.4 | 3.2 | 1.8 | 0.4 | 3.8 | ||
| EP 0.2 | 3.0 | −1.7 | 4.5 | 1.4 | 0.9 | 0.7 | ||
| EP 0.1 | 0.0 | 1.9 | 2.4 | 0.0 | 1.4 | 2.7 | ||
| EP 0 | 1.0 | 2.0 | 0.0 | 2.9 | 1.9 | 3.7 | ||
| Factor | Unit | Clinical Study | ||||||||
|---|---|---|---|---|---|---|---|---|---|---|
| TE | msec | 25 | 22 | 19 | 16 | 13 | 10 | 7 | F | p-value |
| SSI2 b d e | [a.u.] | 129 | 126 | 129 | 120 | 120 | 121 | 128 | 100.18 | 0.000 |
| FSI2 a c d e | 804 | 819 | 887 | 961 | 911 | 982 | 1106 | |||
| SC b d e | 126 | 125 | 125 | 128 | 124 | 130 | 125 | |||
| SBP a b c e | 278 | 310 | 321 | 342 | 357 | 376 | 389 | |||
| ASTM a b c d | 378 | 412 | 468 | 530 | 604 | 688 | 845 | |||
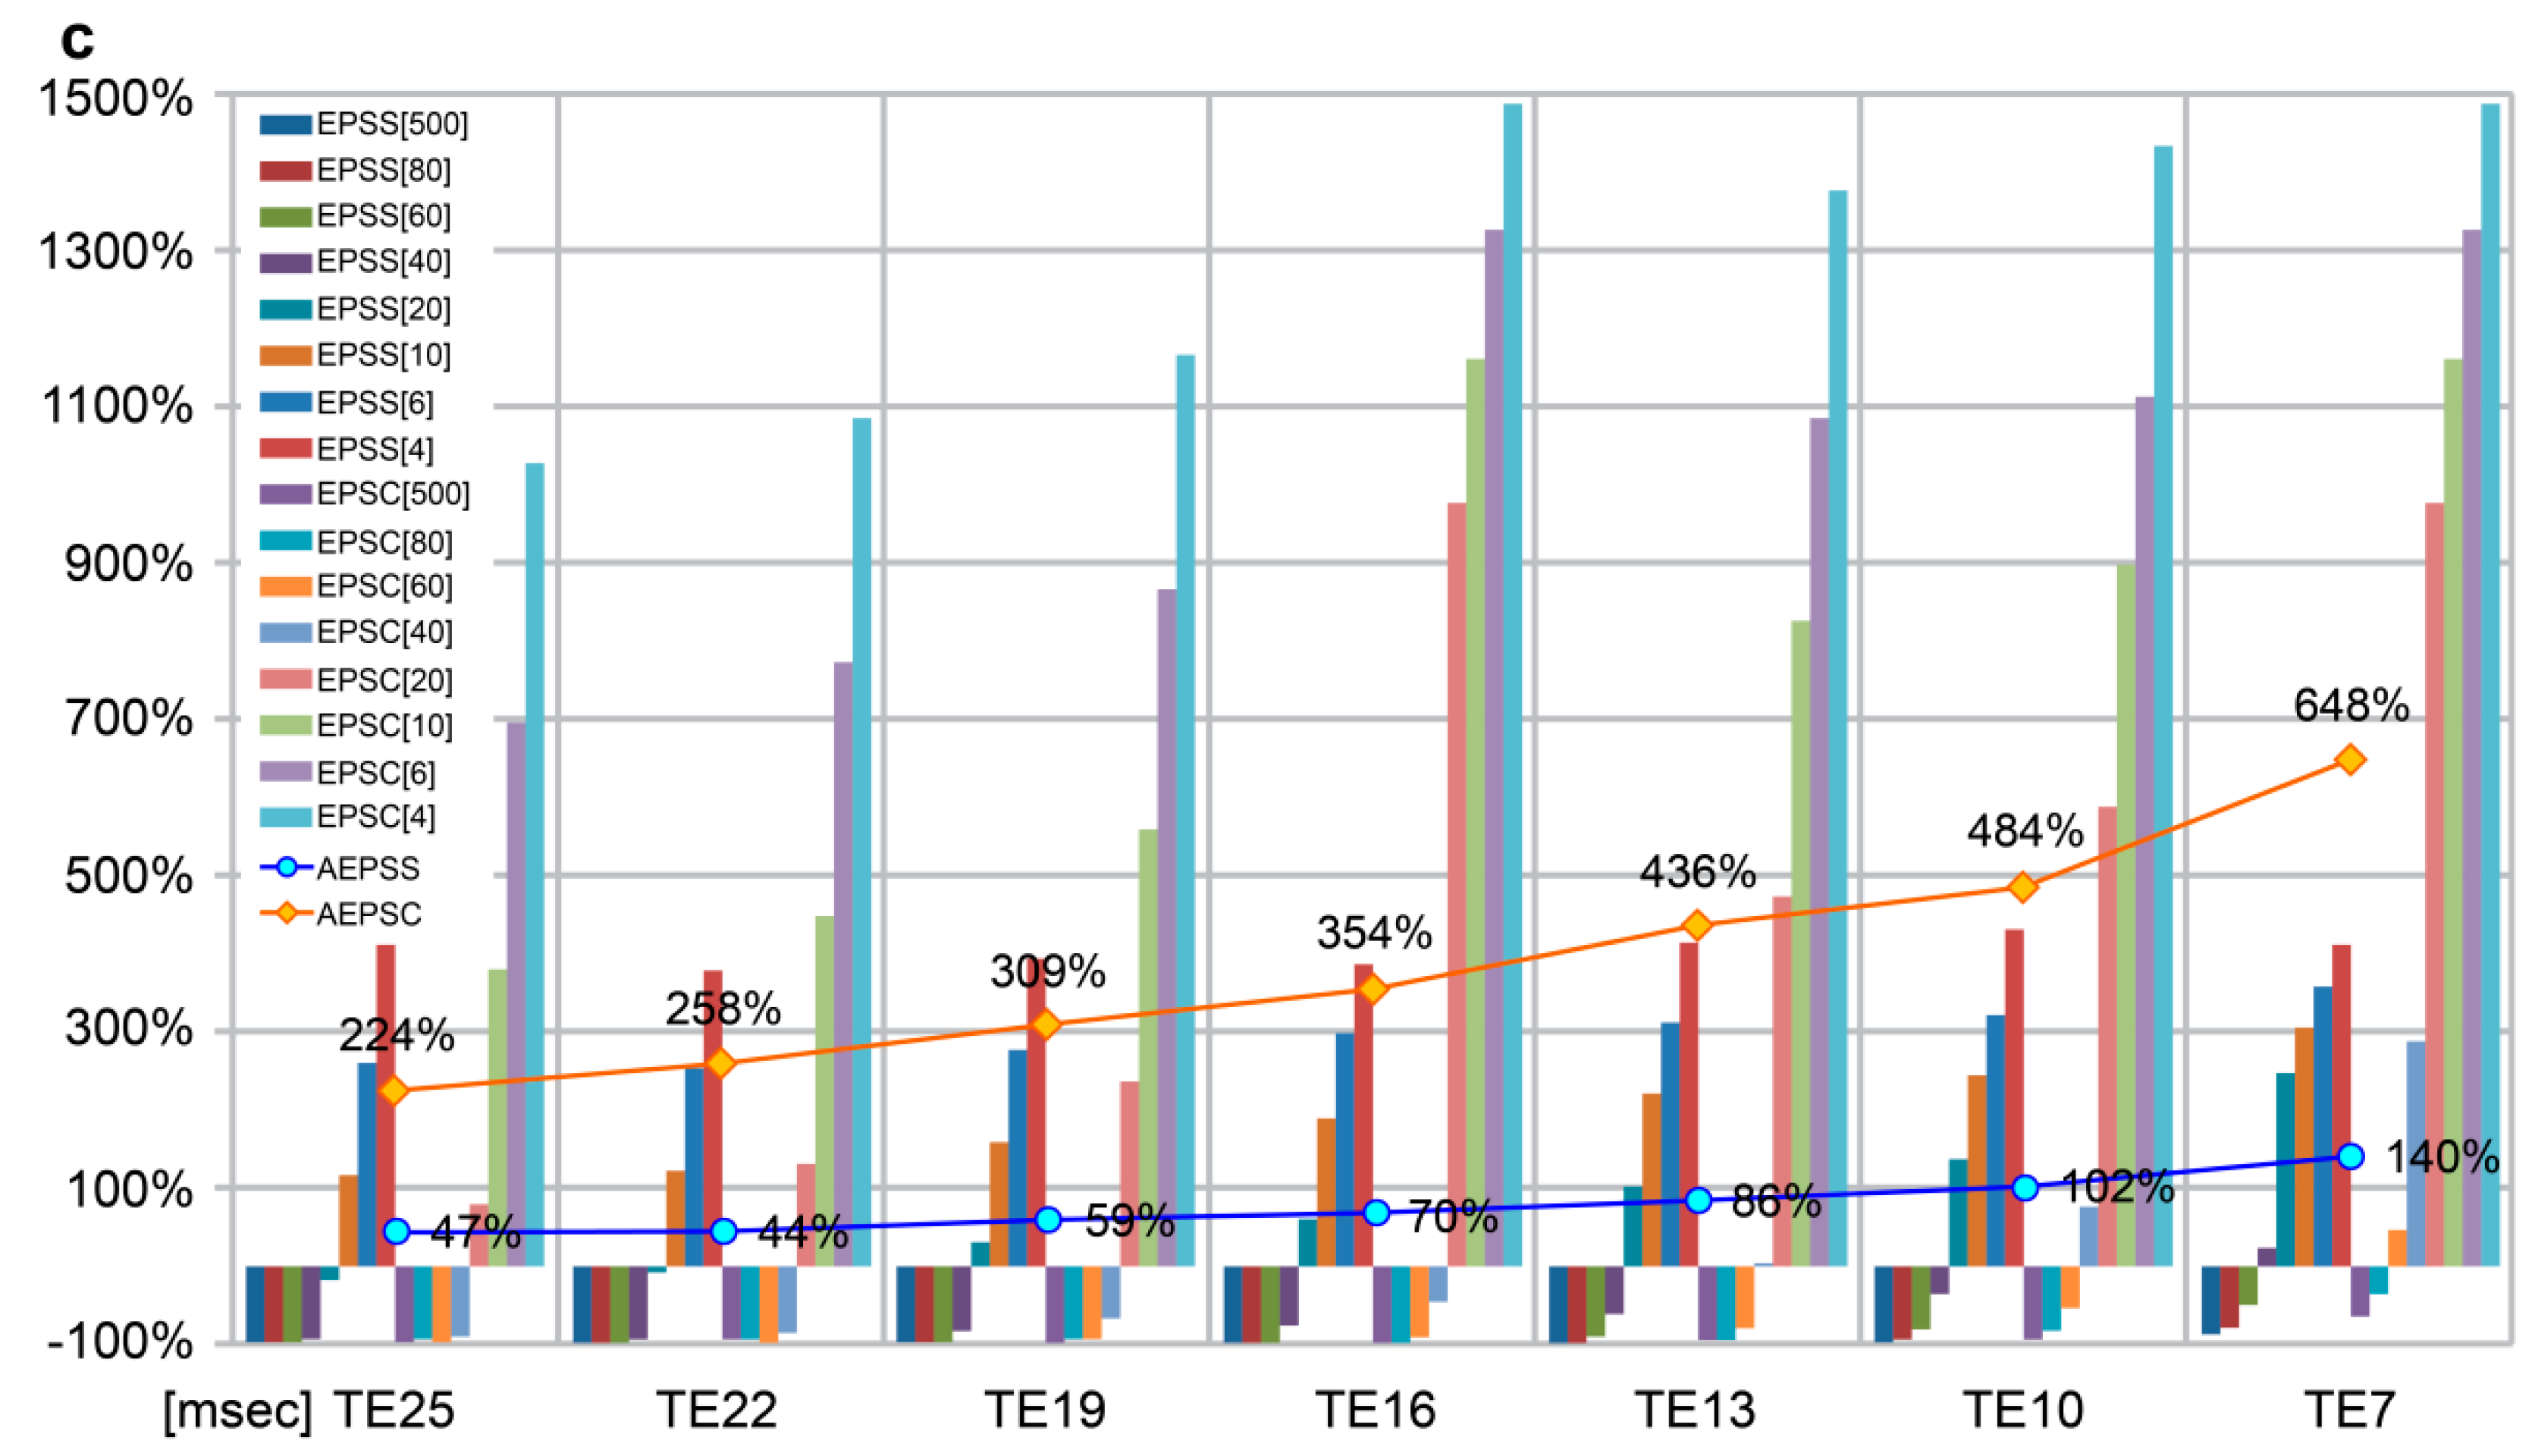
| TE | msec | 25 | 22 | 19 | 16 | 13 | 10 | 7 | Correlation coefficients | p-value |
| EPSS[500] | % | −98.9 | −98.7 | −99.1 | −99.1 | −98.9 | −98.7 | −89.5 | −0.621 | 0.134 |
| EPSS[80] | −98.2 | −98.7 | −98.8 | −99.1 | −98.3 | −95.7 | −79.9 | −0.679 | 0.094 | |
| EPSS[60] | −99.3 | −99.0 | −98.8 | −97.4 | −93.0 | −84.8 | −53.2 | −0.794 | 0.033 * | |
| EPSS[40] | −96.8 | −94.2 | −88.2 | −79.5 | −63.6 | −38.8 | 24.4 | −0.889 | 0.007 * | |
| EPSS[20] | −19.1 | −7.1 | 30.8 | 61.4 | 98.6 | 138.0 | 246.5 | −0.961 | 0.001* | |
| EPSS[10] | 116.5 | 121.3 | 156.7 | 190.9 | 220.4 | 244.9 | 305.4 | −0.984 | 0.000 * | |
| EPSS[6] | 260.4 | 252.6 | 276.6 | 297.7 | 311.8 | 319.4 | 358.9 | −0.964 | 0.000* | |
| EPSS[4] | 411.2 | 378.4 | 393.5 | 384.8 | 412.6 | 430.6 | 409.8 | −0.505 | 0.218 | |
| AEPSS | 47.0 | 44.3 | 59.1 | 70.0 | 86.2 | 101.9 | 140.3 | −0.951 | 0.001 * | |
| EPSC[500] | % | −97.6 | −96.8 | −97.6 | −97.7 | −96.8 | −96.2 | −67.2 | −0.635 | 0.125 |
| EPSC[80] | −96.0 | −96.8 | −96.8 | −97.7 | −95.2 | −87.7 | −37.6 | −0.685 | 0.090 | |
| EPSC[60] | −98.4 | −97.6 | −96.8 | −93.0 | −79.8 | −56.2 | 45.6 | −0.784 | 0.037 * | |
| EPSC[40] | −92.9 | −86.6 | −69.6 | −45.3 | 4.8 | 76.9 | 287.2 | −0.876 | 0.010 * | |
| EPSC[20] | 78.6 | 130.4 | 236.0 | 331.3 | 471.8 | 588.5 | 978.4 | −0.953 | 0.001 * | |
| EPSC[10] | 377.8 | 448.8 | 559.2 | 677.3 | 822.6 | 897.7 | 1161.6 | −0.989 | 0.000 * | |
| EPSC[6] | 695.2 | 774.4 | 867.2 | 962.5 | 1085.5 | 1113.1 | 1328.0 | −0.987 | 0.000 * | |
| EPSC[4] | 1027.8 | 1086.4 | 1167.2 | 1195.3 | 1375.8 | 1434.6 | 1486.4 | −0.984 | 0.000 * | |
| AEPSC | 224.3 | 257.9 | 308.6 | 354.1 | 436.1 | 483.8 | 647.8 | −0.969 | 0.000 * | |
© 2018 by the authors. Licensee MDPI, Basel, Switzerland. This article is an open access article distributed under the terms and conditions of the Creative Commons Attribution (CC BY) license (http://creativecommons.org/licenses/by/4.0/).
Share and Cite
Jeong, H.K.; Lee, K.H.; Kim, M.H.; Kim, S.H.; Kim, M.G.; Kim, H.C. Signal Intensity of Contrast Enhancement according to TE in 3.0T MRI T1 Imaging. Appl. Sci. 2018, 8, 1138. https://doi.org/10.3390/app8071138
Jeong HK, Lee KH, Kim MH, Kim SH, Kim MG, Kim HC. Signal Intensity of Contrast Enhancement according to TE in 3.0T MRI T1 Imaging. Applied Sciences. 2018; 8(7):1138. https://doi.org/10.3390/app8071138
Chicago/Turabian StyleJeong, Hyun Keun, Kwon Hee Lee, Min Hee Kim, Sung Ho Kim, Min Gi Kim, and Ho Chul Kim. 2018. "Signal Intensity of Contrast Enhancement according to TE in 3.0T MRI T1 Imaging" Applied Sciences 8, no. 7: 1138. https://doi.org/10.3390/app8071138
APA StyleJeong, H. K., Lee, K. H., Kim, M. H., Kim, S. H., Kim, M. G., & Kim, H. C. (2018). Signal Intensity of Contrast Enhancement according to TE in 3.0T MRI T1 Imaging. Applied Sciences, 8(7), 1138. https://doi.org/10.3390/app8071138