Article

Evaluation of Near-Infrared Hyperspectral Imaging for Detection of Peanut and Walnut Powders in Whole Wheat Flour

1
College of Engineering, China Agricultural University, Beijing 100083, China
2
Crop Genetics and Breeding Research Unit, USDA-ARS, 2747 Davis Road, Tifton, GA 31793, USA
3
Multidisciplinary Initiative Center, Institute of High Energy Physics, Chinese Academy of Sciences, Beijing 100049, China
4
Academy of State Administration of Grain P.R.C, No. 11 Baiwanzhuang Avenue, Xicheng District, Beijing 100037, China
*
Authors to whom correspondence should be addressed.
Appl. Sci. 2018, 8(7), 1076; https://doi.org/10.3390/app8071076
Submission received: 22 May 2018 / Revised: 14 June 2018 / Accepted: 15 June 2018 / Published: 3 July 2018
(This article belongs to the Special Issue Hyperspectral Chemical Imaging for Food Authentication)

Abstract

:

Featured Application

Near-infrared hyperspectral imaging was employed for inspection of contaminant of peanut or walnut powders in whole wheat flour. A multispectral prediction model and visualization maps demonstrated the potential of the technique for the application of rapid quality control.

Abstract

The general utilization of processing equipment in industry has increased the risk of foreign material contamination. For example, peanut and walnut contaminants in whole wheat flour, which typically a healthy food, are a threat to people who are allergic to nuts. The feasibility of utilizing near-infrared hyperspectral imaging to inspect peanut and walnut powder in whole wheat flour was evaluated herein. Hyperspectral images at wavelengths 950–1700 nm were acquired. A standard normal variate combined with the Savitzky–Golay first derivative spectral transformation was adopted for the development of a partial least squares regression (PLSR) model to predict contamination concentrations. A successive projection algorithm (SPA) and uninformative variable elimination (UVE) for feature wavelength selection were compared. Two individual prediction models for peanut or walnut-contaminated flour, and a general multispectral model for both peanut-contaminated flour and walnut-contaminated flour, were developed. The optimal general multispectral model had promising results, with a determination coefficient of prediction (Rp2) of 0.987, and a root mean square error of prediction (RMSEP) of 0.373%. Visualization maps based on multispectral PLSR models reflected the contamination concentration variations in a spatial manner. The results demonstrated that near-infrared hyperspectral imaging has the potential to inspect peanut and walnut powders in flour for rapid quality control.

1. Introduction

The use of versatile food processing equipment and the globalization of the food supply chain inevitably increase the risk of food contamination caused by extraneous impurities. Food safety incidents of peanut and other nuts found in wheat products has been reported worldwide several times, and has become a serious health threat to people allergic to nuts. On the other hand, peanut and other nuts are widely utilized as food ingredients in commercial food products, but in most cases, they are not clearly stated on the product labels. Hence, the demand to detect peanut and other nut contents in food products during the manufacturing process is of vital importance. However, the most common methods for peanut and nut detection in food are on the basis of traditional protein detection methods, such as real-time polymerase chain reaction (RT-PCR) [1] and enzyme-linked immunosorbent assay (ELISA) [2]. Although these analytical methods are sensitive (0.1 mg/kg) [3], they are also destructive, time-consuming, require skilled operators, and even produce byproducts that are unfriendly to the environment. Thus, these laboratory-based detection techniques cannot meet the demand of the majority of food factories for online detection of nuts contamination.
Near-infrared (NIR) spectroscopy in conjunction with multivariate analysis, as one of the alternatives to the general physical and chemical detection methods, has the advantages of rapid and non-destructive inspection for food quality [4]. It can provide information about chemical compositions in food products based on that various peaks in the spectrum that are related to the bending and stretching of chemical bonds involving O–H, S–H, N–H, and C–H, which are widely present in large molecules or organic compounds [5]. Recent studies have illustrated the potential of NIR for the identification of peanut contamination in wheat flour, milk, and cocoa powder [6], and the classification of peanuts from different cereal, legume, oilseed, and nut samples [7]. However, NIR has the limitation induced by the point measurement; thus, it cannot provide visual images of the samples to represent the spatial variations of peanut contamination proportions and identify the spatial location or position of peanut particles contaminants in a given food product.
Hyperspectral imaging (HSI), which integrates spectroscopy and imaging techniques, is able to simultaneously achieve spectral and spatial information. Compared with NIR spectroscopy, the superiority of HSI exists in the visualization of prediction results, which is generated by employing multivariate analysis models to each pixel of the images. HSI allows chemical imaging for food inspection to graphically reflect the distribution of compositions or variation of proportions in the spatial dimension, which cannot be accomplished by using the naked eye or common industrial cameras [8,9].
The HSI technique has become one of the effective rapid detection methods to predict quality attributes non-destructively, and build chemical images to display the distribution of ingredients of various food products, including monitoring the ripeness of nectarine [10], identifying the browning development of button mushrooms [11], monitoring the total volatile basic nitrogen (TVB-N) values of cured meat [12], and predicting the protein content in single wheat kernels [13]. Furthermore, some studies also demonstrated the successful application of HSI in the quantitative detection of foreign material contamination or adulteration in powdery food products, involving discrimination for milk powders from diverse plants and of different functional qualities [14], detecting melamine adulterated in milk powders [15], the detection of sorghum, oat, and corn flour adulterated in wheat flour [16], and the inspection of common cassava flour, corn flour, and wheat flour adulterated in organic Avatar wheat [17].
The purpose of the study was to assess the potential of using NIR HSI techniques to inspect the contamination of peanut and walnut powders in whole wheat flour. Peanut and walnut powders, as well as the whole wheat flour used in our study, were of the similar small particle sizes. The mixture samples were homogeneous. The specific objectives were to (1) analyze and compare the spectra of pure peanut, walnut powders, and flour in order to extract the distinct spectral features between whole wheat flour and the contaminants; (2) select feature wavelengths and develop the multispectral model to quantify peanut and walnut contaminants in flour; (3) develop an individual identification model for peanut and walnut contaminants in flour, as well as a general model for combined samples of the two; and (4) generate a chemical distribution map to graphically display the contamination concentration variation in the spatial dimension.

2. Materials and Methods

2.1. Sample Preparation and Hyperspectral Image Collection

The commercial whole wheat flour (JIN FEIXUE QUAN MAI FEN, FEI XUE LIANG YOU SHI PIN Co. Ltd., Dongying, China) was obtained from a local supermarket, and was made of winter wheat harvested in Shandong province, China. Cooked peanut and walnut powders were procured from a commercial food-processing factory (Wotelaisi Biological Technology Co. Ltd., Lanzhou, China). The particle sizes of the three types of powders—flour, cooked peanut and walnut powders—were all less than 180 um. Peanut powder and walnut powder were mixed into flour, respectively, with contaminant levels of 0.01%, 0.05%, 0.1%, 0.5%, 1%, 3%, 5%, and 10% (w/w). The samples were fully mixed to be homogeneous. Pure flour, peanut, and walnut powder samples were also prepared. Mixed flour of each proportion filled up three plastic square Petri dishes (100 mm width, 100 mm length, and 15 mm height) as three replicates. The hyperspectral images were collected via a pushbroom HSI system (SPECIM SisuCHEMA, Spectra Imaging Ltd., Oulu, Finland) with a spectral range of 936–1720 nm and spectral resolution of 3.45 nm. The hyperspectral camera (SPECIM FX 17, Spectra Imaging Ltd., Finland) combined with indium gallium arsenide (InGaAs) detector acquired hyperspectral images by scanning line by line, yielding the three-dimensional hypercube data with dimensions of 640 (pixels) × 972 (lines) ×224 (bands). Each hyperspectral image comprised the three plastic square Petri dishes filled up with powder of the same mixed proportion. In total, 19hyperspectral images (eight for peanut–flour mixtures with different contamination proportions, eight for walnut–flour mixtures, as well as each for pure flour, peanut powder, and walnut powder) were collected. The image resolution was about 0.32 mm/pixel.

2.2. Hyperspectral Image Calibration and Region of Interest (ROI) Extraction

To minimize the signal noises due to the disturbance of instrument structure and detector sensitivity, the raw hyperspectral reflectance images were normalized into relative hyperspectral reflectance images using white reference and dark reference images, referring to the following formula [18]:
  R = R 0 R D R W R D
where R is the relative reflectance image, R 0 is the raw reflectance image, and R W and R D are the white and dark reference images, respectively. Before image collection, the white reference images were acquired by collecting the hyperspectral image of a uniform and stable white calibration plate, and the dark reference image was collected when the camera lens was shut off.
To promote the signal-to-noise ratio (S/N), data at the beginning and end of the spectral bands were removed; that is, only the remaining region from 950 nm to 1700 nm (213 bands) was used. To remove the background and edge of the Petri dish, three sub-images (284 × 284 pixels) of the powder area in the three Petri dishes were cut off manually from each relative reflectance image. Then, each sub-image was divided equally into nine regions of interest (ROIs). The spectra of all of the pixels in each ROI were averaged to a spectrum. Hence, 513 spectra in total (27 spectra per image × 19 images) were used for the following analysis. Among these, 243 spectra (27 spectra per image × nine images (eight mixtures and pure flour)) were separated by a ratio of 2:1 into a calibration set (162 spectra) and a prediction set (81 spectra) for the development and validation of the corresponding PLSR models, respectively. A calibration set was also used to perform five-fold cross-validation.

2.3. Spectral Preprocessing

The average reflectance spectra calculated from ROIs were first transformed to absorbance (log (1/reflectance)). Then, in order to eliminate the undesired impact, such as random noise, light scattering, and baseline shifts [18], three spectral preprocessing techniques, including standard normal variate (SNV), Savitzky–Golay first derivative (1st Der) (with a second-order polynomial and a five-point window), de-trending (Det) (with a second-order polynomial), two combinations of SNV with 1st Der (SNV + 1st Der) and SNV with Det (SNV + Det), were separately adopted and compared to deal with the absorption spectra prior to the model establishment. SNV is normally applied to remove scatter effect. First derivative (1st Der) removes the baseline shift and amplifies small spectral features [19]. Det is used to eliminate the effects of baseline shift and curvilinearity [20]. The combination of SNV and Det is often used to remove the curvilinearity and absorbance offset from NIR spectra and reveal key information under processes of investigation [21,22,23].

2.4. Model Development Based on Full Spectra

In this work, partial least squares regression (PLSR) models were established for correlating the hyperspectral absorbance spectra data with the contamination levels of peanut or walnut in the whole wheat flour. PLSR is considered one of the most reliable and robust multivariate statistical analysis methods for modeling, so long as the input variables are numerous and highly correlated. PLS regression transforms raw predictors (wavelengths) to a reduced number of new variables called latent variables (LVs), which are statistically independent and carry useful information that is relevant, with reference values leading to better predictive capability [24]. The optimal number of LVs for the PLSR model was determined on the basis of the rule of the lowest prediction error in cross-validation carried out on the data of the calibration set. The evaluation of the PLSR model performance was examined by determination coefficient as well as root mean square error of calibration (Rc2, RMSEC), cross-validation (Rcv2, RMSECV) and prediction (Rp2, RMSEP). The best model should have higher values of Rc2, Rcv2, and Rp2, and lower values of RMSEC, RMSECV, and RMSEP.

2.5. Optimal Wavelength Extraction and Multispectral Model Development

The PLSR models employing the full spectra of the hyperspectral data do not always yield good results due to the high dimensionality, multicollinearity, and redundancy among contiguous wavelengths, which also causes a lower processing speed and higher cost for hardware setup. Variable selection methods can be used to screen out useful wavelength variables, which can simplify the model development, improve model’s performance and/or robustness, and benefit the development of online or portable instruments. In this study, two variable selection methods, i.e., uninformative variable elimination (UVE) and successive projection algorithm (SPA) were compared. UVE is one of the most prevalent variable selection methods that is widely used in analytical chemistry [25]; it is able to remove the variables that are not more informative than noise for modeling, and thus increase the model’s predictive accuracy [26]. SPA is also a common method to select variables in multivariate modeling, and has been more favorable than the genetic algorithm [27]. SPA is an iterative forward selection method that adopts projection operations to choose variables of collinearity minimum.

2.6. Visualization and Post-Processingof Predicted Results

In order to intuitively display the contamination proportion information in a spatial domain, a visualization map of detection results is generated by transferring a multivariate analysis model to each pixel’s spectra of the image. Specifically, the hyperspectral image was transformed into a two-dimensional matrix, and then the matrix was multiplied with the regression coefficients from the best PLSR model. The resultant vector of predicted values was refolded to form a two-dimensional color image [28]. In this study, the hyperspectral image data that was used for visualization for each type of samples was a sub-image, which was cut out from the raw calibrated hyperspectral images with the size of 150 × 150 pixels at selected wavelengths, and then processed with SNV.
Additionally, in order to obtain a more precise prediction map, a post-processing method was applied on the prediction values of all of the pixels before forming the visualization map. The post-processing method was shown by the following equations:
Y p = Y 0.95 ,   if   Y Y 0.95
Y p = Y ,   if   Y 0.95 < Y Y 0.95 +
Y p = Y 0.95 + ,   if   Y 0.95 + < Y
  Y 0.95 = μ ¯ 1.96 × σ ÷ n
  Y 0.95 + = μ ¯ + 1.96 × σ ÷ n
where the Y p values were the predicted values of the pixels after they were post-processed, Y were the predicted values of the pixels, Y 0.95 and Y 0.95 + were the values of the endpoints of 95% confidence interval of the mean of Y , μ ¯ was the mean of Y , σ was the standard deviation of Y , and n was the number of Y .

2.7. Software

The calibration and extraction of ROIs of the hyperspectral image were realized in ENVI (Exelis Visual Information Solutions, Boulder, CO, USA). All of the spectral preprocessing and PLSR analysis were conducted in Unscrambler X (version 10.1, CAMO software AS, Oslo, Norway, 2010). UVE, SPA, visualization, and post-processing of the predicted results were carried out in MATLAB (version 2013b, The Mathworks Inc., Natick, MA, USA).

3. Results and Discussion

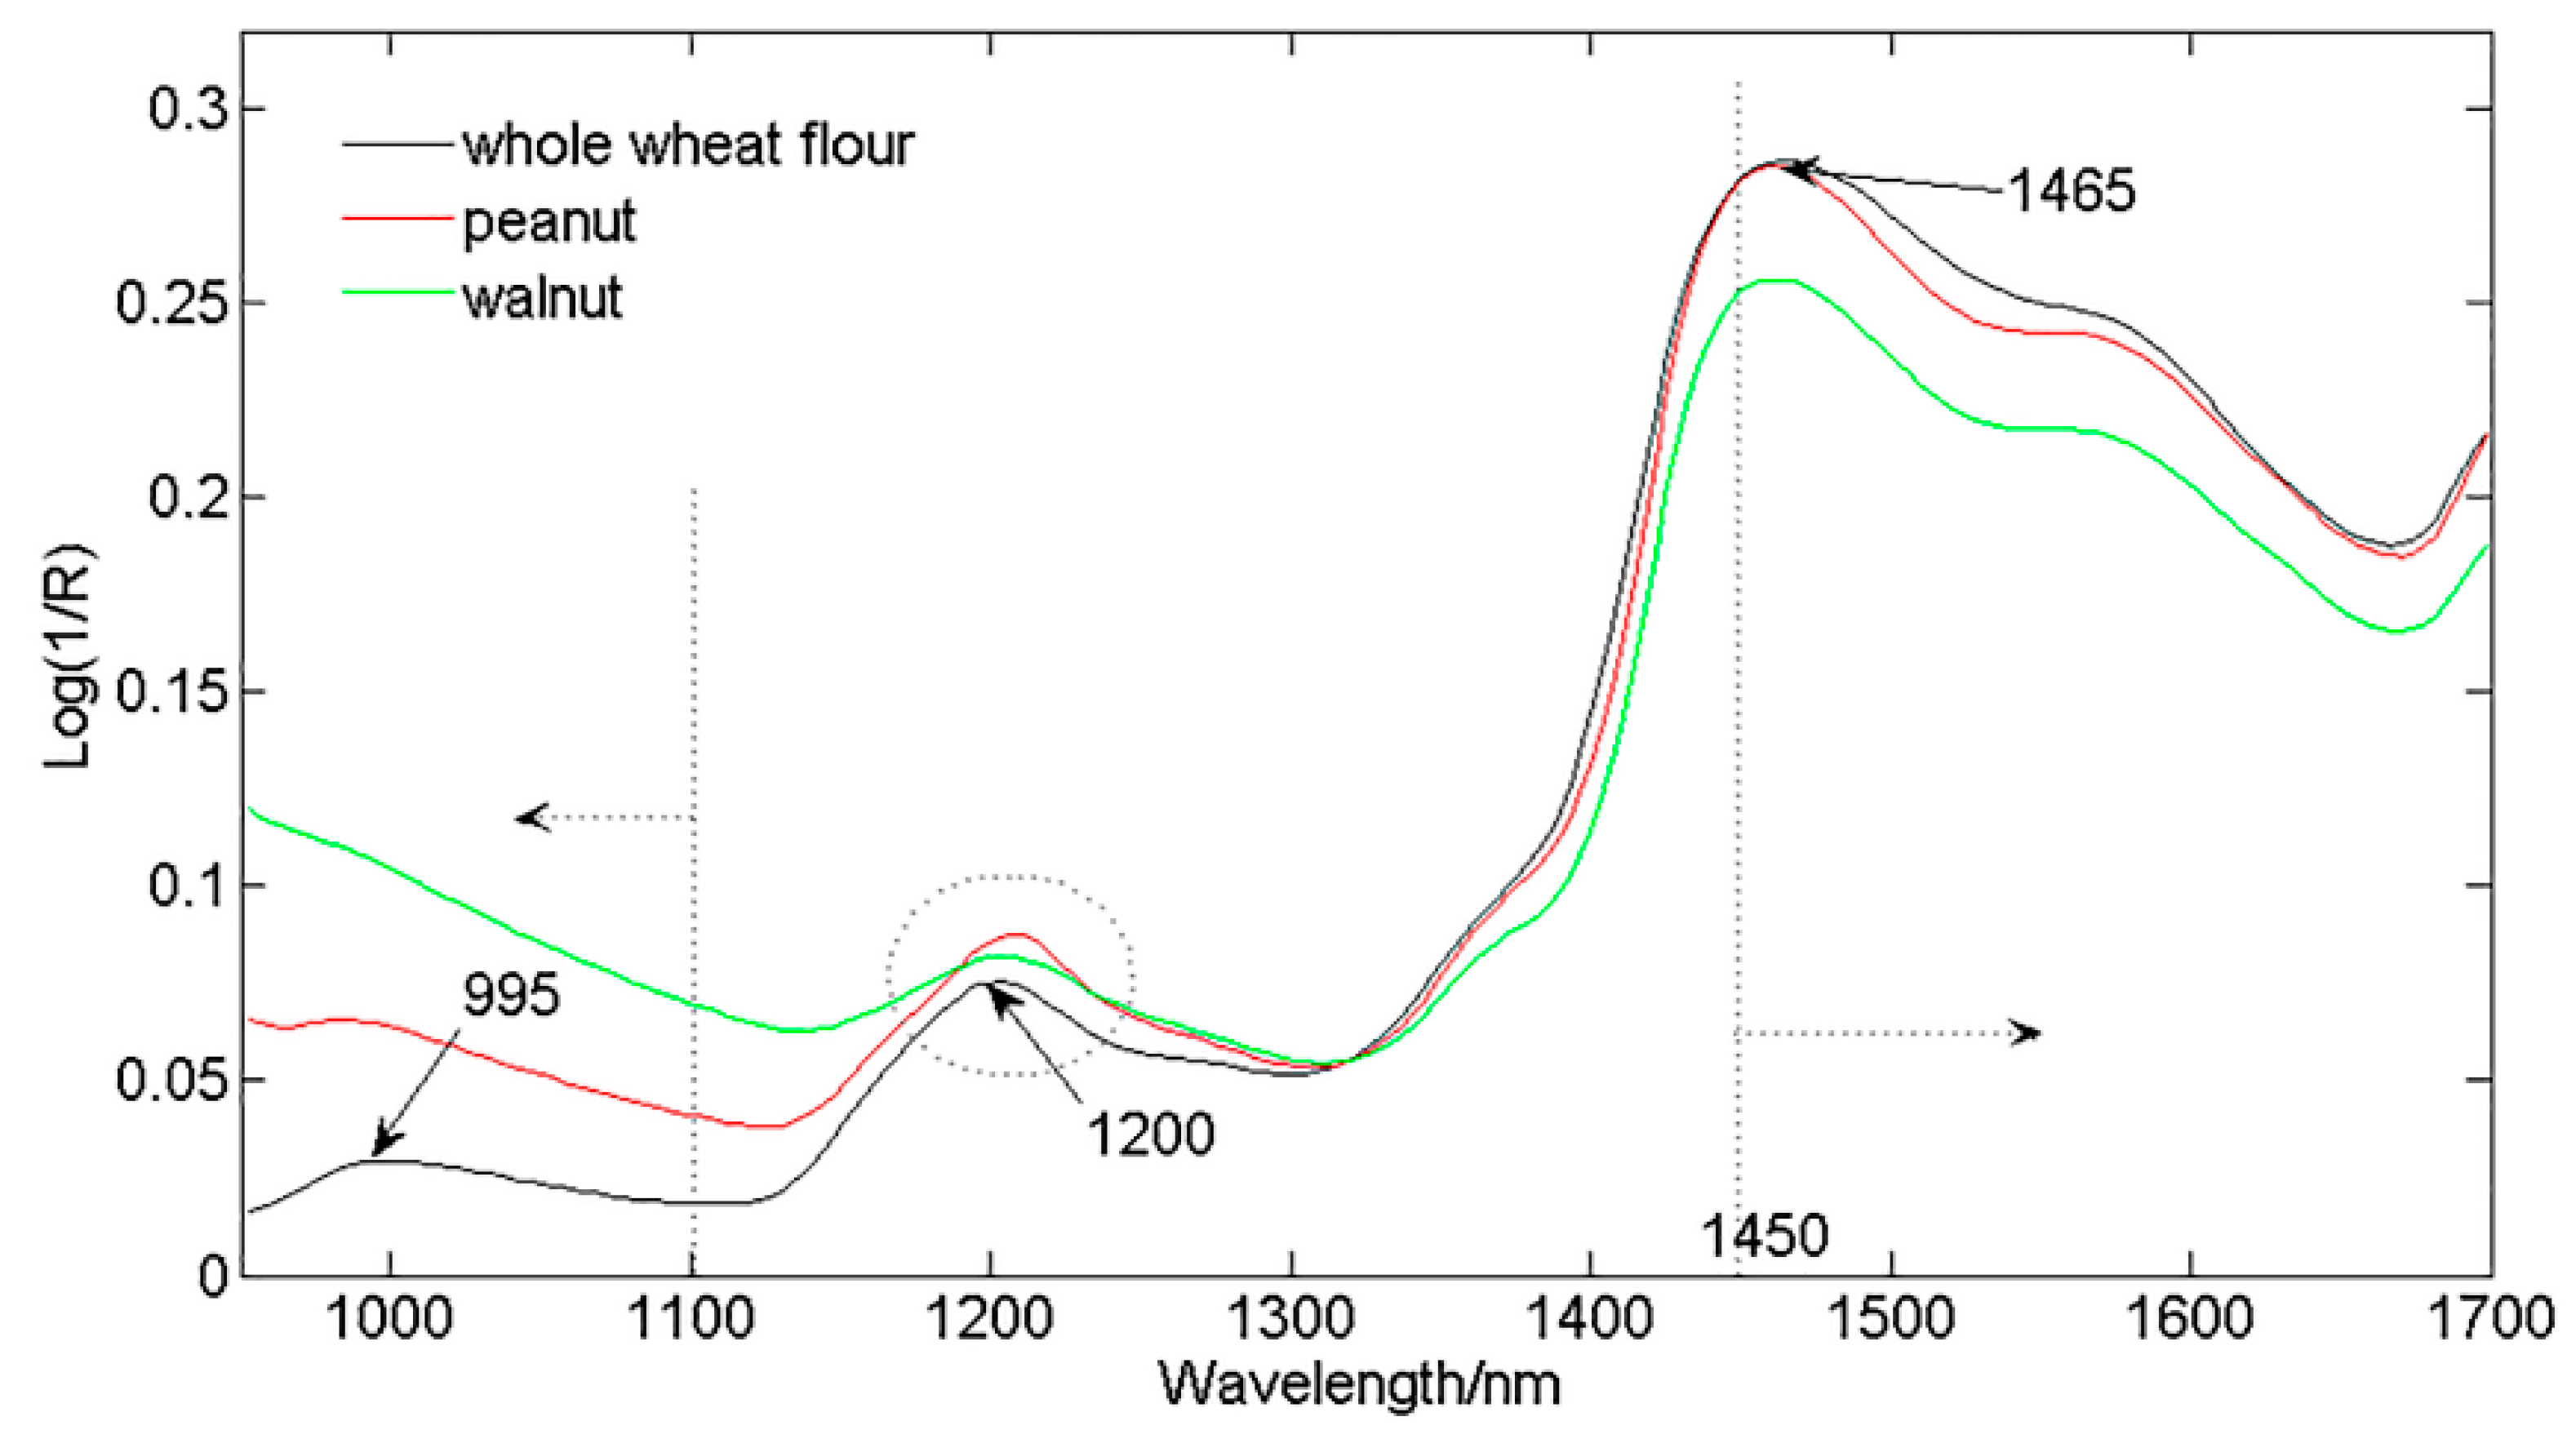
3.1. Spectral Features of Pure Whole Wheat Flour, Peanut Powder, and Walnut Powder

The average absorbance spectral curves of pure flour, peanut powder, and walnut powder were shown in Figure 1. The most obvious difference among the three types of powders was observed in the spectral range from 950 nm to 1100 nm, with a low and remarkable absorption peak at 995 nm, which might be related to a N–H second overtone of peptides and proteins [29]. Flour had the lowest absorbance value among the three powders at this region. In the region after 1150 nm, the general trends of the three spectra curves were similar, and were only different in the value of absorbance. Other significant variations of the three spectral profiles were presented at the absorption peak of 1200 nm and spectral region after 1450 nm (shown in Figure 1). The peak at 1200 nm was associated with C–H stretch (methylene and methyl) second overtones of lipids, starches, and/or proteins. The large absorption at 1465 nm was related to the first overtone of the O–H stretch of water [29]. These differences in absorbance values were primarily due to different chemical compositions of the three powers. As a whole, the difference between walnut and flour is greater than that between peanut and flour. Generally, the trends of the three spectra curves were similar, and taking into account both particle size of samples (less than 0.180 mm) and image resolution (0.32 mm/pixel), the identification of the location of peanut and walnut particles seemed impossible in current study.

3.2. Comparison of Preprocessed Methods and Full Spectra Modeling

The performances of different PLSR models that were developed based on raw and the five preprocessed spectra for predicting peanut or walnut contaminants in flour are summarized in Table 1. Compared to the raw spectra, the preprocessing methods offered a significant improvement in the model performance for peanut contamination, which indicated that the preprocessing methods were effective to attenuate the scatter effect and random noise. As shown in Table 1, the PLSR model with a combined preprocessed method of SNV + 1st Der performed the best. Regarding the model of walnut contamination, although not all of the preprocessing methods improved the performance of the PLSR models, the combination method of SNV + 1st Der performed the best. Moreover, performance of PLSR models for walnut powder was better than the model for peanut powder, which was in accordance with the more distinct difference between walnut and flour than that between peanut and flour, as indicated in Section 3.1 and Figure 1.
The plot of measured versus predicted values of the prediction set for peanut and walnut contamination were shown in Figure 2a,b, respectively. Normally, contaminants with larger concentration gradients are relatively easy to be predicted; thus, the minimum limit of detection is the critical point of the problem. As shown in Figure 2a for peanut contamination, all of the samples with a concentration equal and greater than 1% were predicted to be above 0, while for samples with a concentration of 0.5%, except for one sample, all of the other samples’ predicted values were above 0. These indicated that the lowest detection limit of peanut contamination in flour was close to 0.5%, although variation did exist. The results for walnut were better, and all of the samples with concentrations equal to and greater than 0.5% could be well predicted, and as shown in Figure 2b, the lowest detection limit of walnut contamination in flour reached 0.5%.

3.3. Selection of Optimal Wavelengths and Multispectral Model Development

UVE and SPA were applied on the preprocessed spectra of peanut and walnut contamination samples respectively to select the feature wavelengths from the full spectral range (213 wavelength variables). Furthermore, for the development of a general model for predicting peanut or walnut contamination, UVE and SPA were also applied on the spectra data of the combination of peanut-contaminated and walnut-contaminated flour samples. Multispectral PLSR models for predicting contaminants in flour were then developed using the corresponding feature wavelengths, and the main statistical parameters of the models are presented in Table 2. The number of optimal wavelengths selected by UVE was more than that by SPA, and the models based on UVE possessed better performance than those by SPA. This could be because SPA reduced the number of wavelength variables to a great extent in order to solve the collinearity problem, which leads to a decrease in the accuracy of the model. This was consistent with the conclusions of Ye, Wang, and Min [26], Li et al. [30] and Cheng, Sun, and Pu [31]. Multispectral PLSR models based on UVE showed good results to predict contaminants in three cases (as shown in Table 2). Accuracies of the best multispectral models to individually predict walnut or peanut contaminants were the same or even better than the models based on raw full spectra without being preprocessed. The general multispectral model for predicting a contaminant concentration value of both peanut-contaminated flour and walnut-contaminated flour performed worse than the models for peanut or walnut contaminant individually, but the performance was still promising with Rc2 of 0.988, RMSEC of 0.345%, Rcv2 of 0.987, RMSECV of 0.360%, Rp2 of 0.987, and RMSEP of 0.373%. The plot of measured versus predicted values of a prediction set for predicting peanut contamination, walnut contamination, and a combination of the two were presented in Figure 3. For the former two models, the contaminated samples with concentrations above 0.5% could be well predicted, while for the general model for both peanut and walnut, samples with concentrations above 1% could be predicted correctly as contaminated flour. These indicated that for the two individual models, the limit of detection was 0.5%, while for the general model, the limit of detection was 1%. Mishra et al. [3,32,33] studied the feasibility of the NIR HSI technique combined with principal component analysis (PCA), spectral band math, or independent component analysis (ICA) to detect peanut, hazelnut, and walnut particles (particle size of 1000–500 um) in wheat flour (particle size of 125–100 um and 212–160 um). The results of their studies indicated that the combined technique can detect the spatial locations of peanut particles with contamination concentrations of 0.01% in the wheat flour. However, in their study, the particle sizes of the nuts were greater than that of the flour, and the situation of peanut and nut contaminants with smaller particle sizes similar to powdery food products has not been investigated. For some unintentional contamination situations, the results of the developed models in the study were not good enough; however, the models had practical application significance in the situations of nut powder as a food ingredient that was deliberately added in commercial wheat products without a clear statement.
The distributions of selected wavelengths were plotted on the corresponding spectra profile of pure powders needed to be distinguished (as shown in Figure 4). As illustrated in Figure 4a,b for peanut-contaminated flour samples, the feature wavelengths selected by UVE and SPA were distributed similarly in the wavelengths regions such as 950–1050 nm, around 1200 nm, 1450–1600 nm, as well as 1350–1400 nm. As discussed in the Section 3.1, the former three regions presented the distinction between peanut and flour. For the region of 1350–1400 nm, there appeared to be an inflection point of the absorbance values between peanut and flour. While for Figure 4c,d, the distribution of wavelengths selected by UVE and SPA for walnut-contaminated samples seemed much more different from each other. The majority of the feature wavelengths selected by the UVE were among the region of 995–1150 nm, while wavelengths selected by SPA were among the whole wavelength range. The reason might be that SPA is based on criterion of the minimum of collinearity. As shown in Figure 4e,f, the distributions of wavelengths selected by UVE and SPA for combined samples of peanut and walnut contamination were also similar to each other; the distribution regions were in accordance with those discussed in peanut or walnut contamination cases, respectively. In general, UVE selected more feature wavelengths and had more accurate prediction models than SPA. SPA had the advantage in streamlining the wavelength variables, but also resulted in the decrease of the accuracy of the model.
Furthermore, the number of feature wavelengths for peanut was greater than that for walnut, and the number for combined samples of peanut and walnut was the highest (shown in Table 3). Among all of the selected wavelengths, the wavelengths of 1109 nm, 1127 nm, 1203 nm, 1207 nm, 1249 nm, 1252 nm, 1256 nm, 1368 nm, 1464 nm, and 1606 nm were selected more than once by UVE or SPA for individual peanut or walnut contamination, or a combination of contaminated samples by peanut or walnut. A wavelength of 1127 nm was attributed to O–H stretch from carboxylacids [34], a wavelength of 1200 nm was attributed to the C–H stretch (methylene and methyl) second overtone of lipids, starches, and/or proteins [29], 1210 nm was related to the second overtone of a C–H stretch of lipid [35], and 1465 nm was associated with the first overtone of the O–H stretch of water. These wavelengths were respectively close to the selected wavelengths of 1203 nm, 1207 nm, and 1464 nm, which indicated that the feature wavelengths contained the information for the main chemical composition (protein, starch, lipid, moisture) of peanut, walnut, and flours.

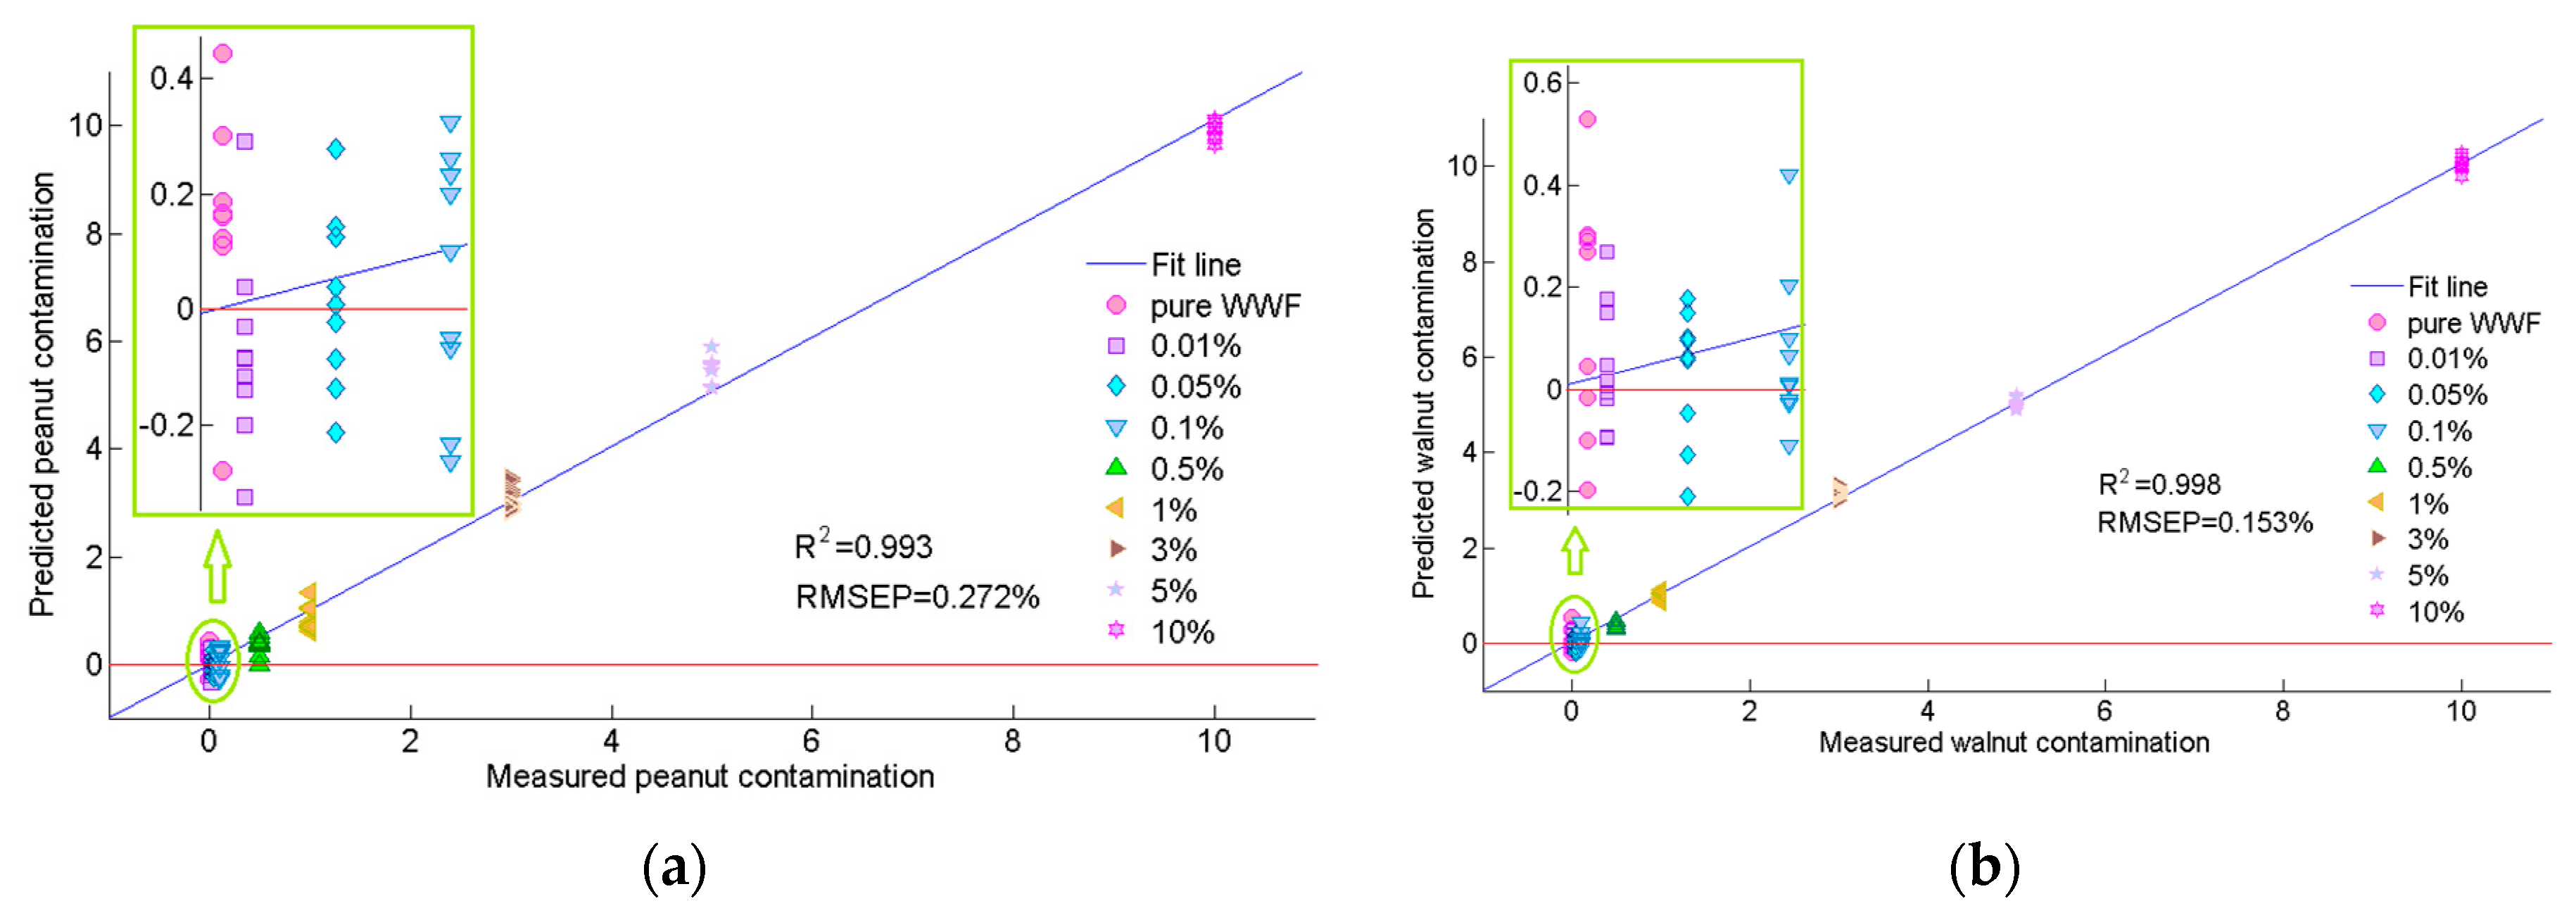
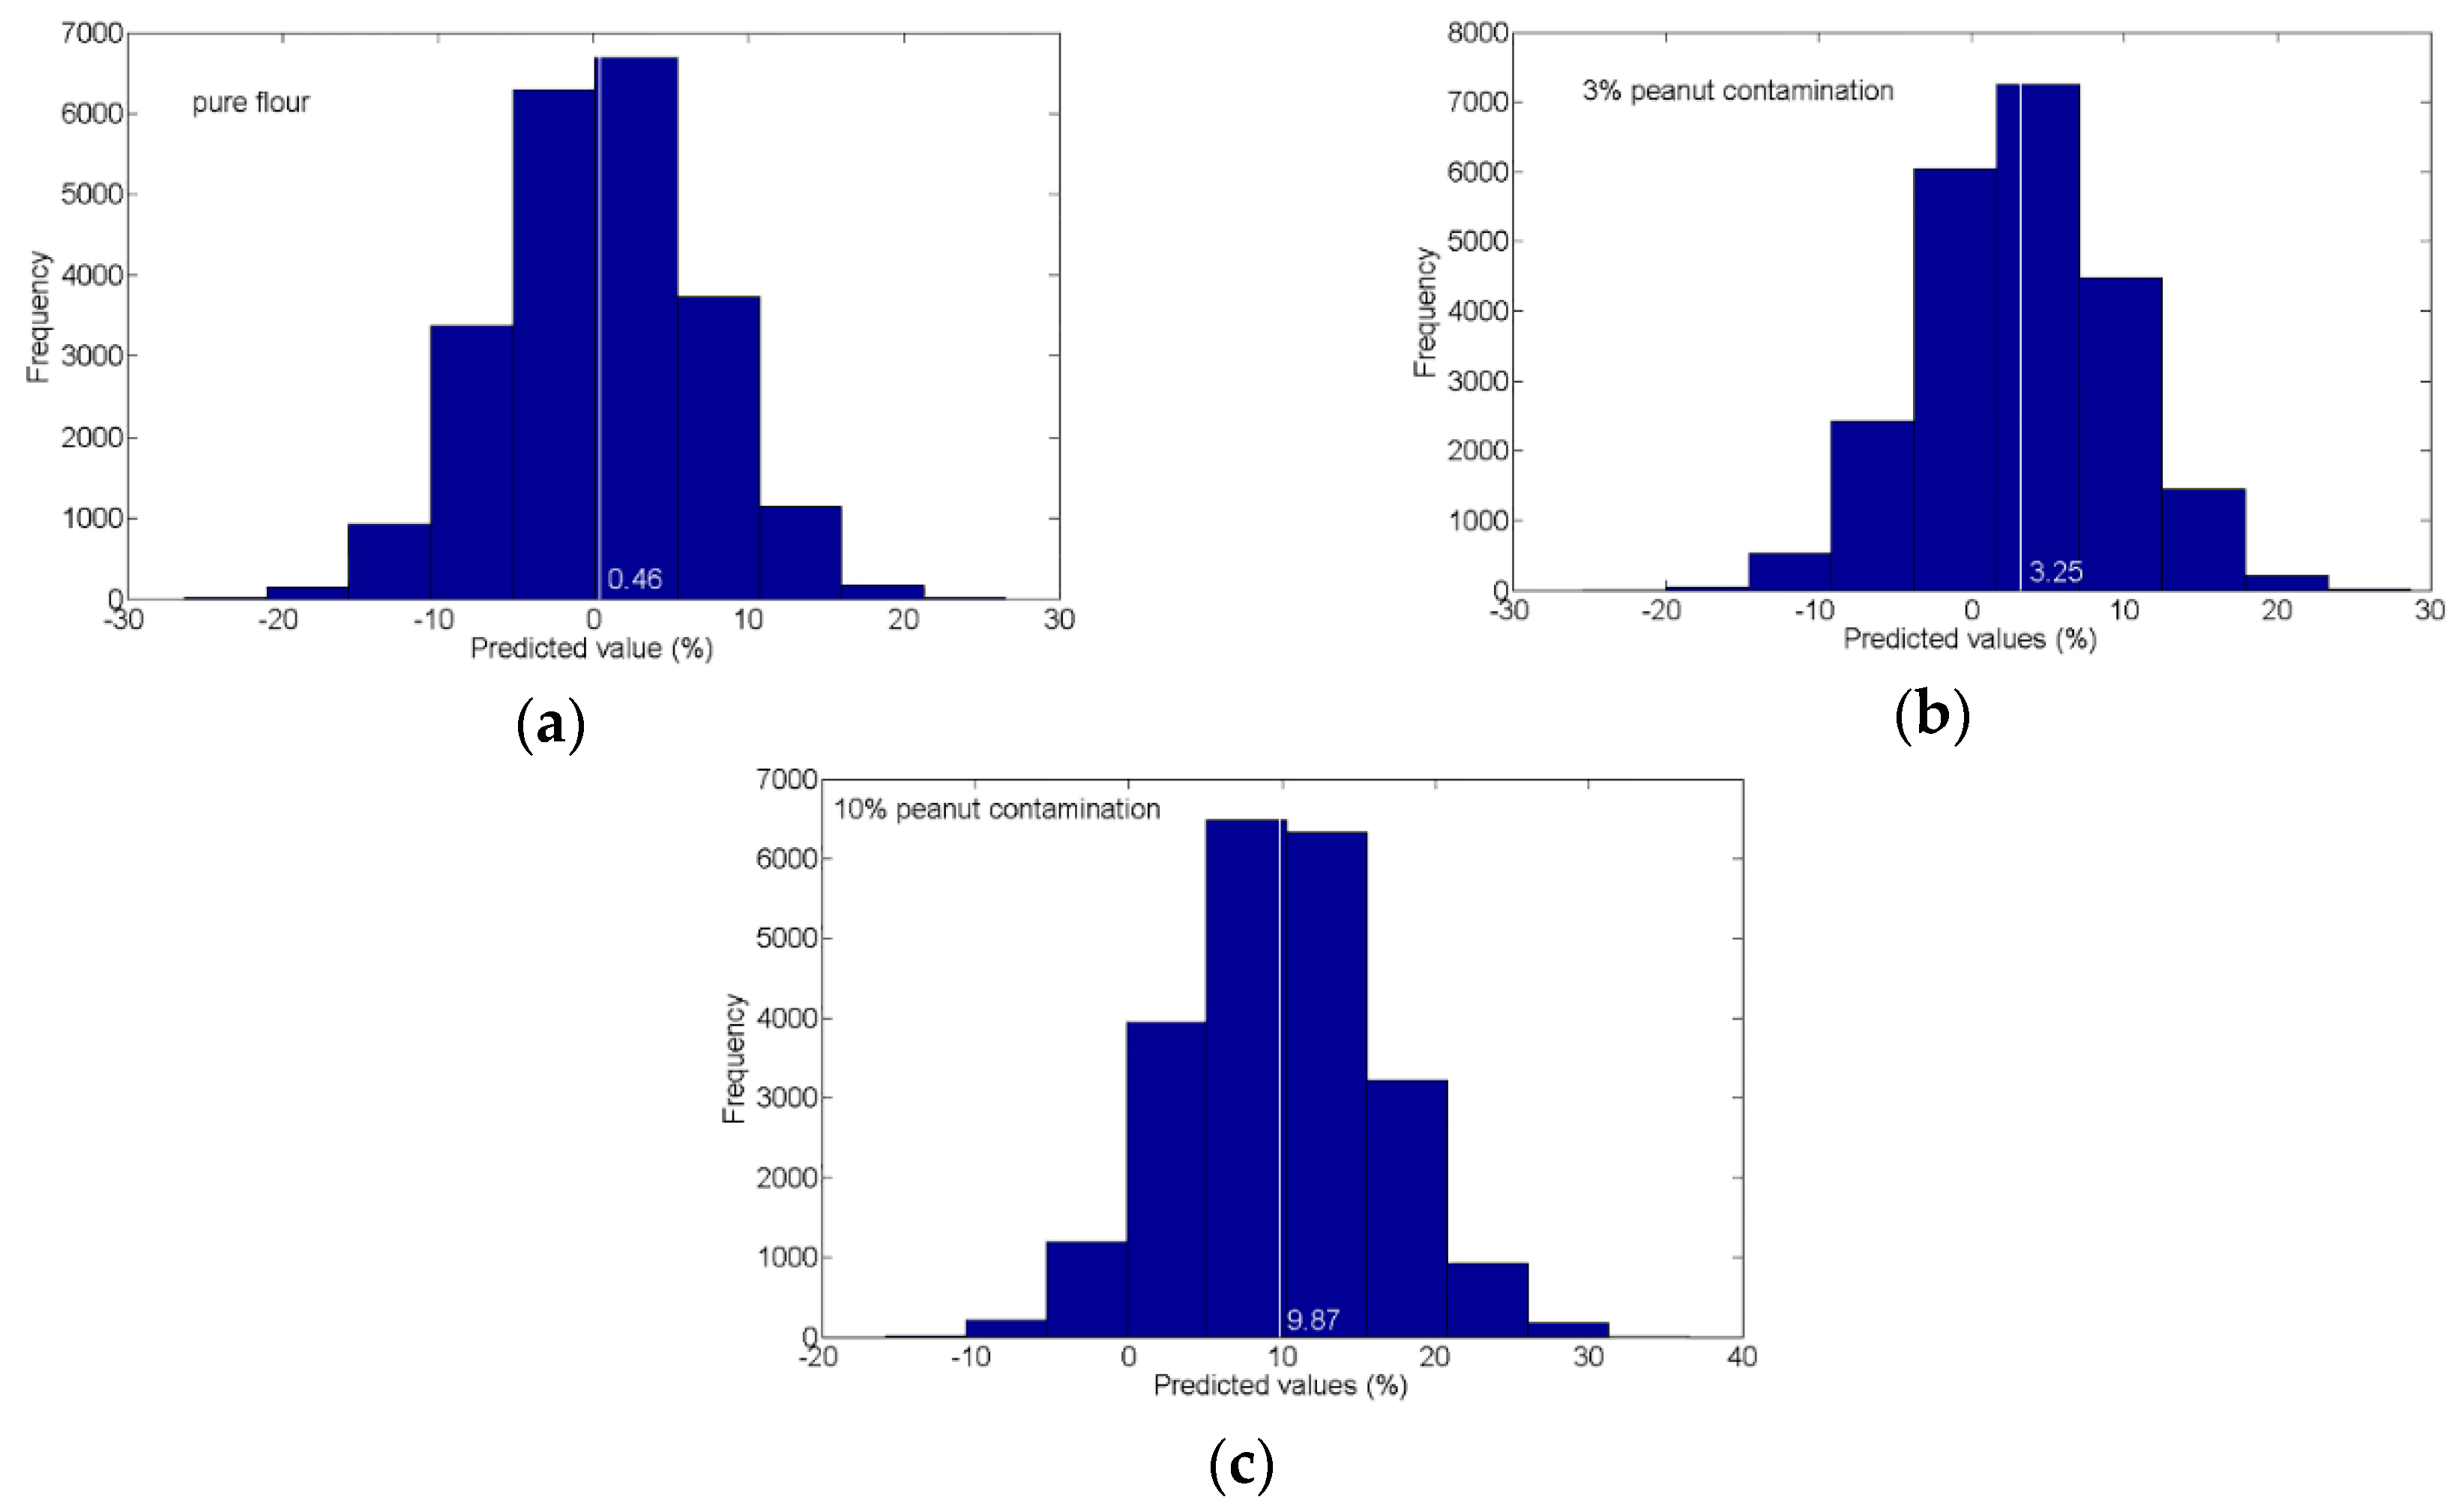
3.4. Post-Processing and Visualization of Prediction Results

The histogram of frequency of predicted concentrations of the pixels of samples with peanut contaminant in concentrations of 0%, 3%, and 10% is presented in Figure 5. As shown in Figure 5, the predicted concentration values of pixels within one sample had large deviations, which were greater than the tested concentration gradients, and led to the poor visualization results. This was considered to be caused by the noise and because the models that were used were developed based on the average spectra of ROIs. However, as shown in Figure 5, the mean of predicted values (shown in white values and white vertical lines) were near to the actual concentrations. Hence, considering the homogeneity of the samples, the lower and upper thresholds defined as 95% confidence interval of the mean of the predicted values were used to correct the predicted values.
Visualization results of the corrected predicted values based on different multispectral PLSR models were shown in Figure 6. All of the visualization results demonstrated clear discrimination among samples with contamination concentrations of 1%, 3%, 5% and 10%, although the corrected predicted values were not very accurate. As shown in Figure 6b, the visual map of the PLSR model based on the 14 wavelengths for predicting walnut contaminant showed the best discrimination results, where even samples with concentrations of 0.5% and pure flour could also be identified. For the other visual maps (shown in Figure 6a,c,d), the prediction results of pure flour samples showed relatively large prediction errors, and the predicted concentration values showed false positives. For all of the multispectral PLSR models, the samples with walnut contaminants were predicted more accurately than those with peanut contaminants. Overall, visual prediction maps graphically displayed the contamination concentration variation between samples and even within one sample, which is impossible for the naked eye and common industrial cameras. Moreover, the visualization results demonstrated the main advantage of HSI over the conventional spectroscopy for not only chemical composition, but also for the spatial contaminant detection of peanut and walnut powders in whole wheat flour.

4. Conclusions

This study demonstrated the feasibility of the NIR HSI technique for the quantitative detection and contamination visualization analysis of peanut and walnut powders in whole wheat flour. At first, different preprocessing methods were examined to promote the signal-to-noise ratio of the original spectra. After comparison, the preprocessed spectra by SNV combined with 1st Der were adopted to develop the PLSR model based on full spectra. UVE selected more feature wavelengths and had more accurate prediction models than SPA. SPA had the advantage of streamlining the wavelength variables based on a minimum of collinearity, but resulted in a decrease in the accuracy of the model. The general multispectral model for predicting a contaminant concentration of both peanut-contaminated flour and walnut-contaminated flour performed worse than the individual identification model for either peanut or walnut contaminant, but the performance was still promising with Rc2 of 0.988, RMSEC of 0.345%, Rcv2 of 0.987, RMSECV of 0.360%, Rp2 of 0.987, and RMSEP of 0.373%. For the individual identification models for peanut and walnut powders in flour, the samples of prediction set with concentrations above 0.5% could be predicted correctly as contaminated flour, while for the general model for combined samples of the two, the limit of detection was 1%. In particular, for all of the models, the walnut contaminant was detected more accurately than the peanut contaminant. Although for some unintentional contamination situations the results of the models were not good enough, the models had practical application significance in the situations of nut powder as a food ingredient deliberately added in commercial wheat products.
Visual maps based on different multispectral PLSR models indicated the ability to display the concentration variation of peanut or walnut contamination in spatial terms, which is impossible for the naked eye and common industrial cameras. The study confirmed that the NIR HSI technique has the potential to inspect peanut and walnut powders in whole wheat flour for rapid quality control, and demonstrated the prospect of practical application. The methodology proposed in this study could also be used to detect other foreign contamination or adulteration in whole wheat flour. In the current study, taking into account similar trends of spectral curves among pure samples, the small particle size of samples (less than 0.180 mm), and the insufficient image resolution (0.32 mm/pixel), the identification of the location of peanut and walnut particles seemed impossible. Further research can focus on the feasibility of employing NIR HSI to identify the location of contaminant particles in the sample surface under situations of different image resolutions and particle sizes of samples.

Author Contributions

W.W. arranged the experiments; X.Z. and X.C. conducted the experiments; X.Z., W.W. and Y.-F.L. analyzed the data; X.Z., W.W., C.S., and X.N. prepared the manuscript. All authors cooperated in the expression of the results and the organization of the manuscript.

Funding

The study is financially supported by the National Natural Science Foundation of China (No. 31772062).

Acknowledgments

The authors thank the Quantum Design China Co., Ltd. (Beijing, China) for the support of the hyperspectral system.

Conflicts of Interest

The authors declare no conflict of interest.

References

  1. López-Calleja, I.M.; de la Cruz, S.; Pegels, N.; González, I.; García, T.; Martín, R. Development of a real time PCR assay for detection of allergenic trace amounts of peanut (Arachishypogaea) in processed foods. Food Control. 2013, 30, 480–490. [Google Scholar] [CrossRef]
  2. Platteau, C.; De Loose, M.; De Meulenaer, B.; Taverniers, I. Detection of allergenic ingredients using real-time PCR: A case study on hazelnut (Corylus avellena) and soy (Glycine max). J. Agric. Food Chem. 2011, 59, 10803–10814. [Google Scholar] [CrossRef] [PubMed]
  3. Mishra, P.; Herrero-Langreo, A.; Barreiro, P.; Roger, J.M.; Diezma, B.; Gorretta, N.; Lleó, L. Detection and quantification of peanut traces in wheat flour by near infrared hyperspectral imaging spectroscopy using principal-component analysis. J. Near Infrared Spectrosc. 2015, 23, 15–22. [Google Scholar] [CrossRef]
  4. Pannico, A.; Schouten, R.E.; Basile, B.; Romano, R.; Woltering, E.J.; Cirillo, C. Non-destructive detection of flawed hazelnut kernels and lipid oxidation assessment using NIR spectroscopy. J. Food Eng. 2015, 160, 42–48. [Google Scholar] [CrossRef]
  5. Su, W.H.; He, H.J.; Sun, D.W. Non-destructive and rapid evaluation of staple foods quality by using spectroscopic techniques: A review. Crit. Rev. Food Sci. Nutr. 2017, 57, 1039–1051. [Google Scholar] [CrossRef] [PubMed]
  6. Ghosh, S.; Domínguez, T.R.C.; Diezma, B.; Lleó, L.; Barreiro, P.; Lacarra, T.G.; Roger, J.M. VIS/NIR spectral signature for the identification of peanut contamination of powder foods. Agric. Eng. Int. CIGR J. 2015, 17, 310–329. [Google Scholar]
  7. Ghosh, S.; Mishra, P.; Mohamad, S.N.H.; de Santos, R.M.; Iglesias, B.D.; Elorza, P.B. Discrimination of peanuts from bulk cereals and nuts by near infrared reflectance spectroscopy. Biosyst. Eng. 2016, 151, 178–186. [Google Scholar] [CrossRef]
  8. Williams, P.J.; Kucheryavskiy, S. Classification of maize kernels using NIR hyperspectral imaging. Food Chem. 2016, 209, 131–138. [Google Scholar] [CrossRef] [PubMed]
  9. Mo, C.; Kim, G.; Kim, M.S.; Lim, J.; Lee, S.H.; Lee, H.S.; Cho, B.K. Discrimination methods for biological contaminants in fresh-cut lettuce based on VNIR and NIR hyperspectral imaging. Infrared Phys. Technol. 2017, 85, 1–12. [Google Scholar] [CrossRef]
  10. Munera, S.; Amigo, J.M.; Blasco, J.; Cubero, S.; Talens, P.; Aleixos, N. Ripeness monitoring of two cultivars of nectarine using VIS-NIR hyperspectral reflectance imaging. J. Food Eng. 2017, 214, 29–39. [Google Scholar] [CrossRef]
  11. Mollazade, K. Non-destructive Identifying Level of Browning Development in Button Mushroom (Agaricusbisporus) Using Hyperspectral Imaging Associated with Chemometrics. Food Anal. Methods 2017, 10, 2743–2754. [Google Scholar] [CrossRef]
  12. Yang, Q.; Sun, D.W.; Cheng, W. Development of simplified models for nondestructive hyperspectral imaging monitoring of TVB-N contents in cured meat during drying process. J. Food Eng. 2017, 192, 53–60. [Google Scholar] [CrossRef]
  13. Caporaso, N.; Whitworth, M.B.; Fisk, I.D. Protein content prediction in single wheat kernels using hyperspectral imaging. Food Chem. 2018, 240, 32–42. [Google Scholar] [CrossRef] [PubMed]
  14. Munir, M.T.; Wilson, D.I.; Yu, W.; Young, B.R. An evaluation of hyperspectral imaging for characterising milk powders. J. Food Eng. 2018, 221, 1–10. [Google Scholar] [CrossRef]
  15. Lim, J.; Kim, G.; Mo, C.; Kim, M.S.; Chao, K.; Qin, J.; Fu, X.; Baek, I.; Cho, B.K. Detection of melamine in milk powders using near-infrared hyperspectral imaging combined with regression coefficient of partial least square regression model. Talanta 2016, 151, 183–191. [Google Scholar] [CrossRef] [PubMed] [Green Version]
  16. Verdú, S.; Vásquez, F.; Grau, R.; Ivorra, E.; Sánchez, A.J.; Barat, J.M. Detection of adulterations with different grains in wheat products based on the hyperspectral image technique: The specific cases of flour and bread. Food Control. 2016, 62, 373–380. [Google Scholar] [CrossRef] [Green Version]
  17. Su, W.H.; Sun, D.W. Evaluation of spectral imaging for inspection of adulterants in terms of common wheat flour, cassava flour and corn flour in organic Avatar wheat (Triticum spp.) flour. J. Food Eng. 2017, 200, 59–69. [Google Scholar] [CrossRef]
  18. Kamruzzaman, M.; Makino, Y.; Oshita, S. Rapid and non-destructive detection of chicken adulteration in minced beef using visible near-infrared hyperspectral imaging and machine learning. J. Food Eng. 2016, 170, 8–15. [Google Scholar] [CrossRef]
  19. Jia, B.; Yoon, S.C.; Zhuang, H.; Wang, W.; Li, C. Prediction of pH of fresh chicken breast fillets by VNIR hyperspectral imaging. J. Food Eng. 2017, 208, 57–65. [Google Scholar] [CrossRef]
  20. Luypaert, J.; Zhang, M.H.; Massart, D.L. Feasibility study for the use of near infrared spectroscopy in the qualitative and quantitative analysis of green tea, Camellia sinensis (L.). Anal. Chim. Acta 2003, 478, 303–312. [Google Scholar] [CrossRef]
  21. Hailey, P.A.; Doherty, P.; Tapsell, P.; Oliver, T.; Aldridge, P.K. Automated system for the on-line monitoring of powder blending processes using near-infrared spectroscopy part I. system development and control. J. Pharm. Biomed. Anal. 1996, 14, 551–559. [Google Scholar] [CrossRef]
  22. Marchi, M.D.; Riovanto, R.; Penasa, M.; Cassandro, M. At-line prediction of fatty acid profile in chicken breast using near infrared reflectance spectroscopy. Meat Sci. 2012, 90, 653–657. [Google Scholar] [CrossRef] [PubMed]
  23. Rodriguez-Saona, L.E.; Fry, F.S.; McLaughlin, M.A.; Calvey, E.M. Rapid analysis of sugars in fruit juices by FT-NIR spectroscopy. Carbohydr. Res. 2001, 336, 63–74. [Google Scholar] [CrossRef]
  24. Wold, S.; Sjöström, M.; Eriksson, L. PLS-regression: A basic tool of chemometrics. Chemom. Intell. Lab. Syst. 2001, 58, 109–130. [Google Scholar] [CrossRef]
  25. Li, Y.-K. Determination of diesel cetane number by consensus modeling based on uninformative variable elimination. Anal. Methods 2012, 4, 254–258. [Google Scholar] [CrossRef]
  26. Ye, S.; Wang, D.; Min, S. Successive projections algorithm combined with uninformative variable elimination for spectral variable selection. Chemom. Intell. Lab. Syst. 2008, 91, 194–199. [Google Scholar] [CrossRef]
  27. Pontes, M.J.C.; Galvao, R.K.H.; Araújo, M.C.U.; Moreira, P.N.T.; Neto, O.D.P.; Jose, G.E.; Saldanha, T.C.B. The successive projections algorithm for spectral variable selection in classification problems. Chemom. Intell. Lab. Syst. 2005, 78, 11–18. [Google Scholar] [CrossRef]
  28. Chu, X.; Wang, W.; Yoon, S.C.; Ni, X.; Heitschmidt, G.W. Detection of aflatoxin B1, (AFB1) in individual maize kernels using short wave infrared (SWIR) hyperspectral imaging. Biosyst. Eng. 2017, 157, 13–23. [Google Scholar] [CrossRef]
  29. Zhao, H.; Guo, B.; Wei, Y.; Zhang, B. Near infrared reflectance spectroscopy for determination of the geographical origin of wheat. Food Chem. 2013, 138, 1902–1907. [Google Scholar] [CrossRef] [PubMed]
  30. Li, Y.; Guo, Y.; Liu, C.; Wang, W.; Rao, P.; Fu, C.; Wang, S. SPA Combined with Swarm Intelligence Optimization Algorithms for Wavelength Variable Selection to Rapidly Discriminate the Adulteration of Apple Juice. Food Anal. Methods 2017, 10, 1965–1971. [Google Scholar] [CrossRef]
  31. Cheng, J.H.; Sun, D.W.; Pu, H. Combining the genetic algorithm and successive projection algorithm for the selection of feature wavelengths to evaluate exudative characteristics in frozen–thawed fish muscle. Food Chem. 2016, 197, 855–863. [Google Scholar] [CrossRef] [PubMed]
  32. Mishra, P.; Herrero-Langreo, A.; Barreiro, P.; Roger, J.M.; Diezma, B.; Gorretta, N.; Lleó, L. Hyperspectral to multispectral imaging for detection of tree nuts and peanut traces in wheat flour. J. Spectr. Imaging 2015, 4, 1–9. [Google Scholar] [CrossRef]
  33. Mishra, P.; Cordella, C.B.Y.; Rutledge, D.N.; Barreiro, P.; Roger, J.M.; Diezma, B. Application of independent components analysis with the jade algorithm and nirhyperspectral imaging for revealing food adulteration. J. Food Eng. 2016, 168, 7–15. [Google Scholar] [CrossRef]
  34. Lammertyn, J.; Nicolai, B.; Ooms, K.; De Smedt, V.; De Baerdemaeker, J. Non-destructive measurement of acidity, soluble solids, and firmness of Jonagold apples using NIR-spectroscopy. Trans. ASAE 1998, 41, 1089–1094. [Google Scholar] [CrossRef]
  35. Downey, G.; Sheehan, E.; Delahunty, C.; O’Callaghan, D.; Guinee, T.; Howard, V. Prediction of maturity and sensory attributes of Cheddar cheese using near-infrared spectroscopy. Int. Dairy J. 2005, 15, 701–709. [Google Scholar] [CrossRef]
Figure 1. Average absorbance spectra of pure whole wheat flour, peanut powder, and walnut powder.
Applsci 08 01076 g001
Figure 2. Performance of the best PLSR models for (a) peanut-contaminated flour and (b) walnut-contaminated flour applied on prediction sets based on full spectra (an enlarged view of the green circle part was shown in the green pane).
Applsci 08 01076 g002
Figure 3. Performance of the best multispectral PLSR models for (a) peanut-contaminated flour; (b) walnut-contaminated flour; and (c) combination of both peanut-contaminated flour and walnut-contaminated flour applied on prediction sets based on the corresponding selected feature wavelengths (an enlarged view of the green circle part was shown in the green pane).
Applsci 08 01076 g003
Figure 4. Distribution of feature wavelengths on average spectra curves of pure whole wheat flour as well as (a,b) peanut powder, (c,d) walnut powder, and combination of (e,f) both peanut and walnut powders samples (the wavelengths marked by the vertical green line were selected by UVE (a,c,e), while wavelengths marked by the vertical blue line were selected by SPA (b,d,f)).
Applsci 08 01076 g004
Figure 5. Histogram of frequency of predicted results of the pixels of peanut-contaminated samples in concentrations of 0% (a); 3% (b); and 10% (c) based on the multispectral model using the 16 wavelengths.
Applsci 08 01076 g005
Figure 6. Visualization maps of the corrected predicted values based on multispectral PLSR models for predicting (a) peanut contaminant using the 16 wavelengths; (b) walnut contaminant using the 14 wavelengths, and the general multispectral PLSR model for predicting (c) peanut and (d) walnut contaminant using the 17 wavelengths.
Applsci 08 01076 g006
Table 1. Partial least squares regression (PLSR) models for the detection of peanut-contaminated flour and walnut-contaminated flour based on full spectra. SNV: standard normal variate; 1st Der: Savitzky–Golay first derivative; Det: de-trending.
ContaminantPreprocessing MethodLVsCalibrationCross-ValidationPrediction
Rc2RMSEC (%)Rcv2RMSECV (%)Rp2RMSEP (%)
PeanutNone110.9890.3420.9860.3860.9850.398
SNV120.9960.2080.9920.2820.9920.287
1st Der100.9940.2590.9910.2980.9910.307
Det130.9950.2250.9920.2930.9930.267
SNV + 1st Der120.9970.1830.9940.2530.9930.272
SNV + Det120.9960.1950.9920.2850.9940.251
WalnutNone80.9980.1450.9980.1590.9970.180
SNV60.9980.1420.9980.1530.9970.168
1st Der80.9980.1590.9970.1750.9980.161
Det90.9980.1540.9970.1840.9960.198
SNV + 1st Der80.9990.1250.9980.1440.9980.153
SNV + Det100.9990.1190.9980.1450.9980.153
Table 2. Multispectral PLSR detection models for peanut-contaminated flour, walnut-contaminated flour and combination of them based on the corresponding selected wavelengths. RMSEC: root mean square error of calibration; RMSECV: root mean square error of cross-validation; RMSEP: root mean square error of prediction; SPA: successive projection algorithm; UVE: uninformative variable elimination.
ContaminantSelection MethodNumber of WavelengthsLVsCalibrationCross-ValidationPrediction
Rc2RMSEC (%)Rcv2RMSECV (%)Rp2RMSEP (%)
PeanutUVE16120.9910.3120.9890.3400.9880.348
SPA1090.9830.4220.9810.4470.9810.465
WalnutUVE1460.9980.1470.9980.1570.9970.170
SPA980.9920.2950.9910.3120.9900.324
Peanut + walnutUVE17100.9880.3450.9870.3600.9870.373
SPA1180.9640.6080.9610.6350.9600.645
Table 3. Selected feature wavelengths for the peanut-contaminated flour, walnut-contaminated flour, and a combination of both, based on UVE and SPA selection methods, respectively.
ContaminantSelection MethodNumber of WavelengthsWavelengths
PeanutUVE16994, 1022, 1057, 1151, 1182, 1196, 1200, 1203, 1207, 1249, 1368, 1386, 1421, 1485, 1521, 1545
SPA10988, 998, 1012, 1154, 1203, 1214, 1368, 1457, 1489, 1588
WalnutUVE141005, 1036, 1085, 1102, 1109, 1113, 1127, 1140, 1144, 1245, 1249, 1252, 1256, 1330
SPA91109, 1179, 1337, 1368, 1464, 1581, 1599, 1667, 1674
Peanut + walnutUVE171022, 1186, 1193, 1196, 1200, 1203, 1207, 1210, 1231, 1249, 1252, 1256 1372, 1390, 1606, 1613, 1638
SPA111064, 1127, 1203, 1365, 1368, 1464, 1574, 1581, 1585, 1606, 1624

