Abstract
This study presents theoretical investigations on the effectiveness criteria for piezoelectric energy harvesters (PEHs) under volume constraints. Firstly, the importance of the volume consideration is investigated. The powers of different PEHs of variant volumes are investigated under the same resonance frequency. It is found that the power output is strongly dependent on the volume of the transducer. Secondly, the impact of the mechanical damping, the electrical damping, the volume of motion, the normalized power to the volume, and the applied load resistance on the power output are investigated. The investigations are analyzed to find the optimized conditions of the applied load and the excitation frequency in order to optimize the power output under volume constraints. The proposed procedure for estimating the effectiveness is to compare the performance of the proposed PEHs to a rectangular-shaped PEH of the same volume. An optimized structure for a rectangular-shaped PEH to be used as the reference is investigated. The power output under the optimized conditions is derived. In order to estimate the effectiveness of the proposed PEHs, the average power over a band of frequencies from the proposed structure must be compared to the average power over the same band of frequencies from the optimized reference harvester.
1. Introduction
There have been many vibration energy harvesters proposed in the literature, either as only a single transducer or as a transducer with an additional structure to increase the operation frequency band, as reviewed in [1,2]. A highly flexible P(VDF-TrFE) (poly(vinylidenefluoride-co-trifluoroethylen)) film-based energy harvesting device on a PDMS (polydimethylsiloxane) substrate was introduced in [3]. The fabricated device powered a set of 27 light-emitting diodes (LEDs) after several minutes of charging. Some structures of transducers, such as the M-shaped transducer in [4], the zigzag-shaped in [5], the V-shaped in [6], and the T-shaped in [7], include empty gaps of a considerable volume compared with the volume of the active material in the ribs of the transducer. An L-shaped energy harvester was investigated in [8], where it was presented that the frequency range over which energy can be harvested from such structures was much larger than using a cantilever beam, but the power density was much lower. The considerable volume of the broadband structure lowers the power density of the energy harvesters. In [9], the performance of the array energy harvester was investigated in comparison with a single reference harvester of the same volume as the entire array. It was presented that the advantage of using the array over the reference harvester was very limited to a small additional bandwidth to the detriment of a large drop in the power output. In [10], a parametric study on piezoelectric energy harvesters considering a constant volume was introduced. In order to optimize the power output, the geometrical parameters (length, width, thickness, and tip mass) were recommended to be maximized within the available volume. In [11], the dynamic responses of a nonlinear vibration energy harvester (a flexible beam moving like an inverted pendulum between amplitude limiters) had multiple solutions, which correspond to various levels of power output. There have been a variety of broadband structures, which mostly require additional volume, cost, and a complicated structure compared with the single transducer. This highlights the necessity of finding the criteria to distinguish between the proposed structures. Possible metrics to appraise the proposed vibration energy harvesters will be reviewed in the following two sub-sections under two main categories: the efficiency and the figure of merit.
1.1. Expressions for Estimating Efficiency
In general, the efficiency η can be defined as the ratio between the harvested power and the input mechanical power. Richards et al. [12] presented an expression for the efficiency as the ratio between the power dissipated across the applied load resistor and the power dissipated by the input voltage across the total impedance of the entire circuit. They considered the Butterworth–van Dyke model for the circuit. The final presented expression for the efficiency was found to be dependent only upon the quality factor and the electromechanical coupling coefficient of the system at the resonance operation condition and an applied load resistance of 1/Cpωn. Shu and Lien [13], Kim et al. [14], and Yang et al. [15] worked on developing an expression for estimating the efficiency based on the same concept of the ratio between the output and the input. When unifying the symbols of the variables in the introduced equations, the derived formula from Kim et al. [14] was found to be very close to what introduced by Shu and Lien [13], see Table 1. The formula derived by Yang et al. [15] was found to be exactly the same as the one introduced by Kim et al. [14]. Shafer and Garcia [16] derived an expression for the average efficiency at the steady state by dividing the average harvested energy by the average change in the energy state of the system (heat losses + energy lost in damping + harvested energy). They reported that for the conservative case (heat losses = 0), their formula would be the same as the one proposed by Shu and Lien [13].

Table 1.
Expressions to estimate the efficiency of the energy harvesters.
Table 1 displays the reviewed equations introduced for the efficiency. The symbols of the variables in the displayed equations in the table are edited from than their original sources in order to use the same symbol for the same variable and hence, to avoid repeatedly defining the variables. This will help differentiate between the proposed equations for the efficiency. The efficiency in general was found to be dependent on the mechanical quality factor, the coupling coefficient, the ratio of the excitation frequency to the resonance frequency, and the ratio of the applied load resistance to the magnitude of 1/Cpωn.
The efficiency is one factor to appraise between proposed vibration-based generators, but it is not enough to decide the effectiveness, because other criteria, such as volume, were not included. The efficiency will not give an accurate evaluation, especially between the broadband energy harvesters, because the bandwidth was not included. Yang et al. [15] reported that the efficiency, as the ratio between the output and the input, is not sufficient to decide the effectiveness of piezoelectric energy harvesters. The input power differs depending on the phase and in general has no uniform definition. The output power of the vibration energy harvester is dependent on many factors and varies if the operation is on resonance or off resonance.
1.2. Figures of Merit
Roundy [17] defined a dimensionless figure of merit that was referred to as ‘effectiveness’ to compare between different designs of vibration energy harvesters. The transmission coefficient λ was used as another definition of the efficiency η. The transmission coefficient λ was defined as the output energy per cycle divided by the input energy per cycle. The maximum transmission coefficient λmax, at which maximum output energy was obtained, was found to be dependent only on the electromechanical coupling coefficient. The effectiveness figure of merit was dependent on the quality factor, the system coupling coefficient, the ratio of the actual density of the design to the baseline density, and the transmission coefficient ratio (λ/λmax). Feng and Hung [18] suggested the square power of the bandwidth multiplied by the maximum displacement under a given acceleration to appraise between vibration energy harvesters. The normalized power density (NPD) was suggested by Beeby et al. [19]. The NPD was defined as the power output normalized to the product of the second power of the input acceleration and the volume of the transducer. Liu et al. [20] mentioned that the power normalized mass acceleration (PNMA) was not proposed specifically in the literature; nevertheless, it was often used for appraising an energy harvester. The PNMA was based on the linear harvester’s property that the power is proportional to the product of the mass and the second power of the ambient acceleration. Ruan et al. [21] proposed a figure of merit (FoM) that was very close to the NPD but divided by the quality factor. They estimated the volume of the energy harvester, taking into account the volume of motion. The volume figure of merit (FoMV) was suggested by Mitcheson et al. [22]. It was based on the power output, the volume, the input acceleration, and the excitation frequency. The density of gold was taken as a reference. To include the bandwidth, they suggested another figure of merit (FoMBW), which is simply the FoMV multiplied by the fractional bandwidth (the ratio between the half-power bandwidth and the excitation frequency). A recent systematic figure of merit with bandwidth information (SFoMBW) for evaluating wideband vibration energy harvesters was introduced by Liu et al. [20]. The SFoMBW included the effectiveness, the normalized bandwidth (bandwidth/central frequency of the bandwidth), the mechanical quality factor, and the effective density (proof mass/entire volume). The effectiveness was defined as the ability to reach the maximum available power. Table 2 displays the formulas of the reviewed figures of merit. The symbols of the variables are edited from their original sources in order to be uniform for all the expressions.
Table 2.
Figures of merit to evaluate between the vibration energy harvesters.
The ultimate goal of vibration energy harvesting is to produce a standalone generator. Therefore, generating the maximum possible power from the available volume is a necessity. In this study, important criteria for the effectiveness of piezoelectric energy harvesters will be theoretically investigated in order to help develop an expression to appraise the different structures proposed for piezoelectric energy harvesters.
2. Discussion about the Importance of Volume Consideration
In order to investigate the importance of volume consideration, the outcome of four piezoelectric energy harvesters (PEHs) of different volumes were investigated (see Figure 1a). The PEHs A, B, C, and D are in the form of the bimorph piezoelectric cantilever displayed in Figure 1b, where l is the free length, h is the total thickness, and b is the width. The piezoelectric layer has a thickness of hp and a total length of lc. The density of the piezoelectric layers and the modulus of elasticity are ρp and Ep, respectively. The non-piezoelectric layer has a thickness of hs, a density of ρs, and a modulus of elasticity of Es. The ratio between the thickness of the middle layer and the thickness of the piezoelectric layer is hsp, where hsp = hs/hp. A tip mass of mt is attached at the end of the beam. The mass ratio between the tip mass and the mass of the entire beam is β, where β = mt/(ρslbhs + 2ρplbhp). The transversal displacement at the tip at any time t is given by x(t) for an input displacement of u(t).

Figure 1.
(a) The piezoelectric energy harvesters (PEHs) under investigation (b) Cantilevered bimorph piezoelectric energy harvester.
The material properties displayed in Table 3 are assumed for all the PEHs, where is the elastic compliance under constant electric field (Ep equals at the short circuit condition (resonance)), is the permittivity of the piezoelectric material at a constant stress, and d31 is the piezoelectric charge constant. The mechanical damping ratio is assumed to be 0.01.
Table 3.
Material properties of the bimorph piezoelectric energy harvesters.
The PEHs A, B, C, and D have different geometrical parameters (dimensions and tip masses). However, it is taken into account that the geometrical parameters are tuned in order for all the PEHs have their first eigenfrequency at 154.8 Hz. The geometrical parameters for the PEHs are displayed in Table 4.
Table 4.
Geometrical parameters of the PEHs.
The two governing equations of the PEHs according to [23] are as follows:
where ceq is the equivalent stiffness of the beam, meq is the equivalent mass of both the beam and the tip mass, dm is the mechanical damping coefficient, R is the applied load resistance, vp is the output voltage, α is the equivalent coupling factor [N/V or C/m], and Cp is the capacitance of the two piezoelectric layers.
The transfer function between the input displacement and the output displacement of the bimorph piezoelectric energy harvester is obtained as expressed by Equation (3a). At excitation frequency around the first eigenfrequency, the transfer function is obtained as expressed by Equation (3b). The power output of the bimorph piezoelectric energy harvester are obtained by Equation (4), as derived in [10].
where ζm is the mechanical damping ratio, ωn is the resonance frequency, and Ω is the excitation frequency.
There are three significant applied load resistances as investigated in [10]. Each of the three load resistances provides the maximum power capability at a corresponding excitation frequency, as displayed in Table 5. The optimal load resistance at resonance frequency (Rop_res) and at anti resonance frequency (Rop_anti) provide the same maximum power output at constant input acceleration. The applied load resistance of Rd results in the maximum electrical damping to the circuit. It is worth mentioning that the maximum power output occurs at ωd not ωn when the applied load is Rd.
Table 5.
Significant applied load resistances and corresponding frequencies for maximum power.
The electrical damping due to the effect of the piezoelectric energy harvesting can be represented as de, where de = 2ζemeqωn and ζe is the electrical damping ratio. The equation of motion of the beam can be rewritten as the following:
By taking the Laplace transform and replacing the excitation frequency by the resonance frequency in Equation (5), the transfer function Hxu at resonance is obtained in terms of the mass ratio between the tip mass and the mass of the beam, the electrical damping ratio, and the mechanical damping ratio, as expressed by Equation (6).
By equating Equation (3b) with Equation (6), the electrical damping ratio as a function of the system parameters is obtained as follows:
Figure 2 displays the impact of the applied load resistance normalized to Rd on the electrical damping ratio. The properties of the PEH considered for the investigation are imported from Table 3. The damping ratio is assumed to be 0.01 (as measured experimentally in [10]). The free length is 39.11 mm. The maximum electrical damping occurs at R/Rd = 1 (which means R = Rd).
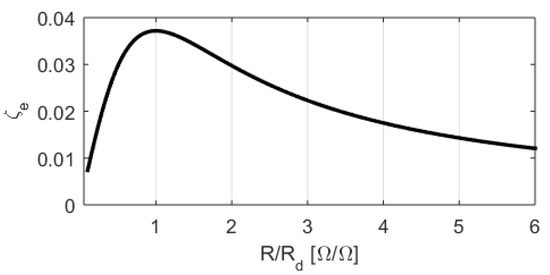
Figure 2.
The impact of the applied load R normalized to Rd on the electrical damping ratio ζe.
For investigating the power output of the PEHs A, B, C, and D, the applied load resistance is the corresponding optimal load resistance Rop_res for each of them at resonance operation condition and is 1.86 kΩ, 0.811 kΩ, 1.62 kΩ, and 0.811 kΩ, respectively. The PEHs are assumed to be excited by a constant input displacement of 0.8 µm. Figure 3 displays the power output of the four piezoelectric energy harvesters. The PEH A, with the largest geometrical parameters, supplies the highest power output. The power output of B, with no tip mass and a reduced thickness, supplies a much lower power output than A. The power output of C is half of the power output of B (C has the same geometrical parameters as “B” but half of its width). The power output of D is much less than other PEHs. Despite the fact that the four PEHs are tuned to the same resonance frequency, there is a significant difference in the maximum power output between them. This highlights the importance of volume consideration for a better estimation of the effectiveness of the developed structures and the broadband techniques, which require a considerable volume compared to the volume of the transducer.

Figure 3.
Power output of the four PEHs with different geometries, tuned to the same resonance.
For a more accurate estimation of the effectiveness of PEHs, the total occupied volume must be considered, including the volume of motion, not only the volume of the transducer. The tip displacement is an important factor to investigate in order to calculate the volume of motion.
3. Tip Displacement
The volume of motion of a cantilever vibrating around the first eigenfrequency is calculated as the surface area multiplied by twice the transversal displacement at the tip. Figure 4a,b display the impact of the applied load resistance and the excitation frequency on the power output and the tip displacement, respectively (ζm is 0.01 as experimentally measured in [10]). The maximum tip displacement occurs at resonance frequency (ωn) with a zero applied load resistance (no electrical damping at all). An increase in the applied load results in a decrease in the tip displacement. The minimum tip displacement is found to occur at an applied load of Rd and an excitation frequency of ωd. An applied load larger than Rd and an excitation frequency larger than ωd result in the tip displacement increasing again. The empirical maximum tip displacement is considered at resonance and the optimal load resistance Rop_res, because the zero applied load resistance of the maximum possible tip displacement means that there is no applied application.
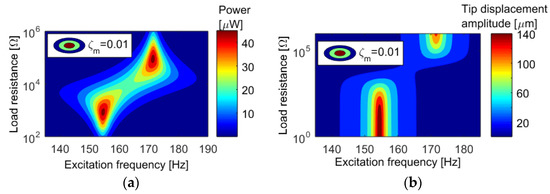
Figure 4.
The impact of the applied load resistance and excitation frequency on (a) the output power (b) the tip displacement.
The maximum tip displacement xmax can be calculated by multiplying the input displacement by the magnitude of the transfer function Hxu at resonance, as displayed by Equation (8). The minimum tip displacement is referred to as xmin and can be calculated as displayed by Equation (9).
4. Normalized Power to the Volume
In order to improve the effectiveness of PEHs, the maximum possible power per unit volume must be generated. For this purpose, the normalized power to the volume is studied. First, the normalized power to the volume of the beam is investigated. The volume of the beam is Vb = lbh. Then, the impact of the volume of the tip mass is investigated. The resonance frequency is kept constant by increasing the total thickness simultaneously with the tip mass. The volume of the tip mass is Vmt = lmtbmthmt, where lmt is the length of the tip mass, bmt is the width of the tip mass, and hmt is the thickness of the tip mass. Finally, the normalized power to the total occupied volume is investigated by taking into account the volume of motion. The volume of motion is expressed as Vmotion = 2lbx, where x is the tip displacement (xmax and xmin are considered for the investigation). The properties of the PEH B from Figure 1 are considered for these.
Figure 5 displays the normalized power to the volume of the beam (NPVb) at two operating conditions: the corresponding Rop_res at excitation frequency of ωn and the corresponding Rd at excitation frequency of ωd. The resonance frequency is kept constant at 155 Hz, while the width is varied. The total thickness is simultaneously varied with the free length (no tip mass). For a given material and the same mass ratio between the tip mass and the mass of the beam, the normalized power to the volume of the beam is constant at the corresponding Rd and ωd or the corresponding Rop and ωn.

Figure 5.
Normalized power to the volume of the beam (fn constant at 155 Hz, free length varies from 4.41 to 9.62 cm for the corresponding total thickness varies from h = 0.08 to 0.38 cm, respectively, constant mass ratio at β = 0, mechanical damping ratio of ζm = 0.01, and input displacement of u = 0.8 µm).
The normalized power to the volume of the beam and the tip mass (NPVb+mt) is investigated. The volume of the tip mass varies according to the density of its material, and accordingly, the normalized power NPVb+mt varies depending on the density of the tip mass (ρmt). The investigations include variant densities of the tip mass. The resonance frequency is kept constant at 155 Hz by varying the total thickness simultaneously with the mass ratio between the tip mass and the mass of the beam. The free length is constant at 8.49 cm. The investigations will consider two operating conditions: the corresponding Rop and ωn and the corresponding Rd and ωd.
Figure 6 displays the NPVb+mt. If the density of the tip mass is less than the average density of the bimorph piezoelectric cantilever (average density ρav = (2hpρp + ρshs)/(2hp + hs)), an increase in the tip mass results in a decrease in the NPVb+mt, despite the fact that the resonance frequency is being kept constant and the total thickness is simultaneously increasing with the increase of the mass ratio. If the density of the tip mass is in the range of the average density, the NPVb+mt increases very slightly with a large increase in the tip mass and simultaneously in the total thickness. If the density of the tip mass is much greater than the average density, a simultaneous increase in the tip mass with the total thickness results in an increase in the NPVb+mt.

Figure 6.
Normalized power to the volume of the beam and the tip mass (NPVb+mt) at (a) the corresponding Rop_res and ωn (b) the corresponding Rd and ωd (fn constant at 155 Hz, free length is 9.62 cm, mass ratio β varies from 0 to 0.52 for the corresponding total thickness varies from 0.382 to 0.682 cm, respectively, ζm = 0.01, and u = 0.8 µm).
A simultaneous increase in the length and the thickness optimizes the power output under volume constraints compared with a simultaneous increase in the mass ratio and the thickness when the tip mass is made out of a less dense material. Even if the tip mass is made out of a material of a density in the range of the average density of the beam, the advantage of an increase in the tip mass is not significant. Hence, in order to optimize the PEHs under a constant volume, the tip mass must be made out of highly dense materials.
Figure 7 displays the normalized power to the total occupied volume NPVTotal (of the beam, the tip mass and the motion). The density of the tip mass is assumed to be 20 g/cm3 as the densest materials currently are in this range. At a very low input excitation level (u = 0.8 µm), the NPVTotal at the corresponding Rop and ωn is larger than that at the corresponding Rd and ωd, while at a relatively larger input excitation level (u = 180 µm), the NPVTotal at the corresponding Rd and ωd is larger than that at the corresponding Rop and ωn. Although the generator at Rop and ωn supplies higher power output than at Rd and ωd, it does not necessarily mean the maximum generated power from a constant predefined volume if the volume of motion is taken into account. The minimum tip displacement, as investigated before, occurs at an applied load resistance of Rd and an excitation frequency of ωd. In all investigations, the normalized power (NPVb, NPVb+mt, or NPVTotal) is constant at variant widths if other geometrical parameters (the free length, the total thickness, and the mass ratio) are kept constant.
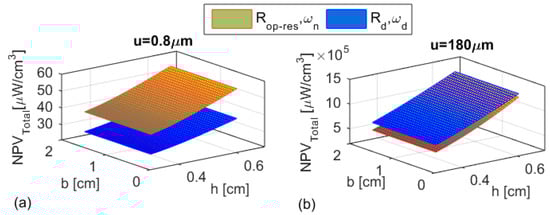
Figure 7.
Normalized power to the total occupied volume (beam, tip mass, and motion) at input displacement of (a) u = 0.8 µm (b) u = 180 µm (fn constant at 155 Hz, free length of 9.62 cm, mass ratio varies from 0 to 0.52 for the corresponding total thickness from 0.382 to 0.682 cm, respectively, and ζm = 0.01).
5. Mechanical Quality Factor
The mechanical quality factor Qm (Qm = 1/2 ζm) is important to investigate. An increase in Qm results in an increase in the tip displacement, which means an increase in the volume of motion. The second issue is that the half-power bandwidth is dependent on Qm. The investigations are carried out considering the properties of the PEH A in Figure 1. Two operating conditions are considered for the investigations: the corresponding Rop_res and ωn (Rop_res is dependent on ζm), and Rd and ωd (Rd is independent on ζm). Figure 8a displays the impact of the quality factor on the transfer function between the tip displacement and the input displacement. At the corresponding optimal load resistance Rop_res, the transfer function Hxu is directly proportional to Qm. At an applied load of Rd, the increase in the transfer function is very slight for a large increase in Qm. Figure 8b displays the impact of the quality factor on the power output. At the corresponding Rop, the power output is directly proportional to Qm. At an applied load resistance of Rd, the increase in the power output is very slight for a large increase in Qm.
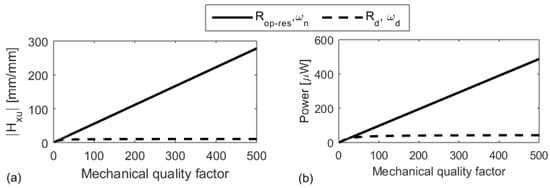
Figure 8.
The impact of the quality factor on (a) the transfer function and (b) the power output at input excitation level of u = 0.8 µm.
The power output at different quality factors is shown in Figure 9. At the corresponding Rop_res, a decrease in Qm to the half causes a reduction in the power output to the half. For this significant drop in the power output, there is a small increase in the half-power bandwidth. At an applied load of Rd, the decrease in the power output due to a decrease in Qm is less than the decrease of the power output at the corresponding Rop. At Rd, there is no increase in the half-power bandwidth for a decrease in Qm. At low mechanical damping ratios, the power peak is sharp at Rop_res and ωn, while at Rd and ωd the peak of the power output is not as sharp as at Rop_res and ωn. The power output at Rd and ωd is more consistent.

Figure 9.
Power output at different quality factors at the corresponding Rop_res (solid curves) and at Rd (dashed curves).
6. Discussion about the Applied Load Resistance
The maximum power is generated at an excitation frequency that equals the resonance frequency and at an applied load resistance that equals the magnitude of the internal impedance [10]. By replacing the excitation frequency with the resonance frequency in the equation of the power output (Equation (4)), the power output at resonance is obtained as follows:
By replacing the applied load R in Equation (10) by the optimal load resistance Rop_res, the maximum power is obtained as expressed by Equation (11). In this equation, the maximum power (power output at ωn and the corresponding Rop_res) is independent of the mechanical damping ratio (ζm). This can be explained by the fact that ζm is implicitly included in the optimal load resistance where Rop_res = f(ζm). By multiplying the maximum power by Rop_res, the magnitude of PmaxRop_res, which equals the square power of the output voltage, is independent of the mechanical damping ratio at the corresponding Rop_res.
Figure 10 displays the impact of the load resistance on the power output at resonance. Different mechanical damping ratios are considered for the investigation. An increase in the mechanical damping ratio results in an increase in the optimal load resistance and a decrease in the maximum power by the same magnitude so that the magnitude of PmaxRop_res is constant at different mechanical damping ratios.
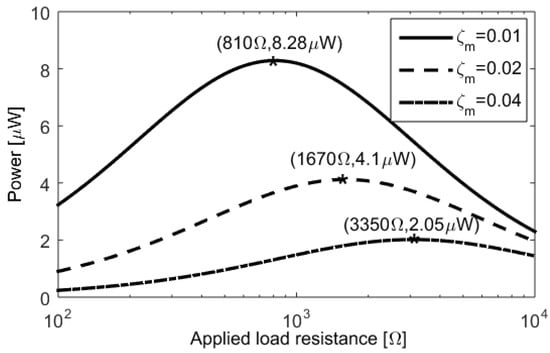
Figure 10.
Output power at different mechanical damping ratios [Rop_resPmax = (810 Ω × 8.28 μW) = (1670 Ω × 4.1 μW) = (3350 Ω × 2.05 μW)].
The magnitude of Rop_res equals the magnitude of the internal impedance of the PEH and is therefore dependent on multiple parameters, such as the mechanical damping, the mass, the coupling factor, the material properties, the geometrical parameters, and the resonance frequency. At very low mechanical damping, the Rop_res will accordingly be very low. During the use of the PEH in the real environment, the mechanical damping may differ, and the applied load will thus no longer be optimal. If the excitation frequency is deviated from the resonance frequency, the internal impedance will differ, and accordingly, the pervious optimal load resistance at resonance will no longer be the optimal load for the new conditions. This means that applying a load resistance of Rop_res limits the applicability of the proposed piezoelectric energy harvester.
The Rd is obtained by multiplying (1/Cp) by (1/ωd). The change in the value (1/ωd) is negligible in comparison with the value (1/Cp). This means that the value of Rd is less sensitive to the excitation frequency than the value of Rop_res. An applied load resistance of Rd is of more robustness than Rop_res, especially for a wide band of excitation frequencies and broadband piezoelectric energy harvesters. The maximum harvested power when the applied load is Rd and the excitation frequency is ωd is obtained as expressed by Equation (12) by substituting Rd and ωd in Equation (4) of the power output.
7. Optimized Rectangular-Shaped Piezoelectric Energy Harvester
The major proposed structure geometry for PEHs is the uniform, cross-sectional, rectangular-shaped beam, especially in the studies that conducted experimental investigations [24,25,26]. The uniform rectangular-shaped cantilever is easy to model and to manufacture, in addition to being easy to apply. The rectangular-shaped piezoelectric energy harvester is selected in this study to be the reference for evaluating the effectiveness of PEHs.
In the investigations on the normalized power to the total occupied volume, the volume of the tip mass was considered as only the volume occupied by its material. However, there can be other unused volume according to the position of the tip mass on the beam, as displayed in Figure 11. This volume is relatively large compared to the volume of the transducer, which is the main part for converting vibration energy to electrical energy. If this volume is taken into account, the normalized power to the total occupied will be very low. Therefore, this position of the mass above the beam is not recommended for the optimized structure.
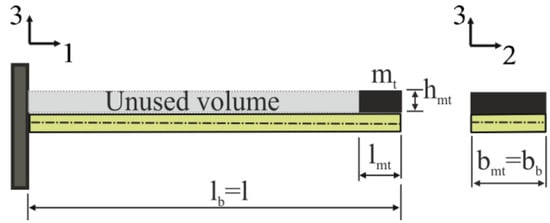
Figure 11.
Unused volume according to the position of the tip mass.
Another possibility is to uniformly distribute the tip mass along the surface area of the beam so that its volume is lbbbhmt. But, this position will not also optimize the structure, because instead of fixing a uniformly distributed mass above the beam, this distributed mass can be added to the middle layer, which will increase the total thickness of the beam and improve the power output. Therefore, the uniformly distributed mass on the surface of the beam does not optimize the structure under volume constraints. For these reasons, the optimized structure is suggested as displayed in Figure 12. The width of the tip mass equals the width of the beam in order to avoid occupying additional volume in the 2-direction. The thickness of the tip mass equals the thickness of the beam in order to avoid occupying additional volume in the 3-direction.
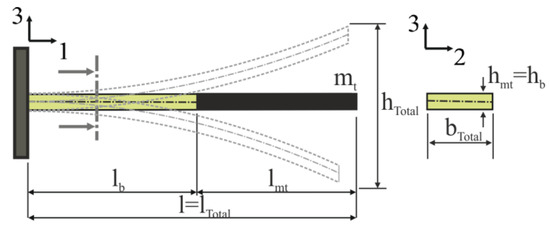
Figure 12.
Optimized structure of a rectangular-shaped cantilevered PEH.
The ratio of the length of the tip mass to the length of the beam is determined according to some assumptions regarding the material of the middle layer and the piezoelectric layers. Most piezoelectric ceramics are of a density in the range of 8 g/cm3. According to [10], in order to optimize the power output, highly dense materials are recommended for the middle layer. Copper and steel are suggested for the middle layer, as they are relatively highly dense materials. Hence, the density of the middle layer is approximately 8.3 g/cm3. Accordingly, the average density of the beam (the middle layer and the two piezoelectric layers) is approximately 8 g/cm3. In order to optimize the power output under a predefined volume, the tip mass must be made out of a very highly dense material, much higher than the average density. The densest materials currently known are in the range of 20 g/cm3 (which is approximately 2.5 times the average density of the beam). Under these assumptions, and according to the suggested optimized structure in Figure 12, the mass ratio is suggested to be 2.5. The tip mass, if the mass ratio is 2.5, occupies approximately the same volume as the beam. This means that half of the beam is a bimorph piezoelectric transducer and the other half is the tip mass (l = lb + lmt).
According to the previous investigation, the parameters of the optimized rectangular-shaped geometry are as follows: ρmt = 20 g/cm3, bmt = bb, hmt = hb, lmt = lb, and β = 2.5. A high mechanical quality factor is recommended for improving the power output. However, a very high-quality factor of more than 100 will not significantly influence the normalized power to the total occupied volume. This is due to the increase in the transversal displacement and accordingly, the volume of motion. The mechanical quality factor is suggested to be 100 for the optimized structure so that the mechanical damping ratio is ζm = 0.005.
For optimization of the power output, it is recommended that the piezoelectric energy harvester be applied to a load resistance in the range of Rd and an excitation frequency of ωd. For values of the mass ratio around or larger than 2.5, the magnitude of [(0.375 + β)/(0.2357 + β)]2 tends to approximately equal 1. By substituting the mass ratio of β = 2.5 in Equation (11), the power output at Rd and ωd is obtained as expressed by Equation (13a), which can be rearranged to Equation (13b). The power output at these conditions is directly proportional to the square power of the coupling factor and inversely proportional to the capacitance. The optimized PEH is simple and has many possible applications. For example, the optimized PEH can be considered for the designed and fabricated PEH in [27] and the PEHs fabricated in [21].
Because the volume of motion is important to consider for optimization of the power normalized to the total occupied volume, an expression for the transfer function at Rd and ωd is derived. The transfer function between a mass ratio of β = 2.5, an applied load resistance of Rd, and an excitation frequency of ωd is obtained as follows:
8. Developing a Methodology to Evaluate the Effectiveness of Piezoelectric Energy Harvesters
The effectiveness of PEHs can be defined as the ability to reach the maximum available power according to Liu et al. [20]. The investigations showed how important the volume criterion is in piezoelectric energy harvesters. Hence, the effectiveness must be estimated based on the entire volume occupied by the proposed structure not only the volume of the transducer. The bandwidth of PEHs is first discussed. Then, a procedure on how to estimate the effectiveness is suggested.
For broadband piezoelectric energy harvesters, the average power as a term is more convenient than the maximum power due to the variation in the power output at different excitation frequencies. For a linear transducer, the average power for a harmonic excitation frequency varying from Ωmin to Ωmax can be expressed according to [20] by Equation (15).
where Ωmin and Ωmax are the minimum and the maximum frequencies in the bandwidth of the PEH, respectively.
The bandwidth of vibration energy harvesters can be defined as the band of frequencies over which a specific, steady level of power can be supplied to a certain value/range of the applied load resistance. This means that, for the same energy harvester, there are infinite values of bandwidth and a corresponding average power for each bandwidth. It can be seen in Figure 13 that the average power over the bandwidth BW1 is less than the peak power but larger than the average power over the bandwidth BW2. Multiplying the bandwidth BW1 by its corresponding average power gives a different result than multiplying BW3 by its corresponding average power, although they are of the same PEH. Hence, multiplying the power by the bandwidth in one formula will not give an accurate estimation of the effectiveness.
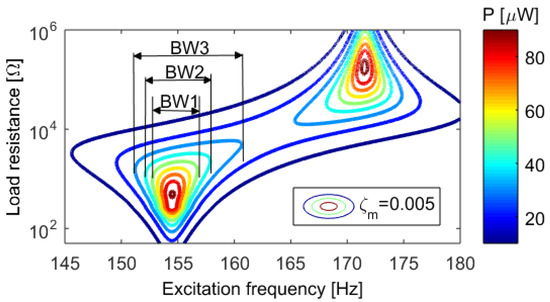
Figure 13.
Different bandwidths at different power levels.
The power output and the bandwidth are two different factors. All bandwidths and their corresponding average power from the same energy harvester are options for the user. It depends firstly on the conditions of the working environment, such as the band within which the excitation frequency varies, and secondly, on the power requirements for the application; for example, if the power requirement is very low, an average power sufficient for the application can be generated over a very wide bandwidth. When proposing a novel PEH, it is important to calculate the average power and clearly state the band of frequencies over which this power is generated. The evaluation of the proposed PEHs is based on how effective they are in generating the maximum power when compared to a single piezoelectric energy harvester of the entire occupied volume (see Figure 14).

Figure 14.
Broadband (BD) energy harvester versus a single reference harvester.
It is suggested that the average power over a band of frequencies (the expected bandwidth) be compared to the average power output of a solid, single PEH of the same entire volume and over the same band of frequencies (see Equation (16)).
where eeff is the effectiveness of the proposed PEH, Pav is the average power output of the proposed PEH over a range of frequencies from Ωmin to Ωmax, and Pref_av is the average power output of the solid, single PEH over the same range of frequencies.
The entire volume of the proposed PEH (referred to as VPEH) must be estimated. The entire volume occupied by the optimized rectangular-shaped PEH is referred to as Vref and is expressed by Equation (17).
where xref is the tip displacement at the conditions of the optimized power output (an applied load resistance of Rd, excitation frequency of ωd, and a mass ratio of the tip mass to the mass of the beam of 2.5. Under these conditions, an approximation for the tip displacement can be obtained as expressed by Equation (18). This equation is obtained by multiplying the input displacement by the magnitude of the transfer function at the conditions of the optimized power output.
The input excitation, as well as the piezoelectric properties, is assumed to be the same for the comparison between the reference PEH and the novel PEH under evaluation. As the volume of the novel PEH is known, the dimensions of the rectangular-shaped reference PEH can be obtained by taking into account the thin-beam conditions. The rectangular PEH is tuned to the same resonance frequency as the novel PEH by adjusting the ratio of the thickness of the middle layer and the thickness of the piezoelectric layers. This ratio does not have a significant influence on the power output if the resonance frequency and the mass of the beam are excluded, according to investigations in [10]. After obtaining the geometrical parameters of the reference PEH, the maximum possible optimized power of the entire volume can be obtained. The average power output over a band of frequencies from Ωmin to Ωmax can be also obtained. The effectiveness of the structure proposed for PEHs can be determined by comparing its performance to the reference PEH of the same volume.
9. Conclusions
Important issues for the effectiveness of the proposed piezoelectric energy harvesters were investigated. The volume criterion and the normalized power to volume were investigated. Volume is a crucial issue in piezoelectric energy harvesters, not only because the PEHs are targeting applications of relatively low scale, but also because the power output is strongly dependent on the volume of the transducer. At the end, the major objective in energy harvesting is to generate the maximum possible power over a wide band of frequencies from a predefined constant volume. One possibility has been suggested to evaluate the effectiveness of the developed structures for the PEHs by comparing their performance to a solid, rectangular-shaped PEH of the same entire volume (the reference harvester).
An optimized structure for a rectangular PEH to be used as the reference was introduced. The optimized conditions of the applied load resistance and excitation frequency were discussed. The power output under the optimized conditions was derived. The tip displacement was important for estimating the volume of motion. The transfer function between the tip displacement and the input displacement was derived under the optimized conditions. Under the same materials and input excitation, if the reference harvester generates higher power over a wider band of frequencies than the proposed, novel PEH, the effectiveness of the proposed PEH will be very low and should not be recommended. In general, it is required to consider the volume for the effectiveness of the proposed structures in the PEHs. It is important to optimize the structures of the piezoelectric energy harvesters under volume constraints in order to be more effective.
Author Contributions
N.A. and J.T. conceptualized this research on studying the effectiveness of piezoelectric energy harvesters under volume constraints. N.A. worked on the methodology, derived the model, developed the software, carried out the investigations for achieving the objective of the research, and conducted the formal analysis. J.T. conducted the project administration. Both authors discussed the model derivation and the analysis of the investigations during this study. The original draft of the manuscript was written by N.A. and reviewed by J.T.
Funding
This research was funded by the Marie Curie program through the ITN ANTARES project, grant number GA 606817.
Acknowledgments
The authors gratefully acknowledge the European Commission for its support of the Marie Curie program, including the ITN ANTARES project GA 606817.
Conflicts of Interest
The authors declare no conflict of interest. The founding sponsors had no role in the design of the study; in the collection, analyses, or interpretation of data; in the writing of the manuscript; or in the decision to publish the results.
References
- Twiefel, J.; Westermann, H. Survey on broadband techniques for vibration energy harvesting. J. Intell. Mater. Syst. Struct. 2013, 24, 1291–1302. [Google Scholar] [CrossRef]
- Zhu, D.; Tudor, M.J.; Beeby, S.P. Strategies for increasing the operating frequency range of vibration energy harvesters: A review. Meas. Sci. Technol. 2010, 21, 022001. [Google Scholar] [CrossRef]
- Kim, S.; Towfeeq, I.; Dong, Y.; Gorman, S.; Rao, A.; Koley, G. P(VDF-TrFE) Film on PDMS Substrate for Energy Harvesting Applications. Appl. Sci. 2018, 8, 213. [Google Scholar] [CrossRef]
- Leadenham, S.; Erturk, A. M-shaped asymmetric nonlinear oscillator for broadband vibration energy harvesting: Harmonic balance analysis and experimental validation. J. Sound Vib. 2014, 333, 6209–6223. [Google Scholar] [CrossRef]
- Karami, M.A.; Inman, D.J. Analytical Modeling and Experimental Verification of the Vibrations of the Zigzag Microstructure for Energy Harvesting. J. Vib. Acoust. 2011, 133, 11002. [Google Scholar] [CrossRef]
- El-Hebeary, M.M.R.; Arafa, M.H.; Megahed, S.M. Modeling and experimental verification of multi-modal vibration energy harvesting from plate structures. Sens. Actuators A Phys. 2013, 193, 35–47. [Google Scholar] [CrossRef]
- Siddique, A.R.M.; Mahmud, S.; van Heyst, B. Energy conversion by ‘T-shaped’ cantilever type electromagnetic vibration based micro power generator from low frequency vibration sources. Energy Convers. Manag. 2017, 133, 399–410. [Google Scholar] [CrossRef]
- Liu, D.; Al-Haik, M.; Zakaria, M.; Hajj, M.R. Piezoelectric energy harvesting using L-shaped structures. J. Intell. Mater. Syst. Struct. 2017, 29, 1045389X1773092. [Google Scholar] [CrossRef]
- Aboulfotoh, N.; Twiefel, J. A Study on Bandwidth and Performance Limitations of Array Vibration Harvester Configurations. Energy Harvest. Syst. 2017, 4, 47–56. [Google Scholar] [CrossRef]
- Aboulfotoh, N.; Twiefel, J. On developing an optimal design procedure for a bimorph piezoelectric cantilever energy harvester under a predefined volume. Mech. Syst. Signal Process. 2018, 106, 1–12. [Google Scholar] [CrossRef]
- Wolszczak, P.; Łygas, K.; Litak, G. Dynamics identification of a piezoelectric vibrational energy harvester by image analysis with a high speed camera. Mech. Syst. Signal Process. 2018, 107, 43–52. [Google Scholar] [CrossRef]
- Richards, C.D.; Anderson, M.J.; Bahr, D.F.; Richards, R.F. Efficiency of energy conversion for devices containing a piezoelectric component. J. Micromech. Microeng. 2004, 14, 717–721. [Google Scholar] [CrossRef]
- Shu, Y.C.; Lien, I.C. Efficiency of energy conversion for a piezoelectric power harvesting system. J. Micromech. Microeng. 2006, 16, 2429–2438. [Google Scholar] [CrossRef]
- Kim, M.; Dugundji, J.; Wardle, B.L. Efficiency of piezoelectric mechanical vibration energy harvesting. Smart Mater. Struct. 2015, 24, 55006. [Google Scholar] [CrossRef]
- Yang, Z.; Erturk, A.; Zu, J. On the efficiency of piezoelectric energy harvesters. Extrem. Mech. Lett. 2017, 15, 26–37. [Google Scholar] [CrossRef]
- Shafer, M.W.; Garcia, E. The Power and Efficiency Limits of Piezoelectric Energy Harvesting. J. Vib. Acoust. 2017, 136, 021007. [Google Scholar] [CrossRef]
- Roundy, S. On the Effectiveness of Vibration-based Energy Harvesting. J. Intell. Mater. Syst. Struct. 2005, 16, 809–823. [Google Scholar] [CrossRef]
- Feng, G.; Hung, J. Optimal FOM Designed Piezoelectric Microgenerator with Energy Harvesting in a Wide Vibration Bandwidth. In Proceedings of the 2nd IEEE International Conference on Nano/Micro Engineered and Molecular Systems, Bangkok, Thailand, 16–19 January 2007; pp. 511–514. [Google Scholar]
- Beeby, S.P.; Torah, R.N.; Tudor, M.J.; Glynne-Jones, P.; O’Donnell, T.; Saha, C.R.; Roy, S. A micro electromagnetic generator for vibration energy harvesting. Micromach. Microeng. 2007, 17, 1257–1265. [Google Scholar] [CrossRef]
- Liu, W.Q.; Badel, A.; Formosa, F.; Wu, Y.P. A new figure of merit for wideband vibration energy harvesters. Smart Mater. Struct. 2015, 24, 125012. [Google Scholar] [CrossRef]
- Ruan, J.J.; Lockhart, R.A.; Janphuang, P.; Quintero, A.V.; Briand, D.; de Rooij, N. An automatic test bench for complete characterization of vibration-energy harvesters. IEEE Trans. Instrum. Meas. 2013, 62, 2966–2973. [Google Scholar] [CrossRef]
- Mitcheson, B.P.D.; Yeatman, E.M.; Rao, G.K.; Holmes, A.S.; Green, T.C. Energy Harvesting From Human and Machine Motion for Wireless Electronic Devices. Proc. IEEE 2008, 96, 1457–1486. [Google Scholar] [CrossRef]
- Hagood, N.; Chung, W.; von Flotow, A. Modelling of Piezoelectric Actuator Dynamics for Active Structural Control. J. Intell. Mater. Syst. Struct. 1990, 1, 327–354. [Google Scholar] [CrossRef]
- Kim, H.S.; Kim, J.J.; Kim, J.J. A Review of Piezoelectric Energy Harvesting Based on Vibration. Int. J. Precis. Eng. Manuf. 2011, 12, 1129–1141. [Google Scholar] [CrossRef]
- Elvin, N.; Erturk, A. Advances in Energy Harvesting Methods; Springer Science & Business Media: New York, NY, USA, 2013. [Google Scholar]
- Bowen, C.R.; Topolov, V.Y.; Kim, H.A. Modern Piezoelectric Energy-Harvesting Materials; Springer International Publishing: Cham, Switzerland, 2016. [Google Scholar]
- Kim, M.; Dugundji, J.; Wardle, B.L. Optimal Design of Piezoelectric Materials and Devices for Energy Harvesting. J. Korean Phys. Soc. 2013, 62, 1689–1695. [Google Scholar] [CrossRef]
© 2018 by the authors. Licensee MDPI, Basel, Switzerland. This article is an open access article distributed under the terms and conditions of the Creative Commons Attribution (CC BY) license (http://creativecommons.org/licenses/by/4.0/).