Article

A Big Data and Time Series Analysis Technology-Based Multi-Agent System for Smart Tourism

1
Graduate Institute of Automation Technology, National Taipei University of Technology, Taipei 10608, Taiwan
2
Department of Information and Communication, St. John’s University, New Taipei City 25135, Taiwan
*
Author to whom correspondence should be addressed.
Appl. Sci. 2018, 8(6), 947; https://doi.org/10.3390/app8060947
Submission received: 28 April 2018 / Revised: 1 June 2018 / Accepted: 4 June 2018 / Published: 7 June 2018
(This article belongs to the Special Issue Selected Papers from the 2017 International Conference on Inventions)

Abstract

:
This study focuses on presenting a development trend from the perspective of data-oriented evidence, especially open data and technologies, as those numbers can verify and prove current technology trends and user information requirements. According to the practical progress of Dr. What-Info I and II, this paper continues to develop Dr. What-Info III. Moreover, big data technology, the MapReduce paralleled decrement mechanism of the cloud information agent CEOntoIAS, which is supported by a Hadoop-like framework, Software R, and time series analysis are adopted to enhance the precision, reliability, and integrity of cloud information. Furthermore, the proposed system app receives a collective satisfaction score of 80% in terms of Quesenbery’s 5Es and Nielsen ratings. In addition, the verification results of the interface design show that the human-machine interface of our proposed system can meet important design preferences and provide approximately optimal balance. The top-n experiment shows that the top-5 recommendations would be better for solving the traditional tradeoff between output quality and processing time. Finally, the system effectiveness experiments indicate that the proposed system receives an overall up-to-standard function rate of 87.5%, and such recommendations provide this system with high information correctness and user satisfaction. Although there is plenty of room for improvement in experience, the feasibility of this service architecture has been proven.

1. Introduction

According to the Smart Tourism Report 2015, as based on the tourism statistics of the Taiwanese Government and released by the United Daily News, tourism has become one of the fastest-growing economic sources in the world, accounting for 10% of the global GDP and generating 277 million jobs. In the face of the fast-growing number of international tourists, which is expected to exceed 10 million, Taiwan must consider a complete solution for smart tourism according to its advantages in the ICT industries, which feature high added value and global exemplary effects. This is the greatest motivation for this paper, to explore smart tourism.
Big data refers to information that is so massive it is impossible to manually obtain, manage, process, or summarize it into information interpreted by human beings within an appropriate period. Therefore, it is almost impossible to process big data with most traditional database management systems; instead, it must be processed by “software that can simultaneously operate on more than tens of, hundreds of, and even thousands of servers [1,2].” Huang [3] argued that data periods are not necessarily as massive as TB, PB, or EB (exabytes, EB = 1018 = 1000 PB, petabytes = 1000 TB, terabytes = 1000 GB, gigabytes), but must be in a “complete,” “relative” database, or must be processed and analyzed into useful information to show the relationship among the information segments. This is the main reason why this study adopts time-series analysis [4,5] for relevant analysis. Thus, the greatest challenge for this paper is to support the Dr. What-Info III system, which is based on big data technology, and to determine the feasibility of further research on Dr. What-Info and its expansion.
As mentioned by Eric E. Schmidt, Google CEO at the Asian-Pacific event “The Mobile First World” in November 2014, “The mobile revolution has driven industries from the Web First to Mobile First and then Mobile Only.” According to Bin-hsian Liang, the Director-General of Taiwan’s Internet of Things Alliance and Chairman of Flowring Technology, 2015 marked the transition from the Electronic Era to the Intelligence Era; from the perspective of intelligence, the Internet of Things, cloud technology, big data, mobile devices, and community media should be the five indispensable factors of the Intelligence Era. Based on the creation principle of Mobile Only, Dr. What-Info [6] aims to improve the development of mobile device-related practical technologies. With the assistance of cloud technology, Dr. What-Info II [7] introduces the latest, accurate, and complete “open data by governments”, and combines them with the ontological index architecture, thus, it provides the corresponding value-added services of cloud information with “mobile” device positioning technology. With the strong information agent system CEOntoIAS (Cloud Extension of Ontological Information Agent Shell) [8], a suitable LBS (location-based service) is selected to achieve the optimal information solution similar to community-like inquiring and sharing. Finally, Dr. What-Info III, as based on big data technology [9], explores the Internet, which is similar to the Internet of Things (information providers are like information sensors on the Internet), and offers the corresponding useful and latest information. The MapReduce paralleled decrement mechanism [10,11] of the cloud information agent CEOntoIAS, as established on the Hadoop-like architecture, and the combination of Software R [12] and time series analysis enhance the precision, reliability, and integrity of cloud information, and effectively improves the aforesaid five indispensable factors of the Intelligence Era, and then, contributes to research on the feasibility of Dr. What-Info expansion.

2. Dr. What-Info Architecture, Operation, and Outcomes

In 2014, the researchers established the prototype of Dr. What-Info, i.e., a master multi-agent system on what the information is, and its objectives that have been fulfilled are, as follows:
  • Adopt the web service technology to establish a cloud computing interaction paradigm, which is widely and seamlessly integrated with relevant Internet information agent systems; establish the WIAS (Web-services-based Information Agent System) [8], which is a cloud operating environment, in order to fulfill the research objective of improving mobile information devices for storing and retrieving cloud information anytime and anywhere.
  • Adopt the agent technology and develop tourism ontology (Figure 1) technologies to help users quickly, accurately, and effectively obtain precise and timely cloud information; apply the Ontological Information Agent Shell, OntolAS [13], in order to transform the information agent EOntoIAS (Extension of OntoIAS) into CEOntoIAS (see Figure 2 for details). Moreover, with the support of the smart multi-agent system CEOntoIAS of the processing, exchange, communication, operation, integration, analysis, and decision-making assistance of cloud information in the three stages (OntoDMA—Ontological Data Mining Agent [5], OntoCBRA—Ontological Case-Based Reasoning Agent [14], and OntoIAS), this study can easily realize the research objective of seeking and sharing optimal cloud information solutions with Dr. What-Info. As illustrated in Figure 1, in the proposed system, the content and links among all the concepts can be well depicted for the entire operation of a backend agent system. Referring to the website content at http://protege.stanford.edu/, an ontology-based cloud touring information system was accordingly built in St. John’s University, Taiwan. The provided ontology-based web services cover semantic distance transformation between index terms, hypernyms, and hyponyms of term retrieval mapping, conversion between synonyms and antonyms, etc. With the WordNet at http://wordnet.princeton.edu/ and the Academia Sinica Bilingual Ontological Wordnet at http://bow.sinica.edu.tw/, the conversion between English and Chinese languages, as well as the connections between distinguishing meanings and relationships of words, can be made as a basic operation of this presented system. Furthermore, Jaccard similarity is employed as a measure of the consistency between ontological concepts. Subsequently, the domain concept can be indexed by the consistency between the concepts of the index terms in WordNet. Finally, with the identification codes Synset_ID given by WordNet, the domain concept can be made accessible for the entire system operation. The Jaccard similarity J, also known as the Jaccard index, while the Jaccard dissimilarity Jδ, also known as the Jaccard distance, are respectively defined as:
    J ( A , B ) = | A B | | A B | ,
    J δ ( A , B ) = 1 J ( A , B ) = | A B | | A B | | A B | ,
    The value of J(A, B) lies within the interval [0, 1], and J(A, B) = 0 means that A is completely unrelated to B, while J(A, B) =1 represents that A and B are compatible synonyms. Alternatively, Jδ(A, B) = 1, i.e., the maximum case, implies that A is completely unrelated to B, while Jδ(A, B) = 0, i.e., the minimum distance case, indicates that A and B are compatible synonyms. Taking OWL/RDF(s) as an example, these relationships are defined as “owl:ObjectProperty”, “owl:Functional Property”, and “owl:InverseFunctionalProperty”. Therefore, relevant analysis rules can be defined to capture the main concept of ontology, e.g.:
    TRIPLE
     (SUBJECT ?P)
     (PREDICATE “HTTP://WWW.W3.ORG/1999/02/22-RDF-SYNTAX-NS#TYPE”)
     (OBJECT “HTTP://WWW.W3.ORG/2002/07/OWL#OBJECTPROPERTY”)
    TRIPLE(SUBJECT ?S)(PREDICATE ?P)(OBJECT ?O)
    =>RESULT : O IS DESCRIPTION FACTOR FOR S
    In the aforesaid rules, if Predicate P is the type of the aforesaid words, then Subject S has other concepts of Object O. On this condition, Subject S is the main concept related to this domain. Afterwards, from a set of the main concepts, the most representative domain concept, i.e., the maximum information content value, is expressed as:
    D o m a i n C o n c e p t = max c S ( c 1 , c 2 ) [ log P ( c ) ] ,
    In addition, the location of this domain concept in the WordNet ontology is indexed according to the hasURI of hasURI and hasConsistency attributes of the most representative concept, the consistency of the domain concept is evaluated as the Jaccard Similarity, and then stored in the corresponding hasConsistency attribute to complete the corresponding processing of the domain concept. Finally, the location of the domain concept in Ontological Databases (OD), as shown in Figure 2b, is accessed according to the Synset_ID of concept in WordNet to support the overall system operation.
  • Adopt the camera or recorder of mobile information devices, the semantic analysis and Chinese-English multimedia recognition technology is supported by domain ontology, and the strong information agent system, called CEOntoIAS, which is located on the back-end of the network, establishes an accurate, quick, and effective camera recognition-based smart mobile multi-agent prototype system of “tourist” information inquiring and sharing. All of these are shown in Figure 3.

3. Dr. What-Info II System

The year of 2014 featured an information economy. Therefore, in 2015, the researchers continued to develop Dr. What-Info II [7], which is a smart mobile information inquiring and sharing multi-agent system, as based on the open data of the Taiwanese Government and universal application interfaces. In most cases, there are two data processing modes for illustrating Open Data, as follows. The first mode is that the website of an API is accessed directly when the access APIs of a corresponding database are provided by an open data platform, while the second is only a download hyperlink, which is provided in case access APIs are not provided. This paper is presented as a solution via Dropbox Cloud storage service, as illustrated below by the example of the JSON format of Kaohsiung City government open data platform.
(1)
An access point saves a link as a corresponding .json file;
(2)
Upload the file to Dropbox Cloud space, and share this access link;
(3)
Modify the first half of the shared access link “https://www.dropbox.com/” as “https://dl.dropboxusercontent.com/” for an APP to access an open database directly. Instead of skipping to the Dropbox file download page directly, this step is of great importance (see https://www.dropbox.com/help/201); and
(4)
Finally, the corrected access hyperlink is directly copied to the object corresponding program code of an access interface, and the same access mode as in the access APIs of a corresponding database, as provided by the open data platform, is completed for the system to implement subsequent processing. A step-by-step menu is shown in Figure 4.
In response to different information patterns and smart interface systems, development based on the open data by the Taiwanese Government and the UAI (universal application interface) was proposed. The realized objectives related to Dr. What-Info II are listed, as follows.
  • Establish the platform for the open data of the Taiwanese Government, develop the UAI based on three-layered addresses (city/county, district/town/township and road/street) in response to different data patterns, and achieve different web components; then, establish a corresponding open database for location-oriented events (Table 1) and the appropriate context index, as correlated with the tourist event ontology through the address (Figure 5). The design concept is illustrated, as follows. Space is exchanged for time and the keywords in an original address, such as the city/county of the first layer, the district/town/township of the second layer, the road/street of the third layer, which are indexed as different web elements in advance. In other words, the indices are classified beforehand using the three-layer relationship of address and a corresponding location-based mobile open database, as shown in Table 1, and a suitable scenario index is checked by the address with the aforesaid tourism event ontology for a system to trigger. The solution via the above-stated Dropbox cloud space is uploaded to provide an open data platform with a complete or fuzzy character string matching function, thus, completing the standard operating procedure of a UAI. Taking the Taipei City hotel open database as an example, the first half of the pictures in Figure 6 indicates that it takes users roughly 48 min to drive from St. John’s University, according to the automatic GPS location captured, to a designated hotel or restaurant, say, the Milord Business Assembly Hall here, while the second half shows the open data provided by the greening restaurants in Tainan, as well as corresponding map information.
  • Make three-stage smart decisions with web technology (similar to Figure 2); in particular, analyze, design, and develop the UAIs technology in response to different data patterns under the WIAS cloud platform; select the establishment suitable for Web service system APIs, such as corresponding information through comparison (Table 2); support the operation of the cloud smart multi-agent system CEOntoIAS; and then, effectively improve the mobile information inquiring and sharing of Dr. What-Info II. Figure 7 shows the bulk information recommendation, as based on St. John’s University GPS.

4. Domestic and Foreign Literature Analysis and Development Technology

As abovementioned, 2014 was the year of the “information economy,” and since then, there has been an increasing number of domestic and foreign discussions regarding big data; moreover, they are combined with ontology and linked data [15]. For instance, Lin [9] adopted Pearson Correlation Analysis to confirm the homogeneity among variables, and used big data regarding external environment factors, such as temperature, humidity, wind speed, and population density to establish an alarm system for the dengue fever epidemic. Bodislav [16] elaborated on corporate governance technology, which integrated business wisdom with hybrid leading indicators of big data. Wang et al. [17] presented a systematic approach, which adopted a set of ontologies and methods as a first step in the direction of a formalization of partially automatic extraction and integration of sketch map content, in order to sketch map the interpretation, and work through an example that demonstrates the sketch map interpretation at different levels using the underlying method. Huang et al. [18] proposed, developed, implemented, and evaluated a relative positioning approach that adopted a linked data-based technical framework where the data are organized according to ontologies, which are designed based on the GeoSPARQL vocabulary, in order to synchronize geometric representations for map mashups through several scales. Li et al. [19] proposed a new development stage of geomatics entitled “Connected Geomatics,” which is defined as a multi-disciplinary science and technology that uses systematic approaches and integrates methods pertaining to any physical objects and human activities on earth, including spatio-temporal data acquisition, information extraction, network management, knowledge discovery, spatial sensing and recognition, and intelligent location-based services. As abovementioned, this system also introduces the currently-popular big data analysis, the Hadoop-like architecture, the MapReduce paralleled decrement mechanism (http://hadoop.apache.org/docs/r1.2.1/mapred_tutorial.html), Software R analysis (http://www.r-software.org/), and time series analysis (short for the time series analysis supported by big data analysis), in order to establish OntoDMA and OntoCBRA of the multi-agent system CEOntoIAS, which supports cloud smart information processing and decision-making, in order to strengthen the system’s prediction ability, as well as the location-based operational robustness of the system. This is the greatest contribution in the research objective of Dr. What-Info III in this program.
The time series analysis has been applied in many domestic and foreign academic papers, and even combined with big data. Lin [4] used the semi-conductor industrial stock-like factor analysis in the stock market with relevant coefficients to analyze and select factors; moreover, the time series model was combined with regression analysis to provide a fast and effective demonstration model DFSS_IDOV (Design for Six Sigma—Identify, Design, Optimize, and Verify). Schuster et al. [20] proposed adopting intra-annual time series analysis in the comparative application of pasture habitats to explore technologies for comparison of the satellite data of RapidEye and TerraSAR-X. Pravilovic et al. [21] presented a cluster-centric forecasting methodology that allows users to yield a characterization of correlation in geophysical time series through a spatio-temporal clustering step, and the experimental results highlight the importance of dealing with both temporal and spatial correlation, and validate the proposed cluster-centric strategy in the computation of a multivariate time series forecasting model. Shrestha and Bhatta [22] discussed the properties of time series data, compared common data analysis methods, and presented a methodological framework with an example: Nepal’s money–price relationship for time series data analysis, and the test results obtained following this methodological framework were found to be more robust and reliable. As abovementioned, this study uses Jaccard similarity and dissimilarity distance of relevant inquiry keywords and relevant ontological keywords to analyze and select a set of corresponding keyword factors. Then, the time series model is combined with appropriate regression analysis to extract the keyword factors with the same development trend similar to that obtained with the Fourier-Gaussian decomposition method. In this way, the optimal information development trend will be obtained to support the analysis and operation of the entire system and, thus, fulfill the research objective of integrating time series with big data analysis to support Dr. What-Info III.
The MapReduce paralleled decrement mechanism has been used in many domestic and foreign academic literatures, especially those based on Hadoop. Chang [10] adopted the Hadoop cloud operation platform to integrate TF-IDF weights with representative keywords in documents, hierarchical agglomerative clustering and K-nearest neighbor’s algorithm, and concept analysis, to determine the technologies for improving the precision of unclassified documents in the HDFS distributed archive system. Triguero et al. [11] proposed distributing the functions of operation algorithms with an operation element cluster, and put forward many operational strategies, such as integrating some operational solutions into one to establish a new MRPR (MapReduce for Prototype Reduction) architecture. Glushkova et al. [23] considered architectural changes and captured the execution flow of a MapReduce job by using queuing a network model, as based on an existing performance model for Hadoop 1.x. Gouasmi et al. [24] proposed an exact MapReduce scheduling model to serve as a baseline for benchmarking and to compare and discuss heuristic algorithm results, and performance evaluation proved that the proposed algorithm FDMR (Federated Distributed MapReduce) could improve resource utilization of the cloud federation, and consequently, reduce the cost and job response time while satisfying the deadline constraint. According to the above studies, the environment for the research, development, and simulation of nearly all systems was the combination of Hadoop and MapReduce. This is the greatest motivation for this program to adopt big data analysis and the MapReduce paralleled decrement mechanism under the Hadoop-like framework.
There have been many domestic and foreign studies using R software, especially those combining with other languages. Weng [25] used the Cox proportion risk model and random intercept to evaluate the influence of time-dependent explanatory variables on the time of existence in R statistical software. Azam [12] studied the historical, present, and future role of R statistical software in data analysis. Bolduc et al. [26] presented R2MCDS, which is an R package that provides tools to call the multiple-covariate distance sampling (MCDS) engine from the Distance 6.2 software in the R environment, and demonstrated the applicability of the package for multi-species surveys using data from the Eastern Canada Seabirds of the Sea (ECSAS) database. Frías et al. [27] proposed an R package that is part of the climate4R bundle, thus, providing transparent access to the ECOMS-UDG climate data service, which allowed a flexible application of visualizeR to a wide variety of specific seasonal forecasting problems and datasets. Manubens et al. [28] proposed an open-source R package: s2dverification v2.8.0 for the quality assessment of climate forecasts using state-of-the-art verification scores, in order to provide tools for each step of the forecast verification process: data retrieval, processing, calculation of verification measures, and visualization of the results. As abovementioned, statistical Software R can improve statistics, drawing, programming interface, and data input/output through the packages of users, and can provide various language interfaces, such as R, LaTeX, Java, C or C++, and Fortran. Moreover, the CRAN (Comprehensive R Archive Network, URL: https://cran.r-project.org/web/packages/) includes different software packages for economic measurement, financial analysis, humanities, and artificial intelligence. Hence, the motivation for combining R statistical software with the time series analysis in this program is obvious.
To sum up, this study focuses on presenting the development trend from the perspective of data-oriented evidence, especially open data and technologies; as those numbers can verify and prove current technology trends and user information requirements. In addition, based on the practical progress of Dr. What-Info I and II, this paper continues to develop Dr. What-Info III. Moreover, the big data technology, the MapReduce paralleled decrement mechanism of the cloud information agent CEOntoIAS, as supported by the Hadoop-like framework, R software, and time series analysis are adopted to enhance the precision, reliability, and integrity of cloud information, which will effectively improve the inquiring and sharing of mobile information.

5. Proposed System Architecture and Involved Technologies

5.1. MapReduce Paralleled Decrement Mechanism with Dr. What-Info III

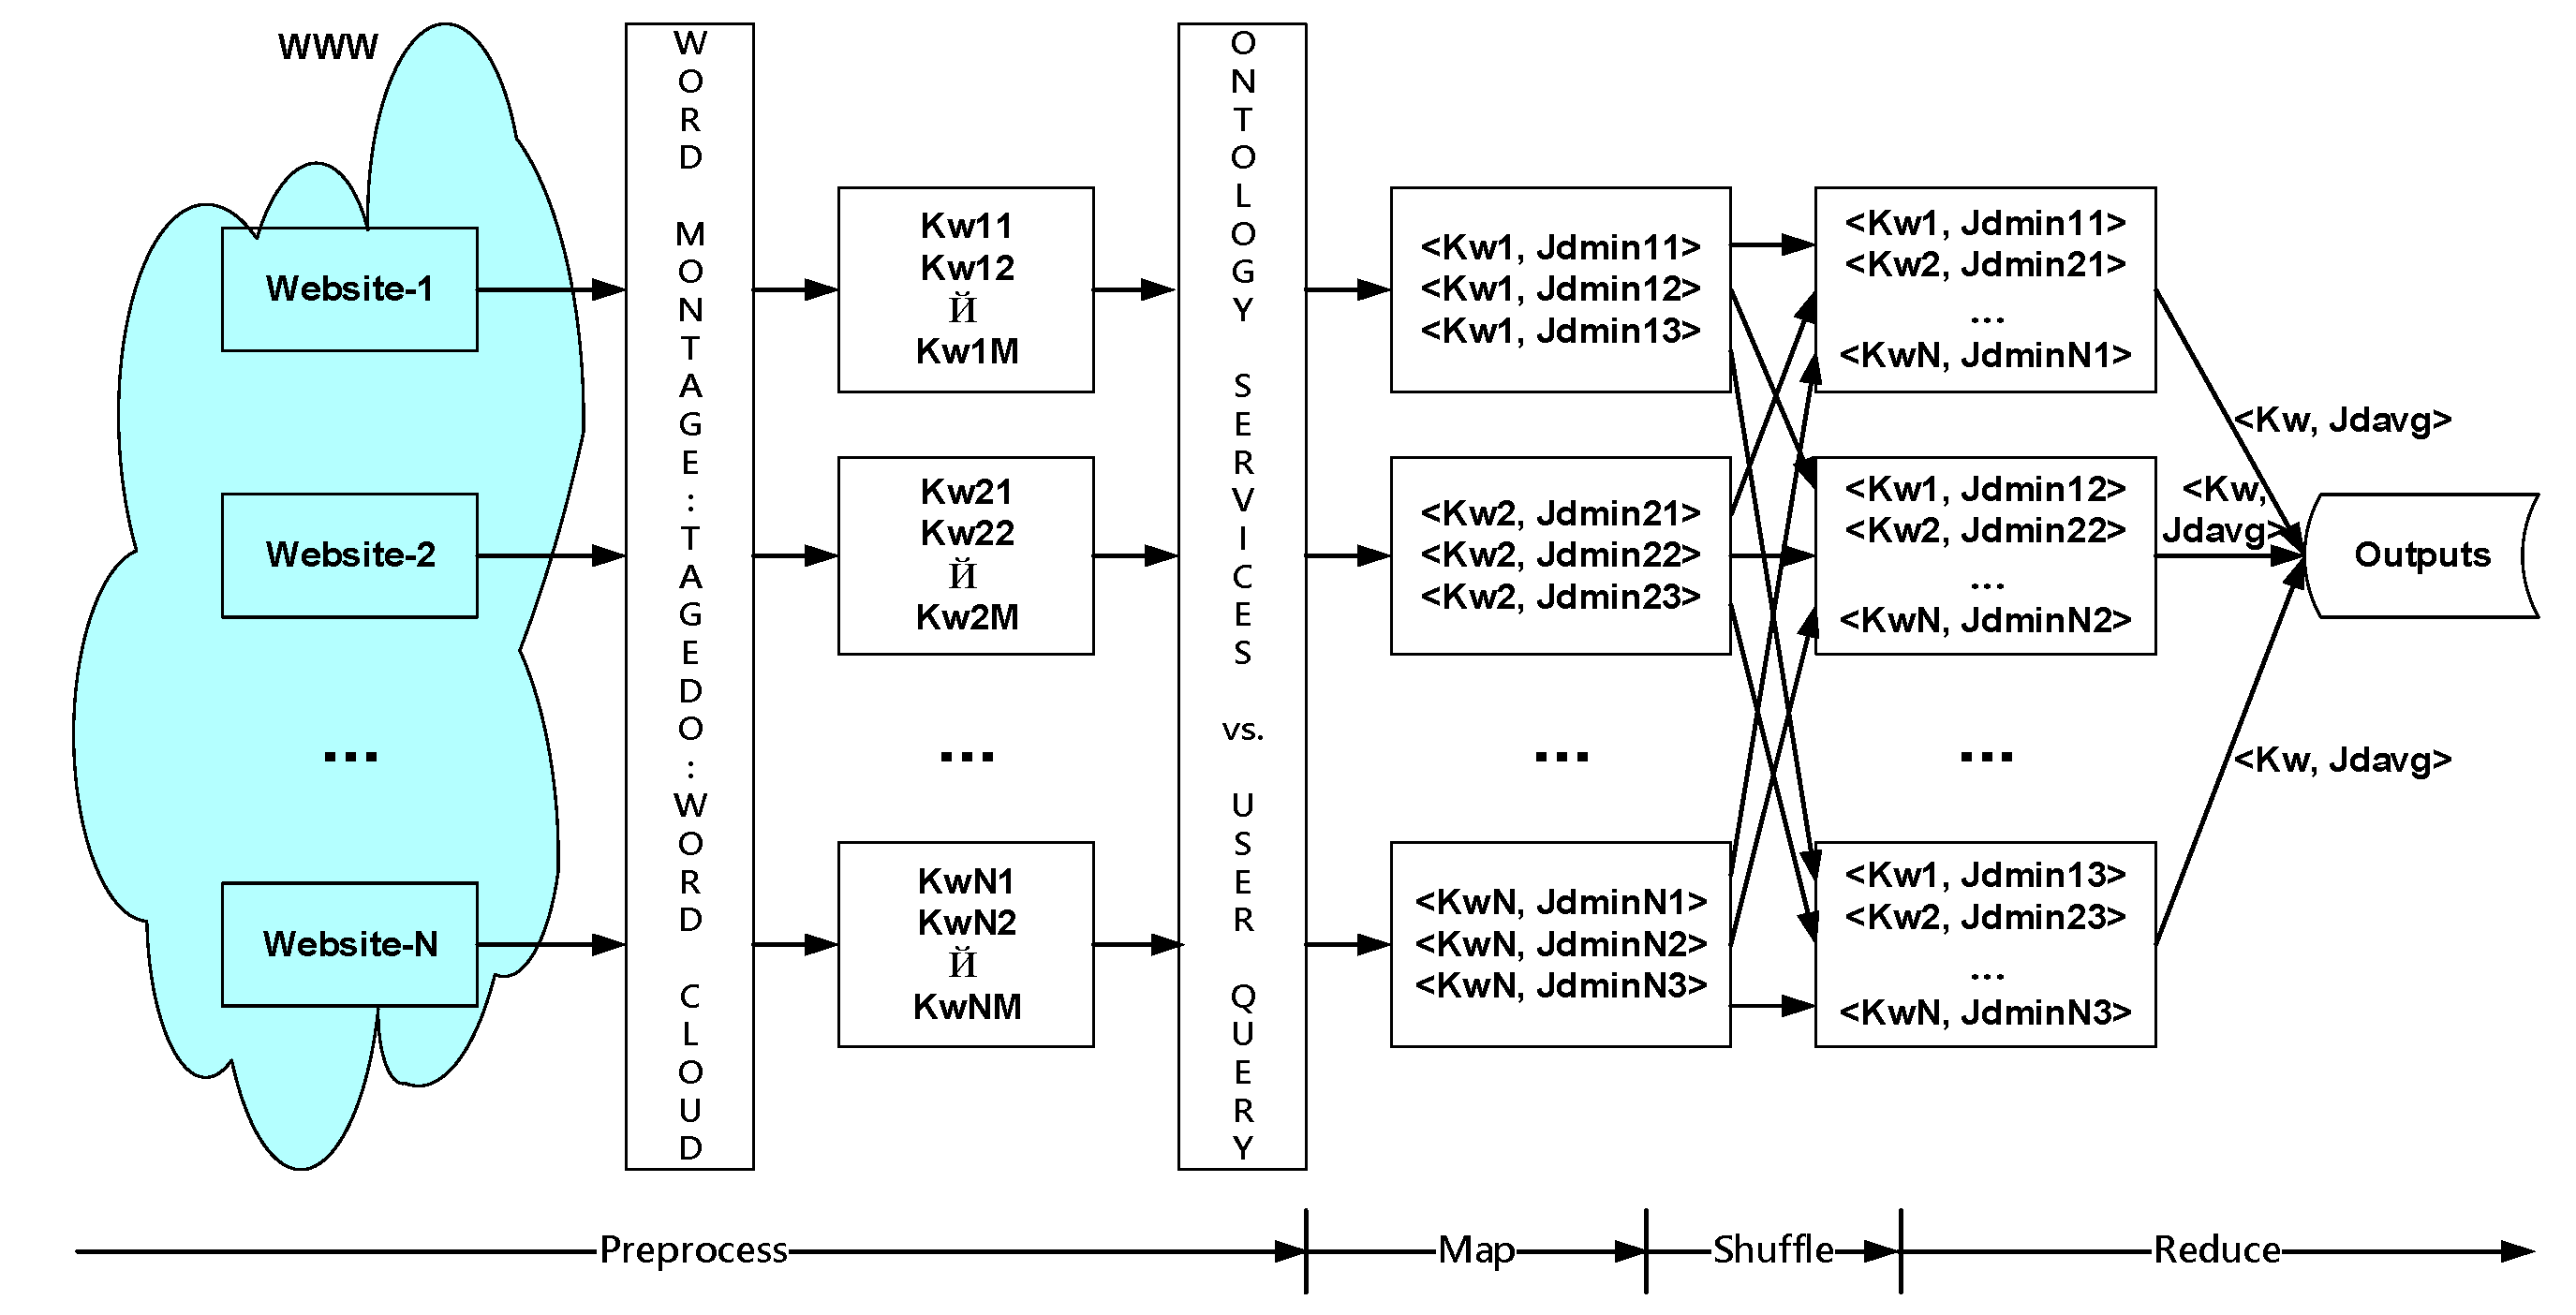
The paralleled decrement mechanism of this study consists of four steps: (1) the preprocess operation to generate the corresponding keywords of a website; (2) the Map operation using the coordinated Jaccard dissimilarity of domain ontology to obtain the three corresponding keyword sets of a website; (3) the Shuffle operation of summarizing the three optimal keyword sets of a website; and (4) the Reduce operation of using the average output of Jaccard dissimilarity [13] and user to inquire the three closest corresponding keywords, as shown in Figure 8.
(1)
The preprocess operation of generating the corresponding keywords of a website;
First, Tagxedo is used, which is a word montage (Tagxedo: http://www.tagxedo.com supporting Chinese-English word tag cloud) automatic graphic archive generator. Then, word frequency is calculated through a simple software operation (such as R) to create a colorful word cloud, which displays the important and meaningful information of the website. However, if the keyword set is too large, its information will not be representative enough to serve as the standard for the information selection and recommendation of the system. Hence, it is necessary to reduce the quantity of keywords and render the keywords more representative.
(2)
The Map operation of using the coordinated Jaccard dissimilarity of domain ontology to obtain the three corresponding keyword sets of a website;
As abovementioned, Jaccard dissimilarity in the ontological service represents the relationship between keywords, and a closer relationship indicates a lower value of Jaccard dissimilarity. In other words, the domain ontology service is used to compare users’ relevant inquired keywords to calculate the corresponding Jaccard dissimilarity (a lower value would be closer to user’s demand for information, thus, the sequence is based on Jdmin). Then, the quantity of the keywords of the abovementioned websites is reduced to three, in order to complete this Map operation.
(3)
The Shuffle operation of summarizing the three optimal keyword sets of a website;
First, there is correlation regarding the preference for some information among information seekers. Therefore, this shuffle operation reorganizes the optimal keywords of some websites to form an optimal keyword set to indicate that these keywords are the closest to the information demand of users. Then, second and third keyword sets are created to lay a foundation for the system to calculate the most recommended information.
(4)
The Reduce operation of using the average output of Jaccard dissimilarity and user to inquire the three closest corresponding keywords;
If the system generates corresponding recommended information according to abovementioned steps 2–3, the recommended information will not be representative, and its quantity will be too large. This will appear to be redundant, as the information will be similar to that obtained through the search engine-based inquiry. Hence, this system aims to shorten the gap between recommended information and users’ information demand. This operation will calculate the optimal keyword set from some websites, as well as the averages of some Jaccard dissimilarities (Jdavg1, Jdavg2, and Jdavg3) of the second and third keyword sets, in order to generate three corresponding keywords closest to the user’s inquiry and, thus, fulfill the objective of achieving the narrowest gap between the most recommended information and users’ information demand.
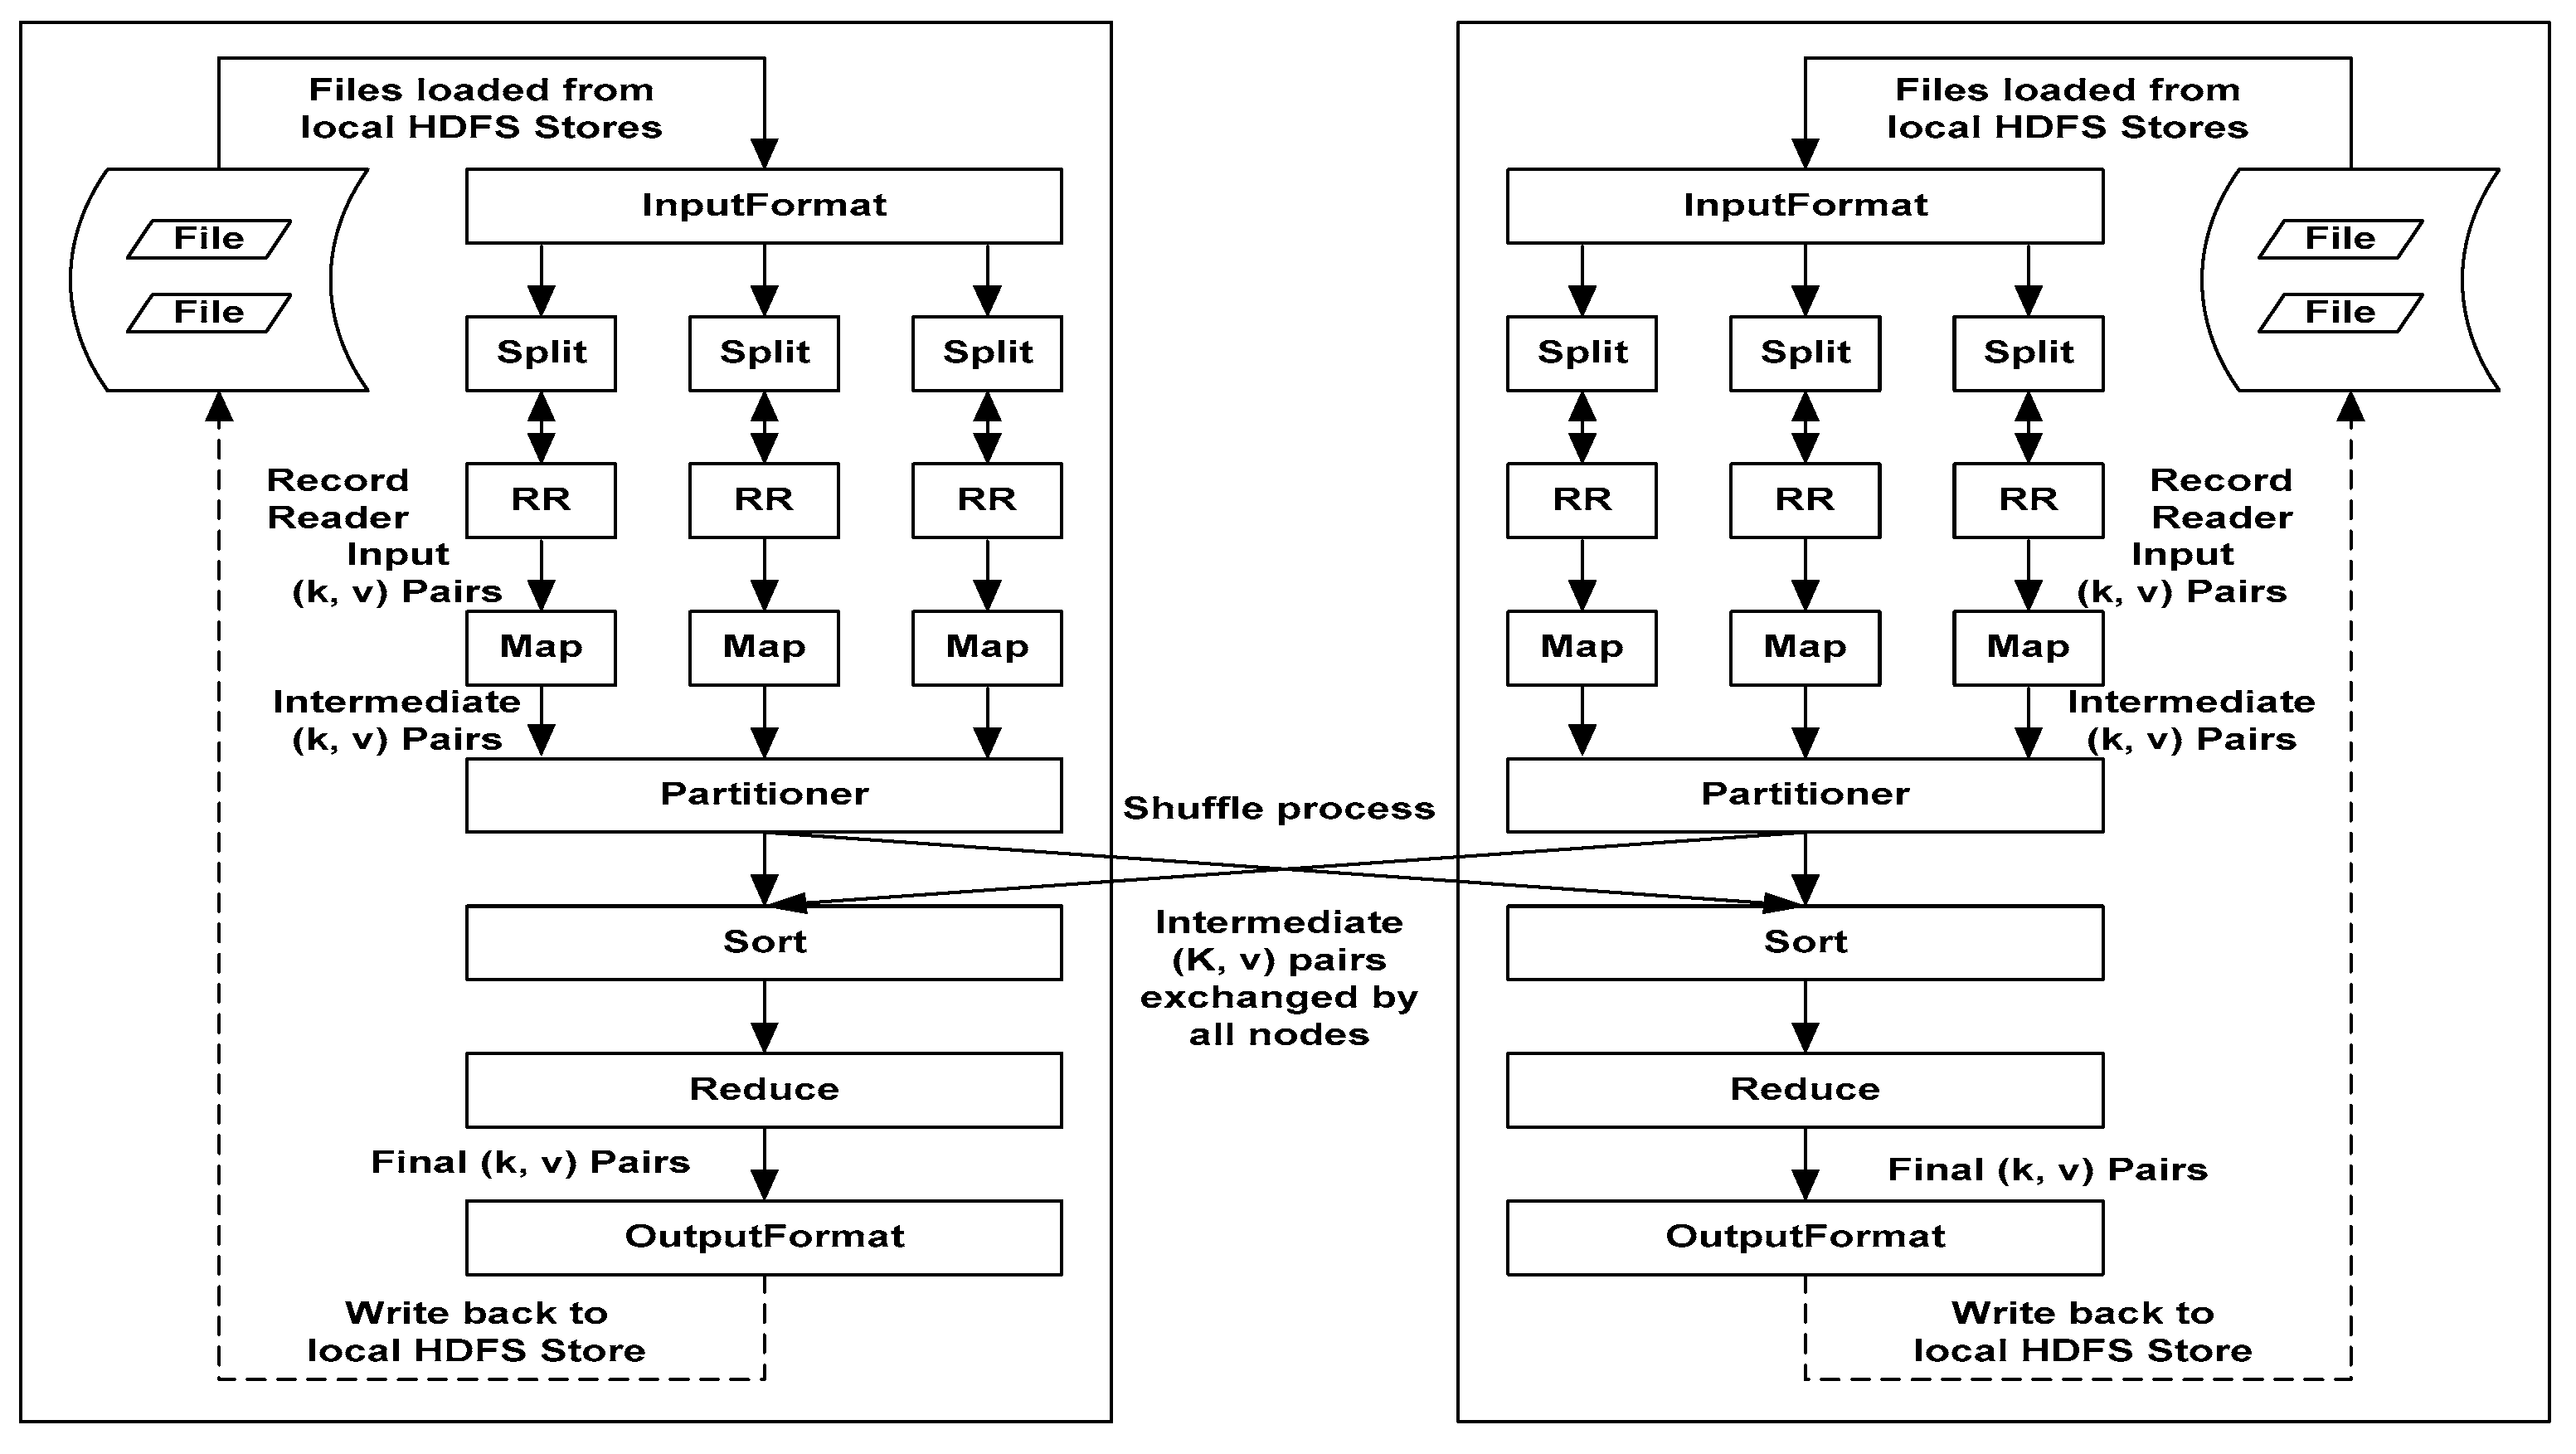
According to the above and relevant literature analysis, this study explores the concept of “R + Hadoop = Big Data Analytics” under the open-source framework of Hadoop. In other words, the open-source framework of Hadoop will be combined with R, as well as a piece of similar open-source analysis software, in order to establish the abovementioned MapReduce paralleled decrement mechanism. Moreover, the keyword-corresponding Jaccard dissimilarities, as supported by the domain ontology service, are integrated to establish the MapReduce paralleled decrement mechanism, in order to facilitate the information services of WIAS, as based on the big data analysis in Dr. What-Info III. The actual operation map is shown in Figure 9 [29]. In particular, OutputFormat establishes the ontological database (OD) according to the domain ontology service index and the relationship between Jaccard dissimilarity establishment and real information. The OD will be the operational basis of the follow-up time series analysis supported by the big data analysis of the abovementioned domain ontology index.
To sum up, mobile device users adopt the cameras or recorders of mobile information devices to recognize and converse corresponding inquired semantic content through the Dr. What-Info III APP and the multi-media semantic analysis sub-system, and describes it with XML. The corresponding query data are returned to the cloud server system CEOntoIAS to facilitate the processing of cloud information and the decisions regarding the inquiry. In the initial stage of the operation of Dr. What-Info III, the cloud information ontology, as established by domain experts, is combined with the corresponding preset rules to retrieve useful information about word frequency in the information inquiry, as well as the support and confidence of the corresponding prediction rules of the initialized information inquiry. Meanwhile, the inter-case similarity operation, as supported by the WIAS network service of the cloud information ontology, is conducted to initialize information agent CEOntoIAS. After the operation of Dr. What-Info III, the system will periodically respond to the frequency of information inquiry, and count the most and least frequent inquired information through time series analysis. OntoCBRA will generate the information regarding relevant cases, and use the two-stage time series prediction algorithm (to be detailed later) to trigger prediction rules consistent with the OntoDMA modification. With the technical assistance of UAI, the selection of local GPS, OpenData@Taiwan/Taipei, and the domain ontology, it will select appropriate corresponding information through comparison to effectively improve the inquiring and sharing of mobile information. Moreover, if the above two fail to provide appropriate cloud information solutions, Dr. What-Info III will trigger OntoIAS to use other technologies, such as information-like search, information selection, information classification, and information presentation (or sequence) of the Preprocess, Map, Shuffle, and Reduce of the abovementioned paralleled decrement mechanism to seek appropriate cloud information solutions outside the Internet. Then, the preset rules, as formulated by domain experts, will be followed to fully establish a learning recycle in response to information inquiry. In this manner, the time of processing inquired information is shortened through the exploration of the knowledge and rules of cloud information operations; moreover, the cases and operation models of processing cloud information are acquired to enhance the system’s robustness in processing inquired information, which will facilitate achieving the research objective of obtaining optimal cloud information solution suitable for users and domains.

5.2. Two-Stage Time Series Prediction Algorithm with OntoDMA

The OntoDAM [5] obtains the relevant object-action pairs, or uses the Jaccard index, to convert inquiry keywords into corresponding values according to the relevant semantic location and distance of ontology. The two-stage procedure of prediction rule generation, as based on the changes to cases generated by OntoCBRA, are as follows.
(1)
Analysis for specific period and regular location: This study adopts time series analysis to select the cases of specific semantic periods and locations as the alternative information, which is also the greatest difference between this study and traditional information systems: the system operation interface automatically has the function of self-explanation with the assistance of semantic technologies.
(2)
Specific inquiry type analysis driven by the above events: according to the above definition of the combination of alternative information in Step (1), it is necessary to select alternative case information (C1~Cn), which has a period longer than that of case generation; then, the VUP and VDOWN of the corresponding values of the same inquiry type are made into corresponding prediction rules P(C1) = {C1(VDOWN), C1(VUP)}, P(C2) = {C2(VDOWN), C2(VUP)}, …, P(Cn) = {Cn(VDOWN), Cn(VUP)}; the corresponding VUP and VDOWN are sequenced, and the set after sequencing is called SVi (sorted values); finally, the maximum and minimum in SVi will be the prediction rule P(SVi) = {SVi(VMAX), SVi(VMIN)} for specific events and inquiry type in the period. The rule analysis and generation procedures are shown in Equation (4). All prediction rule sets are integrated into a prediction rule base, and the corresponding Web services are used to obtain prediction solutions.
P ( C 1 ) = { C 1 ( V D O W N ) ,   C 1 ( V U P ) } P ( C 2 ) = { C 2 ( V D O W N ) ,   C 2 ( V U P ) } P ( C 3 ) = { C 3 ( V D O W N ) ,   C 3 ( V U P ) } P ( C n ) = { C n ( V D O W N ) ,   C n ( V U P ) } S o r t i n g   b y   t h e   v a l u e   o f   V D O W N   a n d   V U P ,   a n d   t o   b e   t h e   s e t   o f   S V i P ( S V i ) = { S V i ( V M A X )   =   M a x ( i = 1 n S V i ) ,   S V i ( V M I N ) = M i n ( i = 1 n S V i ) }
During the online operation of OntoDMA, the inquired information is transmitted from the Solution Finder in Ubi-IA; then, the information inquiry is conducted in relevant sub-agent systems one by one according to the abovementioned smart inquiry and decision-making processing. First, the time series is adopted to analyze the information value (Vpro); then, the corresponding prediction rules (PAns1(SV1) – PAnsN(SVN)) of specific inquiry types (SV1SVN) driven by suitable periods and events are obtained from the prediction rule database; after that, the corresponding VMAX and VMIN are sequenced, and the set after sequencing is called SSVi; finally, the maximum and minimum in SSVi are obtained to meet the prediction solution rules P(SSVi) of this information data. After the generation of prediction solution rules, Vpro is compared with corresponding SSVi(VMAX) and SSVi(VMIN). If Vpro > SSVi(VMAX) or Vpro < SSVi(VMIN), and the value that declines to SSVi(VMAX) or increases to SSVi(VMIN) will be taken as the prediction value of the information data (Vpro). Finally, this system reversely converses the prediction value into corresponding cloud information solution words according to the ontological service of “semantic distance conversion of index word”. The prediction solution analysis and the generation procedure are shown in Equation (5). In case of impossible processing, none will be returned as the controlled response, which indicates the seldom appearance or non-existence of corresponding inquired information. All these actions are returned to Ubi-IA through the web-service-based interface in WIAS.
P A n s 1 ( S V 1 ) = { S V 1 ( V M A X ) ,   S V 1 ( V M I N ) } P A n s 2 ( S V 2 ) = { S V 2 ( V M A X ) ,   S V 2 ( V M I N ) } P A n s 3 ( S V 3 ) = { S V 3 ( V M A X ) ,   S V 3 ( V M I N ) } P A n s N ( S V N ) = { S V N ( V M A X ) ,   S V N ( V M I N ) } S o r t i n g   b y   t h e   v a l u e   o f   V M A X   a n d   V M I N ,   a n d   t o   b e   t h e   s e t   o f   S S V i P ( S S V i ) = { S S V i ( V M A X )   =   M a x ( i = 1 n S S V i ) ,   S S V i ( V M I N ) = M i n ( i = 1 n S S V i ) }

6. Evaluation of System Presentation and Efficacy

6.1. System Presentation

Based on the development and practice of the prototype of Dr. What-Info, this Dr. What-Info III adopts big data analysis, where the MapReduce paralleled decrement mechanism is based on the cloud information agent CEOntoIAS, as established on and supported by the Hadoop-like framework, and Software R and time series analysis enhances the precision, reliability, and integrity of the cloud information, in order to effectively improve the inquiring and sharing of mobile information. For instance, the recommendation of the information regarding a quality restaurant and its corresponding parking lot, as based on St. John’s University GPS in travel, are shown in Figure 10a,b, respectively; then, the corresponding webpage of the click on each line of the lower part of the above webpage is shown in Figure 10c, through which users can obtain all relevant information in advance; finally, if users choose a destination, the system will automatically navigate and present the destination, as shown in Figure 10d. All the above bulk information recommendations are the greatest contributions of the extended exploration of this study.

6.2. System Evaluation

System evaluation is for the analysis of user satisfaction, the usability of the content provided by the webpage of the system, and the ease of use of the system. The analysis of the former is in the International Standard Organization (ISO) 9241. According to its definition, three dimensions —effectiveness, efficiency, and satisfaction—are used to evaluate usability. Whitney Quesenbery (http://www.wqusability.com/, 2009) suggested using the “5E” (efficient, effective, engaging, error tolerant, and easy to learn) function, which could measure usability. Regarding the ease of using the system, Jakob Nielsen (http://www.useit.com/jakob/, 2005) strongly recommended 10 basic principles for user interface design, including visibility of system status, match between system and the real world, user control and freedom, consistency and standards, error prevention, recognition rather than recall, flexibility and efficiency of use, aesthetic and minimalist design, helps users recognize, diagnose, and recover from errors, and help and documentation. Relevant evaluation parameters, as well as the analysis results, are shown in Table 3. The overall satisfaction of the usability of the system and the ease of using the interface design is 80% (((4/5) + (8/10))/2), which satisfies basic principles (1)–(8) of the 10 principles proposed by Nielsen, which indicates that this system must be improved in two aspects: error tolerance and help documentation.
The design preference to importance ratio (DIR) (Equation (6)), as proposed by Ha [30], is taken as the design principle of the human-machine interface (HMI) of this system, as it is perfect for combining it with the balancing index (BI) (see Equation (7)) to define the interface. In other words, if BI is zero, all the HMI elements in this design are balanced and perfect. Its physical meaning is that the HMI design meets the principle of the design preference for importance, and that users’ operation of the system is more consistent with user demand:
D I R i j k = D P i j i = 1 n D P i j I i k i = 1 n I i k
B I j k = | i = 1 n log 10 D I R i j k | n
Specifically, DIRijk refers to the DIR of the design attribute j and importance attribute k of HMI interface element i. DPij indicates the design preference of design attribute j of the HMI interface element i. Iik represents design importance k of importance attribute of the HMI interface element i. BIjk refers to the balance index of design attribute j and importance attribute k. n indicates the total number of HMI interface elements.
A five-scale evaluation scheme is utilized to evaluate each design preference (DPij). In other words, the design preferences include very good, good, moderate, weak, and very weak, and their corresponding values are 5, 4, 3, 2, and 1, respectively. Table 4 illustrates the evaluation of HMI elements in our design attributes, as well as their corresponding informational importance, as evaluated using the analytic hierarchy process [30], while Table 5 shows the evaluation results of DIR with BI = 0.003165 (BI should approach zero for the best balance). The verification results show that the human-machine interface of our proposed system can meet important design preferences and provide approximately optimal balance.
The researchers also frequently use recall and precision, as used in information retrieval (IR), to measure the recommendation efficacy of the information recommended by the system. Recall means that clicked projects play a main role in the recommendation, and the equation for obtaining the proportion of the projects in the recommended projects is shown in Equation (8):
r e c a l l = | { r e c o m m e n d e d _ i t e m s } { c l i c k e d _ i t e m s } | | { c l i c k e d _ i t e m s } |
Precision means that recommended projects play a main role in the recommendation, and the equation for obtaining the proportion of the projects in the clicked projects is shown in Equation (9):
p r e c i s i o n = | { r e c o m m e n d e d _ i t e m s } { c l i c k e d _ i t e m s } | | { r e c o m m e n d e d _ i t e m s } |
In view of the system’s high reliability and validity, the researchers assume in the experiment that every recommending process contains at least one recommended item and gets at least one clicked item, in order to avoid the division of error by zero in the aforesaid two equations. The top-n recommendation set size is another factor affecting recommendation accuracy. The researchers also discuss a reasonable size for the recommendation set. To sufficiently provide a basis for good recommendation, which is large enough to provide comparisons with different parameters, i.e., recommender set size, the researchers performed preliminary experiments at St. John’s University in Taiwan. The experiment’s adopted top 3 to 5 recommendation, 10–20 recommender set sizes, and 20–40 candidate information set sizes; the total number of unit websites of the school is 62 and, at most, five in a building, with the exception of the administration building, which are used for measuring the accuracy of the recommendation. The test users include all of the freshmen students of this current year. The scenario is created to simulate students searching websites using a mobile device, with the system automatically providing related touring website information. The clicked items refer to when the student clicks on any recommended item and browses its corresponding website content. Note, we examined only the precision rate without calculating the recall rate; in a general recommendation system, we are mainly concerned with the correct recommendation. Figure 11 shows the results of the experiment. If the recommendation group changes, the average precision will gradually decline, as shown in Figure 11a,b. When the average precision of the top-3 and top-4 recommended projects is 15, there will be a slight turn; however, the top-5 recommended projects will show a trend of smooth decline, as shown in Figure 11c. In short, a large recommendation group will lead to higher-quality recommendation; nevertheless, it also means that it will take more time to complete the operation on the computer. Hence, there is a give-and-take relationship between output quality and processing time. According to the experimental results, the quality of the top-5 recommended projects is relatively high.
System effectiveness experiment 1 first researches the system’s effectiveness and various function tests. This paper uses the comparison table for LBSs, as proposed by Tu [31], and classifies the proposed 12 items into location positioning, hardware device, application management, and system presentation for a comparison. This experiment indicates that a sound information recommender system must conform to more verification conditions. Therefore, the information recommendation and value added service classes (underlined part) are added to the comparison table, as shown in Table 6. The object compared in this experiment is the LBS system developed by the government: Taiwan Food Map (http://www.foodmap.tw/FM.html). As the system quality matches this system, it is selected as the control group. The overall function’s up-to-standard rate of this system is 87.5%, whereas the up-to-standard rate of the Taiwan Food Map, as developed by the government, is only 43.7%. The reason is because: (1) this system uses location information efficiently to provide a more accurate information service; and (2) with the support of LOD (linked open data), this system architecture not only uses the back end database more efficiently, it also provides users with more all-inclusive LBS.
System effectiveness experiment 2 aims to analyze the actual operation and experience satisfaction of this all-inclusive restaurant information consultation and sharing agent system, as based on GPS and LOD technologies. This test invited users from related departments (departments of information and communications), unrelated departments (department of business management), and the middle/high age-bracket (users above 45 years). The three major blocks are used as a reference frame for analysis, as shown in Table 7. There are 10 persons in each class. The satisfaction scale is 1–5 points, representing strongly dissatisfied (1 point) to most satisfied (5 points). It is observed that unrelated departments care more about the interface appearance and the operation of this system being more convenient. The effect is significant in the middle/high age-bracket. Related departments indicate that operation and fluency are somewhat insufficient, and should be enhanced. A very important indicator is that information correctness is graded as being high. According to this table, fluency is somewhat insufficient, but the graphical menu design of the system is easy for the users of the middle/high age-bracket to operate, which is an obvious outcome.

7. Conclusions and Discussion

With the creation principle of “Mobile Only,” This system develops relevant practical technologies of mobile devices, coordinates the back-end system CEOntoIAS, and adopts three-stage smart inquiry decisions, as dominated by the domain ontology, to establish the smart mobile information inquiring and sharing multi-agent system Dr. What-Info, which can precisely, quickly, and effectively inquire and share information, and is based on camera recognition technology. Dr. What-Info II is equipped with the “cloud” technology to combine the latest, accurate, and complete “open data by government” with the domain ontology index framework. Then, the positioning technology of “mobile” devices offers corresponding cloud information value-added services. By integrating the UAI with the strong back-end information agent system CEOntoIAS, it selects an appropriate LBS through comparison to give play to the “community”-like solution of inquiring and sharing optimal information. This not only effectively improves the “value-added” mobile information, it also enhances the prevision, reliability, and integrity of location-based information. Finally, the proposed system adopts big data analysis to explore the MapReduce paralleled decrement mechanism of the cloud information agent CEOntoIAS, as established on, and supported by, the Hadoop-like framework, and the combination of R software and time series analysis on the Internet, which is similar to the Internet of Things (information providers are like the information sensors on the Internet that offer corresponding useful and latest information). The development includes: (1) the time series analysis is supported by the big data analysis of the domain ontology index; (2) OntoDMA supported by CEOntoIAS is established with the network service technology; (3) OntoCBRA supported by CEOntoIAS is established with the network service technology; and 4) the smart mobile information inquiring and sharing multi-agent system equipped with big data analysis is supported by CEOntoIAS, as established with the network service technology. It is also hoped that the development of Dr. What-Info will reveal some academic achievements from the practical perspective of technical and vocational schools, in order to establish a smart mobile information inquiring and sharing multi-agent system featuring precision, fastness, robustness, universality, and initiative. The achievements and conclusions of this study are listed, as follows:
(1)
Actively develop the agent, UAI, and big data analysis; help users quickly, precisely, and effectively obtain useful and open data in an appropriate and timely manner; apply the extended ontological information agent EOntoIAS to appropriate information fields in a more practical manner; establish CEOntoIAS with the WIAS network service technology. Therefore, this study effectively extends the research achievements of the early stage.
(2)
Integrate UAI and the MapReduce paralleled decrement mechanism, and combine R software with the time series analysis with the WIAS-supporting network service; establish the cloud operation interaction model for the multi-agent system of smart mobile information inquiring and sharing; achieve universal storage and retrieval of cloud information; fulfill the ultimate objective of Mobile Only and from Open Data to Open API, and extend this to research regarding the feasibility of Dr. What-Info. Therefore, this technology has some economic benefits and a bright application future.
(3)
Establish the cloud interaction example supported by network service with the operation of CEOntoIAS; the camera and recorder of mobile devices and the sub-system of multi-media semantic analysis, as supported by ontology, are adopted for recognition and conversion; XML is used to describe the semantic contents of corresponding inquiry. With three-stage (OntoDMA, OntoCBRA, and OntoIAS) smart decision-making, the proposed system leads to the optimal cloud (mobile) information solutions for both users and domains. Moreover, it selects appropriate corresponding information with the MapReduce paralleled decrement mechanism of the cloud operation environment WIAS, as established on and supported by the Hadoop-like framework, R software, times series analysis, the UAI technology, the local GPS capture, the OpenData@Taiwan/Taipei, and the domain ontology. In this way, it effectively improves the inquiring and sharing of mobile information, and enhances the precision, reliability, and integrity of location-based information. Hence, this study is different from the information agent systems reported in the literature.
(4)
The operation of the proposed system is conducted through the integration of open data by the Taiwanese Government, the universal application interface, the time series analysis supported by the big data analysis of the domain ontology index, and the multi-agent system CEOntoIAS for decisions on the processing, exchange, communication, operation, integration, analysis, and inquiry of smart cloud information in the above three-stage smart cloud decision. In addition to obtaining the operational truth of seeking optimal cloud information solutions in a precise, fast, robust, universal, and active manner, it effectively improves the inquiring and sharing of mobile information, and then, enhances the precision, reliability, and integrity, and improves the five indispensable elements of the abovementioned Intelligent Era, and then explores the feasibility of the extension of Dr. What-Info. Therefore, this study is innovative, as compared with the information agent systems reported in the literature.
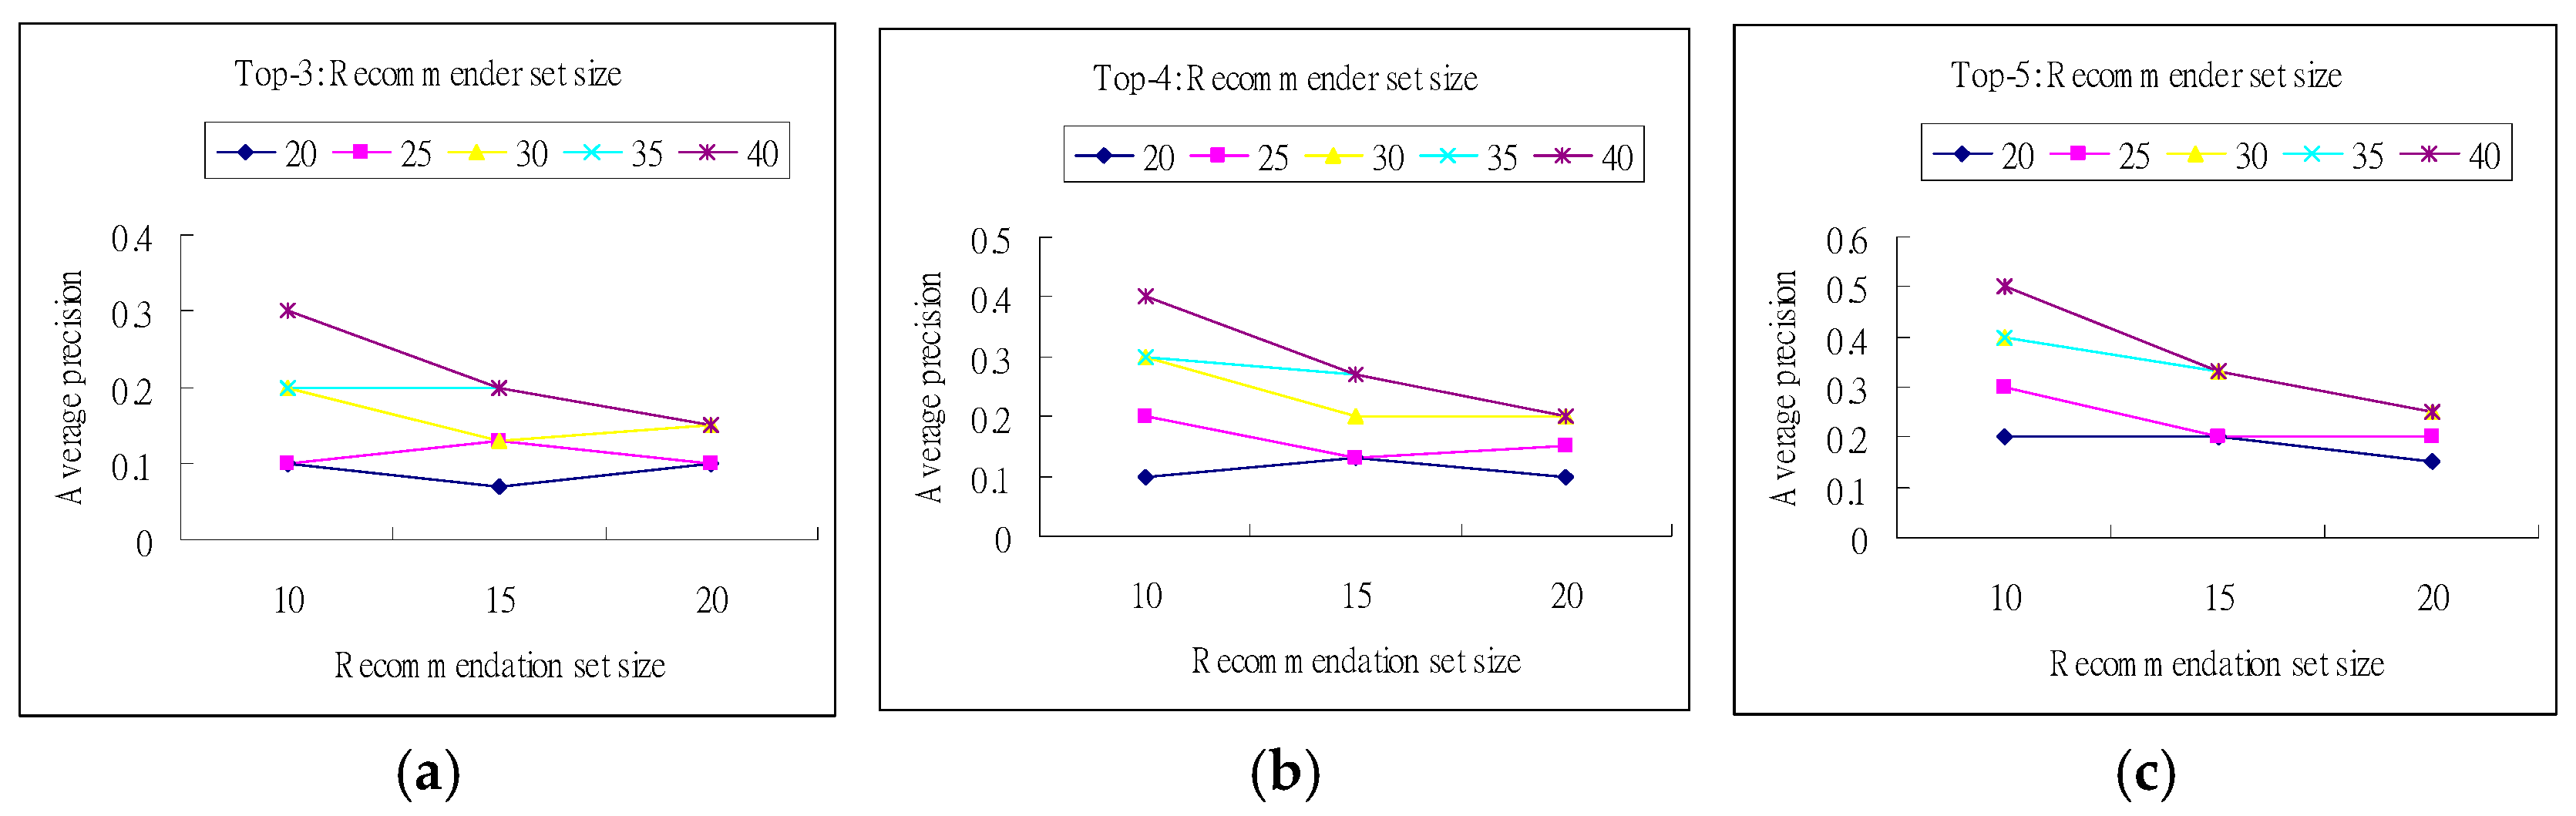
Furthermore, the overall satisfaction of the usability of the proposed system and the ease of using the interface design is 80% in terms of Quesenbery’s 5Es and Nielsen ratings, which indicates that this system must be improved in two aspects: error tolerance and help documentations. In addition, the verification results of the interface design show that the human-machine interface of our proposed system can meet important design preferences and provide approximately optimal balance. Then, the top-n experiment shows that the top-5 recommendations would be better for solving the traditional tradeoff between output quality and processing time. Finally, from system effectiveness experiments, the proposed system receives an overall function’s up-to-standard rate of 87.5%, and those recommendations provide users with high information correctness and user satisfaction. In other words, while the interface appearance is more convenient, the operation and fluency are somewhat insufficient, and should be enhanced; the information correctness is graded as being high, and the graphical menu design of the system is easy for the users, which are obvious outcomes. Although there is plenty of room for improvement in experience, the feasibility of the proposed service architecture has been proven.

Author Contributions

This research article contains three authors, including W.-C.C., W.-H.C. and S.-Y.Y., W.-C.C. and S.-Y.Y. jointly design the overall architecture and related algorithms, and also conceived and designed the experiments, however, W.-H.C. coordinated the overall plan and direction of the experiments and related skills; W.-C.C. and S.-Y.Y. not only contributed analysis tools, but also analyzed the data; W.-C.C. performed the experiments; and S.-Y.Y. wrote this paper and related reply.

Acknowledgments

The authors would like to thank Tung-Han Tsai and Ji-Ling Gu for their assistance in earlier system implementation and preliminary experiments. This research is sponsored under grant 106-2221-E-129-008 and 106-2632-E-129-002 by the Ministry of Science and Technology, Taiwan, R.O.C. The authors feel deeply indebted to the Department of Information and Communication, St. John’s University, Taiwan, for all aspects of assistance provided.

Conflicts of Interest

The authors declare no conflict of interest.

References

  1. Mauro, A.D.; Greco, M.; Grimaldi, M.; Ritala, P. Human resources for Big Data professions: A systematic classification of job roles and required skill sets. Inf. Process. Manag. 2017, in press and corrected proof. Available online: https://doi.org/10.1016/j.ipm.2017.05.004 (accessed on 8 June 2017). [CrossRef]
  2. Vecchio, P.D.; Mele, G.; Ndou, V.; Secundo, G. Creating value from Social Big Data: Implications for Smart Tourism Destinations. Inf. Process. Manag. 2017, in press and corrected proof. Available online: https://doi.org/10.1016/j.ipm.2017.10.006 (accessed on 1 November 2017). [CrossRef]
  3. Huang, Y.Q. Introduction to Big Data; Computer Center, Academia Sinica: Taipei, Taiwan, 2014. [Google Scholar]
  4. Lin, C.Y. The Integration of DFSS and Big Data for Stock Marketing Forecasting Model—Case Study in Semiconductor Industry Stock. Master’s Thesis, Department of Industrial and Systems Engineering, Chung Yuan Christian University, Taoyuan, Taiwan, 2015. [Google Scholar]
  5. Yang, S.Y.; Hsu, C.L. A Cloud Data Mining Agent with Web Service and Ontology Technologies for Intelligent YOHO Information Processing. In Proceedings of the 2014 The 4th International Workshop on Networking, Computing, Systems, and Software, Shizuoka, Japan, 10–12 December 2014; pp. 66–72. [Google Scholar]
  6. Yang, S.Y.; Hsu, C.L. A Location-based Services and Google Maps-based Information Master System for Tour Guiding. Comput. Electr. Eng. 2016, 54, 87–105. [Google Scholar] [CrossRef]
  7. Chen, K.Y.; Chen, F.H.; Yang, S.Y. An Upgraded Intelligent Mobile Information Multi-Agent System with Universal Application Interfaces based on Open Data of Taiwan Government. J. Comput. Appl. Sci. Educ. 2017, 4, 1–23. [Google Scholar]
  8. Yang, S.Y. A Novel Cloud Information Agent System with Web Service Techniques: Example of an Energy-saving Multi-agent system. Expert Syst. Appl. 2013, 40, 1758–1785. [Google Scholar] [CrossRef]
  9. Lin, S.J. Research on Big Data Analysis to Epidemic Situation and Trends of Dengue Fever. Master’s Thesis, Department of Electronic Engineering, National Kaohsiung University of Applied Sciences, Kaohsiung, Taiwan, 2015. [Google Scholar]
  10. Chang, Y.H. Automatic Data Classification and Concept Analysis Based on MapReduce. Master’s Thesis, Department of Computer Science and Information Engineering, Chung Yuan Christian University, Taoyuan, Taiwan, 2015. [Google Scholar]
  11. Triguero, I.; Peralta, D.; Bacardit, J.; García, S.; Herrera, F. MRPR: A MapReduce solution for prototype reduction in big data classification. Neurocomputing 2015, 150, 331–345. [Google Scholar] [CrossRef] [Green Version]
  12. Azam, M.N. R Statistical Software for Data Analysts: Past Present and Future. Glob. J. Quant. Sci. 2015, 2, 34–39. [Google Scholar]
  13. Yang, S.Y. OntoIAS: An Ontology-Supported Information Agent Shell for Ubiquitous Services. Expert Syst. Appl. 2011, 38, 7803–7816. [Google Scholar] [CrossRef]
  14. Yang, S.Y. Developing an Energy-saving and Case-Based Reasoning Information Agent with Web Service and Ontology Techniques. Expert Syst. Appl. 2013, 40, 3351–3369. [Google Scholar] [CrossRef]
  15. Wei, C.C.; Lin, J.S.; Chang, C.C.; Huang, Y.F.; Lin, C.B. The Development of E-Bike Navigation Technology Based on an OpenStreetMap. Smart Science 2018, 6, 29–35. [Google Scholar] [CrossRef]
  16. Bodislav, D.A. Transferring business intelligence and big data analysis from corporations to governments as a hybrid leading indicator. Theor. Appl. Econ. 2015, 22, 275–282. [Google Scholar]
  17. Wang, J.; Worboys, M. Ontologies and representation spaces for sketch map interpretation. Int. J. Geogr. Inf. Sci. 2017, 31, 1697–1721. [Google Scholar] [CrossRef]
  18. Huang, W.; Mansourian, A.; Abdolmajidi, E.; Xu, H.; Harrie, L. Synchronising geometric representations for map mashups using relative positioning and Linked Data. Int. J. Geogr. Inf. Sci. 2018, 32, 1117–1137. [Google Scholar] [CrossRef]
  19. Li, D.; Shen, X.; Wang, L. Connected Geomatics in the big data era. Int. J. Digit. Earth 2018, 11, 139–153. [Google Scholar] [CrossRef]
  20. Schuster, C.; Schmidt, T.; Conrad, C.; Kleinschmit, B.; Förster, M. Grassland habitat mapping by intra-annual time series analysis–Comparison of RapidEye and TerraSAR-X satellite data. Int. J. Appl. Earth Obs. Geoinf. 2015, 34, 25–34. [Google Scholar] [CrossRef]
  21. Pravilovic, S.; Bilancia, M.; Appice, A.; Malerba, D. Using multiple time series analysis for geosensor data forecasting. Inf. Sci. 2017, 380, 31–52. [Google Scholar] [CrossRef]
  22. Shrestha, M.B.; Bhatta, G.R. Selecting appropriate methodological framework for time series data analysis. J. Financ. Data Sci. 2018, 4, 71–89. [Google Scholar] [CrossRef]
  23. Glushkova, D.; Jovanovic, P.; Abelló, A. Mapreduce performance model for Hadoop 2.x. Inf. Syst. 2017, in press and corrected proof. Available online: https://doi.org/10.1016/j.is.2017.11.006 (accessed on 2 December 2017). [CrossRef]
  24. Gouasmi, T.; Louati, W.; Kacem, A.H. Exact and heuristic MapReduce scheduling algorithms for cloud federation. Comput. Electr. Eng. 2018, in press and corrected proof. Available online: https://doi.org/10.1016/j.compeleceng.2018.01.021 (accessed on 7 May 2018). [CrossRef]
  25. Weng, C.H. Time-Dependent Covariates in Cox Regression Model by R. Master’s Thesis, Department of Statistics, National Cheng Kung University, Tainan, Taiwan, 2013. [Google Scholar]
  26. Bolduc, F.; Roy, C.; Rousseu, F. R2MCDS: An R package for the analysis of multi-species datasets collected using distance sampling. Ecol. Inform. 2017, in press and corrected proof. Available online: https://doi.org/10.1016/j.ecoinf.2017.10.003 (accessed on 13 October 2017). [CrossRef]
  27. Frías, M.D.; Iturbide, M.; Manzanas, R.; Bedia, J.; Fernández, J.; Herrera, S.; Cofiño, A.S.; Gutiérrez, J.M. An R package to visualize and communicate uncertainty in seasonal climate prediction. Environ. Model. Softw. 2018, 99, 101–110. [Google Scholar] [CrossRef]
  28. Manubens, N.; Caron, L.P.; Hunter, A.; Bellprat, O.; Exarchou, E.; Fučkar, N.S.; Garcia-Serrano, J.; Massonnet, F.; Ménégoz, M.; Sicardi, V.; et al. An R package for climate forecast verification. Environ. Model. Softw. 2018, 103, 29–42. [Google Scholar] [CrossRef]
  29. Chiu, J.C. The application on Big Data analysis of R and Hadoop. Master’s Thesis, Master Evening and Weekend Program, Department of Statistics and Information Science, Fu Jen Catholic University, Taipei, Taiwan, 2014. [Google Scholar]
  30. Ha, J.S. A Human-machine Interface Evaluation Method Based on Balancing Principles. Procedia Eng. 2014, 69, 13–19. [Google Scholar] [CrossRef]
  31. Tu, T.A. A Refrigerated Cargo Tracking System Using GPS, Google Map API and PHP Web Service. Master’s Thesis, Department of Computer Science and Information Engineering, De-Yeh University, Changhua, Taiwan, 2013. [Google Scholar]
Figure 1. Tourism ontology.
Applsci 08 00947 g001
Figure 2. Prototype system of Dr. What-Info. (a) Operation of the fore-end system; and (b) architecture of back-end system.
Applsci 08 00947 g002
Figure 3. Dr. What-Info system outcomes. (a) Picture of reading the QR/bar code; (b) results of recognition and appropriate recommendations; (c) selection and presentation of local GPS; (d) and planning and presentation of target path.
Applsci 08 00947 g003
Figure 4. Steps to a solution without access APIs via Dropbox Cloud space. (a) Save a link file; (b) upload and share the link; (c) correct link to a corresponding program code; and (d) the same access mode.
Applsci 08 00947 g004
Figure 5. Modularization and context index of tourist events.
Applsci 08 00947 g005
Figure 6. Three-layer address result presentations in the open databases for Taipei City’s hotels and Tainan’s green restaurants.
Applsci 08 00947 g006
Figure 7. Bulk information recommendation based on St. John’s University GPS. (a) Information about quality restaurants; (b) information about corresponding parking lots; (c) website information about No.2 Warehouse Café; and (d) navigation and presentation of destination.
Applsci 08 00947 g007
Figure 8. Conceptual map of the paralleled decrement mechanism.
Applsci 08 00947 g008
Figure 9. Proposed mapreduce operation.
Applsci 08 00947 g009
Figure 10. Bulk recommendation based on St. John’s University GPS. (a) Information about quality restaurant; (b) information about the corresponding parking lot; (c) information on the website of Big Mac Ice Cream; and (d) destination navigation and presentation.
Applsci 08 00947 g010
Figure 11. Average precision of recommendation group size among the stand-by information group size. (a) Top-3; (b) Top-4; and (c) Top-5.
Applsci 08 00947 g011
Table 1. Open databases of corresponding location-oriented events.
Tourist EventEmergency EventSend for doctorCorresponding open data of medical institutionsSource: manual of response to emergencies for team leaders, tourism bureau, ministry of transportation and communications, Taiwan, 2008.
Call for policeCorresponding open data of regional prosecutors and police
Inform companyCorresponding open data of company number
Report it to the tourism bureauCorresponding open data of regional tourism bureau
Loss EventAssistance call from overseas unitsCorresponding open data of regional overseas units
Call for policeCorresponding open data of regional prosecutors and police
Disease and Accident EventSend for doctorCorresponding open data of medical institutions
Call for policeCorresponding open data of regional prosecutors and police
Inform family membersCorresponding open data of regional household registration
Report it to the tourism bureauCorresponding open data of regional tourism bureau
Table 2. APIs functions of some UAI cloud web services.
Service NameService DescriptionTo Whom
UAI_ConnectCrossDomainCross-field Open DB connectionUAI_Connect
UAI_ConnectAlertRegReminder of connection registrationUAI_Connect
UAI_ConnectRuleSettingSetting of connection rulesUAI_Connect
UAI_ComputeFileAccessOperation of archive storage and retrievalUAI_Compute
UAI_ComputeTimeSeriesAccessOperation of time seriesUAI_Compute
UAI_ComputeTriggerConfigOperation of triggering recombinationUAI_Compute
UAI_SearchTimeSeriesSearch for time seriesUAI_Search
UAI_SearchBuildIndexFieldsEstablishment of index columnUAI_Search
UAI_SearchStatisticsSearch statisticsUAI_Search
UAI_StorageFFStatusStatus of files and archivesUAI_Storage
UAI_StorageFFManipulationOperation of files and archivesUAI_Storage
UAI_StorageFTransimissionTransfer and status of files and archivesUAI_Storage
Table 3. Analysis of overall satisfaction with interface design of the system.
StandardItemsThe Proposed System
UsabilityQuesenbery 5EEfficientO
EffectiveO
EngagingO
Error TolerantX
Easy to LearnO
Easy to useNielsenVisibility of system statusO
Match between system and the real worldO
User control and freedomO
Consistency and standardsO
Error preventionO
Recognition rather than recallO
Flexibility and efficiency of useO
Aesthetic and minimalist designO
Help users recognize, diagnose, and recover from errorsX
Help and documentationX
Total satisfaction80%
Legend: “O” means to have this function; while “X” means none.
Table 4. Evaluation of HMI elements and their corresponding importance.
HMI ElementsDescriptionDesign PreferenceInformational ImportanceRemarks
GMAPGoogle Map50.166667Graphical display and points
GSPGSP Location30.233333Label in Text
BOTRecommendation Bottoms30.233333Bottom in Text
NAVINavigation30.183333Bottom in Text
FBSharing by Facebook30.183333Label in Text
Table 5. Evaluation results of DIR with BI = 0.003165.
HMI ElementsDIRRemarks
GMAP1.266055A little bit need to improve
GSP0.904325A little bit need to improve
BOT0.904325A little bit need to improve
NAVI1.000834Approximately optimal balance
FB1.000834Approximately optimal balance
Table 6. System function comparison analysis.
ClassItemThis SystemTaiwan Food Map
Location positioningIndoor positioning
Outdoor positioning
Hardware deviceRFID storage
Environmental sensing device
Application managementDBMS
Management application
Mobile App
Data transmission
System presentationEasy update
Ease of implementation
Actual display
Information recommendationLBS
Community sharing
Satisfaction
Value added serviceEmergency call
Navigation
Table 7. System interface design and overall satisfaction analysis.
TopicItemRelated DepartmentsUnrelated DepartmentsMiddle/High Age-Bracket
InterfaceInterface design3.42.33.7
Whether the required function is found3.83.63.5
OperationOperation difficulty4.13.83.9
Operation fluency3.22.93.7
FunctionIf function is perfect33.84
If function is practical43.73
InformationIf information is correct4.44.24.4
If information recommendation is perfect3.53.83.5

