Investigation of Population Dynamics in 1.54-μm Telecom Transitions of Epitaxial (ErxSc1-x)2O3 Thin Layers for Coherent Population Manipulation: Weak Excitation Regime

Abstract
:1. Introduction
2. Samples and Experimental Setup
3. Results and Discussions
3.1. Time-Integrated Photoluminescence Measurements
- (1)
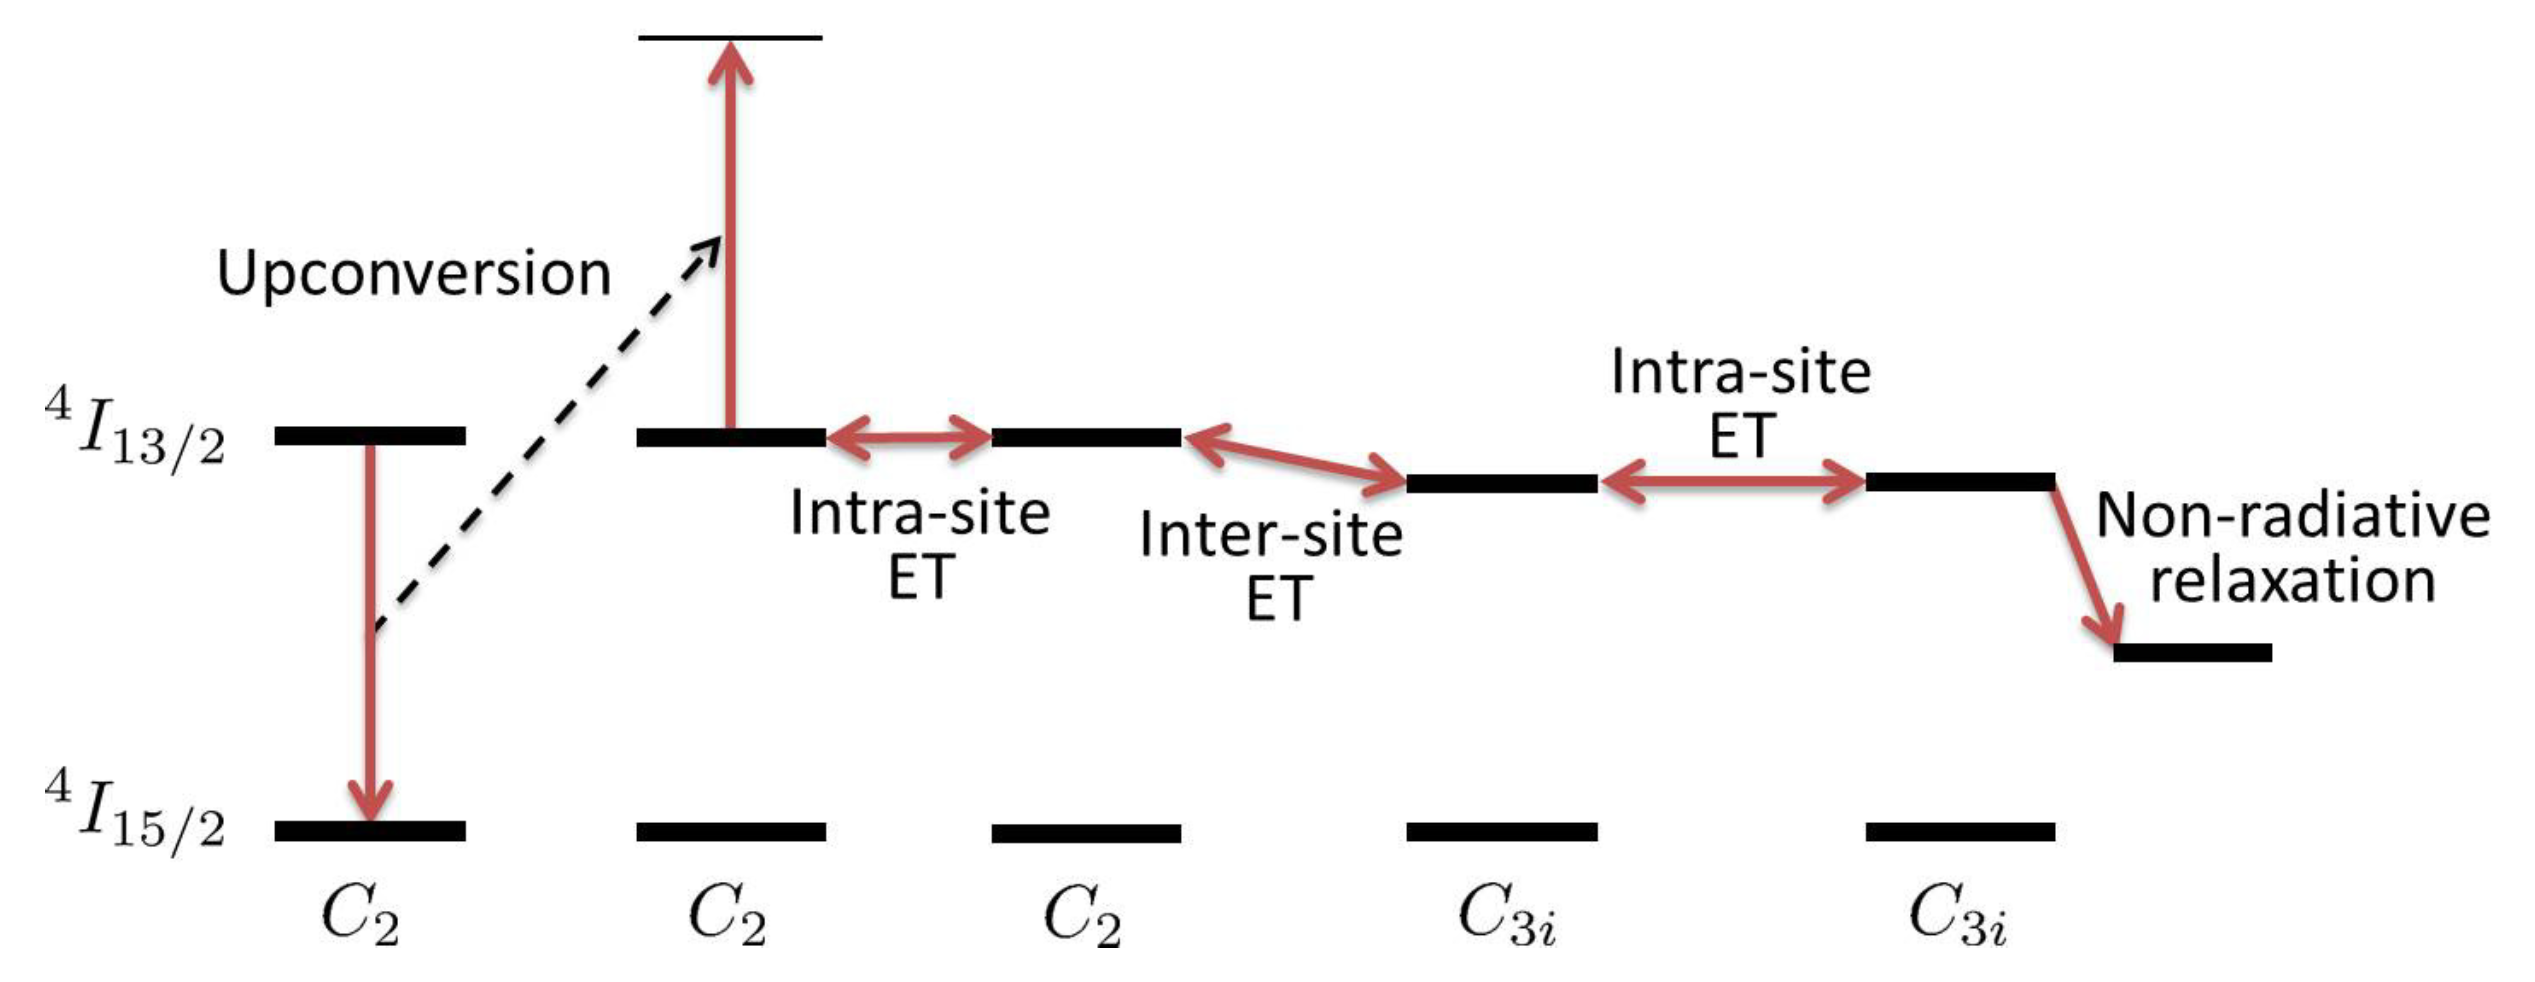
- The UC process occurring in sites is negligible under a low power excitation condition of < a few mW.
- (2)
- The inter-site ET occurs mutually between the lowest states of Y and Y, and it follows the internal energy relaxation in sites (YY).
- (3)
- The extension of the inter-Er distance is very effective in suppressing the inter-site ET and thermal quenching.
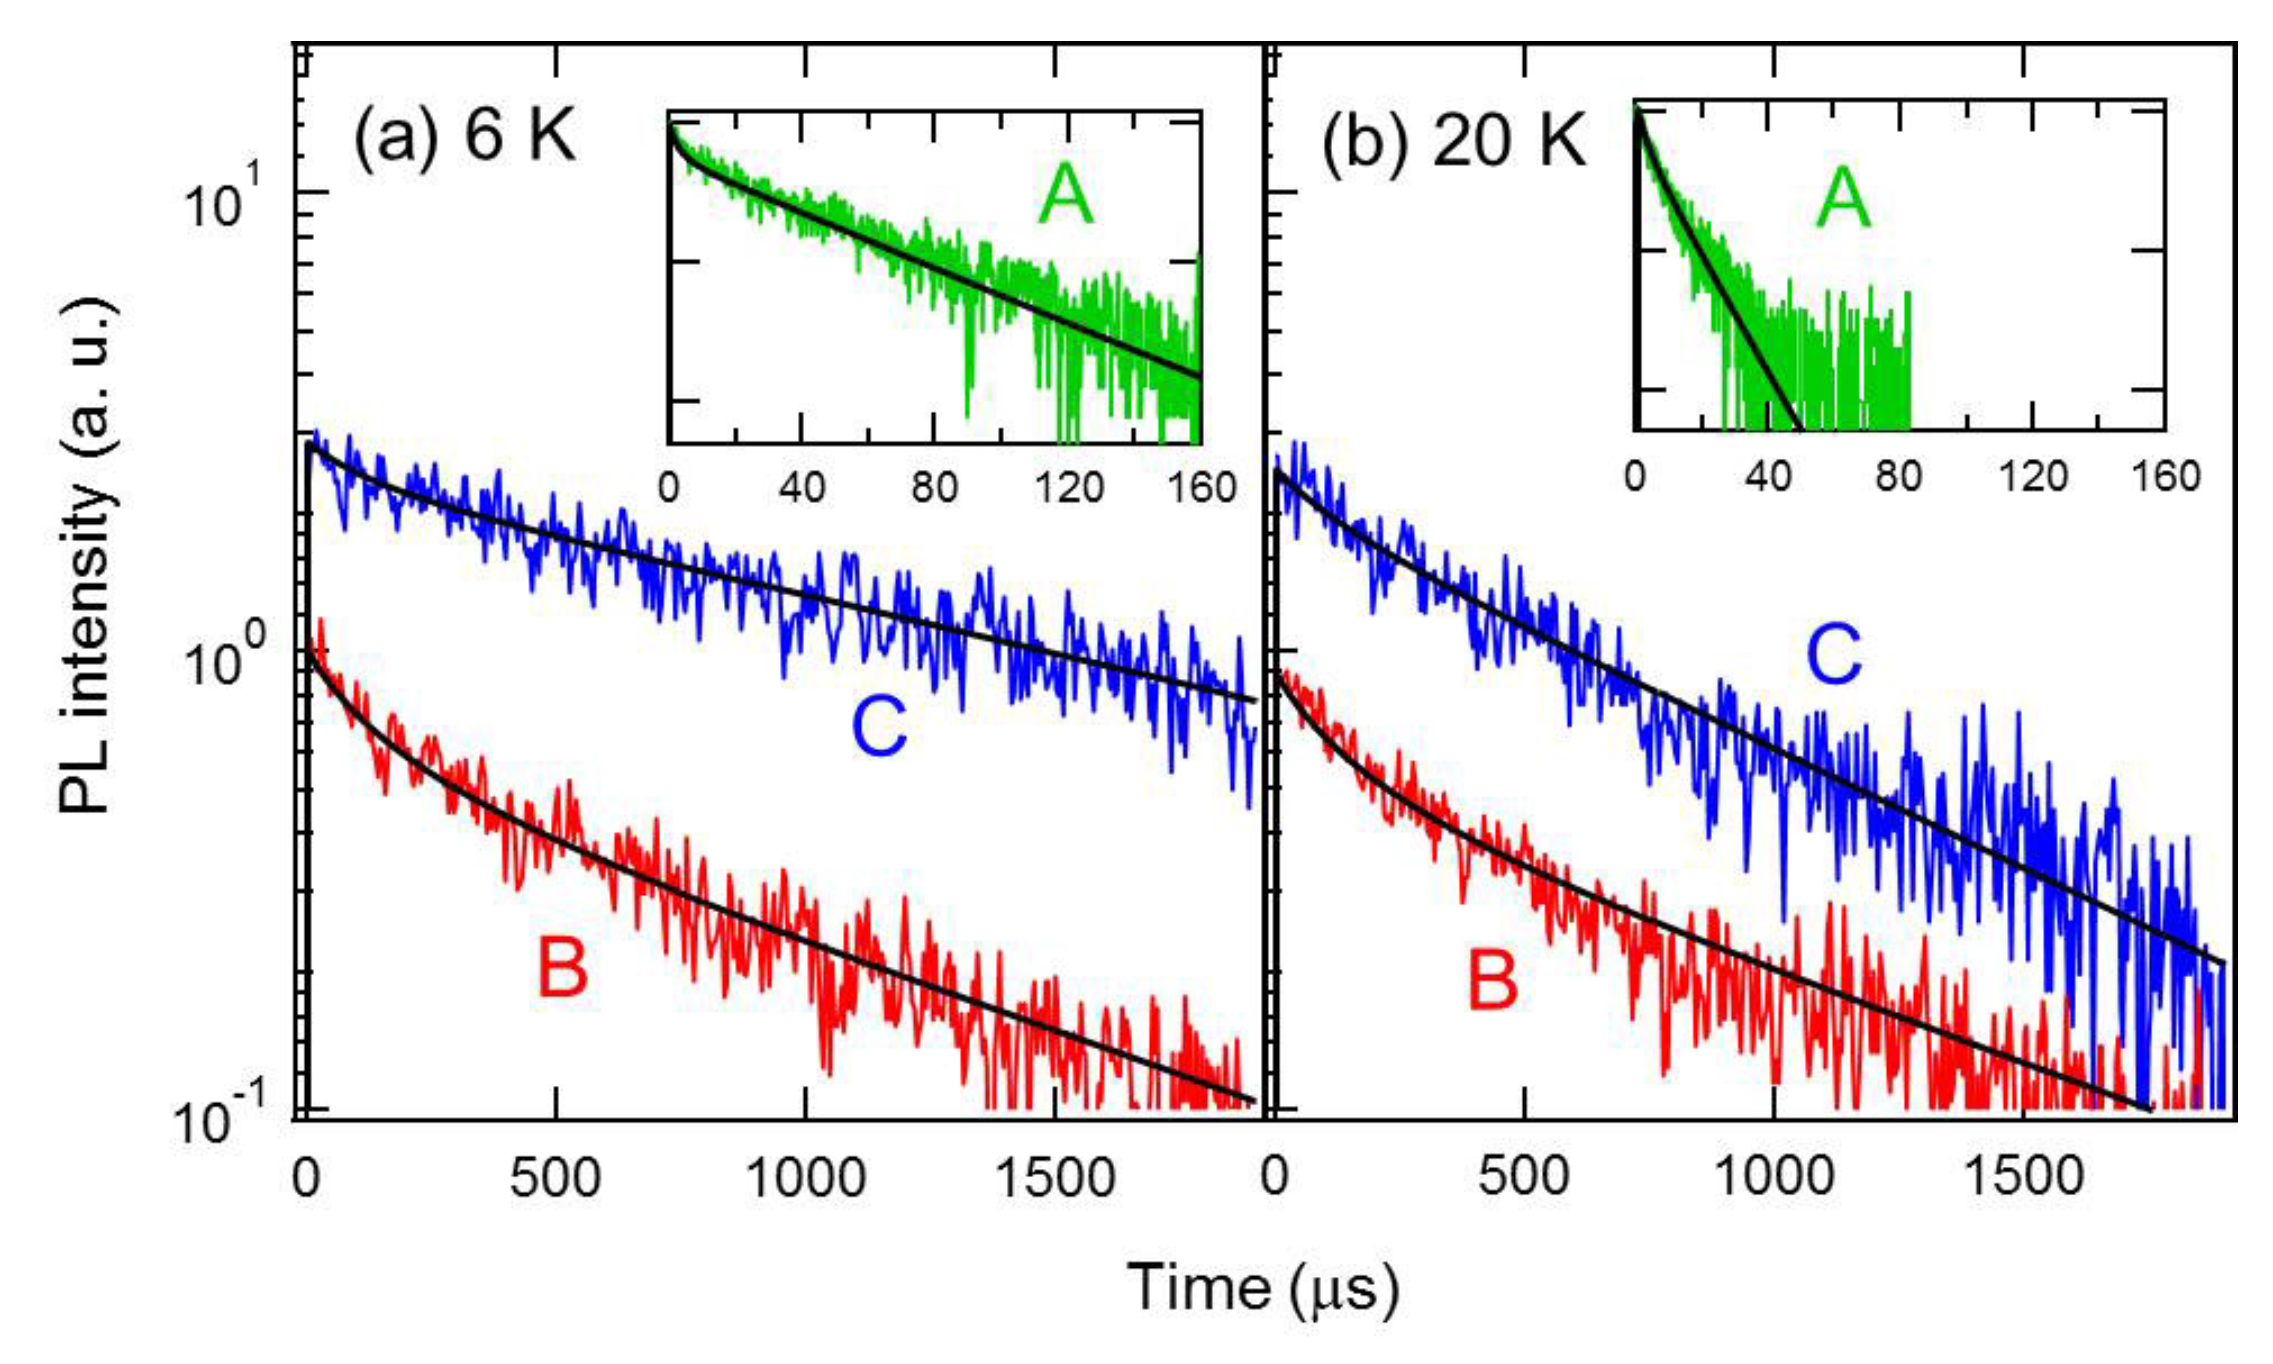
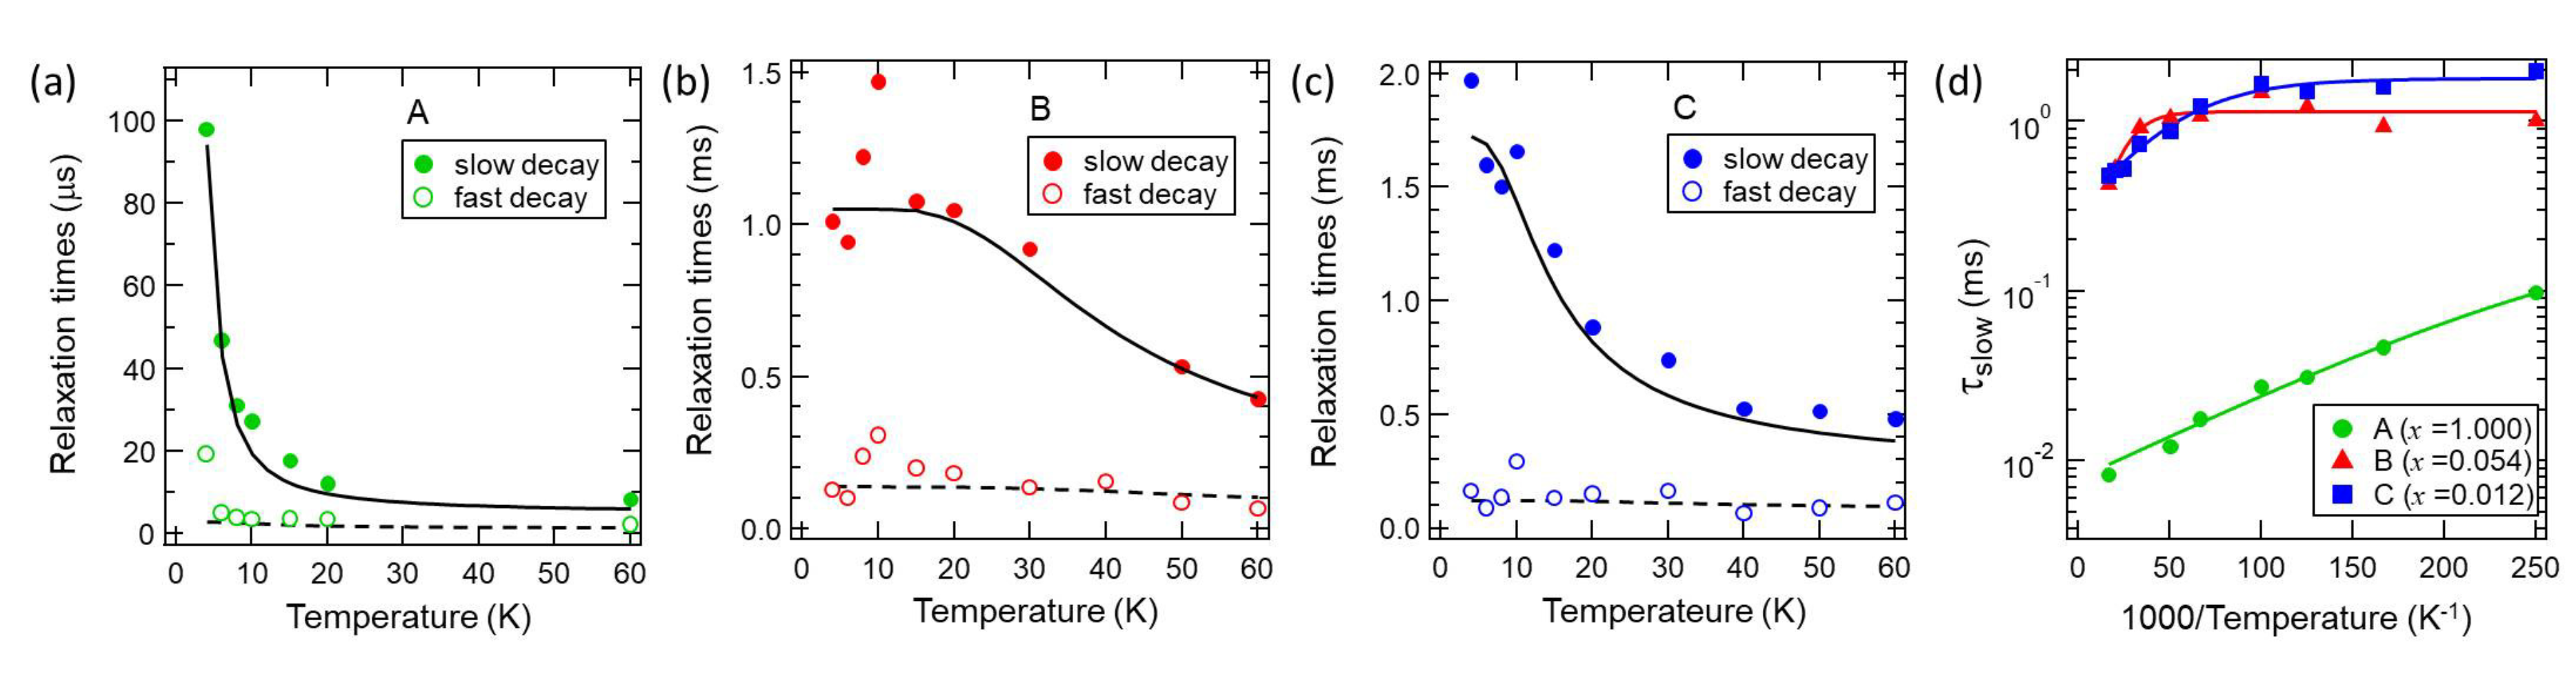
3.2. Time-Resolved Photoluminescence Measurements
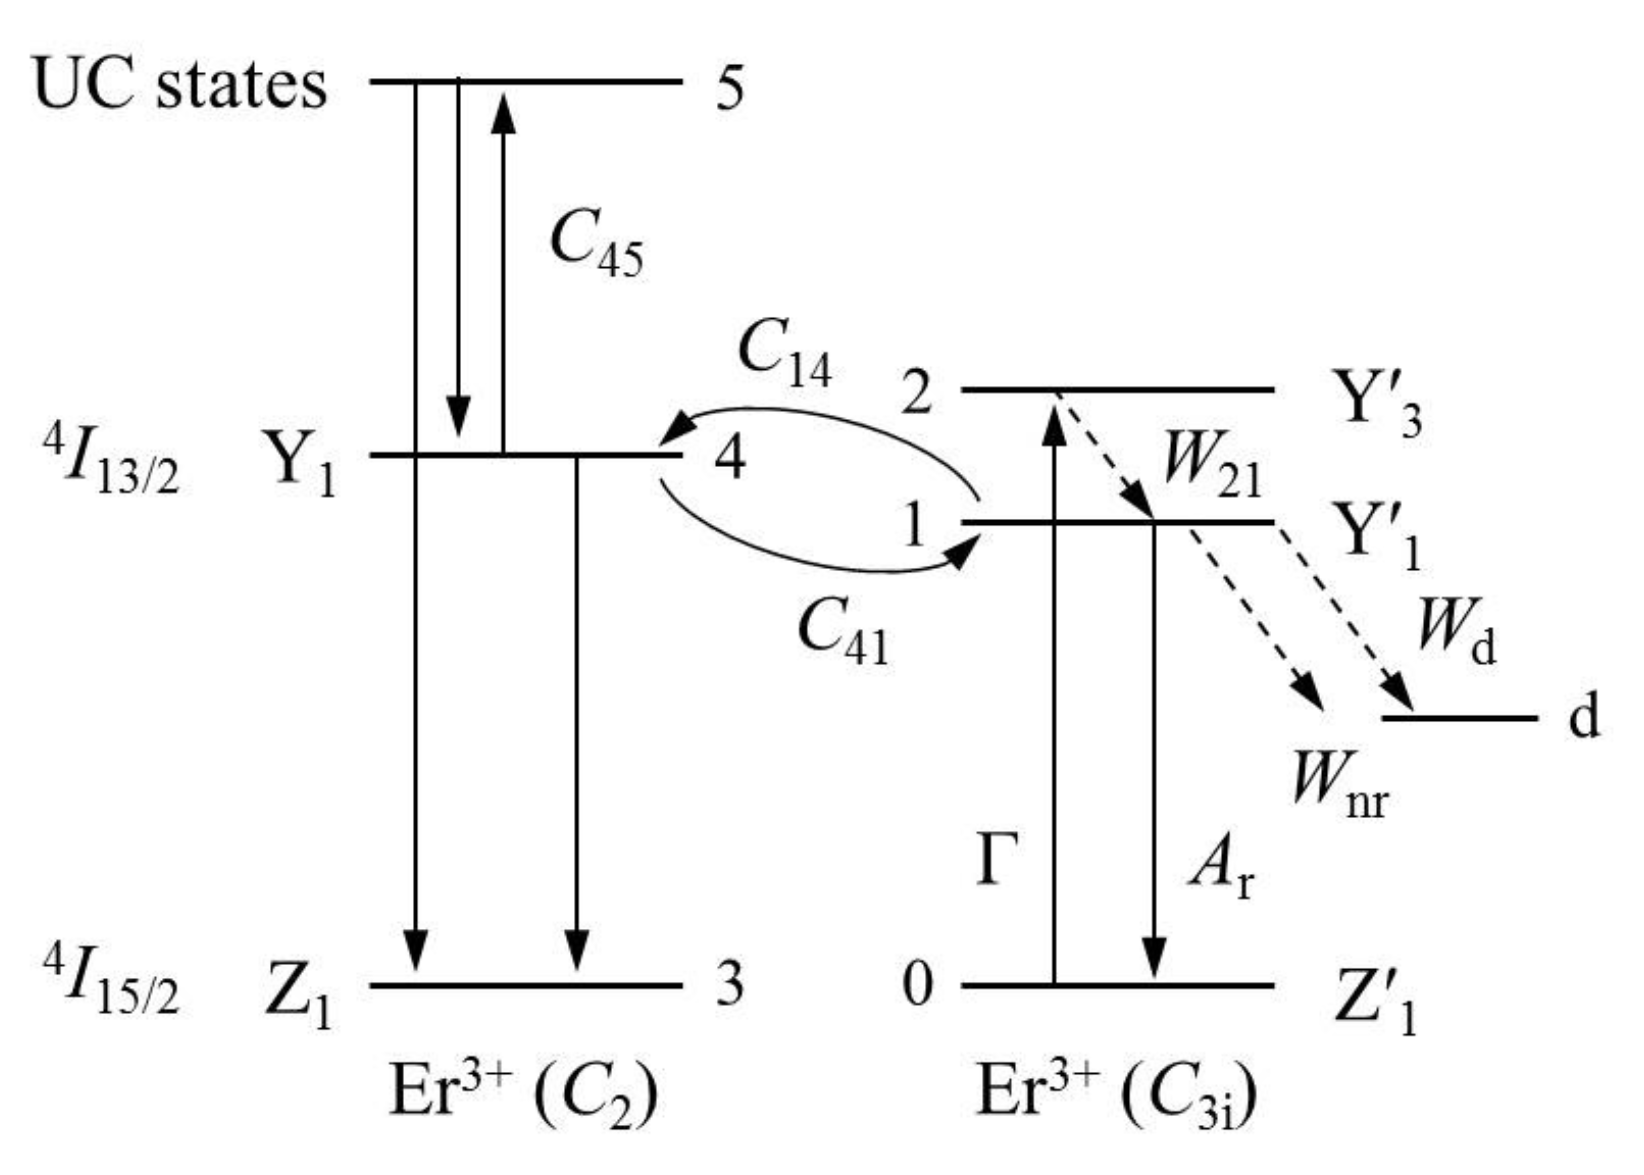
3.3. Model Calculations
4. Summary
Author Contributions
Acknowledgments
Conflicts of Interest
References
- Awschalom, D.D.; Samarth, N.; Loss, D. (Eds.) Semiconductor Spintronics and Quantum Computation; Springer: Berlin, Germany, 2002; ISBN 978-3-642-07577-3. [Google Scholar]
- Slavcheva, G.; Roussignol, P. (Eds.) Optical Generation and Control of Quantum Coherence in Semiconductor Nanostructures; Springer Series in NanoScience and Technology; Springer: Berlin, Germany, 2010; ISBN 978-3-642-12490-7. [Google Scholar]
- Bonadeo, N.H.; Erland, J.; Gammon, D.; Park, D.; Katzer, D.S.; Steel, D.G. Coherent optical control of the quantum state of a single quantum dot. Science 1998, 282, 1473–1476. [Google Scholar] [CrossRef] [PubMed]
- Press, D.; Ladd, T.D.; Zhang, B.; Yamamoto, Y. Complete quantum control of a single quantum dot spin using ultrafast optical pulses. Nature 2008, 456, 218–221. [Google Scholar] [CrossRef] [PubMed]
- De Greve, K.; McMahon, P.L.; Press, D.; Ladd, T.D.; Bisping, D.; Schneider, C.; Kamp, M.; Worschech, L.; Hofling, S.; Forchel, A.; et al. Ultrafast coherent control and suppressed nuclear feedback of a single quantum dot hole qubit. Nat. Phys. 2011, 7, 872–878. [Google Scholar] [CrossRef]
- Greilich, A.; Carter, S.G.; Kim, D.; Bracker, A.S.; Gammon, D. Optical control of one and two hole spins in interacting quantum dots. Nat. Photonics 2011, 5, 702–708. [Google Scholar] [CrossRef]
- Dutt, M.V.G.; Childress, L.; Jiang, L.; Togan, E.; Maze, J.; Jelezko, F.; Zibrov, A.S.; Hemmer, P.R.; Lukin, M.D. Quantum register based on individual electronic and nuclear spin qubits in diamond. Science 2007, 316, 1312–1316. [Google Scholar] [CrossRef] [PubMed]
- Fuchs, G.D.; Burkard, G.; Klimov, P.V.; Awschalom, D.D. A quantum memory intrinsic to single nitrogen-vacancy centres in diamond. Nat. Phys. 2011, 7, 789–793. [Google Scholar] [CrossRef]
- Boozer, A.D.; Boca, A.; Miller, R.; Northup, T.E.; Kimble, H.J. Reversible state transfer between light and a single trapped atom. Phys. Rev. Lett. 2007, 98. [Google Scholar] [CrossRef] [PubMed]
- Ritter, S.; Nölleke, C.; Hahn, C.; Reiserer, A.; Neuzner, A.; Uphoff, M.; Mücke, M.; Figueroa, S.; Bochmann, J.; Rempe, G. An elementary quantum network of single atoms in optical cavities. Nature 2012, 484, 195–200. [Google Scholar] [CrossRef] [PubMed]
- Stute, A.; Casabone, B.; Brandstätter, B.; Friebe, K.; Northup, T.E.; Blatt, R. Quantum-state transfer from an ion to a photon. Nat. Photonics 2013, 7, 219–222. [Google Scholar] [CrossRef] [PubMed]
- Böttger, T.; Thiel, C.W.; Cone, R.L.; Sun, Y. Effects of magnetic field orientation on optical decoherence in Er3+:Y2SiO5. Phys. Rev. B 2009, 79. [Google Scholar] [CrossRef]
- Thiel, C.W.; Böttger, T.; Cone, R.L. Rare-earth-doped materials for applications in quantum information storage and signal processing. J. Lumin. 2011, 131, 353–361. [Google Scholar] [CrossRef]
- Ter-Gabrielyan, N.; Fromzel, V.; Dubinskii, M. Performance analysis of the ultra-low quantum defect Er3+:Sc2O3 laser. Opt. Mater. Express 2011, 1, 503–513. [Google Scholar] [CrossRef]
- Tawara, T.; Mariani, G.; Shimizu, K.; Omi, H.; Adachi, S.; Gotoh, H. Effect of isotopic purification on spectral hole narrowing in 167Er3+ hyperfine transitions. Appl. Phys. Express 2017, 10. [Google Scholar] [CrossRef]
- Omi, H.; Tawara, T. Energy transfers between Er3+ ions located at the two crystalographic sites of Er2O3 grown on Si(111). Jpn. J. Appl. Phys. 2012, 51. [Google Scholar] [CrossRef]
- Tawara, T.; Omi, H.; Hozumi, T.; Kaji, R.; Adachi, S.; Goto, H.; Sogawa, T. Population dynamics in epitaxial Er2O3 thin films grown on Si(111). Appl. Phys. Lett. 2013, 102. [Google Scholar] [CrossRef]
- Omi, H.; Tawara, T.; Hozumi, T.; Kaji, R.; Adachi, S.; Gotoh, H.; Sogawa, T. Molecular beam epitaxy of (ErxSc1-x)2O3 in Si(111). In Proceedings of the International Conference on Photonics, Optics and Laser Technology (PHOTOPTICS 2014), Lisbon, Portugal, 7–9 January 2014. [Google Scholar]
- Adachi, S.; Kawakami, Y.; Kaji, R.; Tawara, T.; Omi, H. Energy transfers in telecommunication-band region of (Sc,Er)2O3 thin films grown on Si(111). J. Phys. Conf. Ser. 2015, 647. [Google Scholar] [CrossRef]
- Tawara, T.; Kawakami, Y.; Omi, H.; Kaji, R.; Adachi, S.; Goto, H. Mechanism of concentration quenching in epitaxial (ErxSc1-x)2O3 thin layers. Opt. Mater. Express 2017, 7, 1097–1104. [Google Scholar] [CrossRef]
- Gruber, J.B.; Nash, K.L.; Sardar, D.K.; Valiev, U.V.; Ter-Gabrielyan, N.; Merkle, L.D. Modeling optical transitions of Er3+(4f11) in C2 and C3i sites in polycrystalline Y2O3. J. Appl. Phys. 2008, 104. [Google Scholar] [CrossRef]
- Wybourne, B.G.; Smentek, L. Optical Spectroscopy of Lanthanides: Magnetic and Hyperfine Interactions; CRC Press: New York, NY, USA, 2007; ISBN 13-978-1-4200-0693-3. [Google Scholar]
- Johnson, L.F.; Guggenheim, H.J.; Rich, T.C.; Ostermayer, F.W. Infrared-to-Visible Conversion by Rare-Earth Ions in Crystals. J. Appl. Phys. 1972, 43, 1125–1137. [Google Scholar] [CrossRef]
- Van der Ziel, J.P.; Van Uitert, L.G.; Grodkiewicz, W.H.; Mikulyak, R.M. 1.5-μm infrared excitation of visible luminescent in Y1-xErxF3 and Y1-x-yErxTmyF3 via resonant-energy transfer. J. Appl. Phys. 1986, 60, 4262–4267. [Google Scholar] [CrossRef]
- Lüthi, S.R.; Pollnau, M.; Gudel, H.U.; Hehlen, M.P. Near-infrared to visible upconversion in Er3+-doped Cs3Lu2Cl9, Cs3Lu2Br9, and Cs3Y2I9 excited at 1.54 μm. Phys. Rev. B 1999, 60, 162–178. [Google Scholar] [CrossRef]
- Pollnau, M.; Gamelin, D.R.; Lüthi, S.R.; Güdel, H.U.; Hehlen, M.P. Power dependence of upconversion luminescence in lanthanide and transition-metal-ion systems. Phys. Rev. B 2000, 61, 3337–3346. [Google Scholar] [CrossRef]
- Lupei, A.; Lupei, V.; Gheorghe, C.; Ikesue, A. Excited States Dynamics of Er3+ in Sc2O3 Ceramic. J. Lumin. 2008, 128, 918–920. [Google Scholar] [CrossRef]
- Lupei, A.; Lupei, V.; Gheorghe, C.; Ikesue, A.; Osiac, E. Upconversion emission of RE3+ in Sc2O3 ceramic under 800 nm pumping. Opt. Mater. 2009, 31, 744–749. [Google Scholar] [CrossRef]
- Zheng, K.; Zhao, D.; Zhang, D.; Liu, N.; Qin, W. Ultraviolet upconversion fluorescence of Er3+ induced by 1560 nm laser excitation. Opt. Lett. 2010, 35, 2442–2444. [Google Scholar] [CrossRef] [PubMed]
- Auzel, F. Up-conversion in RE-doped Solids. In Spectroscopic Properties of Rare Earths in Optical Materials; Liu, G., Jacquier, B., Eds.; Springer: Berlin, Germany, 2005. [Google Scholar]
- Michael, C.P.; Yuen, H.B.; Sabnis, V.A.; Johnson, T.J.; Sewell, R.; Smith, R.; Jamora, A.; Clark, A.; Semans, S.; Atanackovic, P.B.; et al. Growth, processing, and optical properties of epitaxial Er2O3 on silicon. Opt. Express 2008, 16, 19649–19666. [Google Scholar] [CrossRef] [PubMed]
- Förster, T. Energy transfer and fluorescence between molecules. Ann. Phys. 1948, 437, 55–75. [Google Scholar] [CrossRef]
- Dexter, D.L. A theory of sensitized luminescence in solids. J. Chem. Phys. 1953, 21, 836–850. [Google Scholar] [CrossRef]
- Krupke, W.F.; Shinn, M.D.; Marion, J.E.; Caird, J.A.; Stokowski, S.E. Spectroscopic, optical, and thermomechanical properties of neodymium- and chromium-doped gadolinium scandium gallium garnet. J. Opt. Soc. Am. B 1986, 3, 102–114. [Google Scholar] [CrossRef]
- Sardar, D.K.; Gruber, J.B.; Zandi, B.; Hutchinson, J.A.; Trussell, C.W. Judd-Ofelt analysis of the Er3+ (4f11) absorption intensities in phosphate glass: Er3+, Yb3+. J. Appl. Phys. 2003, 93, 2041–2046. [Google Scholar] [CrossRef]
- Gheorghe, C.; Georgescu, S.; Lupei, V.; Lupei, A.; Ikesue, A. Absorption intensities and emission cross section of E3+ in Sc2O3 transparent ceramics. J. Appl. Phys. 2008, 103. [Google Scholar] [CrossRef]
- Feldmann, J.; Peter, G.; Göbel, E.O.; Dawson, P.; Moore, K.; Foxon, C.; Elliott, R.J. Linewidth dependence of radiative exciton lifetimes in quantum wells. Phys. Rev. Lett. 1987, 59, 2337–2340. [Google Scholar] [CrossRef] [PubMed]
- Reisfeld, R. Radiative and non-radiative transitions of rare-earth ions in glasses. In Structure and Bonding Vol. 22; Springer: Berlin, Germany, 1975; pp. 123–175. [Google Scholar]
- Inokuti, M.; Hirayama, F. Influence of energy transfer by the exchange mechanism on donor luminescence. J. Chem. Phys. 1965, 43, 1978–1989. [Google Scholar] [CrossRef]
- Cai, M.; Zhou, B.; Wang, F.; Wei, T.; Tian, Y.; Zhou, J.; Xu, S.; Zhang, J. R2O3 (R = La, Y) modefied erbium activated germanate glasses for mid-infrared 2.7 μm laser materials. Sci. Rep. 2015, 5. [Google Scholar] [CrossRef] [PubMed]

| Sample | x | Er Density | Er | Averaged Inter-Er | Averaged Intra(inter)-Site Distance | ||
|---|---|---|---|---|---|---|---|
| (cm) | in Unit Cell | Distance (Å) | C-C (Å) | C-C (Å) | C-C (Å) | ||
| A | 1.000 | 2.7 | 32 | 3.3 | 1.95 | 5.27 | 2.66 |
| B | 0.054 | 1.4 | 1.6 | 8.8 | 5.15 | 13.94 | 7.03 |
| C | 0.012 | 3.4 | 0.4 | 14.5 | 8.50 | 23.01 | 11.60 |
| Sample | Er | |||||
|---|---|---|---|---|---|---|
| x | (meV) | (ms) | (ms) | (ms) | (ms) | |
| A | 1.000 | 1.02 | 3.92 | 0.255 | 122 | 0.008 |
| B | 0.054 | 9.01 | 0.88 | 1.14 | 8.08 | 0.124 |
| C | 0.012 | 2.89 | 0.56 | 1.78 | 2.70 | 0.370 |
| Er | Non-Radiative Decays from | |||||||||||
|---|---|---|---|---|---|---|---|---|---|---|---|---|
| x | (ms) | (ms) | (ms) | (ms) | (ms) | (s) | ||||||
| 1.000 | 0.10 | 0.26 | 1.00 | 0.008 | 0.006 | 1.0 | 0.4 | |||||
| 0.054 | 1.59 | 1.18 | 500 | 30.3 | 0.160 | 3.3 | 0.4 | |||||
| 0.012 | 1.30 | 1.75 | 2 | 167 | 0.300 | 1.4 | 0.4 | |||||
© 2018 by the authors. Licensee MDPI, Basel, Switzerland. This article is an open access article distributed under the terms and conditions of the Creative Commons Attribution (CC BY) license (http://creativecommons.org/licenses/by/4.0/).
Share and Cite
Adachi, S.; Kawakami, Y.; Kaji, R.; Tawara, T.; Omi, H. Investigation of Population Dynamics in 1.54-μm Telecom Transitions of Epitaxial (ErxSc1-x)2O3 Thin Layers for Coherent Population Manipulation: Weak Excitation Regime. Appl. Sci. 2018, 8, 874. https://doi.org/10.3390/app8060874
Adachi S, Kawakami Y, Kaji R, Tawara T, Omi H. Investigation of Population Dynamics in 1.54-μm Telecom Transitions of Epitaxial (ErxSc1-x)2O3 Thin Layers for Coherent Population Manipulation: Weak Excitation Regime. Applied Sciences. 2018; 8(6):874. https://doi.org/10.3390/app8060874
Chicago/Turabian StyleAdachi, Satoru, Yoshihiro Kawakami, Reina Kaji, Takehiko Tawara, and Hiroo Omi. 2018. "Investigation of Population Dynamics in 1.54-μm Telecom Transitions of Epitaxial (ErxSc1-x)2O3 Thin Layers for Coherent Population Manipulation: Weak Excitation Regime" Applied Sciences 8, no. 6: 874. https://doi.org/10.3390/app8060874
APA StyleAdachi, S., Kawakami, Y., Kaji, R., Tawara, T., & Omi, H. (2018). Investigation of Population Dynamics in 1.54-μm Telecom Transitions of Epitaxial (ErxSc1-x)2O3 Thin Layers for Coherent Population Manipulation: Weak Excitation Regime. Applied Sciences, 8(6), 874. https://doi.org/10.3390/app8060874