Article

Residual Axial Bearing Capacity of Concrete-Filled Circular Steel Tubular Columns (CFCSTCs) after Transverse Impact

1
School of Urban Construction, Yangtze University, Jingzhou 434023, China
2
Hubei Key Laboratory of Roadway Bridge and Structure Engineering, Wuhan University of Technology, Wuhan 430070, China
3
State Key Laboratory of Coastal and Offshore Engineering, Dalian University of Technology, Dalian 116024, China
*
Author to whom correspondence should be addressed.
Appl. Sci. 2018, 8(5), 793; https://doi.org/10.3390/app8050793
Submission received: 13 April 2018 / Revised: 2 May 2018 / Accepted: 2 May 2018 / Published: 16 May 2018
(This article belongs to the Special Issue Emerging Construction Materials and Sustainable Infrastructure)

Abstract

:
The purpose of this research is to study the effect of both transverse impact, and ratio of outer diameter to thickness of outer steel tube (D/t), on the residual axial bearing capacity of concrete-filled circular steel tubular columns (CFCSTCs). A total of sixteen samples, including four samples left untreated for comparison, are experimentally studied to investigate the effect of both drop-hammer transverse impact height (H), and D/t ratio, on the residual axial bearing capacity of CFCSTCs. The failure mode, load-displacement curves, load-strain curves, and residual axial bearing capacity of those samples are extensively investigated. A finite element analysis (FEA) model is established to predict the effect of D/t ratio on the residual axial bearing capacity of CFCSTCs. The results indicate that the H and the D/t ratio have noticeable effects on the axial compression performance of CFCSTCs. Failure mode of samples is commonly local buckling. In addition, maximum reduction of the axial bearing capacity of columns reaches about 35% compared with that of untreated columns. The results also show that the bearing capacity of the column increases with a decreasing D/t ratio of the same diameter (D).

Graphical Abstract

1. Introduction

Concrete Filled Tube (CFT) structures are widely used in engineering due to their excellent structural and constructional performance [1,2]; this is especially the case for typical forms of Concrete Filled Steel Tube (CFST) structures [3,4,5,6,7,8,9,10]. Attention also has been paid to Concrete Filled Fiber Reinforced Polymer (FRP) Tubes, in view of their anti-corrosion properties, which can be better adapted to corrosive environments than CFST [11,12,13,14,15,16]. However, compared with concrete filled FRP Tubes (CFFT), CFSTs are preferred when involving transverse impacts, because steel has much better toughness than FRP when subjected to direct impacts. Throughout the whole life cycle, structures, including the CFTs, may be subjected to transverse impacts from accidental or deliberate events. Accurate vulnerability assessments are crucial in the design process to ensure the safety of CFT composite structures when faced with unexpected loads [17]. At present, structural damage detection [18,19,20] and health monitoring methods [21,22,23,24] have been developed to monitor the damage status and well-being of a structure in real time. Simultaneously, experimental and numerical simulation studies have also been conducted to predict the behavior of structure under unexpected loads, such as impacts, explosions, and other high dynamic loads [25,26,27,28,29].
In recent years, experimental and theoretical studies on the behavior of CFSTs under transverse impact have been broadly conducted. Axial impact experiments on twenty-one circular CFST columns were carried out by Chen et al. [30]. Bambach [31] and Bambach et al. [32] experimentally investigated the performance of square CFST members subjected to lateral impacts at the beam mid-span. Wang et al. [33,34,35] experimentally investigated the impact performance of CFST members and FRP-concrete-steel double skin tubular members. The failure modes and the time history of the impact forces for those members under lateral impact were obtained. In addition, an investigation of the behavior of concrete filled double steel tubular members under lateral impact using ABAQUS 2016 was presented. Subsequently, the experimental and theoretical studies on the behavior of high-strength concrete-filled steel tubes under transverse impact loading were conducted by Han et al. [36]. Alam et al. [37,38] experimentally and theoretically developed a study on the performance and dynamic behavior of carbon FRP strengthened CFST members subjected to lateral impact.
Apart from the aforementioned work [30,31,32,33,34,35,36,37,38], some other studies [39,40] have been reported on CFST members subjected to transverse impact. The majority of these studies demonstrate that CFST members with different configurations have excellent transverse impact resistance. However, there is a lack of investigation into the performance of CFST members after exposure to transverse impact loads. Chen et al. [41,42] conducted research on residual axial bearing capacity, but the sample was only aimed at hollow steel tubes. Therefore, it is of great importance to investigate the residual bearing capacity of CFCSTCs after transverse impact.
This paper presents an experimental and theoretical investigation into the residual compressive bearing capacity of CFCSTCs after transverse impact. In this research, the effects of drop-hammer transverse impact height (H), and ratio of outer diameter to thickness (D/t) of outer steel tube on the residual compressive bearing capacity of CFCSTCs after transverse impact load, are experimentally investigated. Moreover, the failure mode, load-displacement curves, load-strain curves, and residual axial bearing capacity of those samples are extensively investigated based on the experimental results. Furthermore, a finite element analysis (FEA) model is developed to predict the residual compressive bearing capacity of CFCSTCs after transverse impact load with different D/t ratios.

2. Experimental Investigation of Column

2.1. Test Samples

In the test, a total of sixteen CFCSTCs are tested with different drop-hammer transverse impact heights of (H) and diameter-thickness (D/t) ratio under axial compression force, in which four CFCSTCs are not impacted for comparison. The samples have H ranging from 0 m to 4 m, and D/t ratios ranging from 19.9 to 36.5. Table 1 shows the cross-section dimensions, the test parameters and results of all samples. The definition of some symbols are presented in Figure 1. As shown in Table 1, all samples are labeled to identify the D/t ratio and H of the samples. For example, the label “C159 ×6-R26.5-H0” is defined as follows:
  • The first part “C159×6” means that the sample is concrete-filled circular steel tubular columns with the nominal diameter (D) of 159 mm and thickness (t) of 6 mm.
  • The second part “R26.5” indicates that the ratio of diameter-thickness (D/t) of the sample is 26.5.
  • The following notation “H0” demonstrates that the height of the drop-hammer (H) is 0 m.
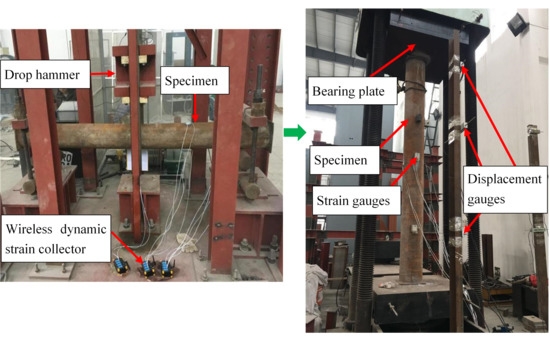
The material properties of all samples are shown in Table 2.

2.2. Test Program

2.2.1. Transverse Impact Program

The transverse impact test is performed on a drop-hammer impact test rig with hinged boundary conditions at both ends. The maximum height of the drop hammer is 7.5 m, and the corresponding maximum impact velocity is 12.36 m/s. The mass of the drop hammer is 339 kg. Details of the drop-hammer impact test rig are shown in Figure 2.

2.2.2. Axial Compression Program

The axial compression test is carried out on the electro-hydraulic servo universal testing setup with a maximum capacity of 5000 kN, as shown in Figure 3. Before the test, the outer surface of all sample was cleaned using a steel wire brush to remove rust or dust. The arrangement of strain gauges of the samples is shown in Figure 4. For each sample, four bi-directional strain rosettes with intervals of 90° are attached to the outer surface of the sample at mid-span, and six displacement gauges are placed in horizontal and vertical directions at 1/2, 1/3 and 1/4 heights of the samples. In order to avoid the end effect, two rigid steel plates are placed between the both ends of the samples and two bearing plates of test setup. During the experiment, the applied load is controlled and measured by the electronic load transducer, and the date of deflection and strain are measured at each load step.

2.3. Transverse Impact Test Results and Discussions

Photographs of the samples after transverse impact tests are shown in Figure 5. The test results of all sixteen samples are shown in Table 1. It can be seen that in the transverse impact test, the residual displacement of the mid-span (Δo) increases with an increase in the drop hammer height (H). In addition, the outer diameter (D) and thickness (t) of the steel tubes have noticeable effect on the impact performance. The Δo reduces with increasing D or t. The typical impact force (F)-time (T) curves of all samples under transverse impact test are shown in Figure 6. It can be known that the trends of F-T curves can be divided into three stages. Firstly, the impact force reaches the peak value rapidly at the moment of impact; this process is defined as the peak stage. Subsequently the impact force descends to stationary stage, and the value of force remains steady; therefore, this period is described as the stationary stage. With the impact energy dissipation, the impact force gradually descends to zero; this last stage is called the unloading stage. It also can be seen that the peak value and amplitude of the impact force increase with the increasing impact height.

2.4. Axial Compression Test Results and Discussions

2.4.1. Basic Behavior

The test results of all samples are presented in Table 1. Figure 7a,b show the residual bearing capacity (Pu) and mid-span lateral displacement (Δr) with the variations of H and the cross-section dimensions respectively. It can be seen from Table 1 and Figure 7a that for CFCSTCs, the residual bearing capacity (Pu) decreases with the increasing H. Furthermore, for samples with same D and t, the highest Pu is obtained by the sample that is not subjected to impact loading before the axial compression test, while the lowest Pu is achieved by the sample with H of 4 m. It also can be found that for C159×6-R26.5-H0 to H4 samples, the reduction of Pu is 35%. However, for C159×8-R19.9-H0 to H4, C219×6-R36.5-H0 to H4, C219×8-R27.4-H0 to H4, the reduction of Pu is 29%, 13% and 4%, respectively. This means that the influence of H on Pu is obviously smaller as a result of the increasing D or t. In addition, under the same H, the Pu decreases with increasing D/t ratio under the same D, while the Pu decreases with decreasing D/t ratio under the same t. It may be observed that a larger D or t can significantly improve the flexural rigidity, and thus Pu can be increased.
It can be noted from Table 1 and Figure 7b that under axial compression, the residual mid-span lateral displacement (Δr) increases with increasing H. In addition, under the same H, Δr increases with increasing D/t ratio under the same D, while Δr decreases with an increasing D/t ratio under the same t. This may attribute to the fact that the capacity to resist deformation of CFCSTC can be improved significantly by increasing the t or D.

2.4.2. Failure Modes

In axial compression tests, the failure modes of samples with different H and D/t ratios are shown in Figure 8. It can be seen that failure modes can be divided into two serials. Mode 1 is the local buckling occurs at the impact location, where the deformation shape of the sample is like a “C”; Mode 2 is the local buckling happens at the upper and underside zone of mid-span, where the deformation shape of the sample is like an “S”. Mode 1 most likely occurs on samples with bigger H, while Mode 2 commonly occurs on samples with lower H or with bigger D/t ratios under the same t or with lower D/t ratios under the same D. Furthermore, the crack never appears when the failure occurs.

2.4.3. Load-Displacement Curves

The typical load-displacement curves of all samples are shown in Figure 9. The vertical axis denotes the axial force (P) and the horizontal axis denotes the vertical displacement (Δv). The ultimate bearing capacity (Pu) under compression is presented in Table 1. As shown in Figure 7a and Figure 9c, it can be concluded that with the increasing D, both the Pu and the vertical displacement corresponding to Pu increase, whereas the influence of H on the P-Δv curves decreases significantly. Similar results may be obtained, as shown in Figure 9b,d. It may be observed that the capacity to resist impact is improved by a large D, and thus, the residual bearing capacity after transverse impact cannot be significantly influenced by the drop hammer height.
Comparing Figure 9a,b, it can be noted that with the increasing t, both the Pu and the initial slope of the P-Δv curve increase, while the vertical displacement corresponding to Pu decreases. Similar results may be obtained, as shown in Figure 9c,d. It may be due to the fact that the capacity to resist deformation of CFCSTC can be improved by increasing the t. However the difference resulting from the t is not more evident than that of the D, which may be due to the fact that the effect of t on the behavior of CFCSTC is less than that of D.

2.4.4. Load-Longitudinal Strain Curves

C159×6-R26.5 was used as an example to analyze the relationship between axial compression load and longitudinal strain (P-εL), as shown in Figure 10, in which negative and positive value denote compressive and tensile strain respectively. It can be noted that the trends of P-εL curves can be divided into three stages. Firstly, the εL increases linearly with the increasing P and the εL is relatively small; therefore, this process is defined as the elastic stage. Subsequently, the εL increases nonlinearly with the increasing P, and this period is termed the elastic-plastic stage. With the increasing P until the maximum value is reached, the growth rate of εL is greater than the increment speed of P, and the deformation increases significantly, so this last stage is called the plastic stage. Most of strain gauges points enter the plastic state when the P reaches to the maximum value.
By comparing the εL curves of C159×6-R26.5 samples under different H, it can be found that for an undamaged sample, i.e., C159×6-R26.5-H0, the maximum compressive strain at yield load is about 2620 με, which is greater than the yield strain of steel. It may be explained that under the synergistic action of core concrete, the compressive strength of CFCST structure is much higher than that of steel structures. In addition, the undamaged sample is almost under compression during the whole deformation process, and before entering into plastic stage, the εL values of all points are very close, which reflects the phenomenon that the sample is vertically and uniformly compressed.
Nevertheless, for the damaged samples, i.e., C159×6-R26.5-H2 to H4, the P-εL curves increases linearly before the loading reaches to 0.7–0.75 Pu. After that, the sample enters the elastic-plastic stage and at the concave side in the middle of the column (i.e., the position where the strain gauge 5 is attached), the compressive growth rate of εL is the fastest. Meanwhile, at the convex side in the middle of the column (i.e., the position where the strain gauge 1 is pasted), the εL is the compressive strain at the initial stage of loading, and after the sample yields, εL gradually decreases to 0 and eventually becomes the tensile strain.

2.4.5. Load-Transverse Strain Curves

The axial compression load versus transverse strain (P-εT) curves of the C159×6-R26.5 sample is shown in Figure 11. Comparing the curves of Figure 10, it can be generally found that the transverse strain (εT) is smaller than the longitudinal strain. It can be found from Figure 11 that at the initial loading, the transverse strain increases slowly, due to the fact that the constraint of outer steel tube to core concrete is a relatively weak. With the increasing P, the constraint effect of steel tube on core concrete is strengthened. After entering the elastic-plastic stage, the transverse deformation of concrete is greater than that of the steel tube, resulting in the extrusion of outer steel tube by concrete and the rapid increase of εT.
It also can be found from Figure 11 that the εT of undamaged samples (i.e., C159×6-R26.5-H0) is less than that of damaged samples. In addition, for undamaged samples before entering into plastic stage, the εT values of all points are basically the same, which also reflects the fact that the sample is vertically and uniformly compressed. For damaged samples, i.e., C159×6-R26.5-H2 to H4, except εT at the position where the strain gauge 2 is pasted from the tension strain to compression strain, the εT at the other position are tension strains during the whole deformation process; this may be due to the different deformation rates of steel tube and core concrete. At the concave side in the middle of the column (i.e., the position where the strain gauge 6 is attached), the εT is almost the biggest, which is consistent with the position where the longitudinal strain gauge 5 is attached. With the increase of H, most of εT is larger, and the deformation rate of sample is higher.

3. Finite Element Analysis (FEA) of Column

3.1. Detail of the Column Model

A finite element analysis (FEA) model is established using the commercial software ABAQUS 2010/Explicit [43] to further investigate the bearing capacity of CFCSTCs. Suitable modeling must be done properly to evaluate the axial behavior of the CFCSTCs after transverse impact. A simplified nonlinear finite element method is developed for CFCSTCs with different D/t ratio under axial loading.

3.1.1. Finite Element Type and Mesh

In the model, the 8-node reduced-integration brick solid element (C3D8R) provided by ABAQUS [43] is adopted to simulate the steel tube, the core concrete, and the steel plates, as proposed by Tao et al. [44] and Classen et al. [45]. A fine mesh is used to develop the model to ensure the simulation effectiveness. The details of the CFCSTC model are shown in Figure 12.

3.1.2. Material Model

The elastic–plastic model in ABAQUS [43], including elastic and plastic parts, is applied to express the constitutive relationship of steel. The elastic part requires the modulus of elasticity (Es) and Poisson’s ratio to be 2.06 × 10⁵ N/mm2 and 0.2 respectively. The plastic part requires the input of a true stress-plastic strain relationship, acquired by transforming the one introduced by Han et al. [36] in this paper.
The concrete damage plasticity (CDP) model provided by ABAQUS [43], including elastic part and plastic part, is used to express the constitutive relationship of a concrete structure under compression and tension. The elastic part requires the modulus of elasticity (Es) and Poisson’s ratio. The modulus of elasticity (Es) can be obtained by the equation of 4700 f c ' , proposed in [46], where f c ' is the cylinder compressive strength of concrete. Poisson’s ratio is set to 0.2. The plastic part contains the concrete under compression and tension, and it can be obtained from Han et al. [36].
The evolutions of tension (dt) and compression (dc) damage variables in CDP model can be used to express the concrete damage induced by plastic deformation. The dt and dc can be calculated using the equations, as proposed by Birtel and Mark [47].
Five parameters in CDP model, including the dilation angle of 30°, the eccentricity of 0.1, the fb0/fc0 of 1.16, the K of 0.6667 and the viscosity parameter of 0.0005, are used to describe the yield function and plastic flow procedure of concrete.

3.1.3. Concrete to Steel Interfaces

The contact models in ABAQUS [43], including normal and tangential directions, is used to model the interface properties between concrete and steel. In the normal direction, a hard contact model is used. A Coulomb friction model is applied in the tangential direction and the dynamic friction coefficient of 0.6 and static friction coefficient of 0.5, proposed in [33,48,49,50,51], are used for the interface between the steel tube and core concrete. In addition, the *TIE option in ABAQUS is adopted to simulate the welding lines between steel tube and steel plates.

3.1.4. Boundary Conditions and Load Application

The model is divided into three parts: the steel tube, the core concrete, and the steel plates. The steel plates can be regarded as elastic rigid plates, and modulus of elasticity and Poisson’s ratio are 1 × 10¹² N/mm2 and 0.0001 respectively. All translational displacements (UX, UY and UZ) of the bottom steel plate are constrained, as shown in Figure 12. The impact load (F) is imposed on the mid-span of the columns using the *PREDEFINED FIELDS option in the first step and axial compressive load (P); this is then imposed onto the top steel plate using *LOAD option in the second step.

3.2. Verification of the FEA Model

The stress and deformation of CFCSTC with different H are shown in Figure 13. It can be seen from Figure 13 that the FEA model can predict the local buckling of column. Figure 13a shows that with the increasing P, the stress develops from the middle area where the buckling occurs towards the ends of sample. Similar behavior can be seen from Figure 13b, while there is a difference that the biggest stress is at the impact location. Through the FEA results, it also can be seen that for C219×8-R27.4-H0, local buckling occurs at the upper and underside zone of mid-span, while for C219×8-R27.4-H4 the deformation only occurs at the mid-span. In addition, deformation increases with the increment of H, and the results obtained by FEA model are in generally good agreement with the test results.

3.3. Parametric Study

Sample C219×8-R27.4-H0, which is presented in Section 2 of this paper, is selected as a typical example for the analysis in this section. The basic parameters of this sample are: D × t = 219 mm × 8 mm, L = 2250 mm, fy = 291.2 N/mm2, fcu = 31.2 N/mm2, H = 0 m. Three samples with different diameter-thickness (D/t) ratio are simulated to analyze the effect of the D/t ratio on the performances of the columns. The change of the D/t ratio is realized by changing t with D = 219 mm. The force-time (P-T) curves of simulated results, and the ways in which variations of D/t ratio affect the bearing capacity of the samples are shown in Figure 14 and Figure 15 respectively. It can be concluded that the bearing capacity of the CFCSTCs can be increased by decreasing D/t ratio on the premise that diameter (D) is constant.

4. Conclusions and Future Work

The following conclusions may be drawn within the limitations of the research:
(1)
Failure mode of CFCSTCs under axial compression can be divided into two serials. Mode 1 is that local buckling occurs at the impact location; Mode 2 is that local buckling happens at the upper zone and underside zone of mid-span. Mode 1 most likely occurs on samples with bigger H, while Mode 2 easily occurs on samples with lower H or with bigger D/t ratio under the same t or with lower D/t ratio under the same D.
(2)
The transverse impact height of drop-hammer (H) and D/t ratio have noticeable effects on the axial compression performance of CFCSTCs. Bearing capacity (Pu) decreases with the increasing H. For samples with same D and t, the highest Pu is obtained by the undamaged sample, while the lowest Pu is achieved with the sample with H of 4 m. The maximum reduction of Pu reaches about 35%, compared with that of undamaged columns. The influence of H on Pu is obviously smaller with increasing D or t. Moreover, the residual mid-span lateral displacement (Δr) increases with increasing H. In addition, under the same H, the Pu decreases with increasing D/t ratio under the same D, while decreases with decreasing D/t ratio under the same t; conversely, Δr increases with increasing D/t ratio under the same D, but decreases with increasing D/t ratio under the same t.
(3)
For P-Δv curves of CFCSTCs under axial compression, both the Pu and the vertical displacement corresponding to Pu increase with the increasing D, whereas the influence of H on the P-Δv curves decrease significantly with the increasing D. Furthermore, with the increasing t, both the Pu and the initial slope of the P-Δv curve increase, while the vertical displacement corresponding to Pu decreases.
(4)
A three-dimensional FEA model is proposed to predict the response of CFCSTC under axial compression. A reasonably good agreement is achieved between the predicted and the experimental results in terms of deformation and stress distribution.
Future research will involve conducting the experiment on the performance of CFCSTC with axial load under transverse impact, and then analyzing the residual bearing capacity. Lastly, through theoretical analysis and numerical simulation, simple design calculations can be proposed.

Author Contribution

G.D. incepted the research; G.D. and A.A. designed the experiments; A.A., Z.L., X.B., Z.L. and G.D. conducted the experiments; A.A., X.B. and Z.L. analyzed the data; G.D., X.B. and A.A. wrote the paper.

Acknowledgments

The research presented in this paper is part of Project (51778064) supported by National Natural Science Foundation of China, the Project (2016D-5007-0605) supported by Petroleum Science and Technology Innovation Foundation of China, and the Project (2016CFA022) supported by Natural Science Foundation of Hubei Province, China. The financial support is highly appreciated.

Conflicts of Interest

The authors declare no conflict of interest.

References

  1. Hu, H.T.; Huang, C.S.; Wu, M.H.; Wu, Y.M. Nonlinear analysis of axially loaded concrete-filled tube columns with confinement effect. J. Struct. Eng. 2003, 129, 1322–1329. [Google Scholar] [CrossRef]
  2. Giakoumelis, G.; Lam, D. Axial capacity of circular concrete-filled tube columns. J. Constr. Steel Res. 2004, 60, 1049–1068. [Google Scholar] [CrossRef]
  3. Sakino, K.; Nakahara, H.; Morino, S.; Nishiyama, I. Behavior of centrally loaded concrete-filled steel-tube short columns. J. Struct. Eng. 2004, 130, 180–188. [Google Scholar] [CrossRef]
  4. Lu, Y.; Li, N.; Li, S. Behavior of FRP-confined concrete-filled steel tube columns. Polymers 2014, 6, 1333–1349. [Google Scholar] [CrossRef]
  5. Krishan, A.L.; Troshkina, E.A.; Chernyshova, E.P. Efficient design of concrete filled steel tube columns. Procedia Eng. 2016, 150, 1709–1714. [Google Scholar] [CrossRef]
  6. Schneider, S.P. Axially loaded concrete-filled steel tubes. J. Struct. Eng. 1998, 124, 1125–1138. [Google Scholar] [CrossRef]
  7. O'Shea, M.D.; Bridge, R.Q. Design of circular thin-walled concrete filled steel tubes. J. Struct. Eng. 2000, 126, 1295–1303. [Google Scholar] [CrossRef]
  8. Varma, A.H.; Ricles, J.M.; Sause, R.; Lu, L.W. Experimental behavior of high strength square concrete-filled steel tube beam-columns. J. Struct. Eng. 2002, 128, 309–318. [Google Scholar] [CrossRef]
  9. Xu, B.; Zhang, T.; Song, G.; Gu, H. Active interface debonding detection of a concrete-filled steel tube with piezoelectric technologies using wavelet packet analysis. Mech. Syst. Signal Process. 2013, 36, 7–17. [Google Scholar] [CrossRef]
  10. Du, G.F.; Bie, X.M.; Li, Z.; Guan, W.Q. Study on constitutive model of shear performance in panel zone of connections composed of CFSSTCs and steel-concrete composite beams with external diaphragms. Eng. Struct. 2018, 155, 178–191. [Google Scholar] [CrossRef]
  11. Ozbakkaloglu, T.; Akin, E. Behavior of FRP-confined normal-and high-strength concrete under cyclic axial compression. J. Compos. Constr. 2012, 16, 451–463. [Google Scholar] [CrossRef]
  12. Ozbakkaloglu, T. Behavior of square fiber reinforced polymer–high-strength concrete–steel double-skin tubular columns under combined axial compression and reversed-cyclic lateral loading. Eng. Struct. 2016, 118, 307–319. [Google Scholar]
  13. Huang, L.; Sun, X.; Yan, L.; Zhu, D. Compressive behavior of concrete confined with GFRP tubes and steel spirals. Polymers 2015, 7, 851–875. [Google Scholar] [CrossRef]
  14. Abdelkarim, O.I.; ElGawady, M.A. Concrete-filled-large deformable FRP tubular columns under axial compressive loading. Fibers 2015, 3, 432–449. [Google Scholar] [CrossRef]
  15. Luo, M.; Li, W.; Hei, C.; Song, G. Concrete infill monitoring in concrete-filled FRP tubes using a PZT-based ultrasonic time-of-flight method. Sensors 2016, 16, 2083. [Google Scholar] [CrossRef] [PubMed]
  16. Xu, Y.; Luo, M.; Chuang, H.; Song, G. Quantitative evaluation of compactness of concrete filled fiber-reinforced-polymer tubes (CFFTs) using piezoceramic transducers and time difference of arrival. Smart Mate. Struct. 2018, 27, 035023. [Google Scholar] [CrossRef]
  17. Deng, Y.H.; Tuan, C.Y. Design of concrete filled circular steel tubes under lateral impact. ACI Struct. J. 2013, 110, 691–701. [Google Scholar]
  18. Hu, X.; Zhu, H.; Wang, D. A study of concrete slab damage detection based on the electromechanical impedance method. Sensors 2014, 14, 19897–19909. [Google Scholar] [CrossRef] [PubMed]
  19. Kong, Q.; Robert, R.H.; Silva, P.; Mo, Y.L. Cyclic crack monitoring of a reinforced concrete column under simulated pseudo-dynamic loading using piezoceramic-based smart aggregates. Appl. Sci. 2016, 6, 341. [Google Scholar] [CrossRef]
  20. Xu, J.; Hao, J.; Li, H.; Luo, M.; Guo, W.; Li, W. Experimental damage identification of a model reticulated shell. Appl. Sci. 2017, 7, 362. [Google Scholar] [CrossRef]
  21. Du, G.; Zhang, J.; Zhang, J.; Song, G. Experimental study on stress monitoring of sand-filled steel tube during impact using piezoceramic smart aggregates. Sensors 2017, 17, 1930. [Google Scholar] [CrossRef] [PubMed]
  22. Yin, H.; Wang, T.; Yang, D.; Liu, S.; Shao, J.; Li, Y. A smart washer for bolt looseness monitoring based on piezoelectric active sensing method. Appl. Sci. 2016, 6, 320. [Google Scholar] [CrossRef]
  23. Song, G.; Wang, C.; Wang, B. Structural health monitoring (SHM) of civil structures. Appl. Sci. 2017, 7, 789. [Google Scholar] [CrossRef]
  24. Yan, S.; Ma, H.; Li, P.; Song, G.; Wu, J. Development and application of a structural health monitoring system based on wireless smart aggregates. Sensors 2017, 17, 1641. [Google Scholar] [CrossRef] [PubMed]
  25. Han, L.H.; Huang, H.; Tao, Z.; Zhao, X.L. Concrete-filled double skin steel tubular (CFDST) beam-columns subjected to cyclic bending. Eng. Struct. 2006, 28, 1698–1714. [Google Scholar] [CrossRef]
  26. Zhou, F.; Xu, W.C. Cyclic loading tests on concrete-filled double-skin (SHS outer and CHS inner) stainless steel tubular beam-columns. Eng. Struct. 2016, 127, 304–318. [Google Scholar] [CrossRef]
  27. Wang, R.; Han, L.H.; Zhao, X.L.; Rasmussen, K.J.R. Experimental behavior of concrete filled double steel tubular (CFDST) members under low velocity drop weight impact. Thin-Walled Struct. 2015, 97, 279–295. [Google Scholar] [CrossRef]
  28. Aghdamy, S.; Thambiratnam, D.P.; Dhanasekar, M.; Saiedi, S. Effects of structure-related parameters on the response of concrete- filled double-skin steel tube columns to lateral impact. Thin-Walled Struct. 2016, 108, 351–368. [Google Scholar] [CrossRef]
  29. Zeng, L.; Xiao, Y.; Chen, Y.; Jin, S.; Xie, W.; Li, X. Seismic damage evaluation of concrete-encased steel frame-reinforced concrete core tube buildings based on dynamic characteristics. Appl. Sci. 2017, 7, 314. [Google Scholar] [CrossRef]
  30. Chen, Z.Y.; Luo, J.Q.; Pan, X.W. The Properties of Concrete-Filled Steel Tube as Members of Protective Structure; The Earthquake Resistant and Explosion Relief Lab at Tsinghua University: Beijing, China, 1986. (In Chinese) [Google Scholar]
  31. Bambach, M.R. Design of hollow and concrete filled steel and stainless steel tubular columns for transverse impact loads. Thin-Walled Struct. 2011, 49, 1251–1260. [Google Scholar] [CrossRef]
  32. Bambach, M.R.; Jama, H.; Zhao, X.L.; Grzebieta, R.H. Hollow and concrete filled steel hollow sections under transverse impact loads. Eng. Struct. 2008, 30, 2859–2870. [Google Scholar] [CrossRef]
  33. Wang, R.; Han, L.H.; Hou, C.C. Behavior of concrete filled steel tubular (CFST) members under lateral impact: Experiment and FEA model. J. Constr. Steel Res. 2013, 80, 188–201. [Google Scholar] [CrossRef]
  34. Wang, R.; Han, L.H.; Tao, Z. Behavior of FRP-concrete-steel double skin tubular members under lateral impact: Experimental study. Thin-Walled Struct. 2015, 95, 363–373. [Google Scholar] [CrossRef]
  35. Wang, R.; Han, L.H.; Zhao, X.L.; Rasmussen, K.J.R. Analytical behavior of concrete filled double steel tubular (CFDST) members under lateral impact. Thin-Walled Struct. 2016, 101, 130–140. [Google Scholar] [CrossRef]
  36. Han, L.H.; Hou, C.C.; Zhao, X.L.; Rasmussen, K.J.R. Behaviour of high-strength concrete filled steel tubes under transverse impact loading. J. Constr. Steel Res. 2014, 92, 25–39. [Google Scholar] [CrossRef]
  37. Alam, M.I.; Fawzia, S.; Zhao, X.L. Numerical investigation of CFRP strengthened full scale CFST columns subjected to vehicular impact. Eng. Struct. 2016, 126, 292–310. [Google Scholar] [CrossRef]
  38. Alam, M.I.; Fawzia, S.; Zhao, X.L.; Remennikov, A.M.; Bambach, M.R.; Elchalakani, M. Performance and dynamic behaviour of FRP strengthened CFST members subjected to lateral impact. Eng. Struct. 2017, 147, 160–176. [Google Scholar] [CrossRef]
  39. Yang, Y.F.; Zhang, Z.C.; Fu, F. Experimental and numerical study on square RACFST members under lateral impact loading. J. Constr. Steel Res. 2015, 111, 43–56. [Google Scholar] [CrossRef]
  40. Shakir, A.S.; Guan, Z.W.; Jones, S.W. Lateral impact response of the concrete filled steel tube columns with and without CFRP strengthening. Eng. Struct. 2016, 116, 148–162. [Google Scholar] [CrossRef]
  41. Chen, Y.; Wan, J.; Wang, K.; Han, S. Residual axial bearing capacity of square steel tubes after lateral impact. J. Constr. Steel Res. 2017, 137, 325–341. [Google Scholar] [CrossRef]
  42. Wan, J.; Chen, Y.; Wang, K.; Han, S. Residual strength of CHS short steel columns after lateral impact. Thin-Walled Struct. 2017, 118, 23–36. [Google Scholar] [CrossRef]
  43. ABAQUS. ABAQUS Standard User’s Manual; Version 6.16; Dassault Systèmes Corp.: Providence, RI, USA, 2016. [Google Scholar]
  44. Tao, Z.; Wang, Z.B.; Yu, Q. Finite element modelling of concrete-filled steel tube columns under axial compression. J. Constr. Steel Res. 2013, 89, 121–131. [Google Scholar] [CrossRef]
  45. Classen, M.; Stark, A.; Hegger, J. Steel-HSC composite beams with partial shear connection and miniaturized limited-slip-capacity connectors. Steel Constr. 2018, 11, 94–103. [Google Scholar] [CrossRef]
  46. ACI 318 Committee. Building Code Requirements for Structural Concrete; American Concrete Institute: Farmington Hills, MI, USA, 2014. [Google Scholar]
  47. Birtel, V.; Mark, P. Parameterised finite element modelling of RC beam shear failure. In Proceedings of the 2006 ABAQUS Users’ Conference, Cambridge, MA, USA, 23–25 May 2006; pp. 95–108. [Google Scholar]
  48. Rabbat, B.G.; Russell, H.G. Friction coefficient of steel on concrete or grout. J. Struct. Eng. 1985, 111, 505–515. [Google Scholar] [CrossRef]
  49. Classen, M.; Herbrand, M.; Kueres, D.; Hegger, J. Derivation of design rules for innovative shear connectors in steel concrete composites by systematic use of nonlinear Finite Element Analysis (FEA). Struct. Concr. 2015, 4, 646–655. [Google Scholar]
  50. Gallwoszus, J. Concrete fatigue in composite dowels. Struct. Concr. 2016, 17, 63–73. [Google Scholar]
  51. Aghdamy, S.; Thambiratnam, D.P.; Dhanasekar, M.; Saiedi, S. Computer analysis of impact behavior of concrete filled steel tube columns. Adv. Eng. Softw. 2015, 89, 52–63. [Google Scholar] [CrossRef]
Figure 1. Definition of symbols.
Applsci 08 00793 g001
Figure 2. Schematic diagram of drop-hammer impact test rig.
Applsci 08 00793 g002
Figure 3. Schematic diagram of electro-hydraulic servo universal testing setup.
Applsci 08 00793 g003
Figure 4. Arrangement of strain gauges of the sample. Numbers (1 to 8) are labels of strain gauges.
Applsci 08 00793 g004
Figure 5. Samples after impact test. (a) C159×6-R26.5-H2 to H4; (b) C159×8-R19.9-H2 to H4; (c) C219×6-R36.5-H2 to H4; (d) C219×8-R27.4-H2 to H4.
Applsci 08 00793 g005
Figure 6. Impact force (F) versus time (T) curves of samples in impact test. (a) C159×6-R26.5-H2 to H4; (b) C159×8-R19.9-H2 to H4; (c) C219×6-R36.5-H2 to H4; (d) C219×8-R27.4-H2 to H4.
Applsci 08 00793 g006
Figure 7. The residual bearing capacity (Pu) and mid-span lateral displacement (Δr) of samples. (a) The Pu under different H; (b) The Δr under different H.
Applsci 08 00793 g007
Figure 8. Samples after axial compression test. (a) C159×6-R26.5-H0 to H4; (b) C159×8-R19.9-H0 to H4; (c) C219×6-R36.5-H0 to H4; (d) C219×8-R27.4-H0 to H4.
Applsci 08 00793 g008aApplsci 08 00793 g008b
Figure 9. Axial force versus vertical displacement (P-Δv) curves of samples. (a) C159×6-R26.5-H0 to H4; (b) C159×8-R19.9-H0 to H4; (c) C219×6-R36.5-H0 to H4; (d) C219×8-R27.4-H0 to H4.
Applsci 08 00793 g009
Figure 10. Typical axial force versus longitudinal strain (P-εL) curves of C159×6-R26.5-H0 to H4. (a) H = 0 m; (b) H = 2 m; (c) H = 3 m; (d) H = 4 m.
Applsci 08 00793 g010
Figure 11. Typical axial force versus transverse strain (P-εT) curves of C159×6-R26.5-H0 to H4. (a) H = 0 m; (b) H = 2 m; (c) H = 3 m; (d) H = 4 m.
Applsci 08 00793 g011aApplsci 08 00793 g011b
Figure 12. A finite element analysis model of CFCSTC (concrete-filled circular steel tubular columns).
Applsci 08 00793 g012
Figure 13. Stress and deformation distribution. (a) C219×8-R27.4-H0; (b) C219×8-R27.4-H4.
Applsci 08 00793 g013
Figure 14. Effect of D/t ratio on time-force curves.
Applsci 08 00793 g014
Figure 15. Effect of D/t ratio on bearing capacity.
Applsci 08 00793 g015
Table 1. Details of samples.
SampleD × t (mm)L (mm)D/tH (m)Δo (mm)Δr (mm)Pu (kN)
C159×6-R26.5-H0159 × 6225026.50018.51747.2
C159×6-R26.5-H2159 × 6225026.522971.71433.3
C159×6-R26.5-H3159 × 6225026.534188.51343.2
C159×6-R26.5-H4159 × 6225026.5452102.21134.8
C159×8-R19.9-H0159 × 8225019.90016.82168.6
C159×8-R19.9-H2159 × 8225019.9215.565.61977.8
C159×8-R19.9-H3159 × 8225019.9327.882.41656.6
C159×8-R19.9-H4159 × 8225019.944699.81541.6
C219×6-R36.5-H0219 × 6225036.5007.83242.2
C219×6-R36.5-H2219 × 6225036.5212.552.43053.8
C219×6-R36.5-H3219 × 6225036.5316.163.62998.8
C219×6-R36.5-H4219 × 6225036.5428.274.22827.6
C219×8-R27.4-H0219 × 8225027.4005.83691.2
C219×8-R27.4-H2219 × 8225027.4210.850.73689.2
C219×8-R27.4-H3219 × 8225027.4313.458.53598.2
C219×8-R27.4-H4219 × 8225027.441764.63551.6
Notes: D, t and L mean the outer diameter of CFST column, the thickness of steel tube and the length of CFST column respectively; H and Δo denote the height of drop-hammer and the residual displacement of the mid-span under transverse impact respectively; Δr and Pu mean the residual displacement of the mid-span and ultimate bearing capacity under axial compression respectively.
Table 2. The material properties.
D × t (mm)fcu (N/mm2)fy (N/mm2)Es (N/mm2)
159 × 631.2294.82.06 × 105
159 × 831.2291.22.09 × 105
219 × 631.2294.82.06 × 105
219 × 831.2291.22.09 × 105
Note: fcu denotes the average 28-day compressive strength of core concrete cubes tested; fy denotes average yield strength of steel tube; Es denotes the modulus of elasticity of steel tube.

