Article

Two-Stage Strategy for CO Removal from H2-Rich Streams over (Nano-) CuO/CeO2 Structured Catalyst at Low Temperature

by
Gianluca Landi
1,
Almerinda Di Benedetto
2,* and
Luciana Lisi
1
1
Institute of Researches on Combustion-CNR, Piazzale Tecchio 80, 80125 Naples, Italy
2
Dipartimento di Ingegneria Chimica, dei Materiali e della Produzione Industriale, University of Naples Federico II, Piazzale Tecchio 80, 80125 Naples, Italy
*
Author to whom correspondence should be addressed.
Appl. Sci. 2018, 8(5), 789; https://doi.org/10.3390/app8050789
Submission received: 13 April 2018 / Revised: 2 May 2018 / Accepted: 9 May 2018 / Published: 15 May 2018
(This article belongs to the Special Issue Cu and Cu-Based Nanoparticles: Applications in Catalysis)

Abstract

:
Proton exchange membrane (PEM) fuel cells represent one of the most interesting systems for converting hydrogen from fossil or renewable fuels into electric power at low temperature. To prevent poisoning of fuel cell anodes, CO concentration has to be reduced to 10–100 ppm. To this aim, the preliminary catalytic preferential oxidation of CO may be used, provided that the catalyst effectively oxidizes CO, limiting as much as possible the oxidation of H2. Presently, both high selectivity and CO conversion cannot be simultaneously achieved. In this work, a novel strategy for CO removal from H2-rich streams based on a CuO/CeO2 reactive trap is proposed, exploiting both catalytic and adsorption properties of this material. The process occurs in two stages. In the first stage, one reactor, fed with a CO-containing stream, works as a CO-reactive adsorber, providing a CO-free mixture. In the second stage, the adsorbed CO is converted to CO2 by O2. By this approach it is possible to simultaneously get CO lower than the limiting value and avoid any H2 oxidation with no O2 in the feed stream to PEM. Experimental tests allowed the evaluation of the kinetic parameters of all the reaction mechanism steps. Model simulations were performed at varying operating parameters, showing that the positive effect of high contact times and low CO inlet concentration is significantly affected by the non-linear behavior of the CO reactive adsorption.

1. Introduction

Proton exchange membrane (PEM) fuel cells represent a promising technology for electric power generation at low temperature from H2. Especially in mobile applications, the hydrogen source is, generally, an organic compound (fossil or renewable), which is converted to hydrogen in a fuel processor (FP), consisting of a reformer and one or two water gas shift reactors [1,2,3,4,5,6,7,8]. The so obtained H2-rich stream contains 0.5–1 vol.% CO, which is a poison for the fuel cell anode catalyst (Pt). To prevent catalyst deactivation, CO concentration has to be reduced to 10–100 ppm and then the stream has to be purified. To this aim, the catalytic PReferential OXidation of CO (CO-PROX) has been proposed [9,10,11,12].
CO-PROX catalysts have been studied to work under steady-state conditions and have been designed and selected to ensure high CO oxidation activity, selectivity, and stability. Pt- and Au-based catalysts have been first studied and some formulations have been proposed for commercial applications. Copper/ceria catalysts have been proposed as an alternative due to their good activity and selectivity at low temperatures [11,13,14,15,16,17,18,19,20,21,22,23,24,25,26,27,28,29,30,31,32].
The main drawback of CO-PROX is the competitive H2 oxidation, showing a higher activation energy with respect to that of CO. At the high temperatures needed to obtain high CO conversions at reasonable contact times, H2 oxidation becomes faster than CO oxidation [33,34,35]. In order to limit H2 consumption, stringent control of the temperature profile is required and obtained by 2–4 adiabatic stages with intercooling [2,3,36,37] or exchanging reactors [38]. For this reason, the volume of the CO-PROX section is very large and can correspond to more than 40% [36] or 50% [39] total volume of the fuel processor.
Several efforts have been made in order to extend the temperature window corresponding to both high conversion and selectivity by doping CuO/CeO2 with a proper cation [16,21,35,40,41,42,43] or developing suitable preparation methods [14,24,25,44] with successful results.
In order to ensure a wide temperature window, the required O2/CO ratio should be higher than the stoichiometric value, whatever the catalyst. At these conditions, the CO-PROX reaction outlet stream would contain excess O2, which would react with hydrogen at the PEM Pt anode. Accordingly, O2 concentration should be kept lower than 10–100 ppm [45], thus increasing the sacrificial hydrogen.
In this work, we propose a novel process for CO abatement over a CuO/CeO2 catalyst based on 2 steps: CO adsorption and subsequent oxidation. In the CO adsorption step, the reactor acts as a trap for CO and a CO-free H2 flow exits the reactor; in the second step the reactor works as a catalytic converter with oxidation of the CO adsorbed over the catalyst. Through this process, it is possible to achieve a CO concentration lower than 100 ppm without O2 at the PEM fuel cell inlet, preventing H2 consumption.
This idea is based on previous papers showing that nano-ceria-based materials (CuO/CeO2) can adsorb CO at room temperature [46,47]. More recently, we showed that nanometric copper/ceria is able not only to adsorb CO but also to partially oxidize it, releasing CO2 at room temperature, due to easier oxygen mobility occurring in nanometric catalyst particles and also to the promotion of CO2 desorption [48].
We report both experimental tests and simulations of the proposed trap. Experiments were carried out on a structured monolith washcoated with nanometric CuO/CeO2 [48].
A mechanism was proposed and the kinetic model of both the adsorption and the oxidation phases was derived. Simulations of both adsorption and oxidation reactors were carried out at varying residence times, the CO inlet concentration and the duration of the oxidation step.

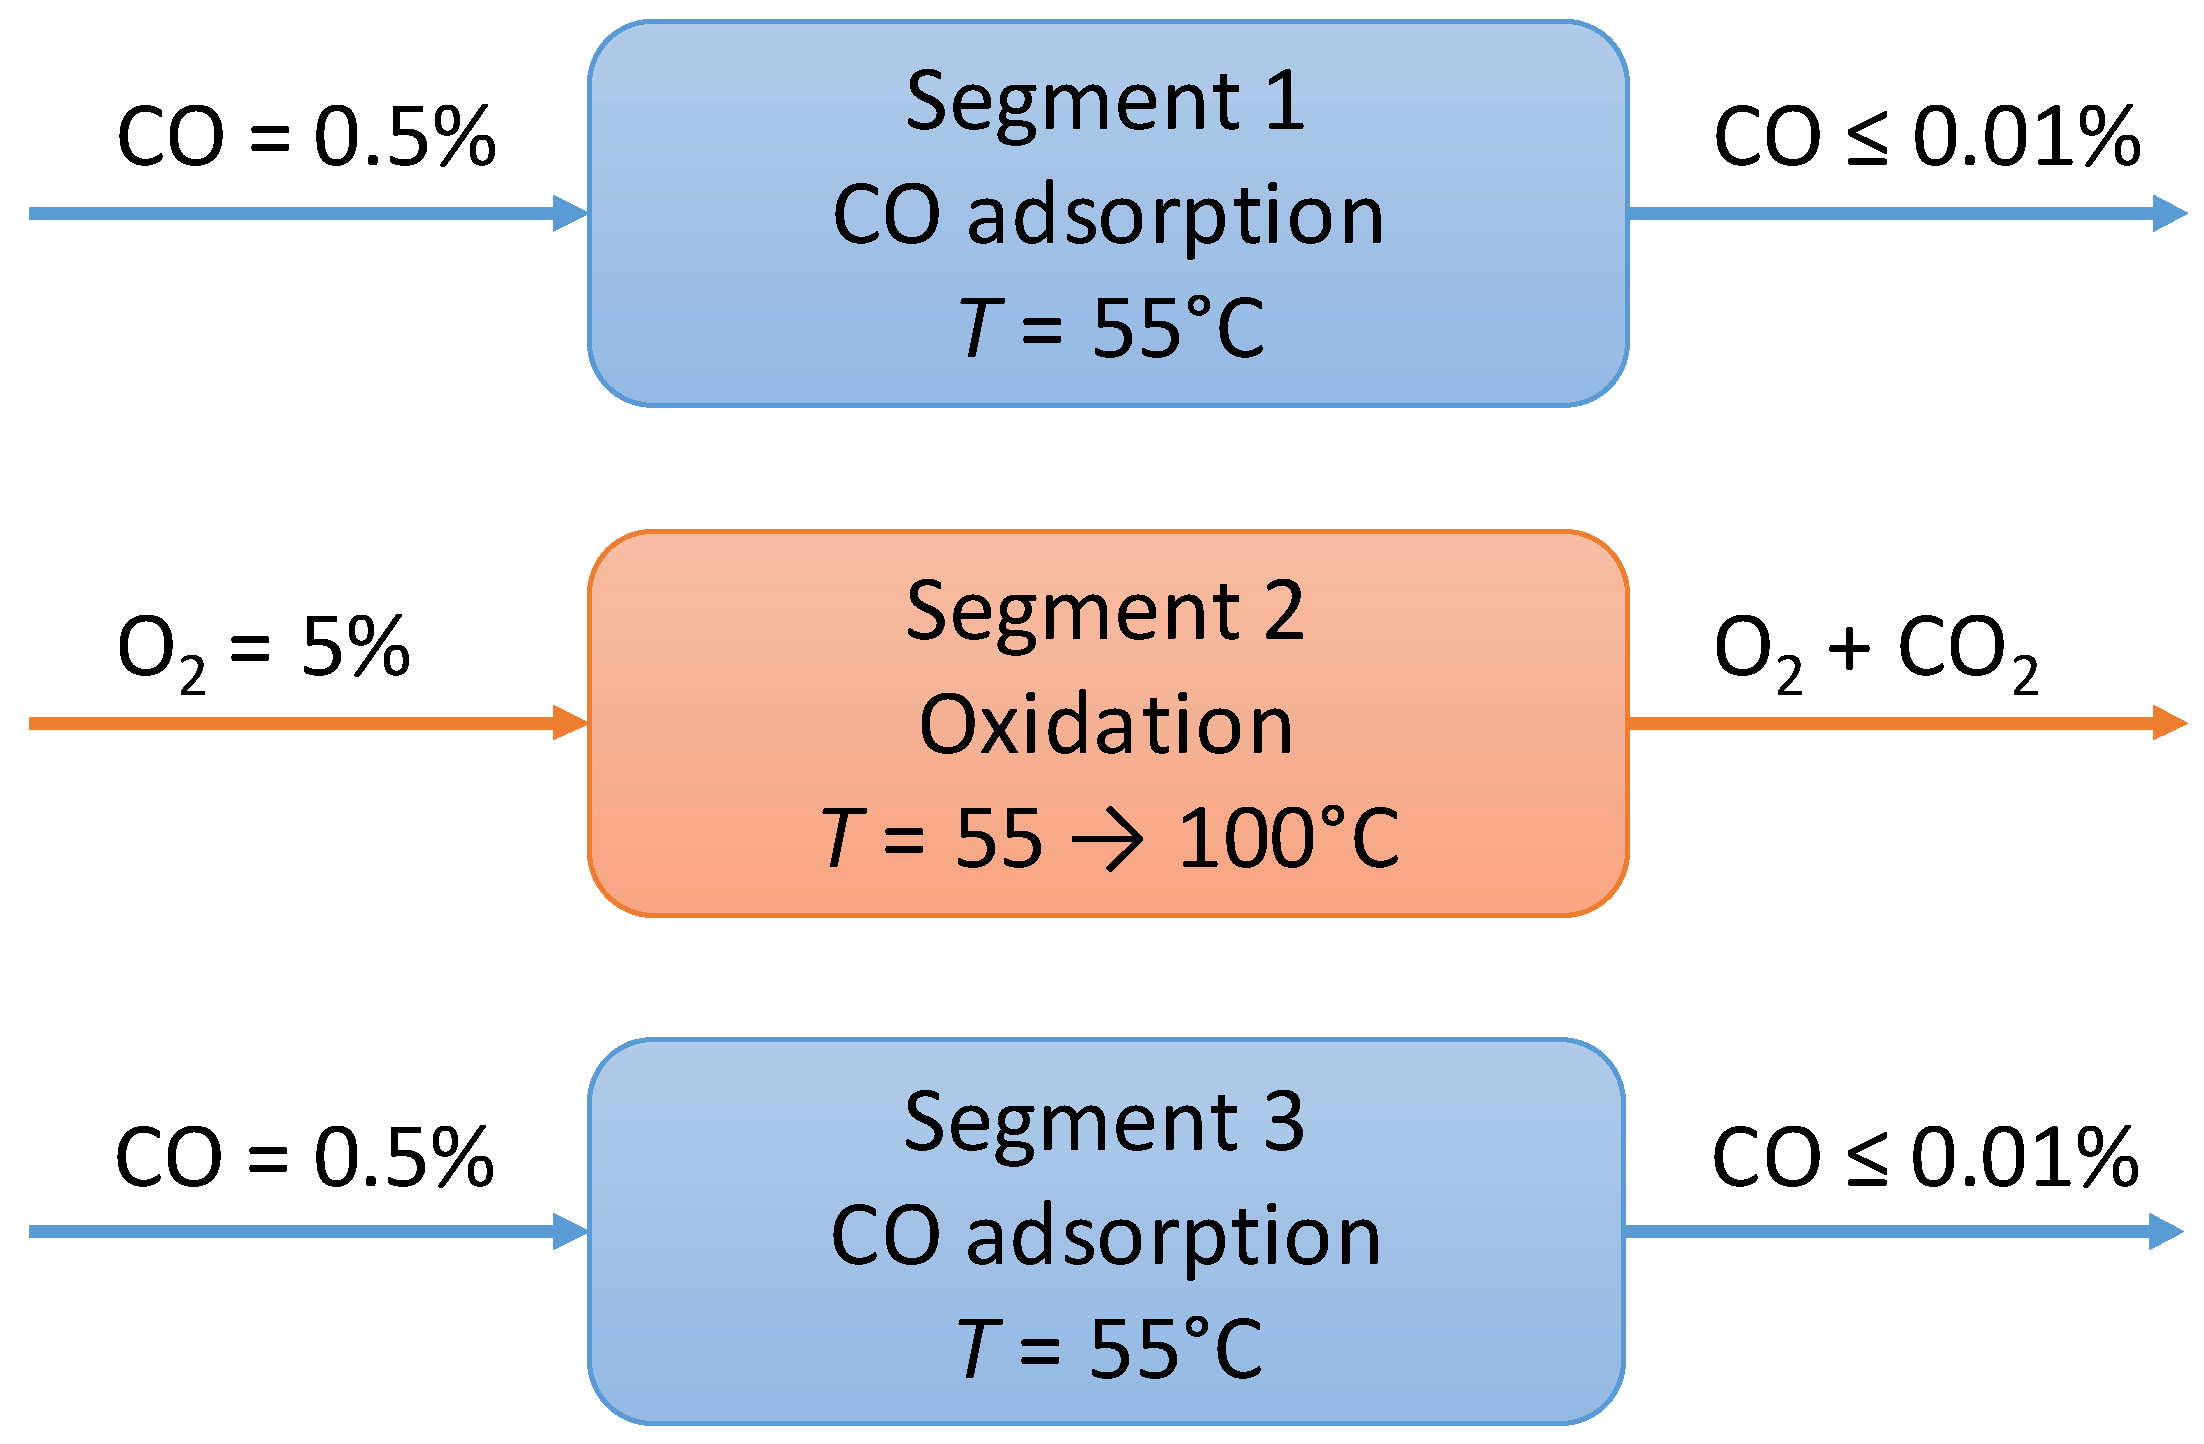
Description of the Process

The block flow diagram (BFD) of the process here proposed is shown in Figure 1. It consists of two parallel catalytic reactors which alternatively operate as trap for CO and as reactor for the oxidation of CO adsorbed. In Figure 1, during Stage 1 Reactor 1 operates as a CO adsorber with the inlet stream coming from the FP, thus providing a CO-free exiting flow for the fuel cell, while Reactor 2 is regenerated by flowing air. During the Stage 2, the roles of the reactors are inverted.
Thus, the operating phases of each reactor are listed in the following:
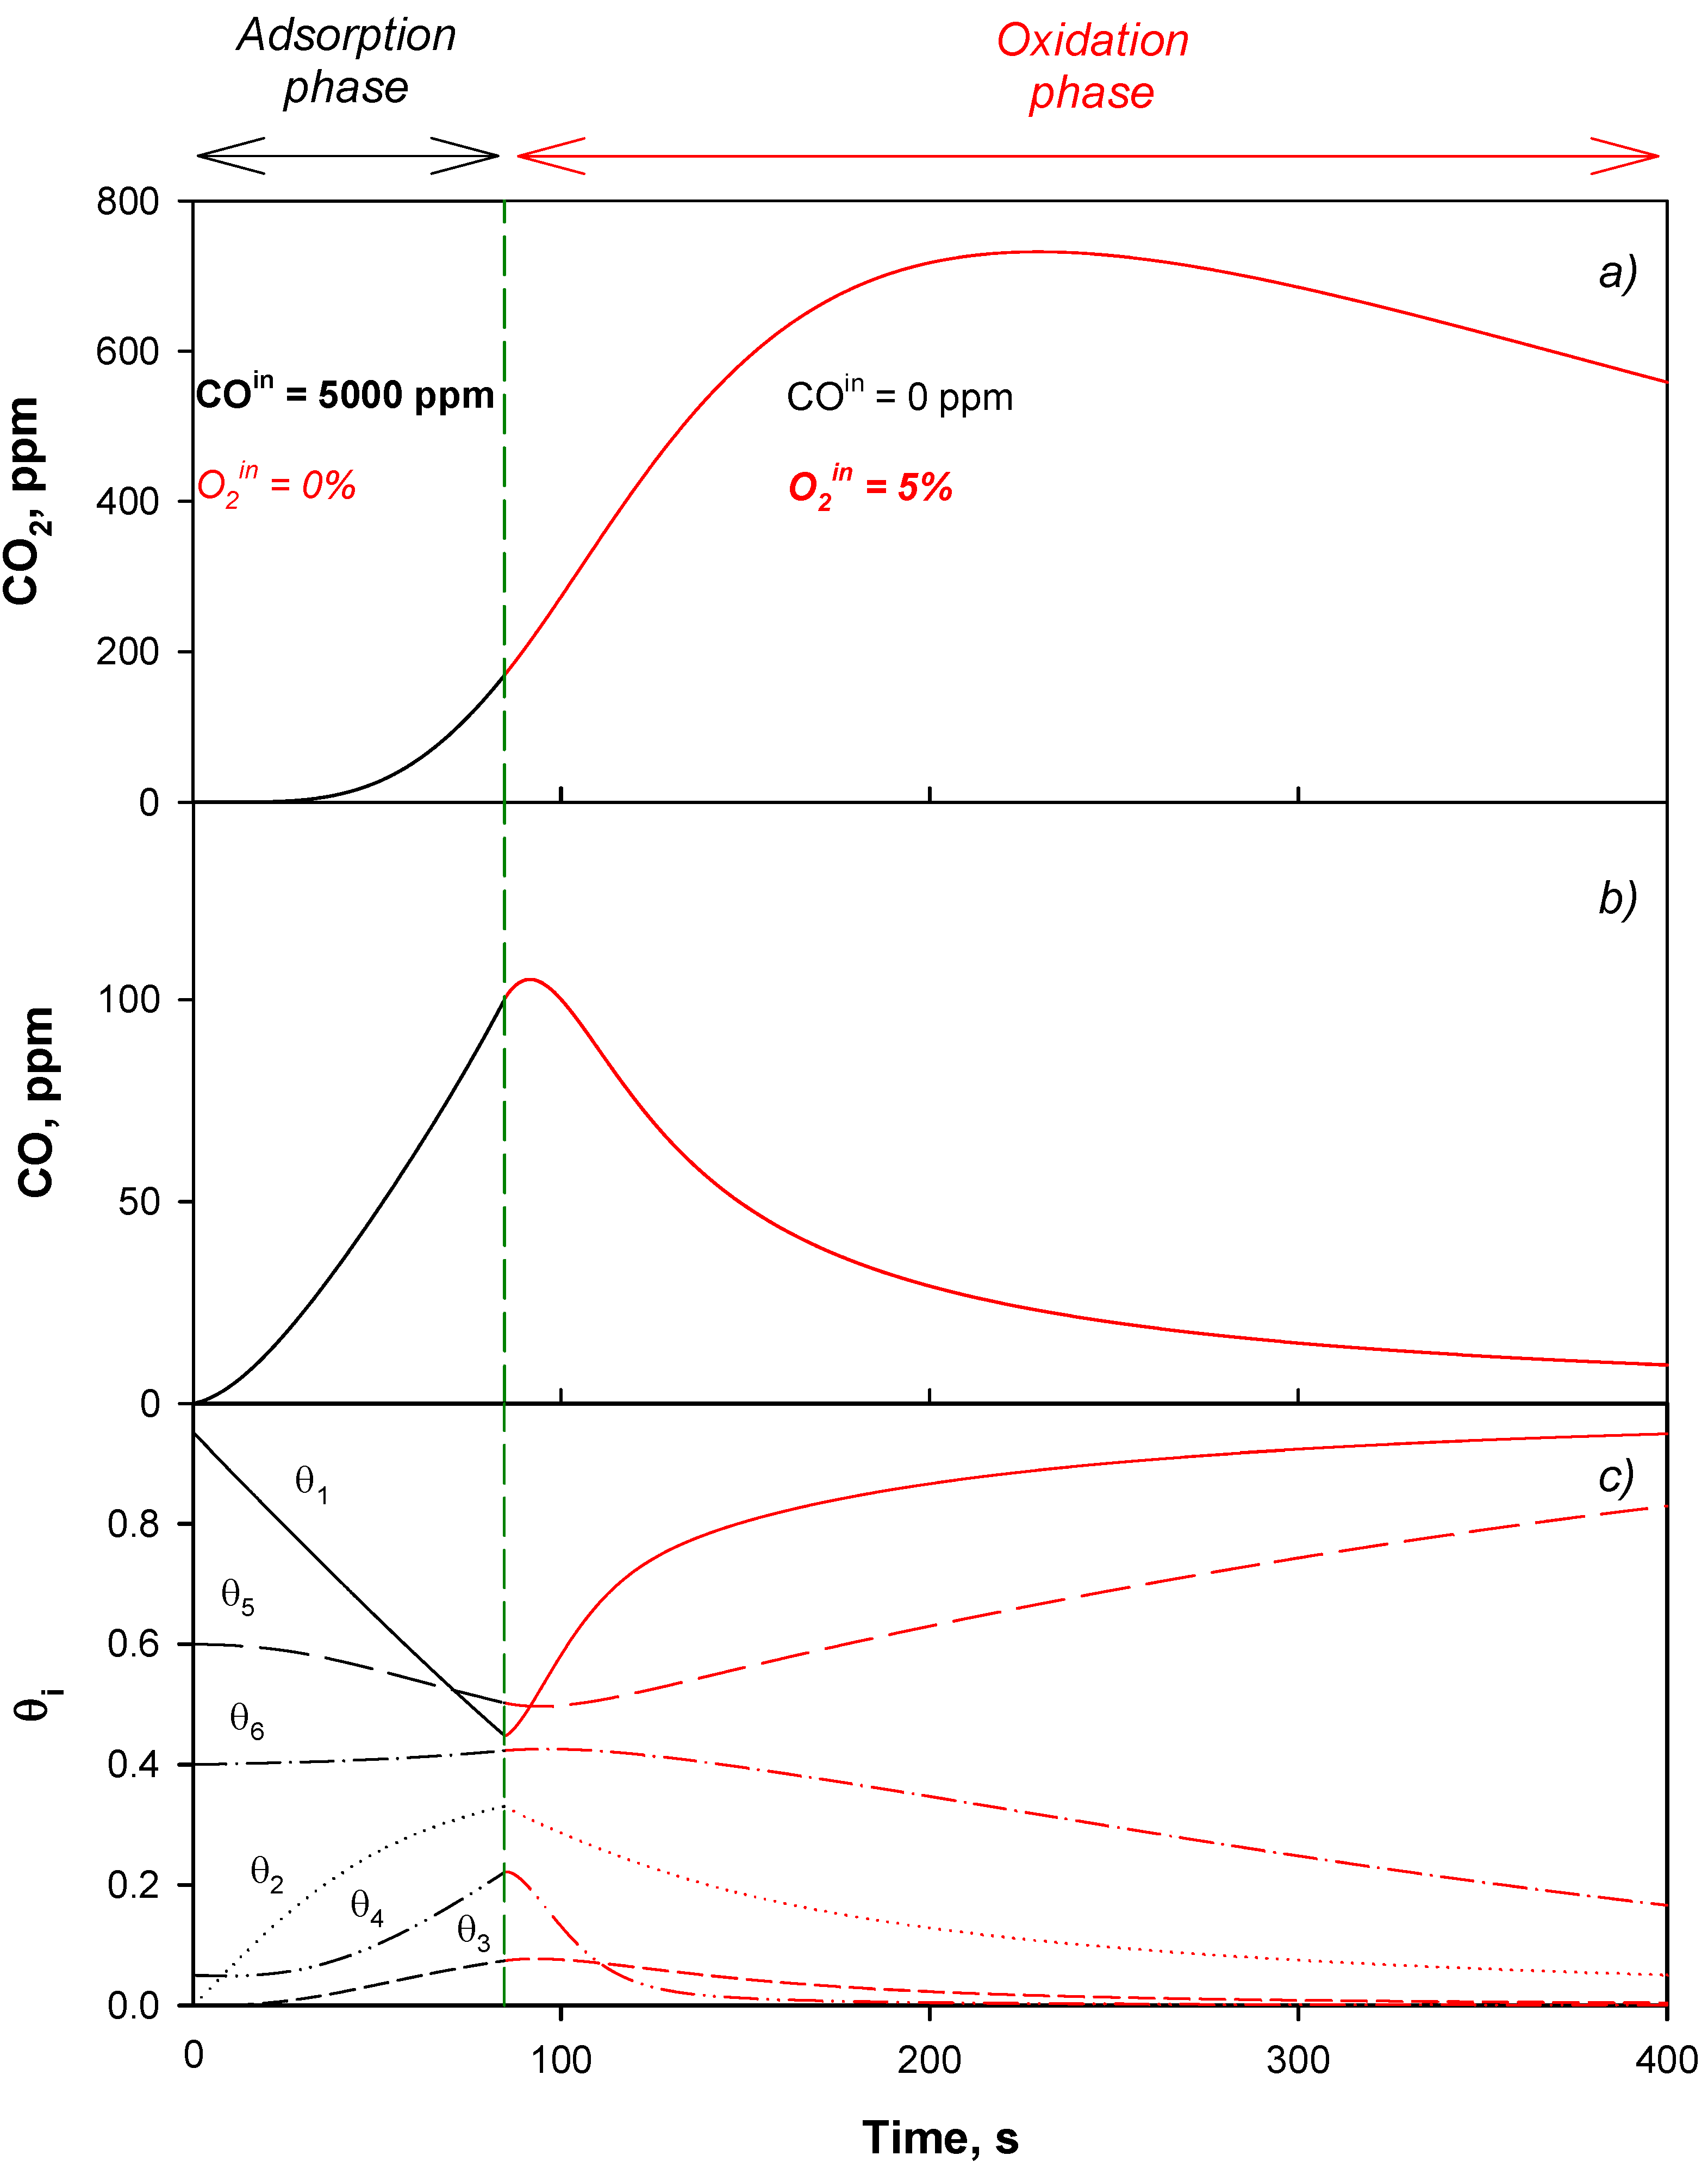
  • CO adsorption: During this phase, CO is adsorbed over the catalyst surface at very low temperature (T1 < 100 °C) at which H2 does not interact with the catalytic sites;
  • CO oxidation: CO trapped over the catalyst surface is oxidized and the CO2 formed is desorbed.
From our previous study [48], we found that CO adsorption can be carried out at a temperature sufficiently lower than that activating H2 oxidation (55–85 °C), flowing the CO-containing mixture up to a time ensuring an exit CO concentration lower than 100 ppm. We also showed that the presence of H2 has a null or even positive effect on CO adsorption/CO2 formation, depending on the temperature, generating new hydroxyl groups at T > 80 °C, which enhances CO oxidation and adsorption over the catalyst surface.
When slightly increasing the temperature and flowing the O2/N2 mixture, CO2, formed at the expense of lattice oxygen, starts desorbing and gaseous oxygen can restore the catalyst initial oxidation state.

2. Materials and Methods

2.1. Catalyst Preparation

The preparation technique of the CuO/CeO2-based monolith has been described in [49]. Briefly, a commercial honeycomb monolith (cordierite, 400 cpsi; Corning, NY 14831, USA), cut in the desired shape and dimension (cylinder; D = 16 mm; L = 12 mm), was washcoated with colloidal ceria (specific surface area (SSA) = 120 m2/g, Nyacol Nano Technologies Inc., Ashland, MA 01721, USA, CeO2 particle size <20 nm) by a modified dip-coating procedure and then dried at 120 °C for 1 h and calcined in air at 450 °C for 2 h. Cycles of dip-coating followed by drying and calcination were repeated until the target ceria weight (corresponding to about 15 μm layer) was reached. A slurry containing 100% colloidal ceria was chosen to washcoat the ceramic substrate on the basis of the results reported in [49], in order to reproduce a structured catalyst with a good mechanical resistance and a high dispersion of copper.
Copper oxide was deposited onto ceria by wet impregnation using an aqueous solution of copper acetate monohydrate (Sigma-Aldrich srl, Milan, Italy); the sample was then dried at 120 °C for 1 h and calcined in air at 450 °C for 2 h again in order to decompose acetate into copper oxide. The procedure was repeated until the desired copper oxide load (4 wt % with respect to the active layer), determined by sample weight after each cycle, was obtained.
The final catalyst (CuO/CeO2) amount was about 450 mg/monolith. The ICP-MS analysis (performed with an Agilent 7500CE (California USA) Instrument) revealed that the copper content (4.0 wt %) corresponded to the target load within the experimental error (≤5%).

2.2. Lab Test Rig

The lab-scale set-up used for CO-PROX experiments is described elsewhere [34]. It consisted of a tubular quartz reactor where the monolith, wrapped in a ceramic wool tape, is located between two mullite foams. The catalytic reactor was pre-heated using an electric tubular furnace (Lenton, UK) provided with a PID-type controller. Under the experimental conditions used in this study, a relatively flat temperature profile was recorded through three thermocouples placed inside the central channel as described in [50].
Lab experiments consisted of the following segments:
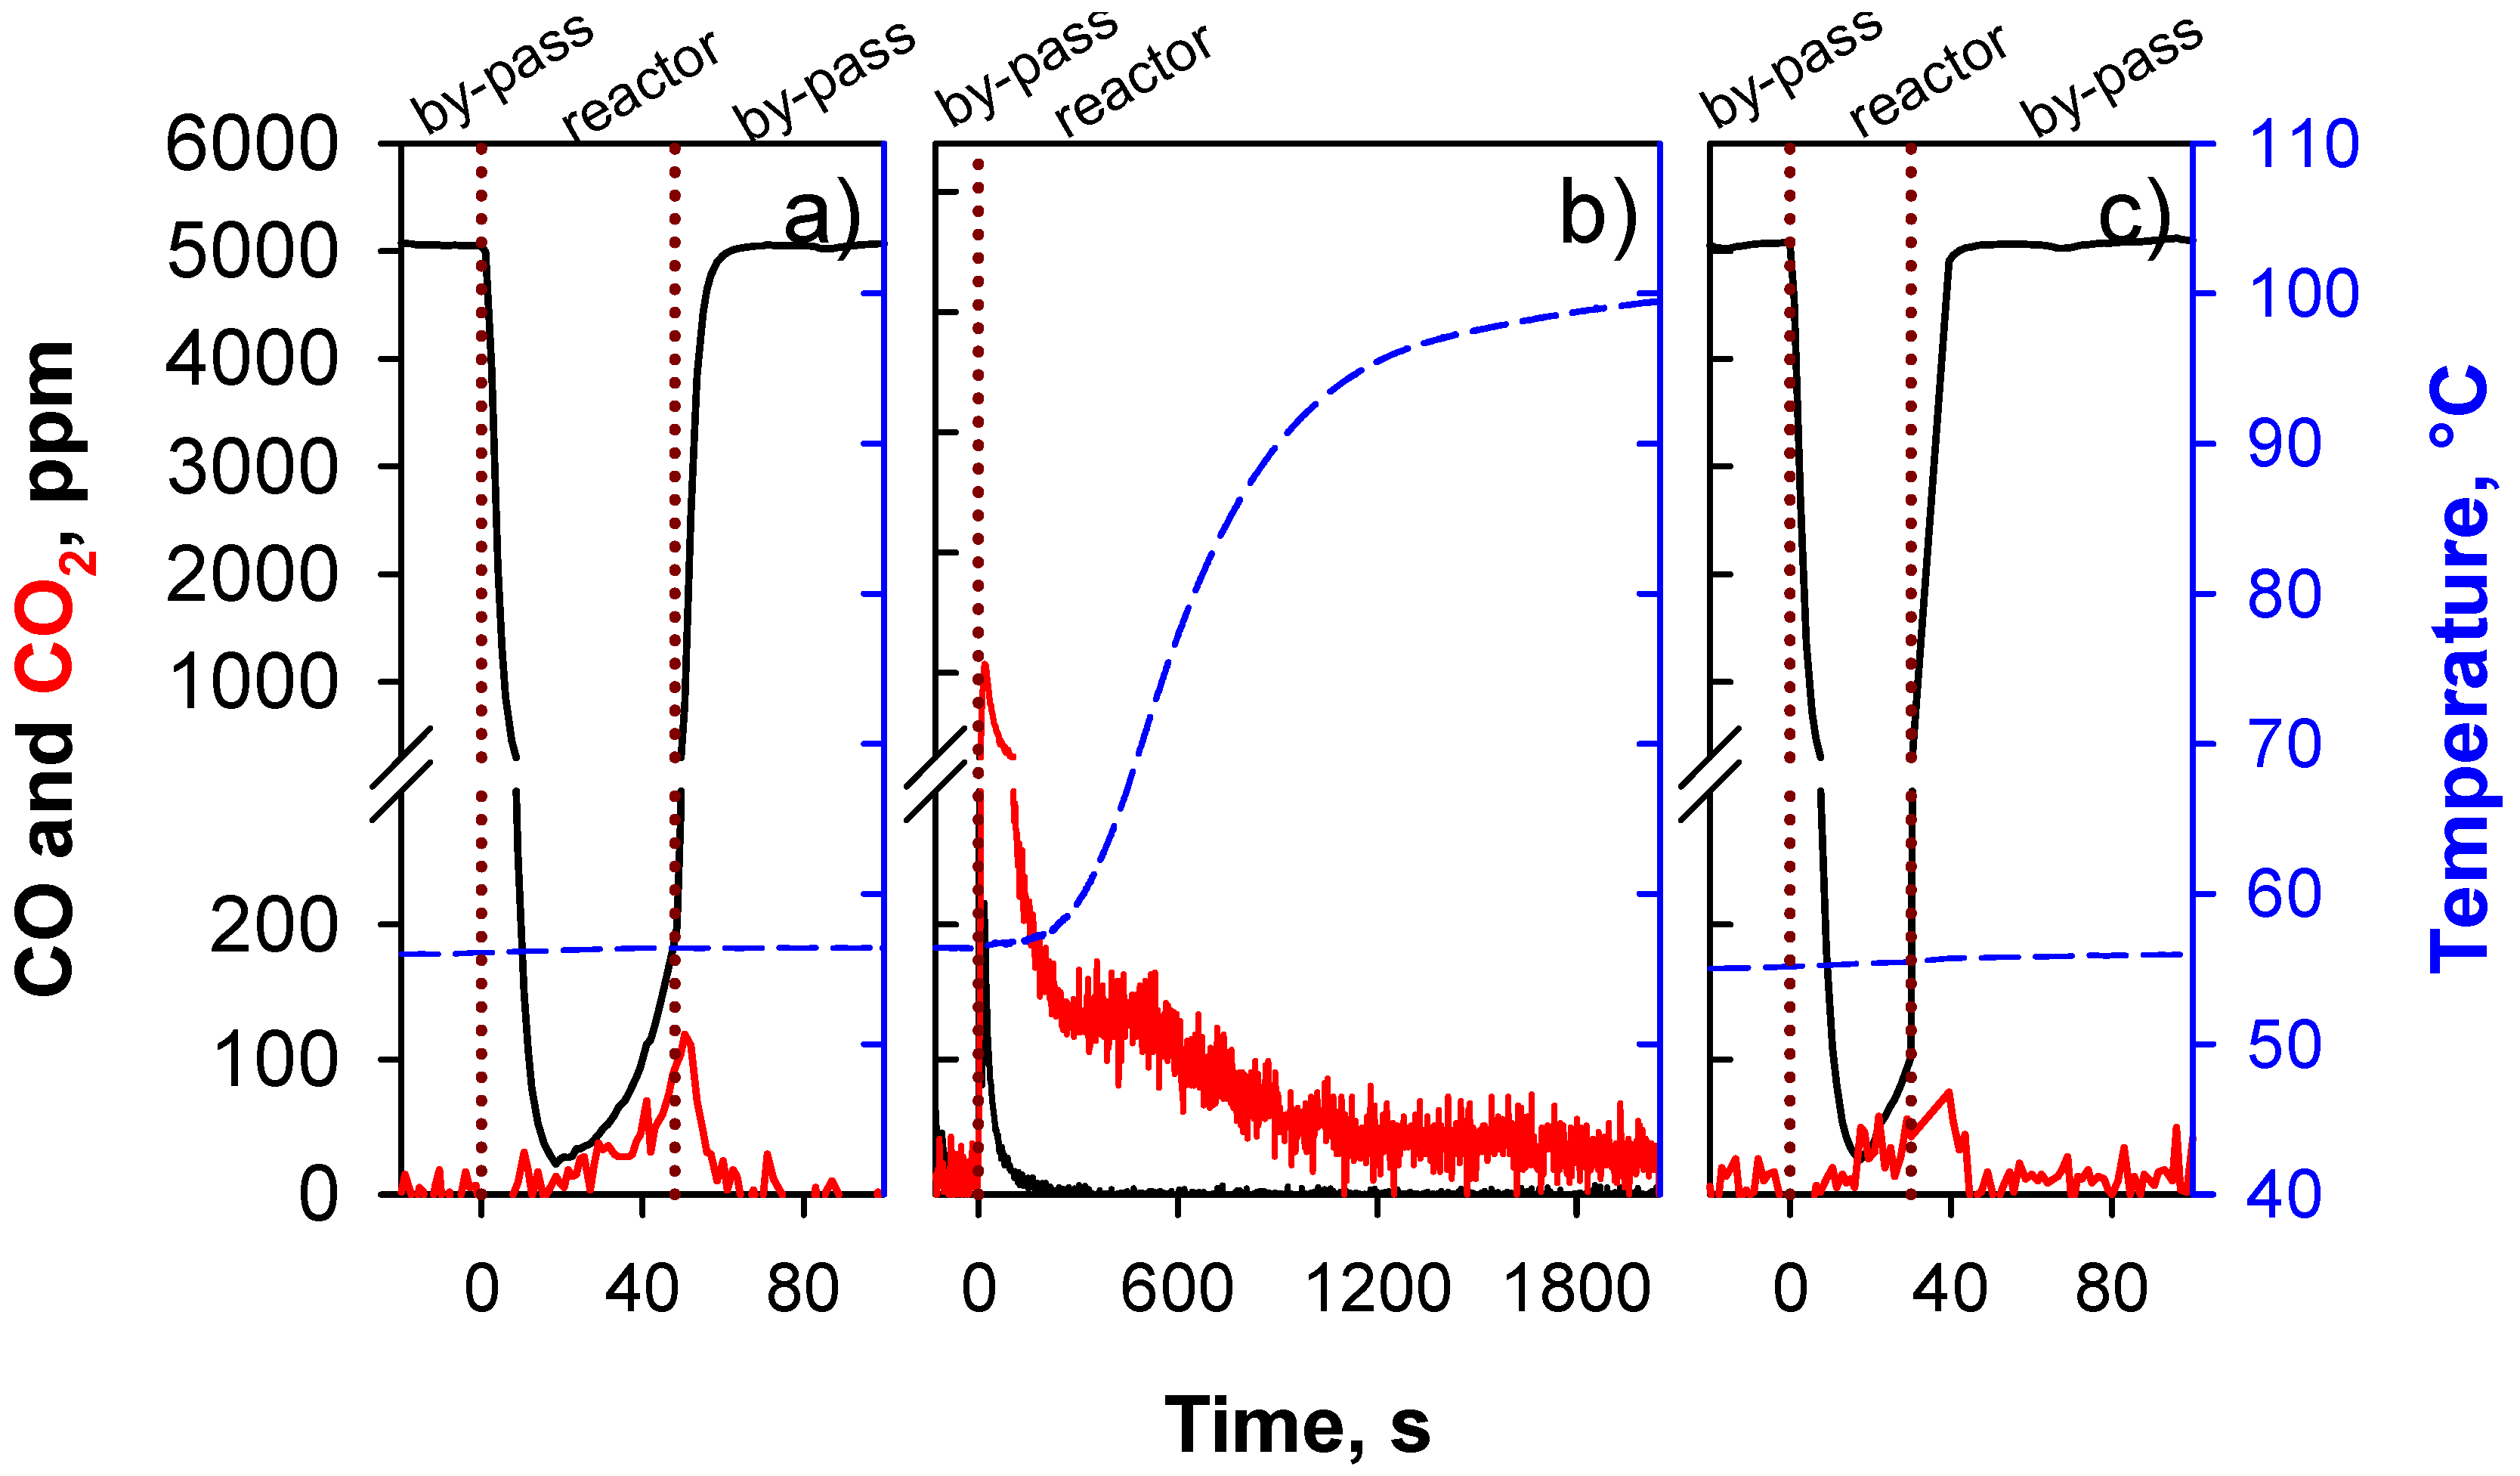
  • Segment 1—Isothermal adsorption. T = 55 °C, CO = 5000 ppm in N2 flow. When the CO concentration reaches 100 ppm the reactor is by-passed.
  • Segment 2—Oxidation temperature is increased up to 100 °C, heating rate = 10 °C/min, 5 vol % O2 in N2 flow to the reactor.
  • Segment 3—Isothermal adsorption (repeatability test).
Segment 1 was repeated after Segment 2 to test the repeatability of the cycle.
The outline of the whole experiment is reported in Figure 2. A 5% CO/N2 mixture was suitably pre-mixed with pure N2 to obtain 5000 ppm CO in Segment 1, whereas pure O2 was pre-mixed with pure N2 to feed 5% O2/N2 in Segment 2. All gas flows were controlled by MFC and were dried by passing through a CaCl2 trap before reaching a Fisher-Rosemount NGA2000 (St. Louis, MA, USA) continuous analyzer for CO, CO2, and O2. The feed mixture did not contain H2 due to the negligible effect of this component at temperature <80 °C [48].

3. Results

In Figure 3, the temporal evolution of CO and CO2 concentrations are shown for the three segments previously described. In Table 1, the corresponding CO and CO2 amounts are given. During Segment 1, the target CO exit concentration (<100 ppm) was attained for about 30 s. As observed in [48], CO2 started to be detected in the gas phase only when CO concentration rose. Consequently, CO2 concentration in the gas flow theoretically entering the fuel cell was negligible. The amount of CO consumed during this segment was about 4.5 × 10⁻² mmol and was mostly trapped on the catalyst surface. The corresponding CO/Cu ratio was equal to 0.19.
In Segment 2, a very narrow peak of CO was observed at the very beginning with a maximum value not exceeding the target exit CO concentration, whereas mainly CO2 evolved. From a quantitative point of view, about 3.0 × 10⁻² mmol of CO2 were produced, corresponding to 67% of CO consumed in Segment 1, representing a very good result taking into account the low operating temperature. It is worth noting that most of the CO2 evolution (≈55%) occurred in the first few minutes at 55 °C due to the positive effect of temperature on both CO oxidation (oxygen mobility) and CO2 desorption rate, in agreement with our previous results [48].
When segment 1 was repeated (segment 3), a significant reduction of the time when exiting CO concentration was below the target was observed (20 s vs. 30 s). Accordingly, CO adsorbed in Segment 3 was 40% lower than that adsorbed in segment 1 and also slightly lower than the CO2 evolved during segment 2. This reduction should be related to the initial state of the catalyst surface, still partially covered after the segment 2, and thus not completely available for the fresh catalyst.
Without exception, the trap provided a clean gas flow with a maximum punctual value of CO outlet concentration of 100 ppm, 100% selectivity (no H2 can be oxidized under these conditions, as demonstrated in [48]) and no O2 in the H2-rich stream.

4. Model

4.1. Reaction Mechanism and Kinetic Model

The results of our previous tests on CO adsorption/oxidation at room temperature provided insights into the reaction path [48].
Also based on results by others [13,14,32,43,51,52], we concluded that, most probably, CO adsorption activates the copper redox cycle between +2 and +1 oxidation states. The main role of Ce is to provide oxygen to Cu sites through easily mobile lattice oxygen.
We found that the most important parameters affecting the reaction path are the surface oxygen mobility/availability [15] and the CO2 desorption rate [32]. The presence of O2 activates the direct oxidation of copper and of oxygen vacancies of ceria in the area of copper sites.
According to the above findings, the following mechanism is here derived:
σ O + CO σ O CO
σ O CO + σ O σ O CO 2 + σ
σ O CO 2 σ O + CO 2
σ + σ O σ O + σ
With the presence of O2 in the gas phase, the oxidation steps of sites σ’ and σ have to be considered:
σ + 1 2 O 2 σ O
σ + 1 2 O 2 σ O
In Table 2, the nature of each site in the mechanism (1)–(6) is given. In the proposed mechanism, CO is adsorbed on Cu2+ sites in strict contact with ceria, causing a partial reduction of copper (and adjacent cerium atom) (step 1). CO2 is then formed and transferred onto ceria sites, causing copper reduction to Cu+ (and adjacent cerium reduction to Ce3+) (step 2). The CO2 adsorption onto sites different from copper is in agreement with [32]. Step 3 represents CO2 desorption. As reported in [48], copper re-oxidation can occur also in the absence of molecular oxygen in the gas phase at the expense of an oxygen transfer from ceria sites, leading to a surface ceria reduction (step 4). When molecular oxygen is fed, re-oxidation of the surface can occur on both copper/ceria and ceria sites (steps 5 and 6).
Based the mechanism (1)–(6), a kinetic model was developed. All steps are assumed irreversible except step 1. Rates of steps 1–6 are:
R 1 = k 1   θ 1   C CO
R 1 = k 1   θ 2 1  
R 2 = k 2   θ 2   θ 5
R 3 = k 3   θ 3
R 4 = k 4   θ 4   θ 5
R 5 = k 5   θ 6   C O 2 n
R 6 = k 6   θ 4   C O 2 n
where θ1–6 are the fractions of sites with respect to the total number of sites (Table 2).
We assumed that both the activation energy (Ei) and the frequency factor (i) are not dependent of the adsorption degree (Redhead Approximation).
Thus, the kinetic constant of step (i) is:
ki = i exp(−Ei/RT)
The unsteady balance equations on the fraction (θ1, θ2, θ3 and θ5) read:
d ϑ 1 d t = R 1 + R 1 + R 4 + R 6
d ϑ 2 d t = R 1 R 1 R 2
d ϑ 3 d t = + R 2 R 3
d ϑ 5 d t = R 2 + R 3 R 5 + R 5
The total sites conservation equations complete the system:
ϑ 1 + ϑ 2 + ϑ 4 = ϑ C u °
ϑ 3 + ϑ 5 + ϑ 6 = ϑ C e °
The initial conditions are:
t = 0; θ1 = θ°1
t = 0; θ2 = θ°2
t = 0; θ3 = θ°3
t = 0; θ5 = θ°5
Regarding the balance on gas phase species, we assumed the reactor was composed by two vessels (R) and (T) (Figure 4). The vessel R is the catalytic reactor, while T is representative of the tube connecting the reactor (R) and the analyzer, whose residence time represents the delay time between gas species’ exit from the reactor and their detection in the analysis system.
The lab reactor used here for the tests is characterized by value of the axial Peclet (Pe) number equal to 50. This value suggests that each channel of the monolith behaves as a reactor with significant back diffusion. As a consequence, the reactor has an intermediate behavior between a plug flow reactor (PFR) and a continuous stirred tank reactor (CSTR). We used a CSTR as model reactor to simplify the fitting procedure. This choice allows a rough estimation of the kinetic parameters which can be used in the trap model to (at least qualitatively) test the idea. Further work will be focused on the development of the complete process configuration, which will take into account the real behavior of the reactor.
Furthermore, transport limitations are negligible since the kinetic regime is fully maintained by keeping the operating temperature very low (55 °C).
The CO molar balance equations in the reactor (R) and in the connecting tube (T) are the following:
R:
1 C ° d C C O d t C C O i n C C O C ° τ 1 = R 1 + R 1 ,
T:
1 C ° d C C O d t C C O i n C C O C ° τ 2 = 0 .
The CO2 molar balance equations are the following:
R:
1 C ° d C C O 2 d t + C C O 2 C ° τ 1 = R 3 ,
T:
1 C ° d C C O 2 d t + C C O 2 C ° τ 2 = 0 ,
where C° is the total gas concentration (mol/g) and τ1 and τ2 are the residence times (s) of the reactor R and the connecting tube T respectively.
The O2 molar balance equations are the following:
R:
1 C ° d C O 2 d t C O 2 i n C O 2 C ° τ 1 = 1 / 2 R 5 1 / 2 R 6 ,
T:
1 C ° d C O 2 d t C O 2 i n C O 2 C ° τ 1 = 0 .
The initial conditions of the CO, CO2, and O2 molar balances are the following:
t = 0; CCO2 = 0
t = 0; CCO = 0
t = 0; CO2 = 0,
when simulating the oxidation phase, the initial conditions for both the site concentrations (θi) and the gas phase molar concentration (Ci) are the final values corresponding to the adsorption phase simulation. The model equations with the initial conditions were solved by means of the Runge-Kutta method.
To quantify the differences between the experimental and the model curves, we computed the root mean square error (SRMSE) normalized by the maximum value of the experimental curve (Cmax) [53]:
S R M S E = 1 C m a x 1 N i = 1 N ( C e x p ( i ) C m o d e l ( i ) ) 2
According to Kanervo et al. [53], if SRMSE ≤ 0.045 then the experimental and modeling curves may be considered in good agreement.

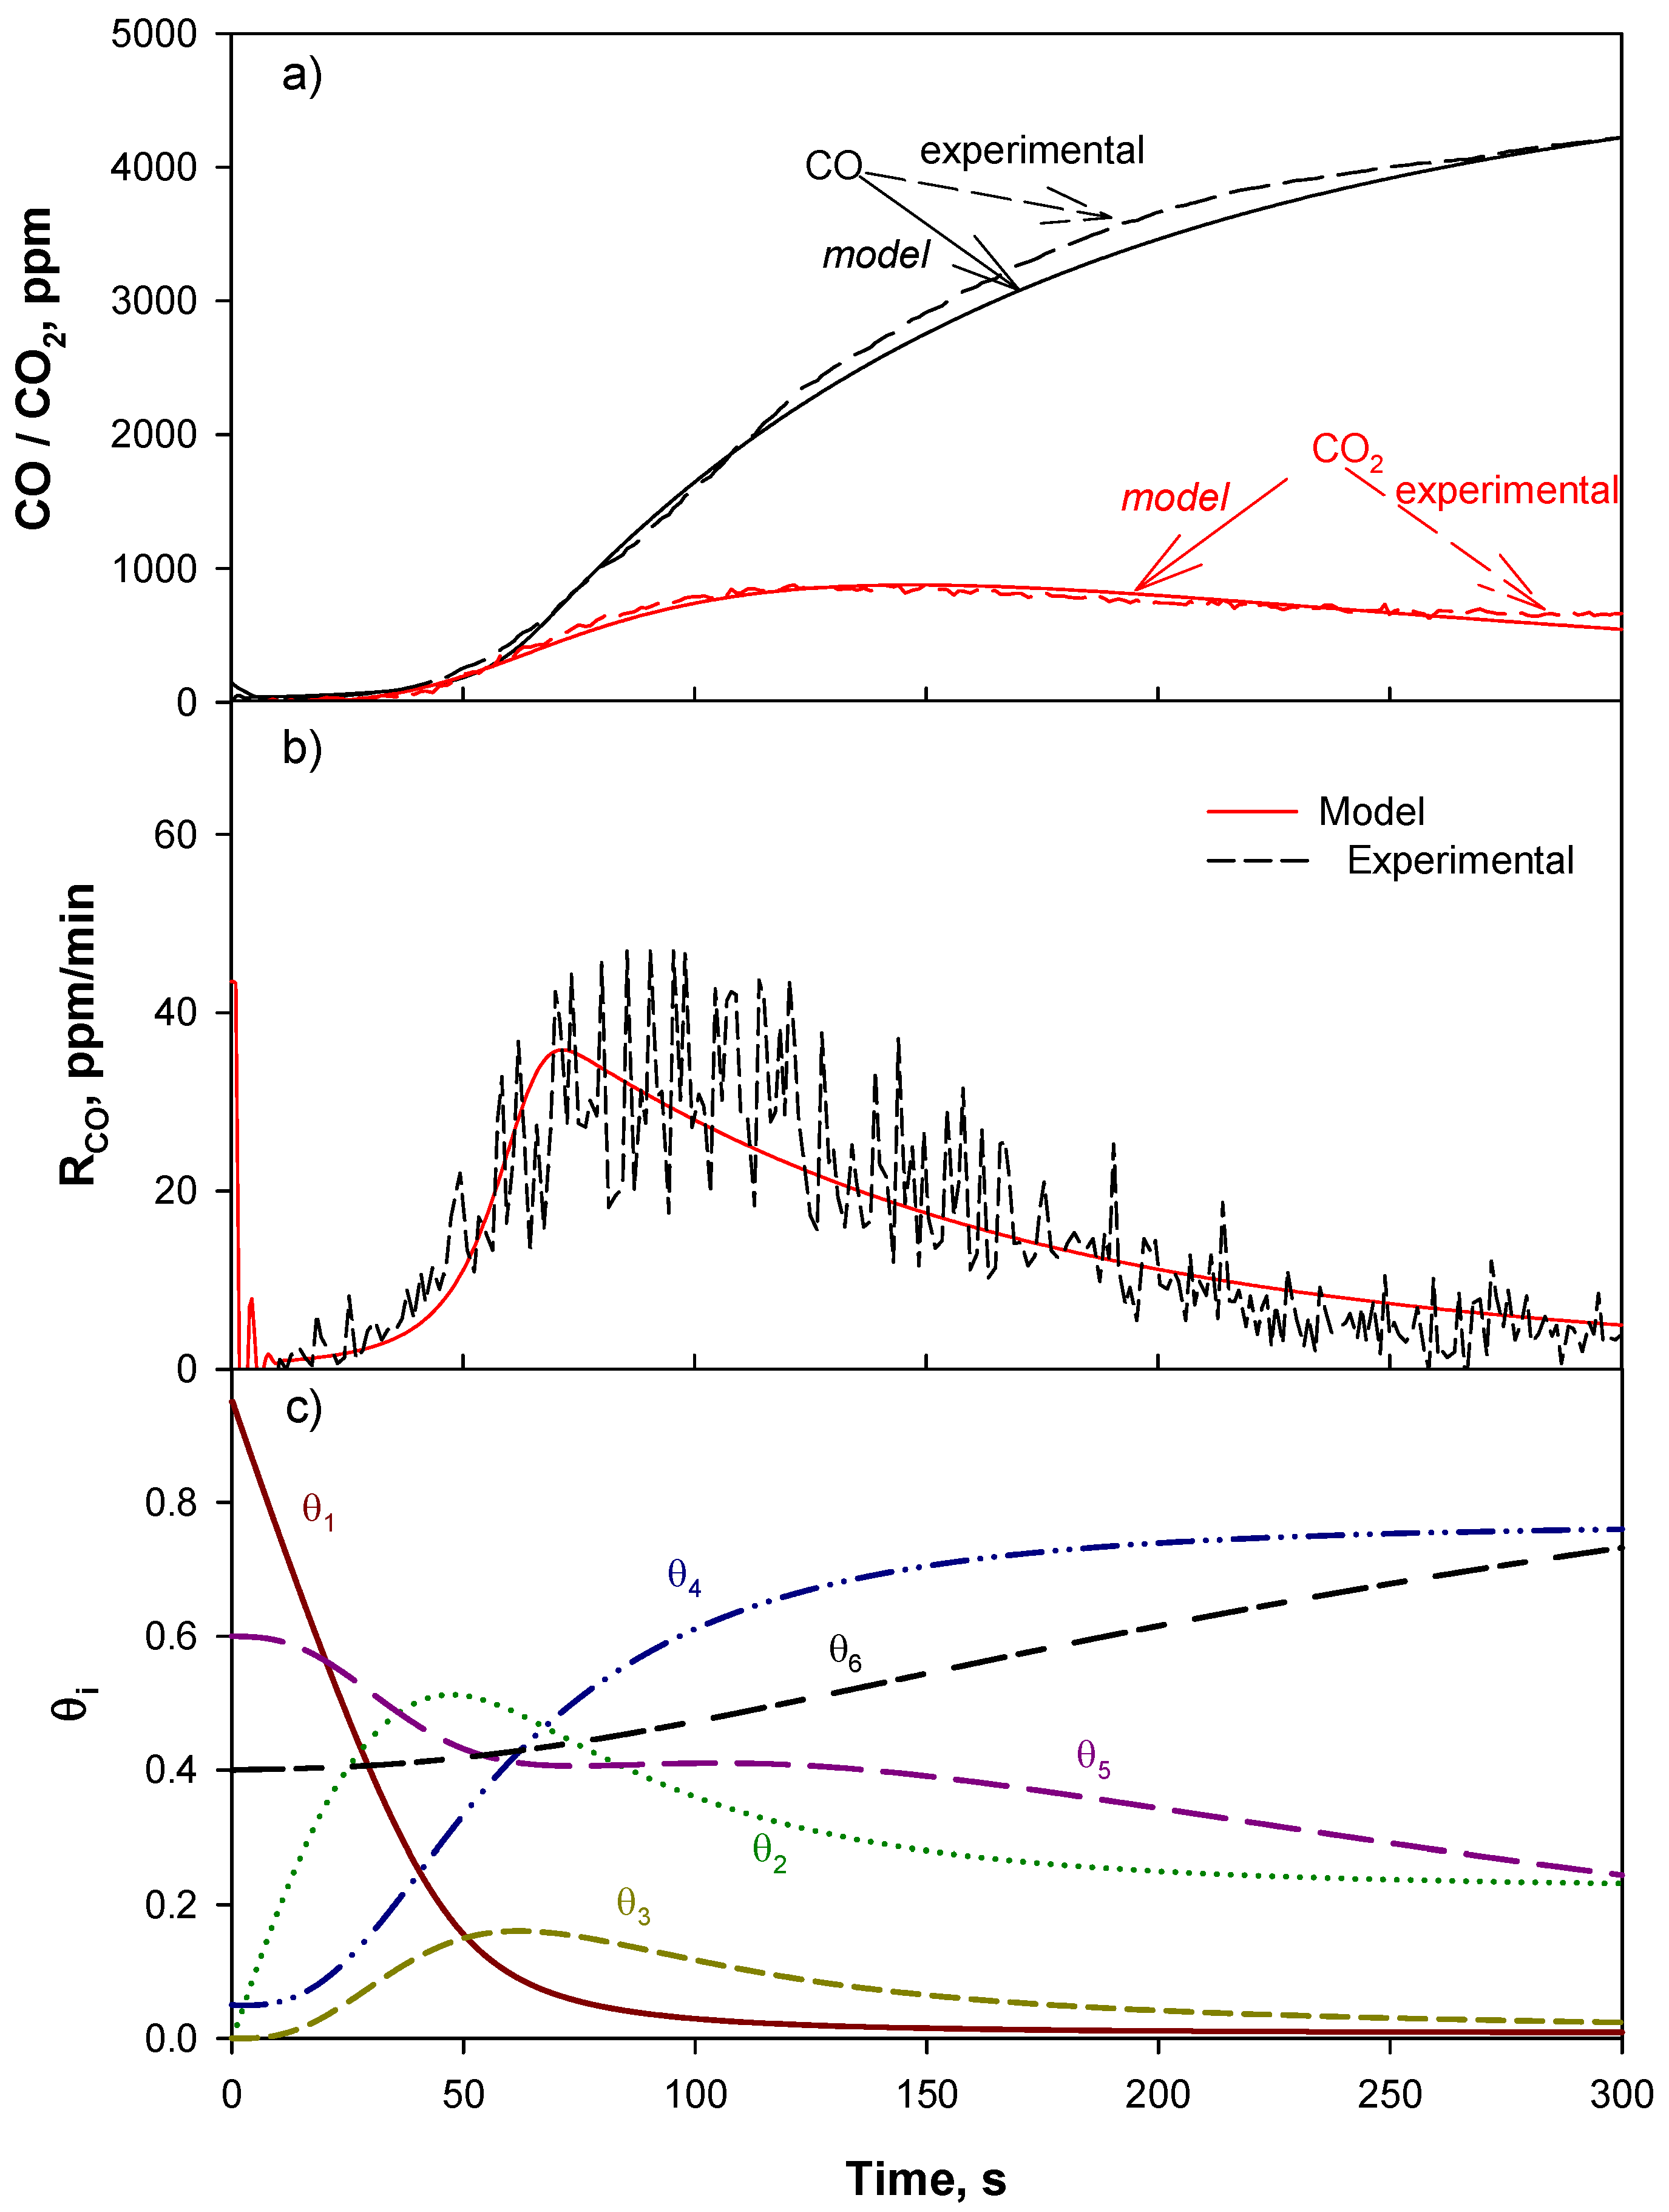
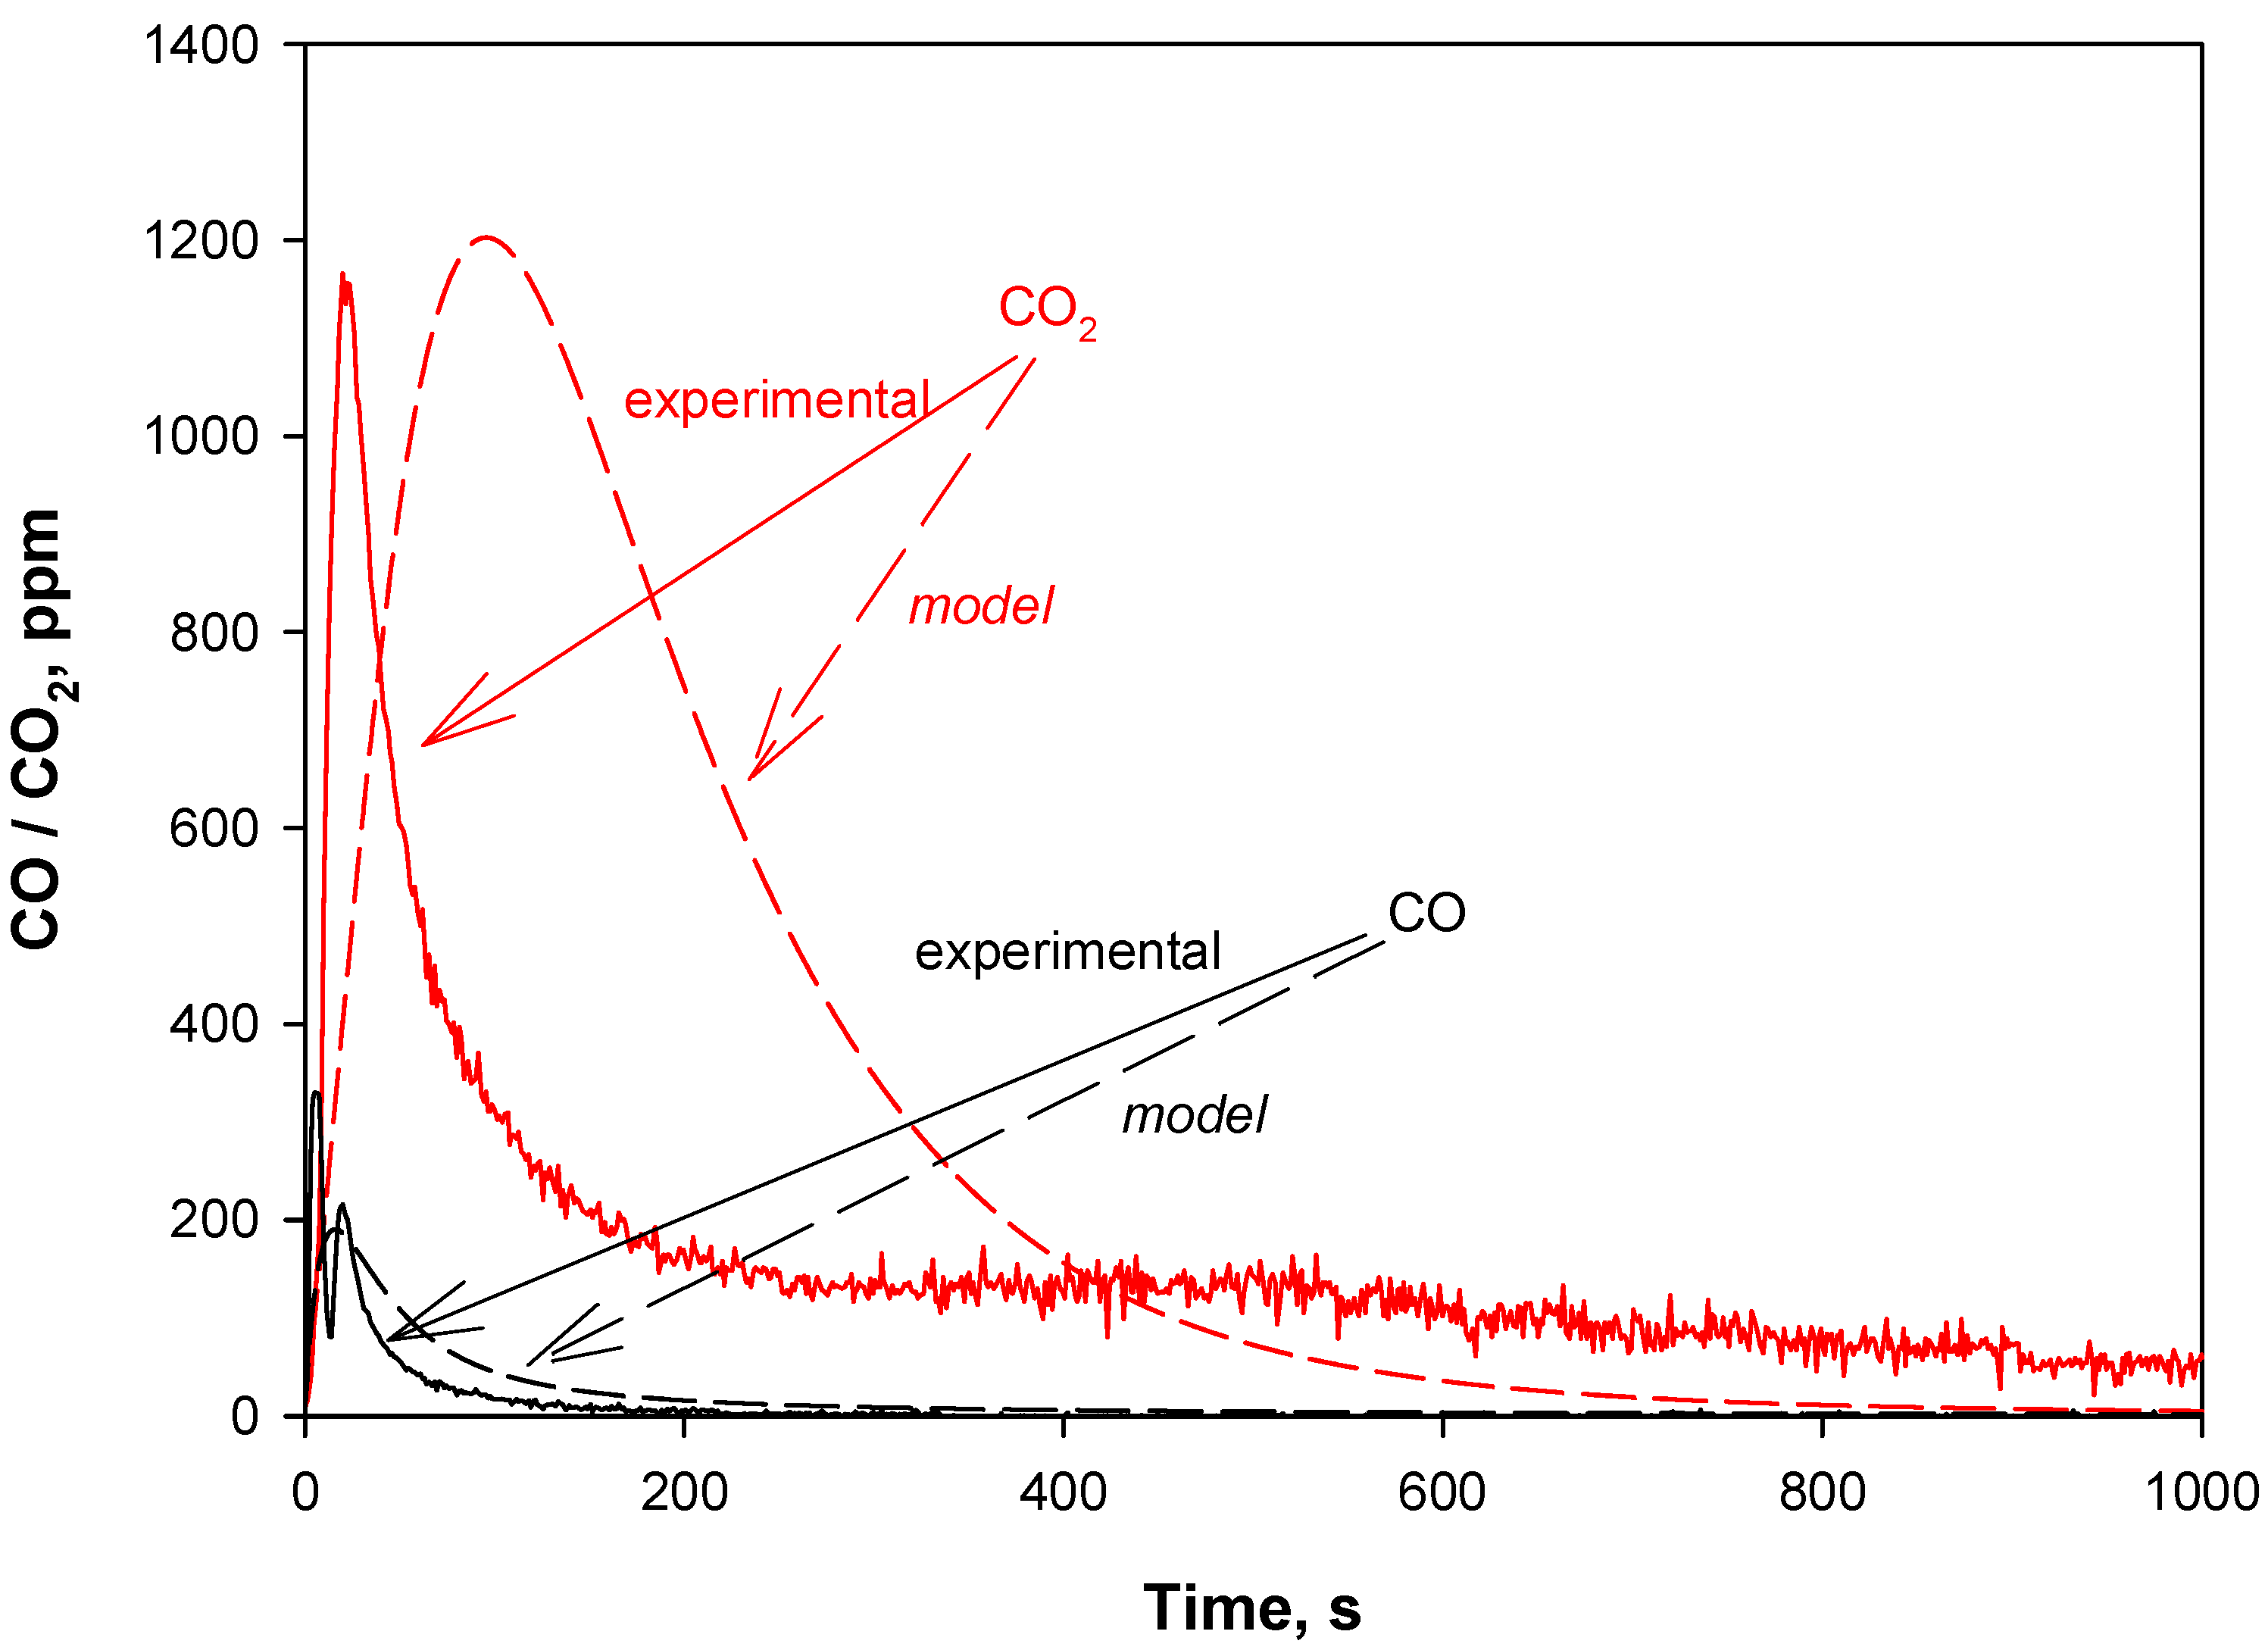
4.2. Model Validation

In order to derive the kinetic parameter values. we preliminary fitted the experimental curves of the adsorption phase, in the absence of O2 in the feed on the basis of data reported in [48] that were obtained at different temperatures and contact times. The values of kinetic parameters obtained are given in Table 3, together with the value of the regression factor, SRMSE.
The SRMSE value suggests that the agreement between the two curves is quite satisfactory being ≤0.045 [53].
In Figure 5a, the comparison between the experimental and the model outlet CO and CO2 concentrations during the adsorption are shown as a function of time. In Figure 5b, the reaction rate of CO consumption is compared with the experimental rate. Both figures show a very good agreement between experimental and model results.
Trends of the site concentrations were also computed from the model. In Figure 5c the temporal evolution of the site concentrations is shown.
It is found that at the end of the reaction, Cu sites in the oxidized form are completely consumed (θ1 = 0). Parts of them are covered by CO (θ2) and parts of them are simply reduced (θ4).
It is worth noting that CO2 is still present over the Ce sites (θ3) and the Ce sites are only partially reduced, since the concentration of oxidized sites is higher than zero (θ5).
Furthermore, from the trend of θ5, it is possible to follow the O transfer from Ce sites to Cu sites, which allows for CO adsorption. θ5 (σ’-O) first decreases, driving the CO2 formation through step 2 and then it increases, since it is restored by CO2 desorption (step 3).
The O transfer is then facilitated by the CO-CO2 cycle occurring over the catalyst surface and by step 5, which eventually allows for the reduction of Ce based sites (θ5θ6). At the end of the run (~400 s), CO2 is almost completely desorbed (θ3 ≈ 0). From these results, it turns out that the controlling parameter is O availability/mobility.
After the adsorption phase, O2 is fed to the reactor in order to re-oxidize the catalyst sites.
According to our trap experiment (Figure 3), the adsorption step is stopped at about 45 s (CO ≈ 100 ppm). To quantify the kinetic parameters of the oxidation reactions of the mechanism (steps 6 and 7), we fitted the experimental curves.
It is worth noting that in the experiments there is a time delay between the adsorption phase and the oxidation phase in which the catalyst is under CO/CO2/N2 atmosphere at isothermal conditions.
In Figure 6, the comparison between the experimental and the model curves during the oxidation are shown.
The agreement between the experimental and the model curves is poor.
This deviation could be explained on the basis of the model of the reactor we used. As previously discussed, the experimental reactor exhibits an intermediate behavior between a PFR and a CSTR, being characterized by a significant back diffusion. The presence of axial dispersion causes an increase of the deviation of the curves from a pulse, which is typical of a PFR reactor. Nevertheless, the aim of the model is not to fit the experimental data but rather to get reliable kinetic parameters to test the idea of the trap configuration.
From the comparison between the curves, we get the values of the kinetic constants of the oxidation step, which are given in Table 4.
As shown in Table 4, the value of SRMSE is quite high, confirming that the agreement between the experimental and the model curves is not satisfactory.

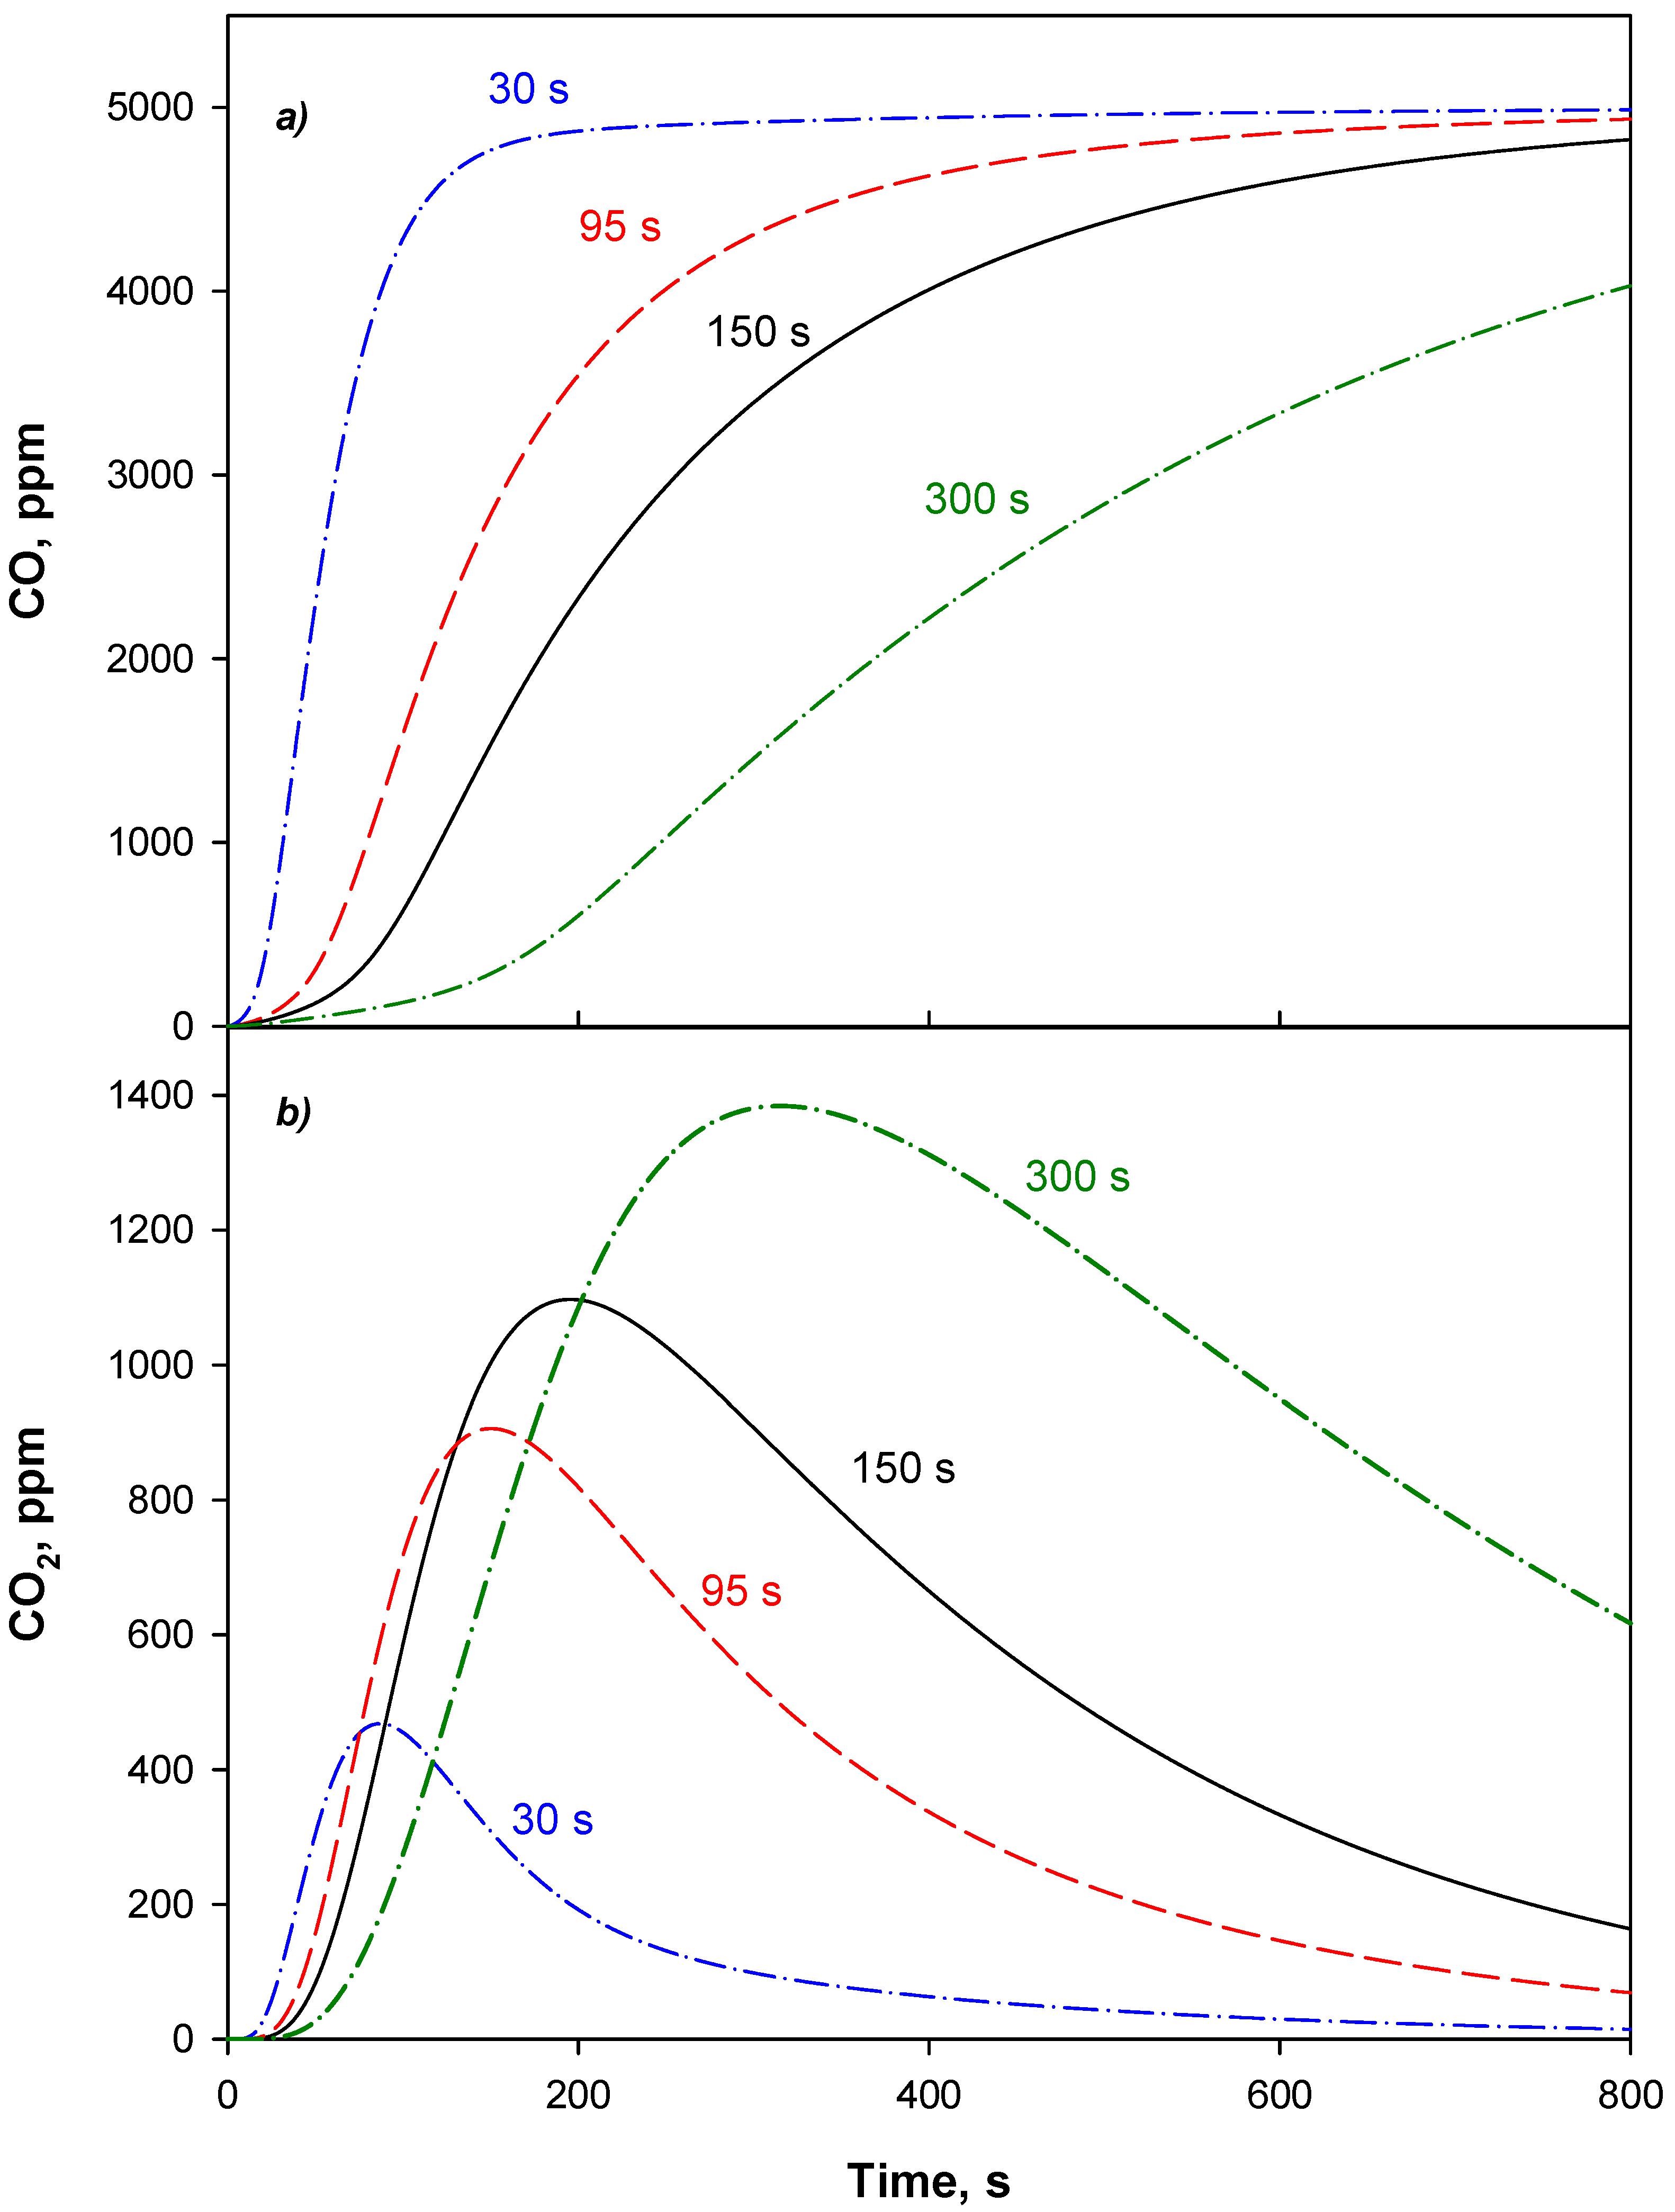
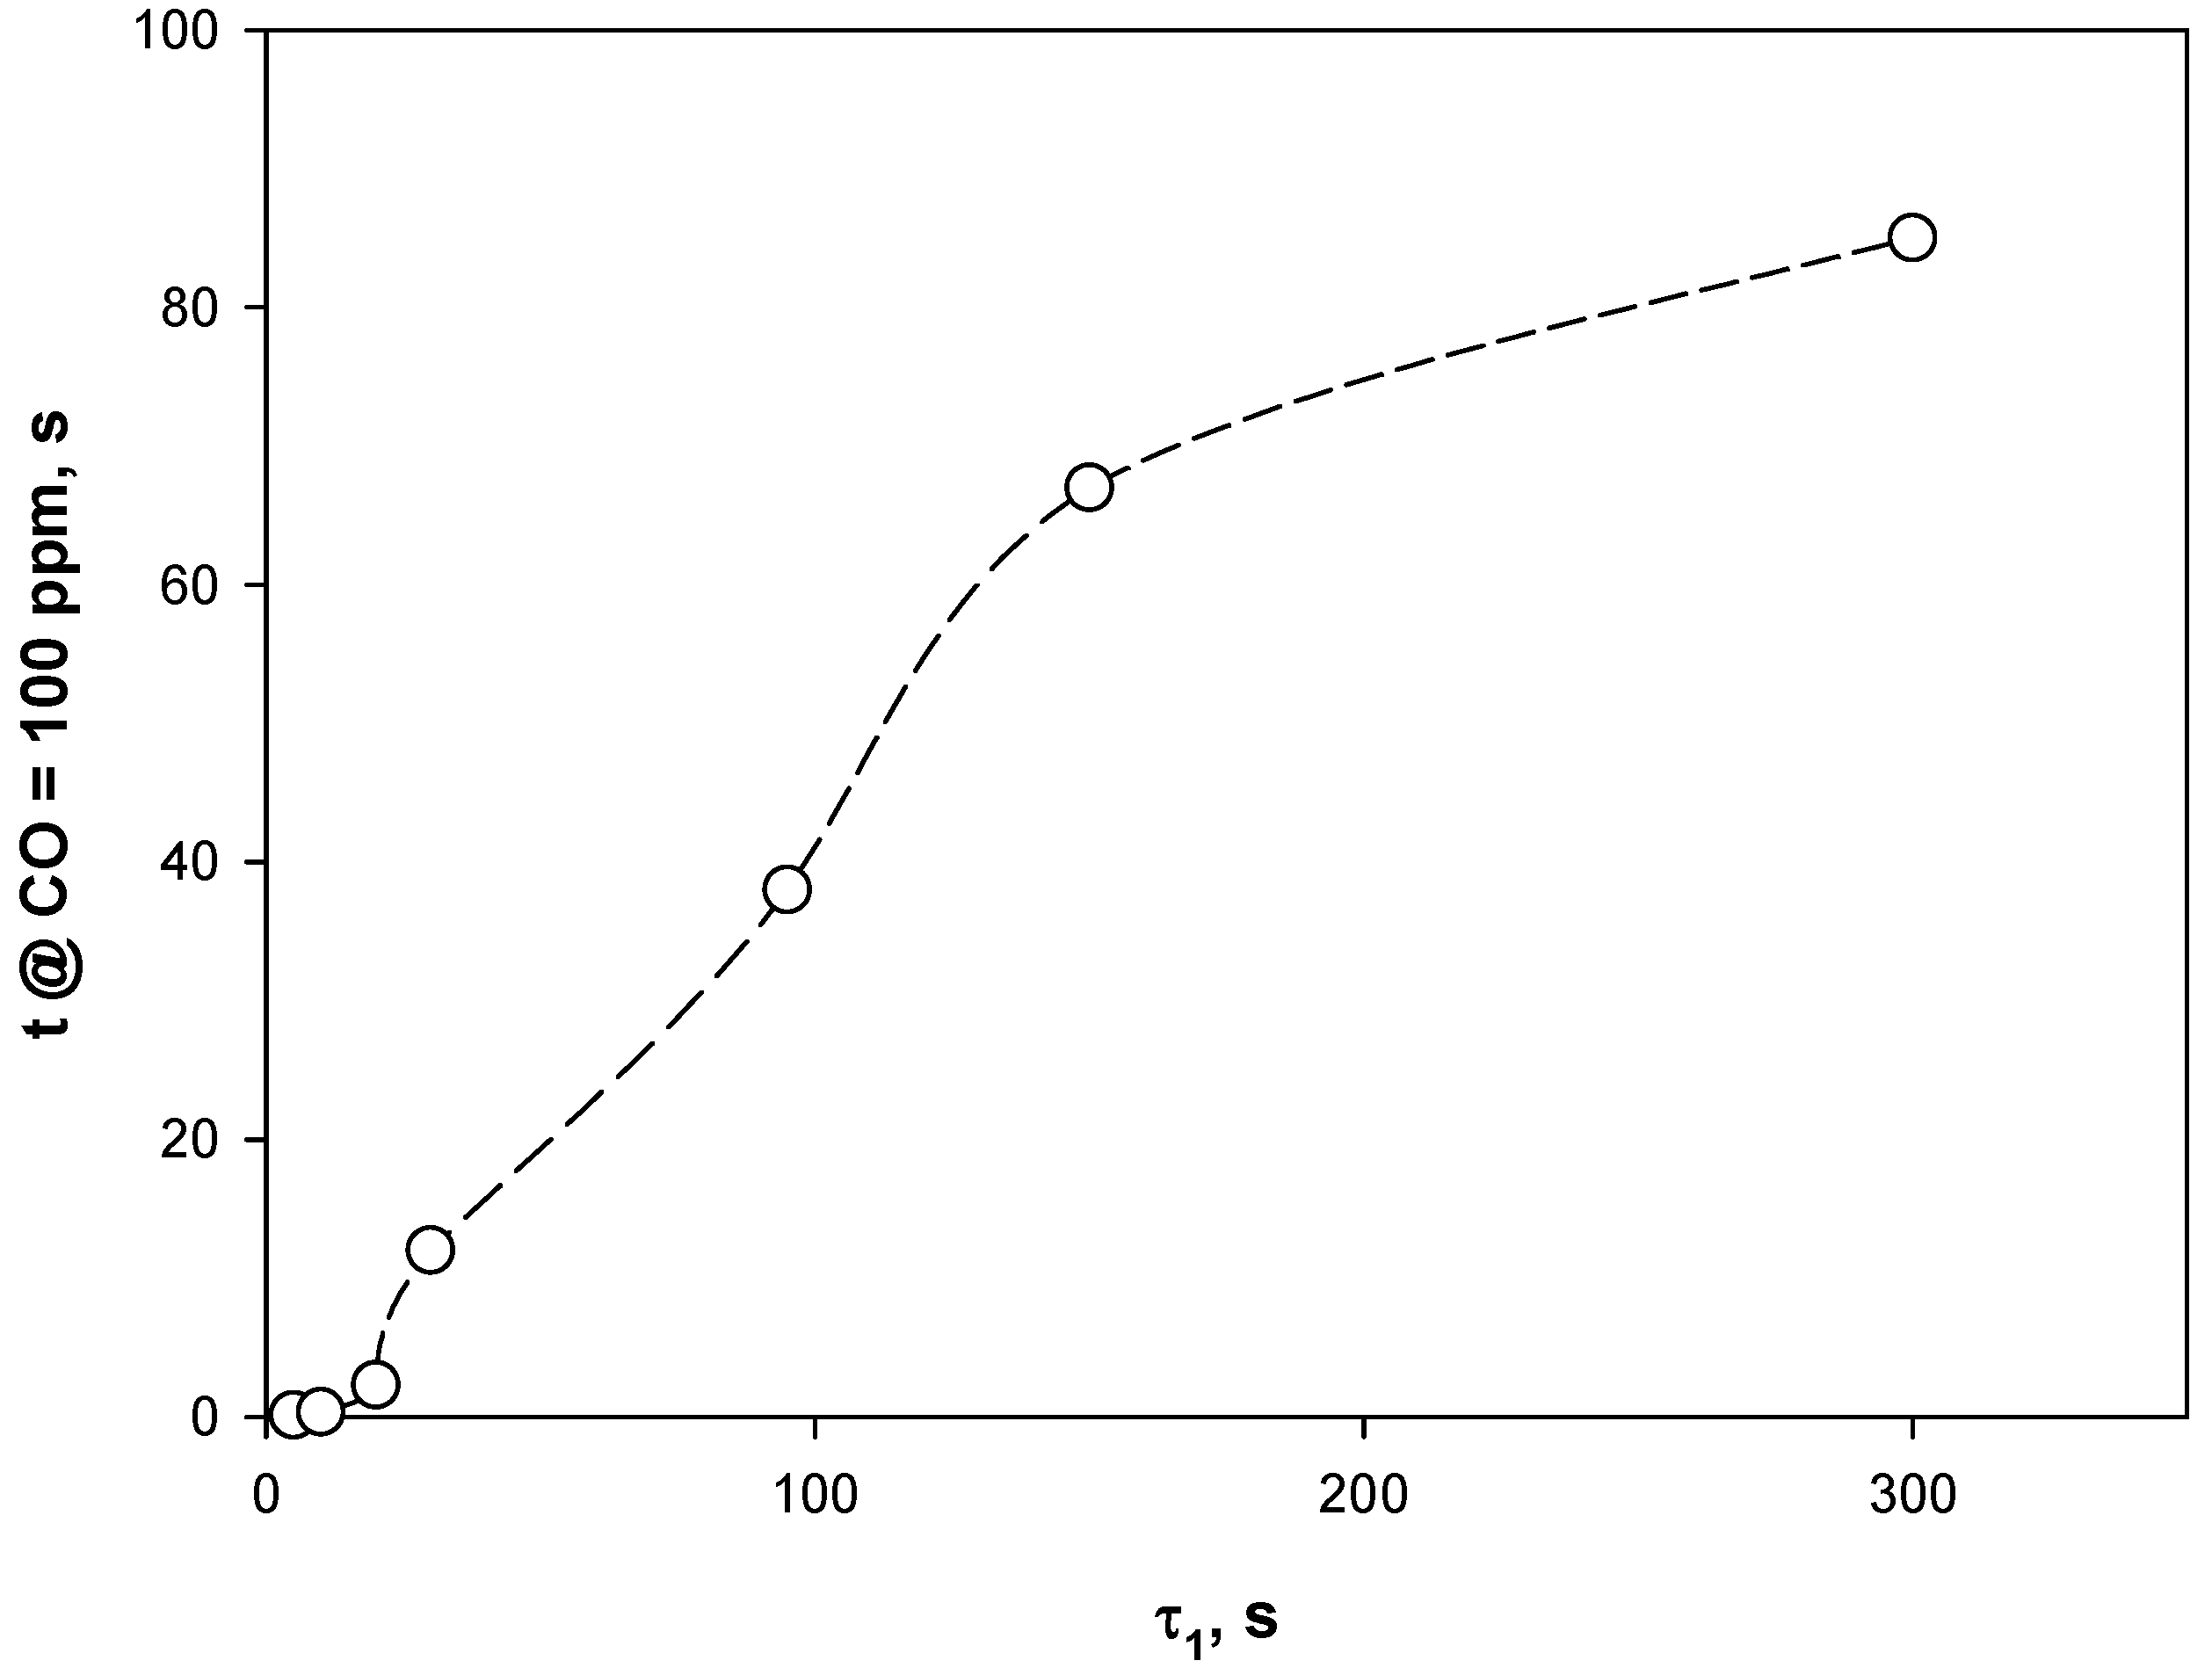
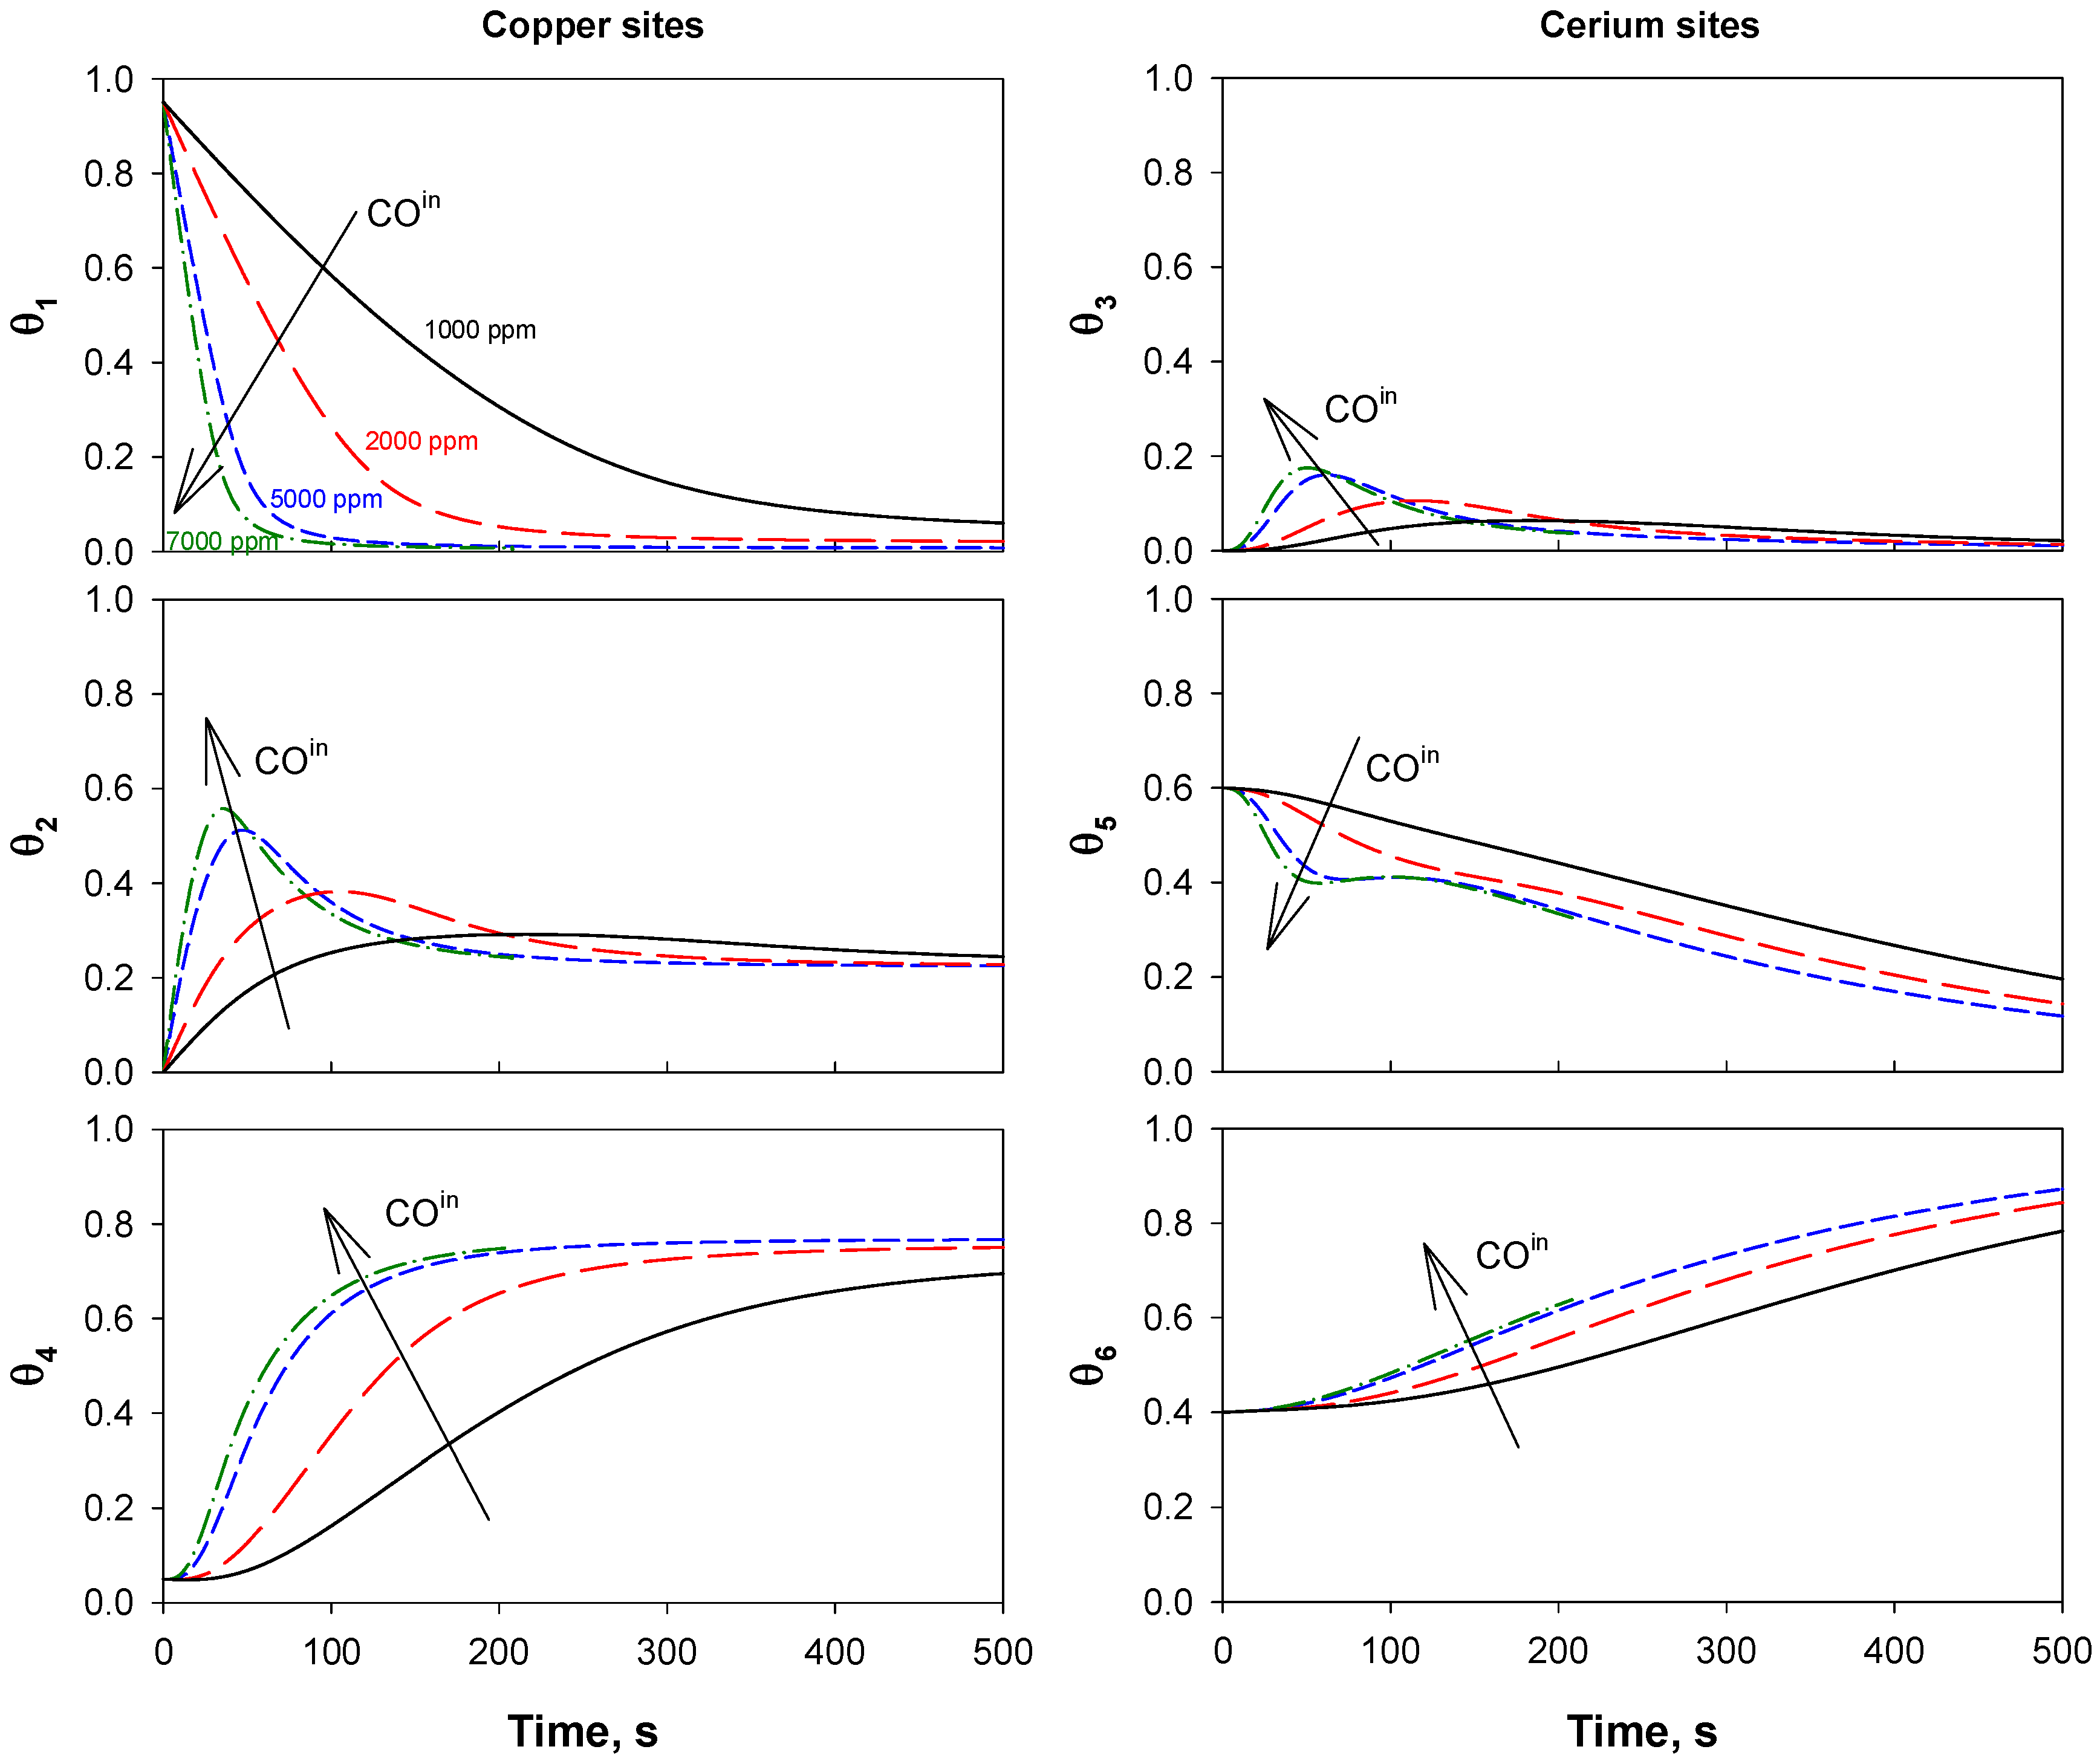
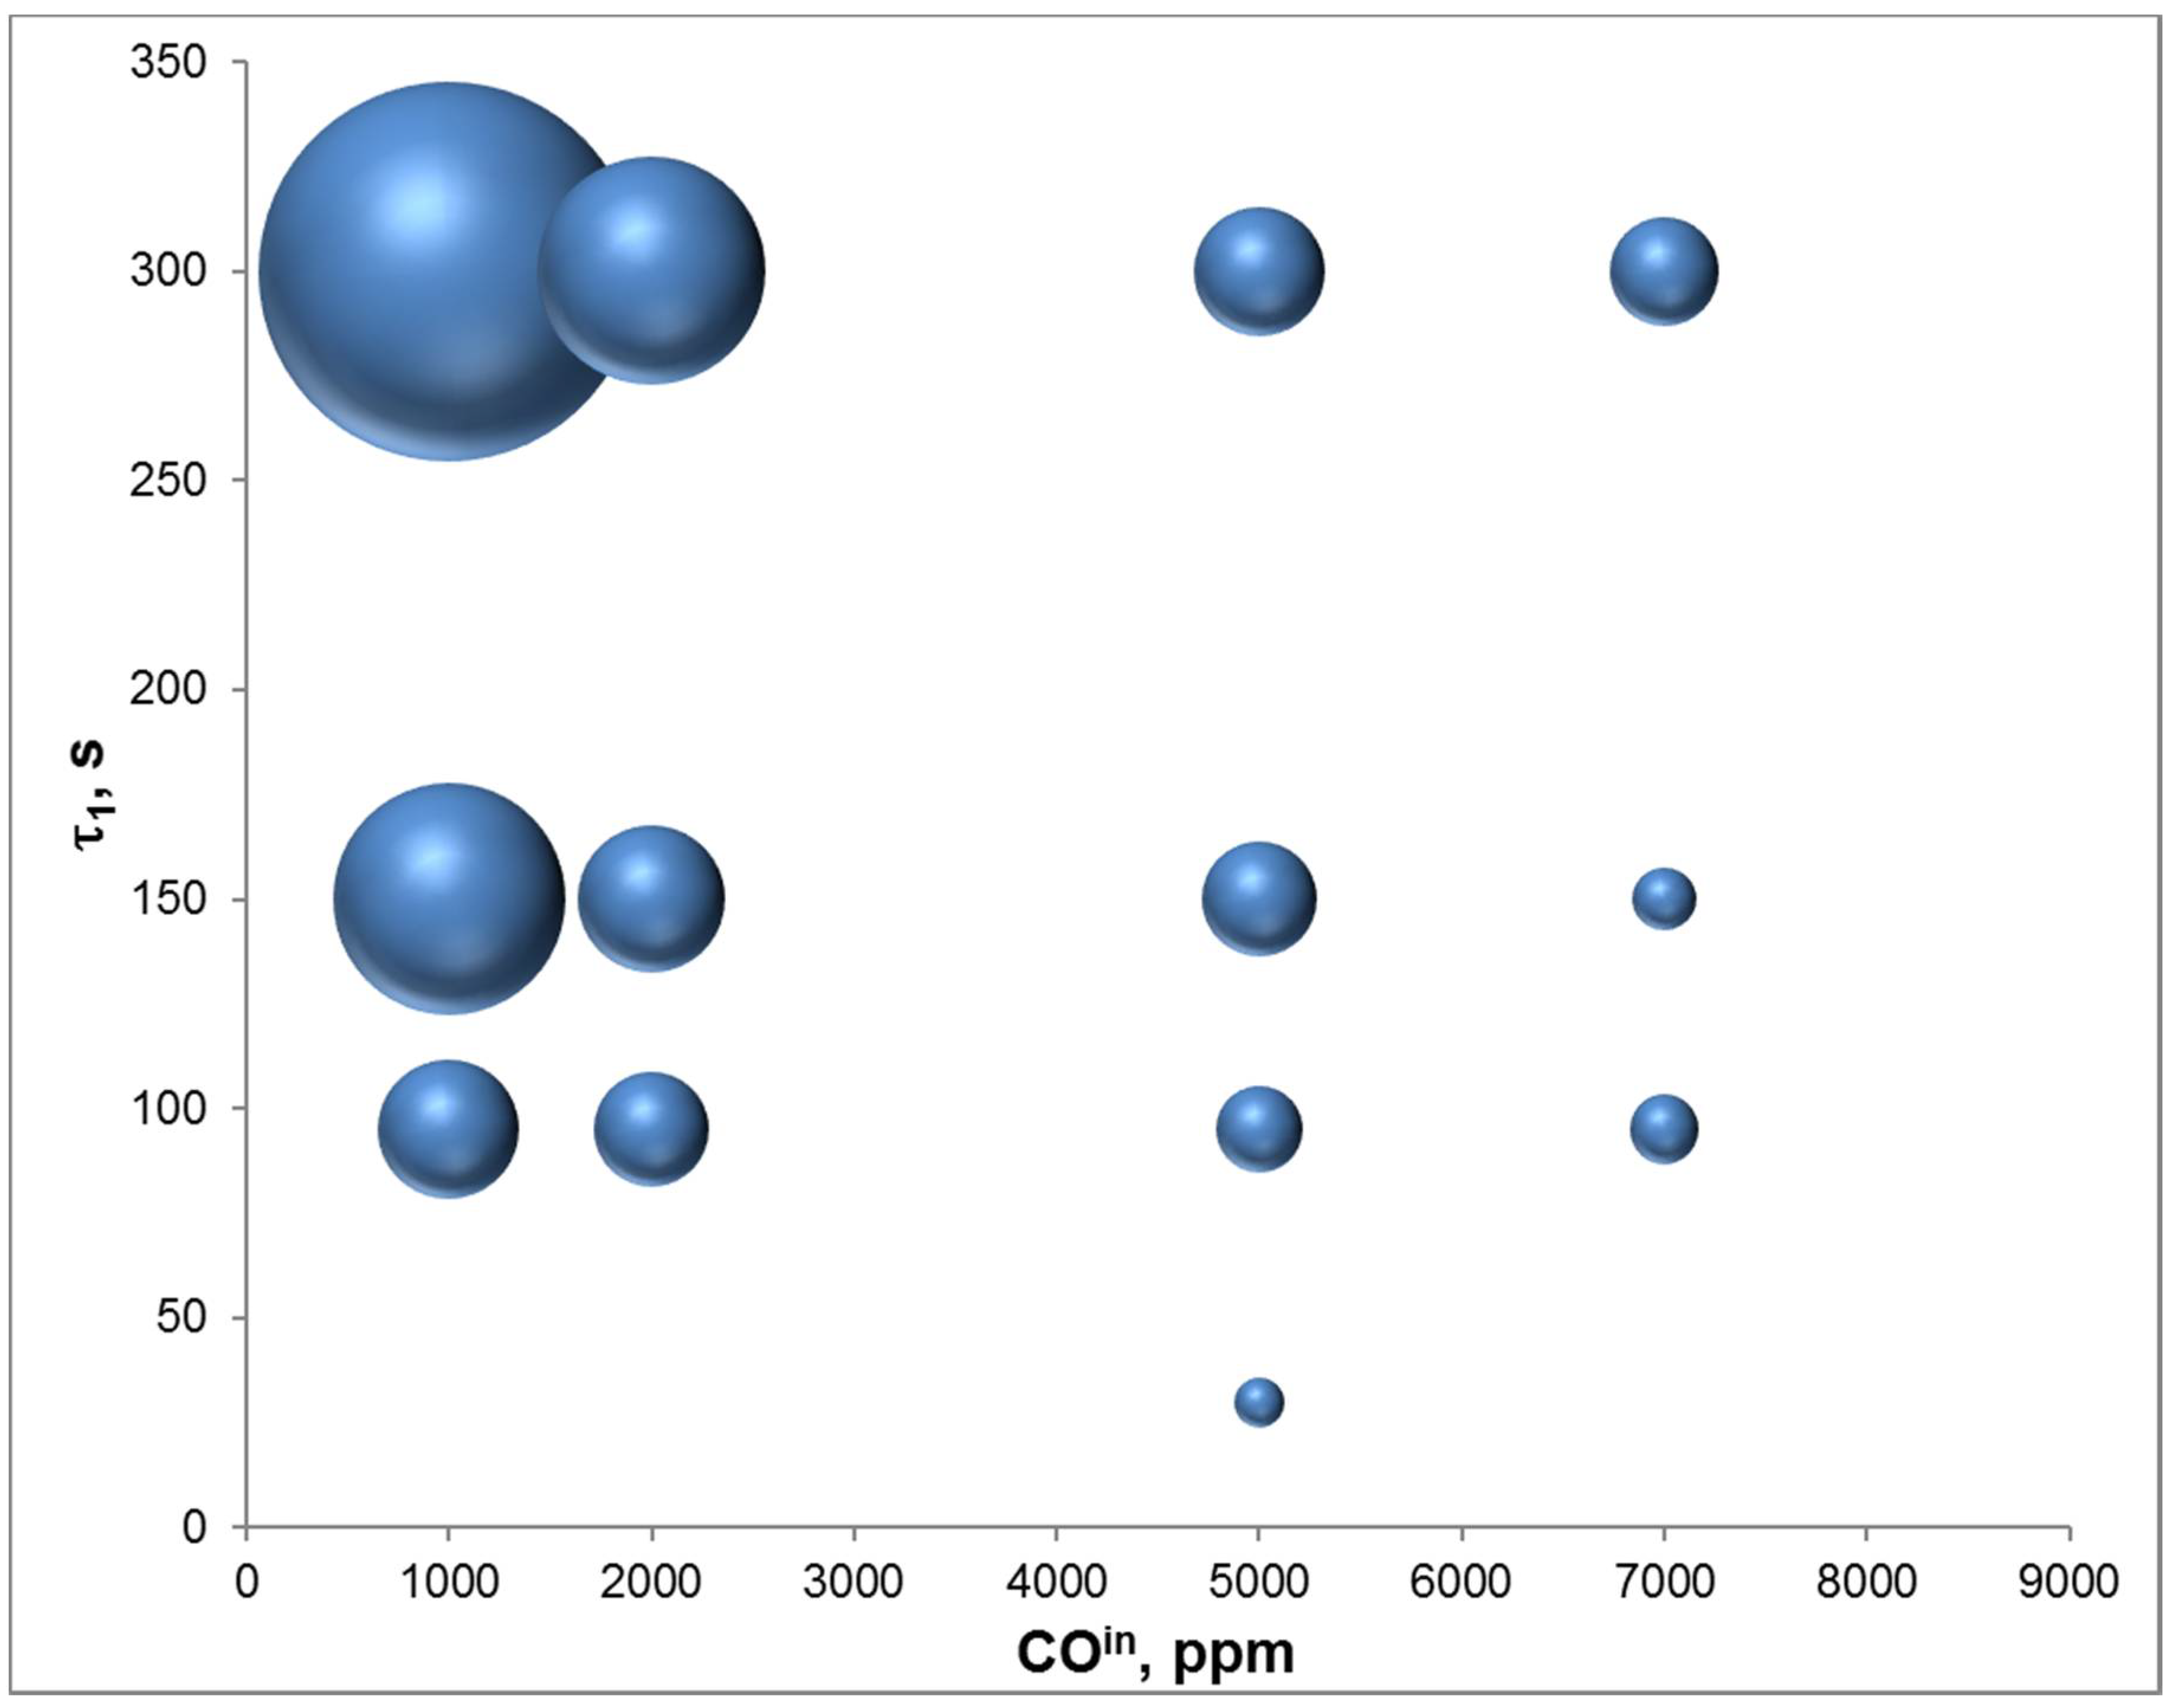
4.3. Adsorption Phase: Effect of the Operating Parameters

In order to study the effect of the parameters on the performances of the adsorption phase, we computed the CO and CO2 outlet concentrations by varying the contact time and the CO inlet concentration.
In Figure 7, the CO and CO2 outlet concentrations are shown as a function of time as computed at different values of the residence time of the reactor, R.
As expected, when increasing the residence time, CO outlet concentration decreases at any given time and the time length at which CO outlet concentration is lower than 100 ppm increases. The CO2 outlet concentration increases even more than expected due to the non-linear behavior of residence time with respect to CO2/CO ratio observed and explained in [48].
In Figure 8, the time at which CO outlet concentration is equal to 100 ppm is plotted versus the residence time of reactor R.
When increasing the residence time, the duration of the adsorption phase may potentially increase up to more than 1 min for a residence time of 300 s. Nevertheless, the figure also shows clear changes of the slope by increasing the residence time, due to non-linear behavior of the reactive adsorption on the CuO/CeO2 catalyst [48].
In Figure 9, the CO and CO2 outlet concentrations are plotted versus time as calculated at different values of CO inlet concentration. When increasing the CO content in the feed mixture, the time at 100 ppm significantly decreases, as expected. Nevertheless, the same does not occur for CO2 at high values of CO inlet concentration. The amount of CO2 released at 5000 ppm CO approaches that released for 7000 ppm. This effect can be considered opposite to that produced by the increase of residence time observed in [1] and highlights the limiting step of CO2 oxidation and desorption. In other words, transfer of CO2 from θ2 to θ3 sites with subsequent CO2 desorption and reduction of θ1 sites into θ4 sites has a plateau value likely related to vicinity of Cu2+-O2−-Ce4+ sites and Ce4+-O2−-Ce4+ sites, which is a measure of copper dispersion. On the other hand, CO adsorption can still continue on copper/ceria sites not able to oxidize CO and transfer CO2.
In Figure 10, the time at which the CO outlet concentration is equal to 100 ppm is plotted versus the CO inlet concentration, showing that upon increasing the CO inlet concentration, the time duration of the adsorption phase should be lower and lower. It is worth noting that due to the non-linear behavior of the CO reactive adsorption on the CuO/CeO2 catalyst, the adsorption time is significantly higher than expected in absence of CO reaction and CO2 release (dashed line in Figure 10).
In Figure 11, the site concentrations are plotted as calculated for all the COin concentrations. It appears that at the highest values of COin (5000 and 7000 ppm), the sites distribution almost overlaps, suggesting a saturation of the catalyst sites.
In Figure 12, results of simulations of the adsorption phase, varying both residence time and CO inlet concentration, are summarized by the plane residence time/CO inlet concentration. The bubble dimension is proportional to the time at which CO outlet concentration is equal to 100 ppm.
It is worth noting that the best conditions are attained at low CO inlet concentration and high residence time.

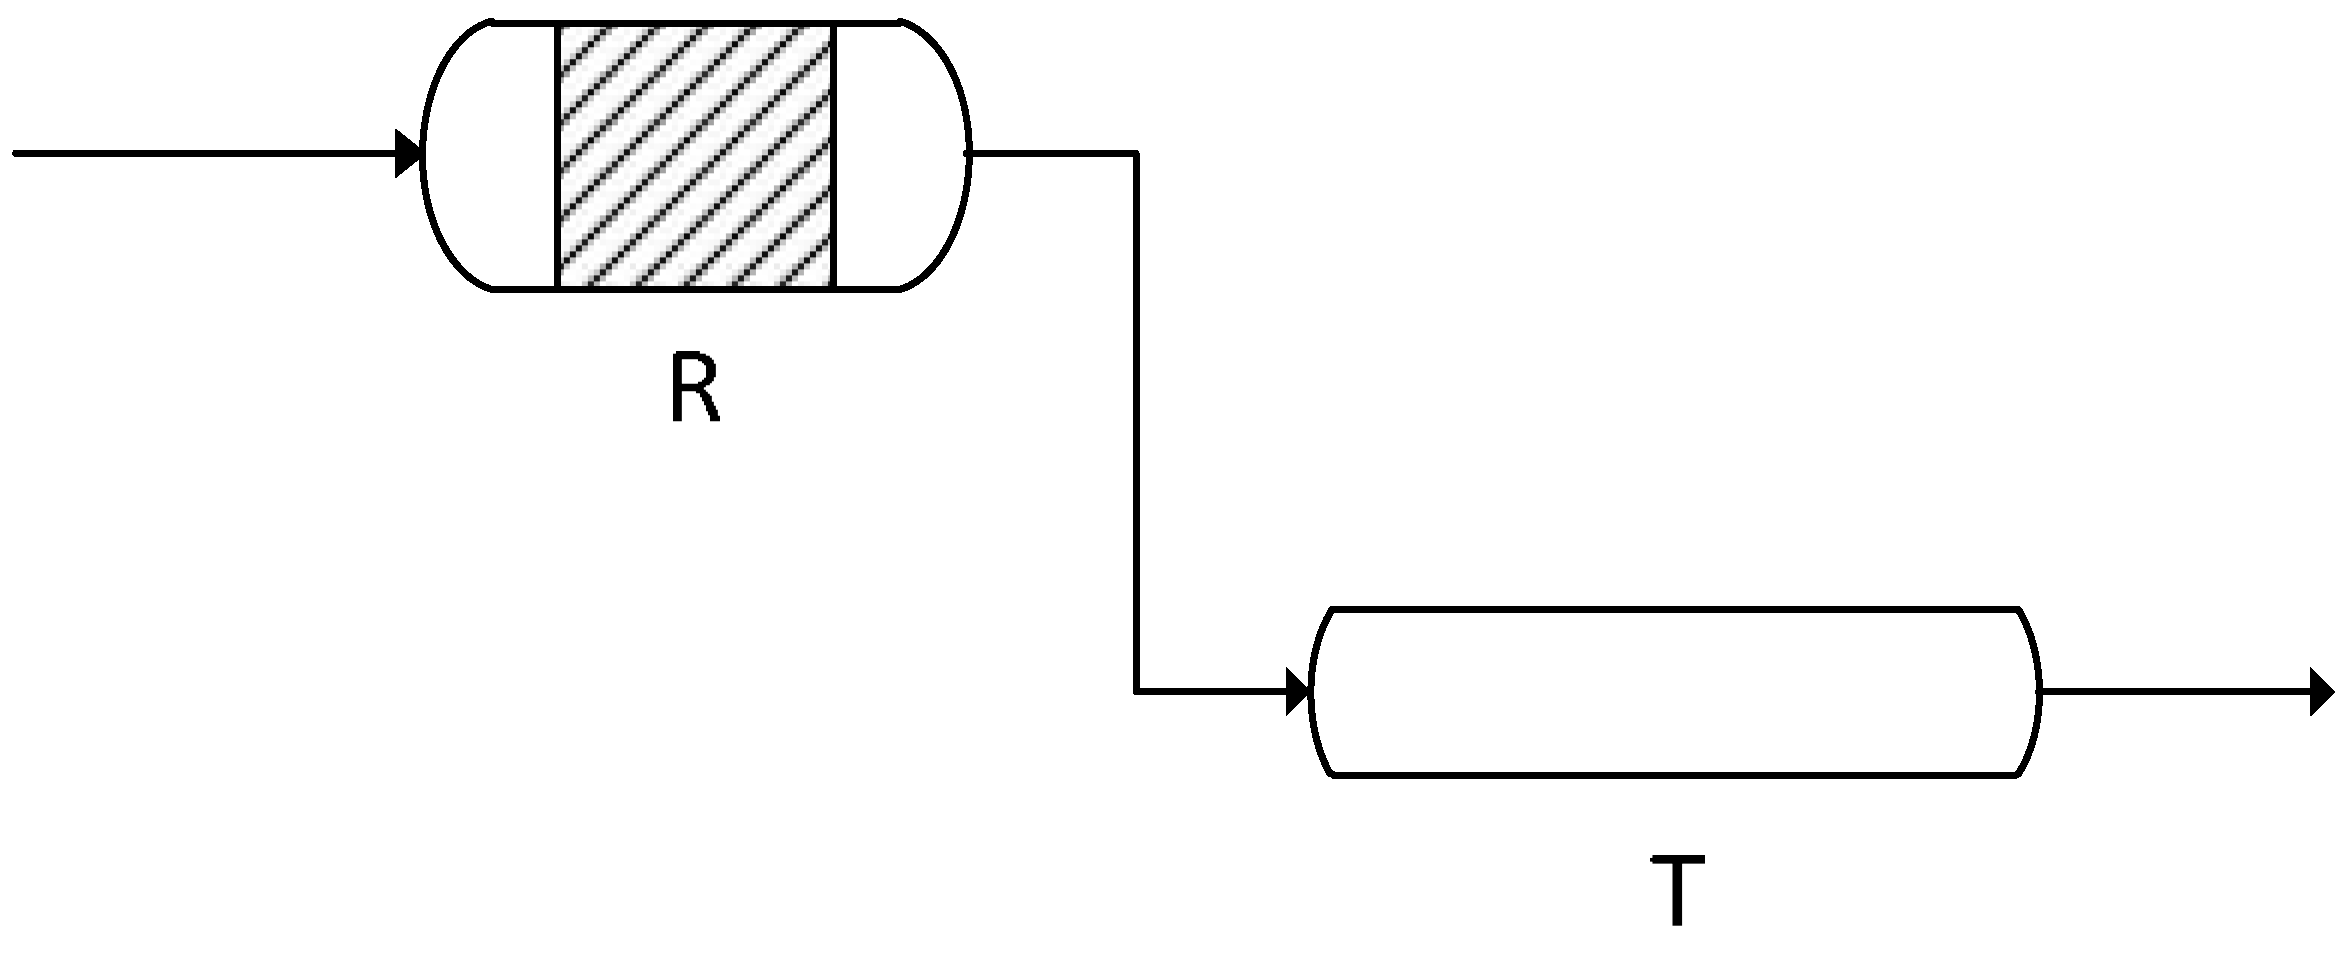
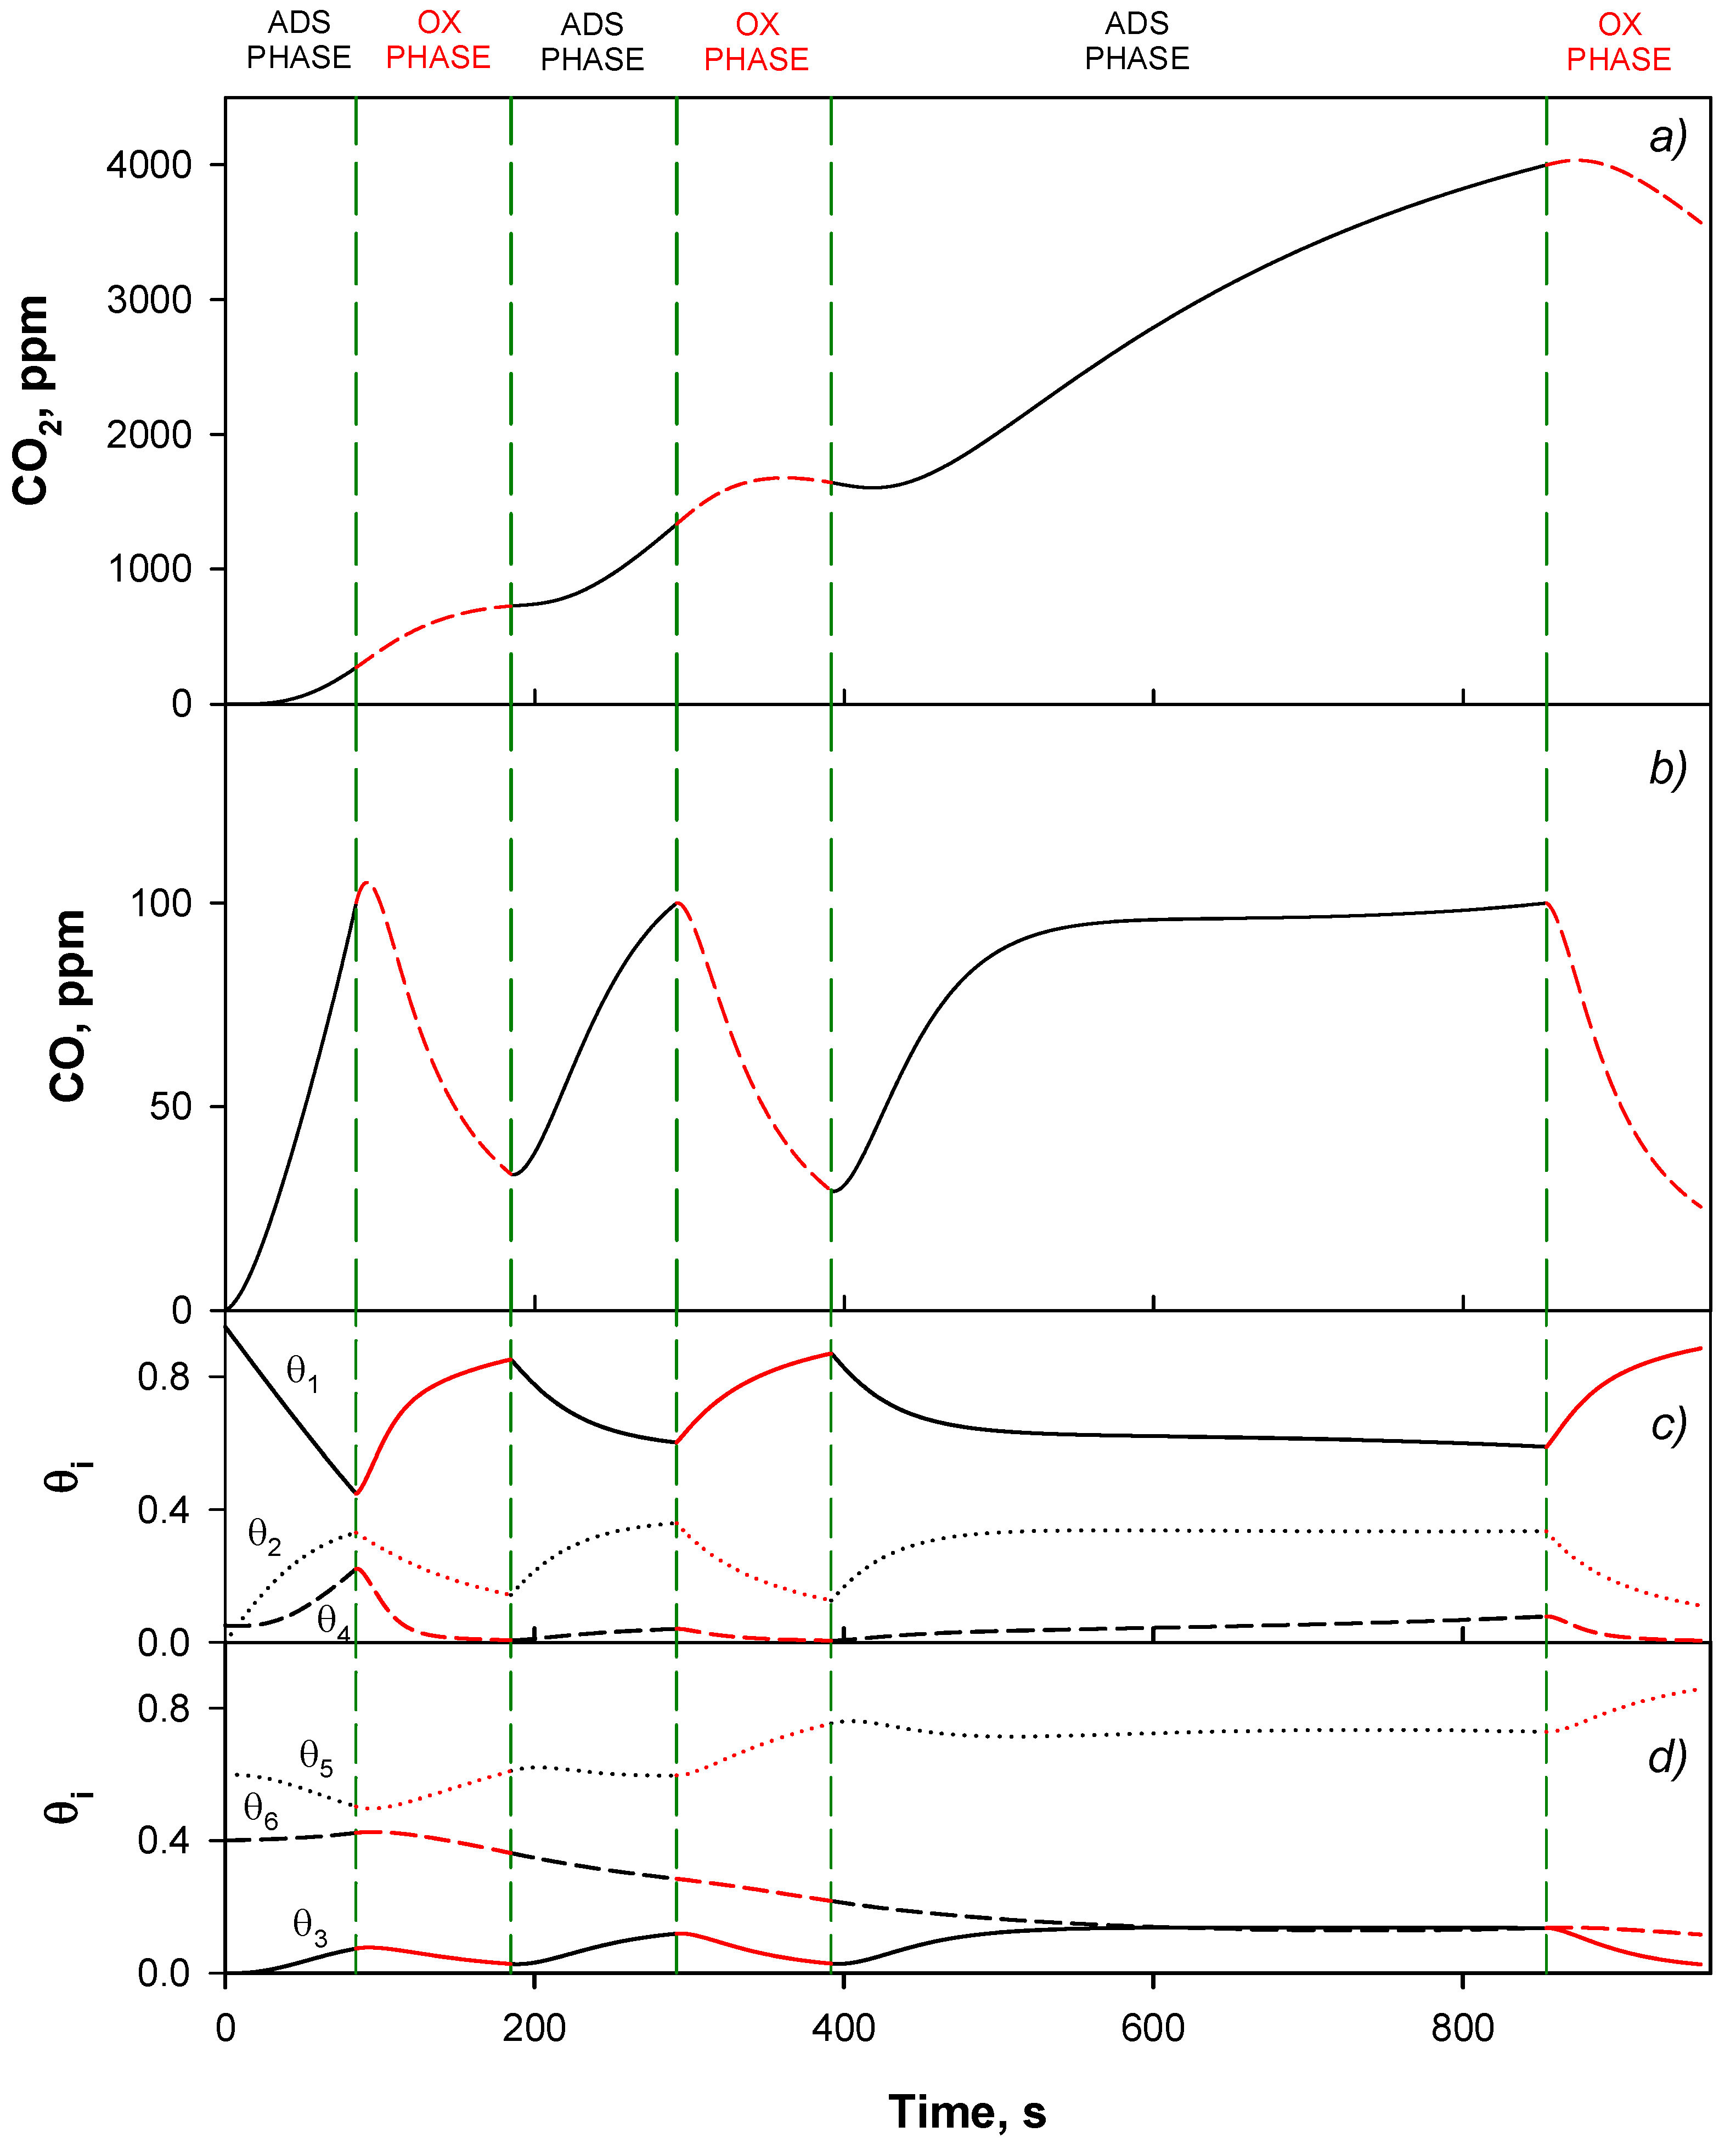
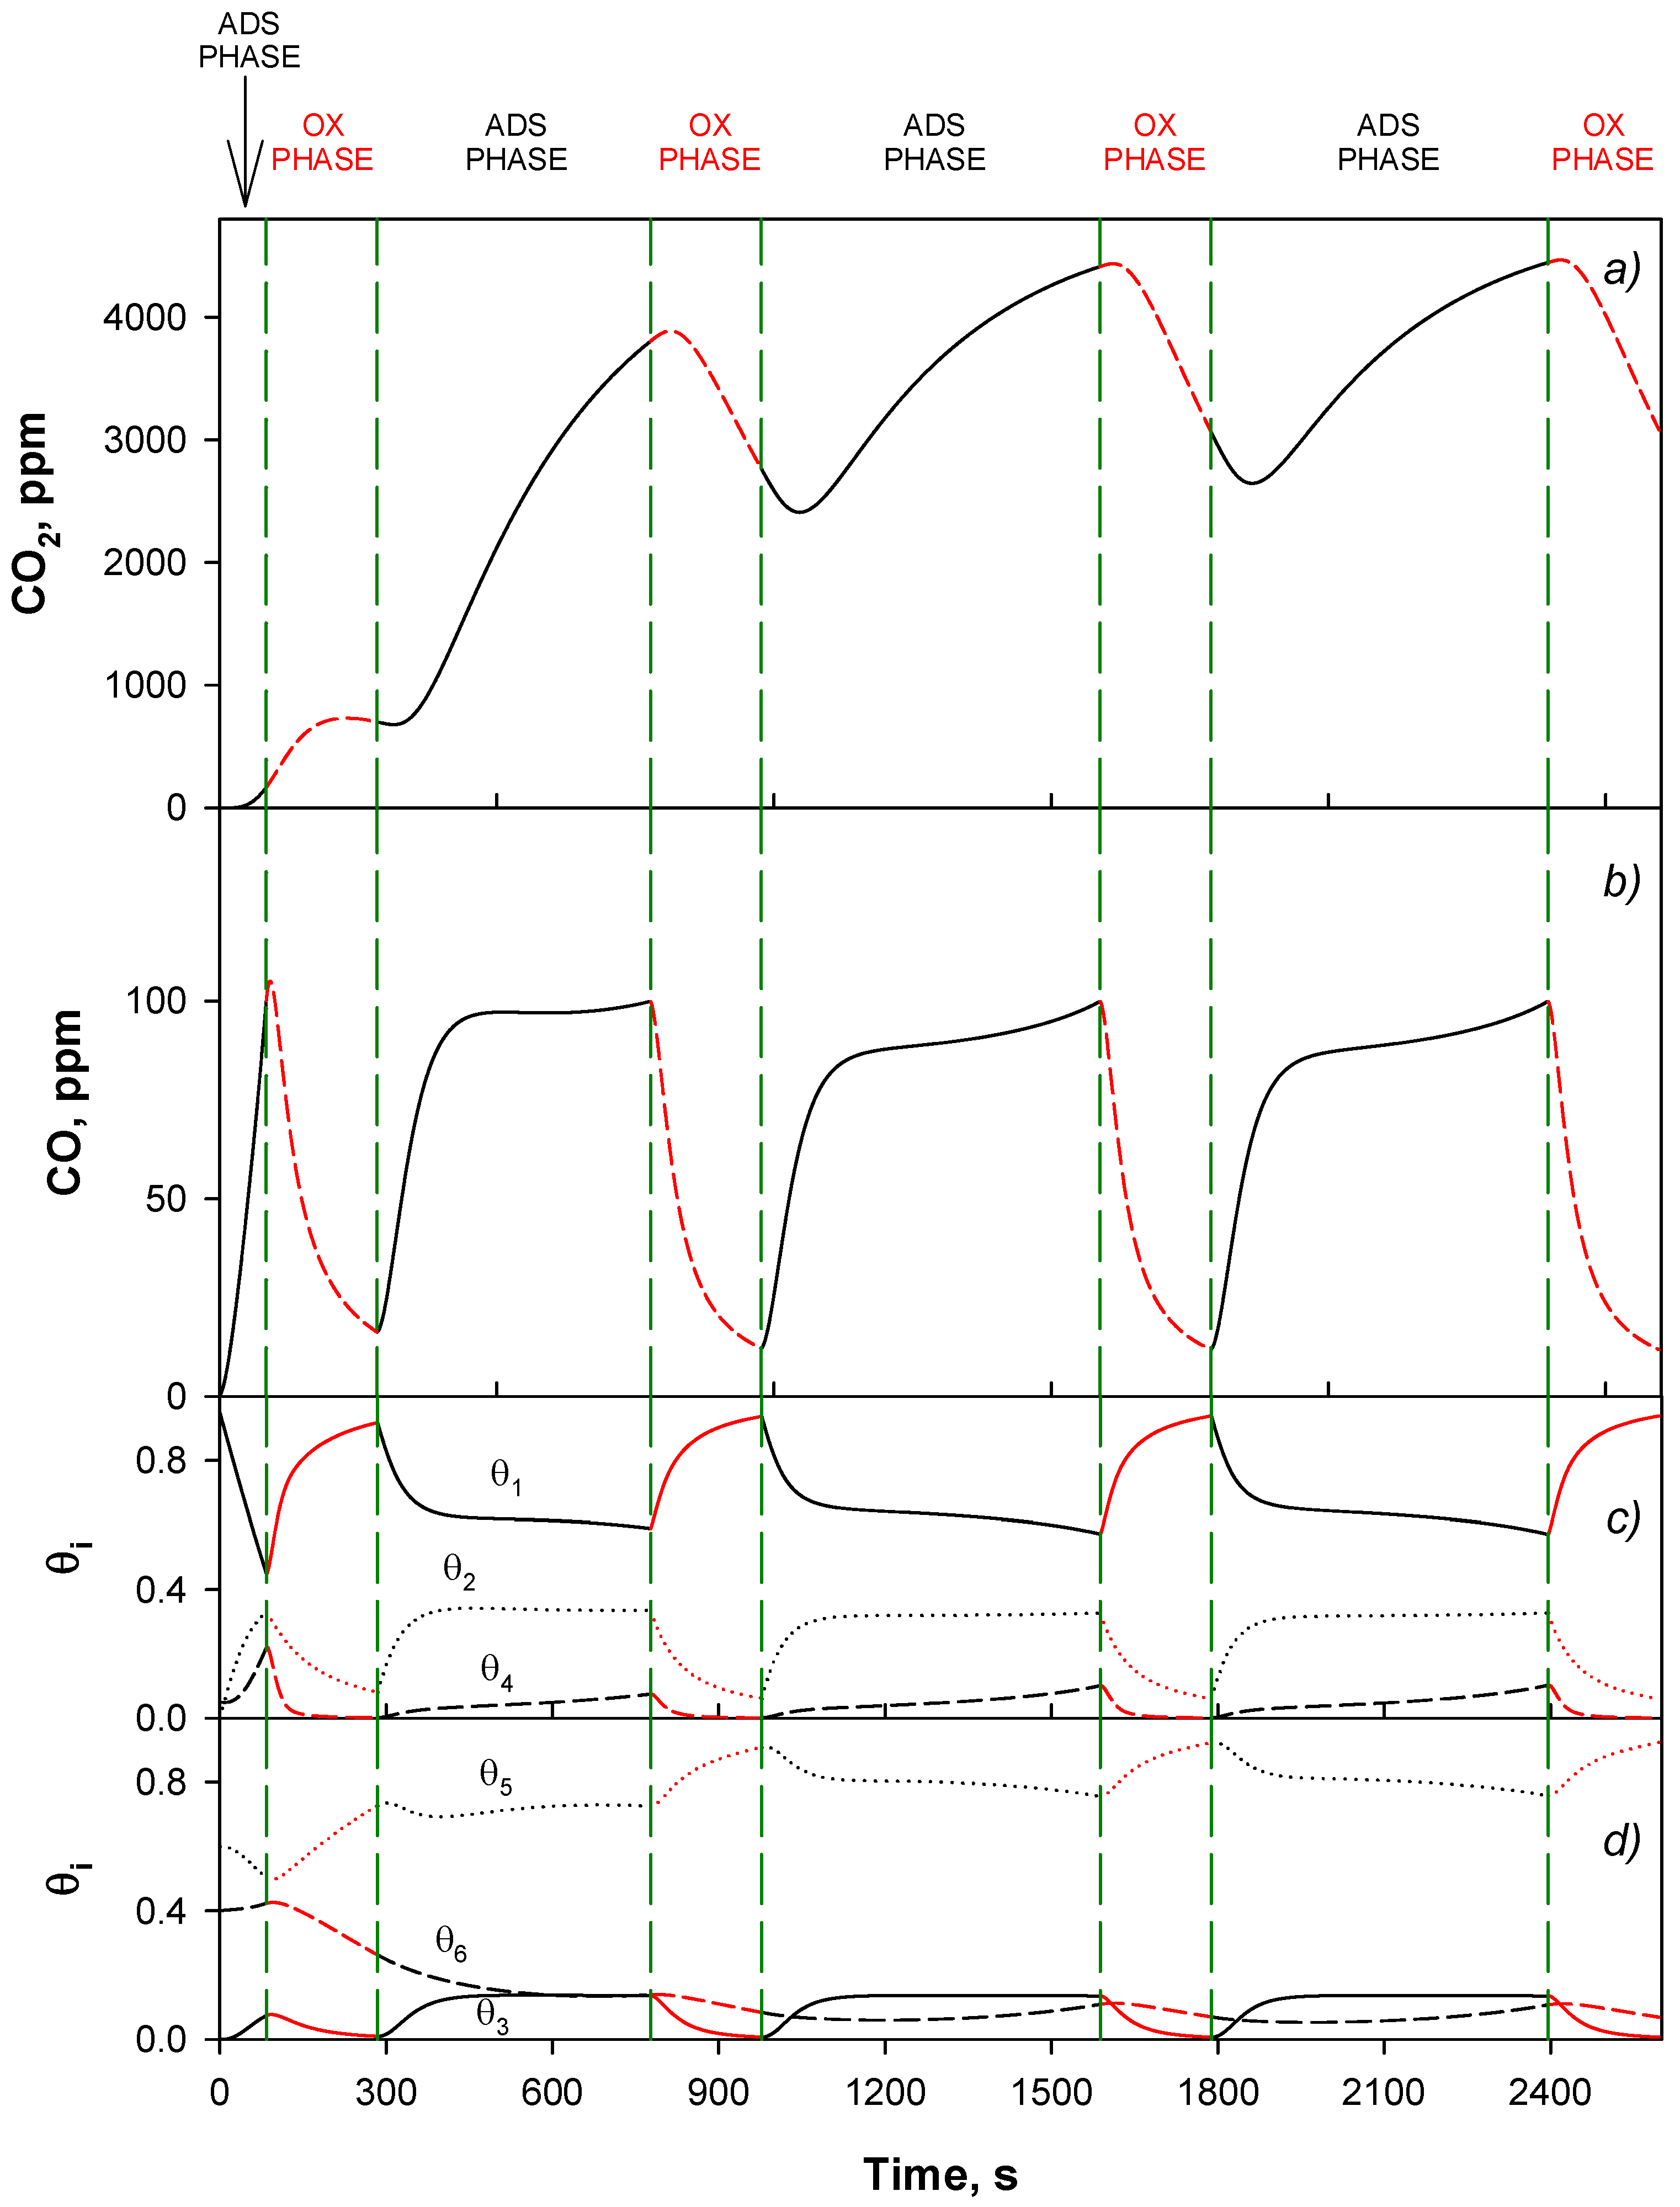
4.4. Trap Simulation

The effect of the time length of the oxidation phase is fundamental for an effective regeneration of the catalyst.
To this end, we simulated the complete (isothermal) trap, by setting COin = 5000 ppm and τ1 = 95 s. In Figure 13, CO2 (a and CO (b), are shown as a function of time as obtained by simulating both the adsorption (Phase I) and the oxidation (Phase II) step.
When the CO outlet concentration reaches 100 ppm, the feed is switched to COin = 0 and O2 is fed (5 vol %).
The corresponding evolution of the catalyst sites is shown in Figure 14 (c and d) as well. During the adsorption phase, we observe that the active sites (sites Cu2+--O2−-Ce4+) start to be covered by CO (θ1 decreases, θ2 increases). The activation of oxygen transfer from the Ce sites to the Cu sites (step 4 of the reaction mechanism) should also be noted, since θ6 slightly increases and θ5 decreases. CO is present as adsorbed over the catalyst (θ2) and only partially oxidized to CO2 (θ3).
During the oxidation phase, both the Cu- (θ1) and Ce- (θ5) oxidized sites are restored. However, it is worth noting that the time required for reaching the initial values is quite high (~400 s).
In order to optimize the trap operation, we performed simulations of several subsequent cycles. In Figure 15, the adsorption/oxidation cycles are shown as obtained by setting the duration of the oxidation step at 100 s, whereas time length of the adsorption phase is adjusted by the time at which CO outlet concentration reaches 100 ppm, corresponding to about 85 s for the first adsorption phase, in agreement with above results.
From the plot it appears that the amount of CO trapped/converted increases cycle by cycle, as suggested by the increasing length of the adsorption phase (84.6 s; 107.15 s; 462.15 s).
The site concentrations as functions of time during the cycles are shown in Figure 14d as well. Excluding the first adsorption phase, θ6 (i.e., reduced ceria sites) steadily decreases cycle by cycle, while oxidized ceria sites (θ5) and surface carbonates (θ3) increase on average, thus suggesting that CO2 buffering on the surface improves the oxygen storage capacity of the catalyst. Accordingly, the fraction of reduced copper sites (θ4) is low.
In order to improve the catalyst regeneration, we changed the time length of the oxidation phase. In Figure 15, the trap simulation results are shown in terms of CO and CO2 concentrations and site distribution as calculated by assuming a double oxidation phase duration (200 s), stopping the adsorption phase when CO concentration reaches 100 ppm as before. Under these conditions, CO adsorption can last more than the oxidation phase starting from the second cycle. This is due to a deeper re-oxidation of the copper sites (Figure 15d) and to the decrease of θ4 going down to zero at the end of each oxidation phase. As a consequence, the CO adsorbed/reacted and the CO2 formed can be the same at each cycle.
The above results suggest that by a proper choice of the regeneration (oxidation) time, the CO trap system could work with only two reactors operated under adsorption/oxidation conditions, as shown in Figure 1.
From the above results, it appears that the time required to reach 100 ppm is quite high (about 400 s) and that after about 200 s, CO fast reaches 85 ppm, then increasing very slowly up to 100 ppm. We then simulated the trap by fixing the time duration of both the adsorption and the oxidation phase at t = 200 s.
In Figure 16, the CO and CO2 concentrations are shown as functions of time as obtained by assuming the first cycle is stopped when CO reaches 100 ppm (about 85 s) and then by switching the feed composition every 200 s.
After a transient phase lasting about 1000 s (corresponding to three adsorption/oxidation cycles), a periodic stable (forced) regime is attained. CO concentration is oscillating between 10 and 85 ppm.
The site concentrations are plotted in Figure 16 as well. It is worth noting that the catalyst is stabilized in the oxidized form, θ4 and θ6 (reduced sites containing both copper and cerium and only cerium, respectively) being nearly zero. The high oxidation degree of ceria sites (θ5), oscillating between 0.8 and 0.95, thus behave as an oxygen reservoir for copper sites during the adsorption phase, promoting both CO adsorption and oxidation to CO2.
It should also be noted that, during the oxidation phase, a complete desorption of CO2 occurs (θ3 ≈ 0 in the oxidation phase). Conversely, CO is not completely oxidized, since θ2 is always higher than zero, even in the oxidation phase. From these results, we may conclude that the key step of the reaction mechanism at these operating conditions is the oxygen transfer from the Ce sites to the Cu sites (step 4).
It is worth noting that according to this trap operation, the valves switching time is 200 s for both phases, which is compatible with the process operation.
When switching from one feed to the other, unavoidable mixing can occur. In particular, when switching from the CO adsorption to the CO oxidation phase, hydrogen still present in the reactor may be mixed with the oxygen-containing stream generating a H2/O2/N2 mixture. This mixture represents a loss of H2 and it could in principle be flammable.
Likewise, when switching from the CO oxidation phase to the CO adsorption phase, a mixture of H2/O2/N2/CO is generated which cannot be fed to the fuel cell and represents a loss of H2.
In order to avoid incorrect feeding and H2 loss, it is crucial to optimize the delay time between the switch of the inlet/outlet valves of the two reactors of the process.
It should be said that immediately after switching, a H2/O2/N2/CO could be formed. In the chosen operating conditions (oxidizing stream containing 5% O2), this mixture is not flammable, the oxygen content being lower than the H2 minimum oxide concentration (MOC = 5%). In any case, this mixture may be generated from air by mixing the outlet steam (containing about 3.5% O2) with fresh air.

5. Conclusions

In this work, we proposed a novel approach for CO abatement in H2-rich streams to be fed to PEM fuel cells. The main concept is a dual-stage process operating with a copper/ceria based catalyst, consisting of a reactive adsorption phase, allowing for CO abatement under the PEM limits, and an oxidation phase, restoring the catalyst and converting the adsorbed CO into CO2. By this approach it should be possible to simultaneously get CO lower than the limiting value and avoid any H2 consumption with no O2 in the feed stream to the PEM. Parameters of a kinetic model including CO adsorption and oxidation to CO2, CO2 desorption, and catalyst re-oxidation by molecular oxygen, developed on the basis of previous results, were obtained from data of suitably programmed experimental tests. Experimental and model simulations are in good agreement, especially for the CO-reactive adsorption phase.
The simulations were performed at varying operating parameters. The results showed that high contact times and low CO inlet concentration are beneficial in order to obtain CO concentration lower than 100 ppm for long period, as expected. However, due to the non-linear behavior of the CO reactive adsorption, the effect is quantitatively different from that expected for a classical adsorption, in particular, the effect of contact time is more than linear, while that of CO inlet concentration is less than linear.
The simulations of the complete system, varying the time length of the oxidation phase (adsorption phase ending when CO at the outlet reaches 100 ppm followed by the oxidation phase), highlighted the importance of carrying out a deep oxidation in order to fully regenerate the material, restoring the initial oxidation state. Even if CO2 buffering on the catalyst causes an increase of the mean oxidation state, related to larger and larger adsorption phase duration, by a proper choice of the duration of the oxidation phase, conditions to operate always under the target exit CO concentration (100 ppm) can be found. Consequently, a suitable equal time length can be chosen for the two phases in order to synchronize them and assure a cyclic operation which could be carried out by using only two reactors (one acting as adsorber, the other in regeneration). In this work, we chose 200 s as working time and demonstrated that a stable periodic operation was achieved.

Author Contributions

G.L., A.D.B. and L.L. conceived and designed the experiments and the simulations; G.L. and L.L. performed the experiments; A.D.B. developed the model and performed the simulations; G.L., A.D.B. and L.L. analyzed the data; G.L., A.D.B. and L.L. wrote the paper.

Acknowledgments

The present work was financially supported by MIUR (Italy) under FIRB projects (project code: RBFR10S4OW—Novel catalytic systems for H2-rich streams purification).

Conflicts of Interest

The authors declare no conflict of interest.

References

  1. Recupero, V.; Pino, L.; Vita, A.; Cipitì, F.; Cordaro, M.; Laganà, M. Development of a LPG fuel processor for PEFC systems: Laboratory scale evaluation of autothermal reforming and preferential oxidation subunits. Int. J. Hydrogen Energy 2005, 30, 963–971. [Google Scholar] [CrossRef]
  2. Pan, L.; Wang, S. A compact integrated fuel-processing system for proton exchange membrane fuel cells. Int. J. Hydrog. Energy 2006, 31, 447–454. [Google Scholar] [CrossRef]
  3. Men, Y.; Kolb, G.; Zapf, R.; Tiemann, D.; Wichert, M.; Hessel, V.; Lowe, H. A complete miniaturized microstructured methanol fuel processor/fuel cell system for low power applications. Int. J. Hydrogen Energy 2008, 33, 1374–1382. [Google Scholar] [CrossRef]
  4. Oliva, D.G.; Francesconi, J.A.; Mussati, M.C.; Aguirre, P.A. Energy efficiency analysis of an integrated glycerin processor for PEM fuel cells: Comparison with an ethanol-based system. Int. J. Hydrogen Energy 2010, 35, 709–724. [Google Scholar] [CrossRef]
  5. Di Bona, D.; Jannelli, E.; Minutillo, M.; Perna, A. Investigations on the behaviour of 2kW natural gas fuel processor. Int. J. Hydrogen Energy 2011, 36, 7763–7770. [Google Scholar] [CrossRef]
  6. Ji, H.; Bae, J.; Cho, S.; Kang, I. Start-up strategy and operational tests of gasoline fuel processor for auxiliary power unit. Int. J. Hydrogen Energy 2015, 40, 4101–4110. [Google Scholar] [CrossRef]
  7. Yan, C.; Hai, H.; Guo, C.; Li, W.; Huang, S.; Chen, H. Hydrogen production by steam reforming of dimethyl ether and CO-PrOx in a metal foam micro-reactor. Int. J. Hydrogen Energy 2014, 39, 10409–10416. [Google Scholar] [CrossRef]
  8. Engelhardt, P.; Maximini, M.; Beckmann, F.; Brenner, M.; Moritz, O. Coupled operation of a diesel steam reformer and an LT- and HT-PEFC. Int. J. Hydrogen Energy 2014, 39, 18146–18153. [Google Scholar] [CrossRef]
  9. Trimm, D.L.; Önsan, Z.I. Onboard Fuel Conversion for Hydrogen-Fuel-Cell-Driven Vehicles. Catal. Rev. Sci. Eng. 2001, 43, 31–84. [Google Scholar] [CrossRef]
  10. Zhao, Z.; Lin, X.; Jin, R.; Dai, Y.; Wang, G. High catalytic activity in CO PROX reaction of low cobalt-oxide loading catalysts supported on nano-particulate CeO2–ZrO2 oxides. Catal. Commun. 2011, 12, 1448–1451. [Google Scholar] [CrossRef]
  11. López, I.; Valdés-Solís, T.; Marbán, G. An attempt to rank copper-based catalysts used in the CO-PROX reaction. Int. J. Hydrogen Energy 2008, 33, 197–205. [Google Scholar] [CrossRef]
  12. Lukashuk, L.; Föttinger, K.; Kolar, E.; Rameshan, C.; Teschner, D.; Hävecker, M.; Knop-Gericke, A.; Yigit, N.; Li, H.; McDermotta, E. Operando XAS and NAP-XPS studies of preferential CO oxidation on Co3O4 and CeO2-Co3O4 catalysts. J. Catal. 2016, 344, 1–15. [Google Scholar] [CrossRef]
  13. Martinez-Arias, A.; Fernandez-Garcia, M.; Galvez, O.; Coronado, J.M.; Anderson, J.A.; Conesa, J.C.; Munuera, S.G. Comparative study on redox properties and catalytic behavior for CO oxidation of CuO/CeO2 and CuO/ZrCeO4 catalysts. J. Catal. 2000, 195, 207–216. [Google Scholar] [CrossRef]
  14. Sedmak, G.; Hočevar, S.; Levec, J. Kinetics of selective CO oxidation in excess of H2 over the nanostructured Cu0.1Ce0.9O2-y catalyst. J. Catal. 2003, 213, 135–150. [Google Scholar] [CrossRef]
  15. Caputo, T.; Lisi, L.; Pirone, R.; Russo, G.; Ii, F. Kinetics of the Preferential Oxidation of CO over CuO/CeO2 Catalysts in H2-Rich. Ind. Eng. Chem. Res. 2007, 46, 6793–6800. [Google Scholar] [CrossRef]
  16. Martínez-Arias, A.; Hungría, A.B.; Fernández-García, M.; Conesa, J.C.; Munuera, G. Preferential oxidation of CO in a H2-rich stream over CuO/CeO2 and CuO/(Ce,M)Ox (M = Zr, Tb) catalysts. J. Power Sources 2005, 151, 32–42. [Google Scholar] [CrossRef]
  17. Martínez-Arias, A.; Hungría, A.B.; Munuera, G.; Gamarra, D. Preferential oxidation of CO in rich H2 over CuO/CeO2: Details of selectivity and deactivation under the reactant stream. Appl. Catal. B Environ. 2006, 65, 207–216. [Google Scholar] [CrossRef]
  18. Moretti, E.; Lenarda, M.; Riello, P.; Storaro, L.; Talon, A.; Frattini, R.; Reyes-Carmon, A.; Jiménez-López, A.; Rodríguez-Castellón, E. Influence of synthesis parameters on the performance of CeO2-CuO and CeO2-ZrO2-CuO systems in the catalytic oxidation of CO in excess of hydrogen. Appl. Catal. B Environ. 2013, 129, 556–565. [Google Scholar] [CrossRef]
  19. Avgouropoulos, G.; Ioannides, T.; Matralis, H. Influence of the preparation method on the performance of CuO-CeO2 catalysts for the selective oxidation of CO. Appl. Catal. B Environ. 2005, 56, 87–93. [Google Scholar] [CrossRef]
  20. Liu, Z.; Zhou, R.; Zheng, X. Influence of rare-earth metal doping on the catalytic performance of CuO-CeO2 for the preferential oxidation of CO in excess hydrogen. J. Nat. Gas. Chem. 2008, 17, 283–287. [Google Scholar] [CrossRef]
  21. Reddy, L.H.; Reddy, G.K.; Devaiah, D.; Reddy, B.M. A rapid microwave-assisted solution combustion synthesis of CuO promoted CeO2-MxOy (M = Zr, La, Pr and Sm) catalysts for CO oxidation. Appl. Catal. A Gen. 2012, 445-446, 297–305. [Google Scholar] [CrossRef]
  22. Avgouropoulos, G.; Ioannides, T.; Matralis, H.K.; Batista, J.; Hocevar, S. CuO–CeO2 mixed oxide catalysts for the selective oxidation of carbon monoxide in excess hydrogen. Catal. Lett. 2001, 73, 33–40. [Google Scholar] [CrossRef]
  23. Zou, H.; Dong, X.; Lin, W. Selective CO oxidation in hydrogen-rich gas over CuO/CeO2 catalysts. Appl. Surf. Sci. 2006, 253, 2893–2898. [Google Scholar] [CrossRef]
  24. Avgouropoulos, G.; Ioannides, T. Selective CO oxidation over CuO-CeO2 catalysts prepared via the urea–nitrate combustion method. Appl. Catal. A Gen. 2003, 244, 155–167. [Google Scholar] [CrossRef]
  25. Gurbani, A.; Ayastuy, J.L.; González-Marcos, M.P.; Gutiérrez-Ortiz, M.A. CuO-CeO2 catalysts synthesized by various methods: Comparative study of redox properties. Int. J. Hydrogen Energy 2010, 35, 11582–11590. [Google Scholar] [CrossRef]
  26. Marban, G.; Fuertes, A.B. Highly active and selective CuOx/CeO2 catalyst prepared by a single-step citrate method for preferential oxidation of carbon monoxide. Appl. Catal. B Environ. 2005, 57, 43–53. [Google Scholar] [CrossRef]
  27. Barbato, P.S.; Colussi, S.; Di Benedetto, A.; Landi, G.; Lisi, L.; Llorca, J.; Trovarelli, A. Origin of High Activity and Selectivity of CuO/CeO2 Catalysts Prepared by Solution Combustion Synthesis in CO-PROX Reaction. J. Phys. Chem. C 2016, 120, 13039–13048. [Google Scholar] [CrossRef]
  28. Landi, G.; Di Benedetto, A.; Colussi, S.; Barbato, P.S.; Lisi, L. Effect of carbon dioxide and water on the performances of an iron-promoted copper/ceria catalyst for CO preferential oxidation in H2-rich streams. Int. J. Hydrogen Energy 2016, 41, 7332–7341. [Google Scholar] [CrossRef]
  29. Barbato, P.S.; Colussi, S.; Di Benedetto, A.; Landi, G.; Lisi, L.; Llorca, J.; Trovarelli, A. CO preferential oxidation under H2-rich streams on copper oxide supported on Fe promoted CeO2. Appl. Catal. A Gen. 2015, 506, 268–277. [Google Scholar] [CrossRef]
  30. Wang, W.-W.; Du, P.-P.; Zou, S.-H.; He, H.-Y.; Wang, R.-X.; Jin, Z.; Shi, S.; Huang, Y.-Y.; Si, S.; Song, Q.-S. Highly Dispersed Copper Oxide Clusters as Active Species in Copper-Ceria Catalyst for Preferential Oxidation of Carbon Monoxide. ACS Catal. 2015, 5, 2088–2099. [Google Scholar] [CrossRef]
  31. Elias, J.S.; Artrith, N.; Bugnet, M.; Giordano, L.; Botton, G.A.; Kolpak, A.M.; Yang, S.H. Elucidating the Nature of the Active Phase in Copper/Ceria Catalysts for CO Oxidation. ACS Catal. 2016, 6, 1675–1679. [Google Scholar] [CrossRef]
  32. Davó-Quiñonero, A.; Navlani-García, M.; Lozano-Castelló, D.; Bueno-López, A.; Anderson, J.A. Role of Hydroxyl Groups in the Preferential Oxidation of CO over Copper Oxide-Cerium Oxide Catalysts. ACS Catal. 2016, 6, 1723–1731. [Google Scholar] [CrossRef] [Green Version]
  33. Lee, H.C.; Kim, D.H. Kinetics of CO and H2 oxidation over CuO-CeO2 catalyst in H2 mixtures with CO2 and H2O. Catal. Today 2008, 132, 109–116. [Google Scholar] [CrossRef]
  34. Di Benedetto, A.; Landi, G.; Lisi, L.; Russo, G. Role of CO2 on CO preferential oxidation over CuO/CeO2 catalyst. Appl. Catal. B Environ. 2013, 142-143, 169–177. [Google Scholar] [CrossRef]
  35. Wang, J.B.; Lin, S.C.; Huang, T.J. Selective CO oxidation in rich hydrogen over CuO/samaria-doped ceria. Appl. Catal. A Gen. 2002, 232, 107–120. [Google Scholar] [CrossRef]
  36. Chuang, C.; Chen, Y.; Ward, J.; Yu, C.; Liu, Y.; Lee, C. Optimal design of an experimental methanol fuel reformer. Int. J. Hydrogen Energy 2008, 33, 7062–7073. [Google Scholar] [CrossRef]
  37. Dudÿeld, C.D.; Chen, R.; Adcock, P.L. A carbon monoxide PROX reactor for PEM fuel cell automotive application. Int. J. Hydrogen Energy 2001, 26, 763–775. [Google Scholar] [CrossRef]
  38. Northrop, W.F.; Choi, S.O.; Thompson, L.T. Thermally integrated fuel processor design for fuel cell applications. Int. J. Hydrogen Energy 2012, 37, 3447–3458. [Google Scholar] [CrossRef]
  39. Cipitì, F.; Pino, L.; Vita, A.; Laganà, M.; Recupero, V. Experimental investigation on a methane fuel processor for polymer electrolyte fuel cells. Int. J. Hydrogen Energy 2013, 38, 2387–2397. [Google Scholar] [CrossRef]
  40. Ayastuy, J.L.; Gurbani, A.; González-Marcos, M.P.; Gutiérrez-Ortiz, M.A. Selective CO oxidation in H2 streams on CuO/CexZr1−xO2 catalysts: Correlation between activity and low temperature reducibility. Int. J. Hydrogen Energy 2012, 37, 1993–2006. [Google Scholar] [CrossRef]
  41. Sirichaiprasert, K.; Luengnaruemitchai, A.; Pongstabodee, S. Selective oxidation of CO to CO2 over Cu-Ce-Fe-O composite-oxide catalyst in hydrogen feed stream. Int. J. Hydrogen Energy 2007, 32, 915–926. [Google Scholar] [CrossRef]
  42. Lendzion-Bielun, Z.; Bettahar, M.M.; Monteverdi, S. Fe-promoted CuO/CeO2 catalyst: Structural characterization and CO oxidation activity. Catal. Commun. 2010, 11, 1137–1142. [Google Scholar] [CrossRef]
  43. Zou, H.; Chen, S.; Liu, Z.; Lin, W. Selective CO oxidation over CuO-CeO2 catalysts doped with transition metal oxides. Powder Technol. 2011, 207, 238–244. [Google Scholar] [CrossRef]
  44. Kydd, R.; Ferri, D.; Hug, P.; Scott, J.; Teoh, W.Y.; Amal, R. Temperature-induced evolution of reaction sites and mechanisms during preferential oxidation of CO. J. Catal. 2011, 277, 64–71. [Google Scholar] [CrossRef]
  45. Zhang, Q.; Shore, L.; Farrauto, R.J. Selective CO oxidation over a commercial PROX monolith catalyst for hydrogen fuel cell applications. Int. J. Hydrogen Energy 2012, 37, 10874–10880. [Google Scholar] [CrossRef]
  46. Caputo, T.; Lisi, L.; Pirone, R.; Russo, G. On the role of redox properties of CuO/CeO2 catalysts in the preferential oxidation of CO in H2-rich gases. Appl. Catal. A Gen. 2008, 348, 42–53. [Google Scholar] [CrossRef]
  47. Gamarra, D.; Munuera, G.; Hungría, A.B.; Fernández-García, M.; Conesa, J.C.; Midgley, P.A.; Wang, X.Q.; Hanson, J.C.; Rodríguez, J.A.; Martínez-Arias, A. Structure-activity relationship in nanostructured copper-ceria-based preferential CO oxidation catalysts. J. Phys. Chem C 2007, 111, 11026–11038. [Google Scholar] [CrossRef]
  48. Di Benedetto, A.; Landi, G.; Lisi, L. CO reactive adsorption at low temperature over CuO/CeO2 structured catalytic monolith. Int. J. Hydrogen Energy 2017. [Google Scholar] [CrossRef]
  49. Landi, G.; Barbato, P.S.; Di Benedetto, A.; Lisi, L. Optimization of the preparation method of CuO/CeO2 structured catalytic monolith for CO preferential oxidation in H2-rich streams. Appl. Catal. B Environ. 2016, 181, 727–737. [Google Scholar] [CrossRef]
  50. Barbato, P.S.; Di Benedetto, A.; Landi, G.; Lisi, L. CuO/CeO2 based monoliths for CO preferential oxidation in H2-rich streams. Chem. Eng. J. 2015, 279, 983–993. [Google Scholar] [CrossRef]
  51. Arango-Díaz, A.; Cecilia, J.A.; Dos Santos-Gómez, L.; Marrero-López, D.; Losilla, E.R.; Jiménez-Jiménez, J.; Rodríguez-Castellóna, E. Characterization and performance in preferential oxidation of CO of CuO-CeO2 catalysts synthesized using polymethyl metacrylate (PMMA) as template. Int. J. Hydrogen Energy 2015, 40, 11254–11260. [Google Scholar] [CrossRef]
  52. Moreno, M.; Bergamini, L.; Baronetti, G.T.; Laborde, M.A.; Mariño, F.J. Mechanism of CO oxidation over CuO/CeO2 catalysts. Int. J. Hydrogen Energy 2010, 35, 5918–5924. [Google Scholar] [CrossRef]
  53. Kanervo, J.M.; Keskitalo, T.J.; Slioor, R.I.; Krause, A.O.I. Temperature-programmed desorption as a tool to extract quantitative kinetic or energetic information for porous catalysts. J. Catal. 2006, 238, 382–393. [Google Scholar] [CrossRef]
Figure 1. Block flow diagram (BFD) of the process. FP: Fuel Processor; PEM: proton exchange membrane. Red solid lines represent gases flowing from the FP going to rector containing fresh/regenerated catalyst; blue dashed lines represent air flowing to reactor containing catalysts after CO adsorption.
Applsci 08 00789 g001
Figure 2. Outline of the lab experiment.
Applsci 08 00789 g002
Figure 3. CO (black line) and CO2 (red line) concentrations and temperature as function of time during segment 1 (a), 2 (b) and 3 (c).
Applsci 08 00789 g003
Figure 4. Scheme of the reactor network. R: catalytic reactor; T: reactor-analyzer connection tube.
Applsci 08 00789 g004
Figure 5. Experimental (dashed lines) and model (solid lines) CO and CO2 concentrations (a) and CO reaction rate (b) as a function of time during the adsorption. Site concentrations (c) as a function of time during the adsorption. T = 55 °C, COin = 5000 ppm (ϑi = fraction of site i).
Applsci 08 00789 g005
Figure 6. Experimental (solid lines) and model (dashed lines) CO and CO2 concentrations as a function of time during the oxidation. T = 55 °C, COin = 0 ppm, O2in = 5 vol.%.
Applsci 08 00789 g006
Figure 7. CO (a) and CO2 (b) outlet concentrations versus time at different values of the residence time (model results). COin = 5000 ppm; T = 55 °C.
Applsci 08 00789 g007
Figure 8. Time at which CO outlet concentration is equal to 100 ppm as a function of the reactor residence time, τ1. COin = 5000 ppm; T = 55 °C.
Applsci 08 00789 g008
Figure 9. CO (a) and CO2 (b) outlet concentrations versus time at different values of the CO inlet concentration (model results). τ = 95 s; T = 55 °C.
Applsci 08 00789 g009
Figure 10. Time at which CO outlet concentration is equal to 100 ppm as function of CO inlet concentration. The dashed line represents the time at which CO outlet concentration is equal to 100 ppm in the case of non-reactive adsorption (Ri = 0).
Applsci 08 00789 g010
Figure 11. Site fraction concentrations (θi) as a function of time as computed at different values of the CO inlet concentration (reported on the curves of the top left figure). (Refer to Table 2 for the nature of sites corresponding to each θi).
Applsci 08 00789 g011
Figure 12. Plane residence time/CO inlet concentration, the bubble dimension is proportional to the time at which CO outlet concentration is equal to 100 ppm.
Applsci 08 00789 g012
Figure 13. CO2 (a) and CO (b) outlet concentration and site concentrations (c) as functions of time, complete trap simulation. τ1 = 95 s. Adsorption phase: COin = 5000 ppm and O2in = 0. Oxidation phase: COin = 0; O2in = 5 vol.%.
Applsci 08 00789 g013
Figure 14. CO2 (a) and CO (b) concentrations and site concentrations (Cu-containing (c) and ceria (d) sites) as functions of time, complete trap simulation. τ1 = 95 s. Adsorption phase: COin = 5000 ppm and O2in = 0. Oxidation phase: COin = 0; O2in = 5 vol %. Time duration of the oxidation phase = 100 s.
Applsci 08 00789 g014
Figure 15. CO2 (a) and CO (b) concentrations and site concentrations (Cu-containing (c) and ceria (d) sites) as functions of time, complete trap simulation. τ1 = 95 s. Adsorption phase: COin = 5000 ppm and O2in = 0. Oxidation phase: COin = 0; O2in = 5 vol %. Time duration of the oxidation phase = 200 s.
Applsci 08 00789 g015
Figure 16. CO2 (a) and CO (b) concentrations and site concentrations (Cu-containing (c) and ceria (d) sites) as functions of time, complete trap simulation. τ1 = 95 s. Adsorption phase: COin = 5000 ppm and O2in = 0. Oxidation phase: COin = 0; O2in = 5 vol %. Time duration of both the adsorption and oxidation phases = 200 s (first adsorption excluded).
Applsci 08 00789 g016
Table 1. CO consumed and CO2 formed in segments 1, 2 and 3.
MoleculeSegment 1Segment 2 (Isothermal)Segment 2 (Total)Segment 3
(mmol)
CO4.50 × 10−20.2 × 10−20.2 × 10−22.72 × 10⁻²
CO20.04 × 10−21.65 × 10−23.02 × 10−2-
Table 2. Nature of the sites reported in the mechanism 1–6.
Symbol of SiteNature of SiteSite Fraction Symbol
σ-O Cu 2 + O 2 Ce 4 + θ1
σ-O-CO Cu ( 2 δ ) + O 2 CO ( δ + ε ) + Ce ( 4 ε ) + θ2
σ’-O-CO2 CO 2 Ce 4 + O 2 Ce 4 + θ3
σ Cu + Ce 3 + θ4
σ’-O Ce 4 + O 2 Ce 4 + θ5
σ’ Ce 3 + Ce 3 + θ6
Table 3. Kinetic parameters of steps 1–4.
StepKinetic Constant (ki, 1/s)Activation Energy (Ei, J/K mol)
112030,000
−160,00033,000
210,00032,000
3600032,000
45025,000
Root mean square error (SRMSE) = 0.021
Table 4. Kinetic parameters of steps 5 and 6.
StepKinetic Constant (ki, (m3/mol)0.5 s)Activation Energy (Ei, J/K mol)
55021,000
6522,000
SRMSE = 0.35

