Abstract
As information technologies evolve, it has become necessary to examine the changes which have taken place in the top business scopes for both investors and entrepreneurs. To provide an understanding for the trends of the top business scopes in the current market, this article conducts a concurrent text and time series methodology to analyze the stocks in the New York Stock Exchange (NYSE) and the National Association of Securities Dealers Automated Quotations (NASDAQ) from 2012 to 2017. There is evidence that artificial intelligence and blockchains gained increasing importance for companies during that period. The authors contend that their findings in this paper question the status quo of promising business scopes for companies in the U.S. market.
1. Introduction
With the development of information technologies such as big data (BD), business intelligence (BI), and artificial intelligence (AI), the scopes of business for many companies have changed significantly. These developments have had a great impact on the strategies for traditional industries, as some new business scopes have become of interest. An interesting discovery is that although some companies share the same business scope, the industries involved vary. These findings have led researchers to focus more attention on business scopes, relegating important issues of participation to the background.
As computer science continues to evolve, it becomes meaningful to examine the changes taking place in the scopes of interest for businesses. As some works claim, a review of the daily news or annual financial reports is a reasonable approach to this. Findings will help the U.S. government to publish policies more closely aligned with demands of markets. Founders or operators of companies may gage areas of growth and potential needs for their business development planning based on these analyses. Finally, investors could use this data to base their investment choices on companies which have promising business scopes.
Google Finance makes rough judgments of whether two companies shared the same or similar business scopes. This judgment is made by domain experts. In theory, news text and expert judgments like those of Google Finance would reveal whether two companies have the same business scope. However, the influence of this scope remains uncertain. Time series comparison is a helpful method to complete the process of judgments, as researchers could carry out the clustering work of companies in a more convincing way by combining time-series data and text data.
From 2012 to 2017, popular business scopes were constantly changing with the development of new digital concepts. A significant issue is to identify the promising business scopes for the current U.S. market. To provide a reasonable approach to understanding the trends of the American market, this article uses sophisticated research methodology to identify such trends, with more processed data than prior studies. In this paper, the authors mainly focus on the companies in the New York Stock Exchange (NYSE) and the National Association of Securities Dealers Automated Quotations (NASDAQ). This article aimed to solve the following three questions:
- (1)
- What kind of business scopes are popular in the current U.S. market?
- (2)
- What key factors or specific productions show a promising development trend?
- (3)
- What business scopes are in alignment with U.S. market trends?
In this paper, authors offer a concurrent text and time series active learning algorithm to carry out the clustering work. This algorithm shows three main advantages compared to existing methods:
- (1)
- Use of text similarity to adjust the clustering results of numerical data, improving the clustering accuracy. Text similarity is used to evaluate the effectiveness of the clustering algorithm in most existing methods. In this paper, text similarity is directly used as a clustering index to carry out clustering work.
- (2)
- Active learning is introduced in the factor weight assignment stage. This method implies lower manpower costs, with lower time complexity.
- (3)
- Under this framework, more similarity measures can be introduced so that the clustering results more closely represent the actual situation, providing a better guiding effect with respect to the U.S. stock market.
The authors contend that the findings in this paper may provide a more comprehensive understanding of the current U.S. market in business scopes.
2. Literature Review
2.1. Company Business Scope Identification using BI
Studies of business intelligence (BI) as a research field are well documented in the literature. Each branch of a United States government agency conducts business analysis using its own methods and metrics, which are unknown and meaningless to other branches. The Standard Industrial Classification system (SIC) [1] was put forward to offer standardized and meaningful ways to measure business scopes. SIC codes are four-digit numerical representations of major businesses and industries. SIC codes are assigned based on common characteristics shared in the products, services, production, and the delivery system of a business. SIC codes have been available since 1939, but are being replaced by North American Industry Classification System (NAICS) codes [2]. The Global Industry Classifications Standard (GICS) system [3], jointly developed by Standard & Poor’s (S&P) and Morgan Stanley Capital International (MSCI), is gaining popularity among financial practitioners, while the Fama and French [4] algorithm was devised by academics. Global Industry Classifications Standard (GICS) classifications are significantly better at explaining stock return co-movements, as well as cross-sectional variations in valuation-multiples, forecasted and realized growth rates, R&D expenditures, and various key financial ratios. The advantages of GICS are consistent from year to year and are most pronounced among large firms. The International Standard Industrial Classification of All Economic Activities (ISIC), which was established and updated by United Nations (UN), is a widely adapted version of GICS at present.
Google Finance [5] approved and adopted a document which defines the company’s business scopes. When users open a certain link of stocks in the NASDAQ or NYSE, it will find a column of “Similar Stocks”, created and updated by Google Finance through company’s news, annual reports, and financial reports. Some important business scopes are identified, including the retailing, finance and banking, manufacturing, agriculture, information technology, energy, transport, and medical sectors. These identification labels were believed to help investors choose stocks or make decisions with necessary consideration of the company’s background.
However, among the existing classification systems, the standards provided by Google are slightly rough, and thus some industries cannot find corresponding classifications under this system. In addition, since the ISIC version is not updated, the existing ISIC lacks timeliness and the identification result is not satisfactory when it is used alone. By analyzing existing studies on the company’s business scopes identification among BI, the authors believe that there is a need to provide ISIC improvement based on the current U.S. market.
2.2. Analysis Methodology in Current U.S. Market Research
Text-based analysis is a frequent-used method in U.S. market research. Liao et al. [6] demonstrated a news-based stock clustering algorithm which was verified through the Taiwanese stock market. They made a codebook for defining the business scopes that include the agriculture, biology, medical, manufacturing, transport, energy, and information technology sectors. Kalczynski [7] introduced a temporal document retrieval model for business news archives; this model helps researchers cluster companies’ business scopes through different time intervals. With the development of information technologies, the company’s business scope could change every year or even every quarter of a year, and text-based market analysis can hardly adapt to such a rapidly changing market.
Indeed, the time series data of stocks, such as closing price, is believed to be highly related to the operation of a certain company. Fu [8] demonstrated a pattern discovery method in his paper. Using self-organizing maps, the authors could discover the pattern character of a stock series. Guo [9] carried out time series clustering experiments on stocks, and proved that the stock pairs with similar time series pattern also shared some similar business scopes. Cai [10] demonstrated a fuzzy time series forecasting model combined with ant colony optimization and auto-regression, which could be used to accelerate the efficiency of time-series based stock clustering.
Each new discovery in this area has introduced methodology based on previous studies. To discover stocks with similar movement in stock prices, Valitutti [11] demonstrated an algorithm assuming that similarity queries can be classified into certain categories. Wattenburg [12] introduced clustering arrangement in which neighboring stocks were as similar as possible. This algorithm prevented text from obscuring the structure of the diagram. Achananuparp [13] made an evaluation upon sentence similarity using the company’s annual report, and companies could be clustered more precisely in business scopes. Wang [14] built semantic kernels for text classification using Wikipedia data. This method was then widely used in text similarity analysis. Bushman [15] calculated a daily market return by summing the abnormal returns; these analysis considered a bank’s average text similarity and tail co-movement with all other banks. Since news may contain more information, also full of diverse expressions, Bushman’s method cannot be guaranteed in terms of validity.
The data mining and machine learning community have made a great efforts with respect to time-stamped data [16,17]. This is not surprising as time-stamped data is commonly seen in our daily lives. For example, many smart cities now monitor hourly traffic flow rate to better understand the traffic patterns [18]. The authors also monitor heights of ocean tides every day to understand the possible climate change. Analysts monitor daily closing prices of stocks to understand the market. Doctors monitor patients’ monthly weights to gain insights into the condition of the patient. It follows that the data mining tasks over this data aim to discover patterns and knowledge from the collected temporal sequences [19]. However, the patterns of time series data are usually influenced by other events that cannot be easily obtained or derived from the real-valued time series data. In order to better understand the behavior of time series data, the authors could incorporate some external knowledge, such as concurrent events. As an illustration, new iPhone release has had a significant impact on the stock prices of Apple Inc. (Cupertino, CA, USA) [20]. Specifically, analysts observed that, in the last few years, the stock of Apple has been driven by anticipation of the next iPhone release. Official news from Apple and rumors about the release of new iPhone greatly impact the stock prices of Apple Inc. https://investorplace.com/2017/07/how-does-apple-inc-aapl-stock-react-to-iphone-releases/#).
2.3. Related Works on the NASDAQ or NYSE
As the most common time series, the stock’s own volatility often reflects changes in the operating conditions of a company. In existing commercial works, stocks are clustered by a certain similarity calculation formula, and the stocks in the same cluster of clustering results are often considered to have similar trends in the nearby time period. Taking the study of the U.S. market as an example, there is a large number of studies on the NASDAQ and NYSE market stocks in the existing works. Bessler [21] used a listing cluster method to discover the benefits of German companies in the NASDAQ and NYSE. Spyrou [22] applied similar approach to discover sentiment changes, stock returns, and volatility from NYSE, American Express (AMEX), and NASDAQ stocks. Carrion [23] used the Dynamic Time Warping (DTW) algorithm to research high-frequency trading in NASDAQ, which contributed to the fast money research. Klock [24] demonstrated new ideas of time series clustering based on monthly features. Hu [25] carried out stock trading rule discovery with an evolutionary trend-following model.
It is clear to everyone that time series data is not independent; instead, it is often driven by other events which cannot be easily captured by real-value time series data [26]. Compared to real-valued time series data, textual information such as that found in news articles is much easier for humans to understand, and thus has significant impacts on our daily behavior, which in turn influences the time series data observed. Haldane [27] used annual reports of certain companies in NASDAQ to monitor operation states. Nguyen [28] explained the information asymmetry and accounting restatement in some NASDAQ and NYSE companies with the help of analysis on the daily news texts.
Among the existing NASDAQ and NYSE stock market studies, there are many studies on the clustering of stock price time series, and text analysis studies of company annual reports, news, while studies combining text information and time series information for analysis are lacking. In most existing studies, textual information and time-series information are processed separately. External textual information thus does not play its due role in the analysis of time series. This will lead to some differences between the time series clustering results and the actual situations, and the credibility of the conclusions based on the time series will therefore be reduced.
3. Method
3.1. Data Selection and Data Preprocessing
The data analyzed in this study is from the NASDAQ stock database and the NYSE stock database from 2012 to 2017. According to Cai’s [10] research, the NASDAQ and NYSE stock lists cover 70% of American companies. Although directly gathering data from companies may provide more representative data, this would also be very time-consuming.
The data source, however, shows a deviation between the end result of the study and the actual American market. For example, Cai’s work shows that NASDAQ stock covers a remarkably higher percentage of companies in the information technology (IT, 35%) and retailing (21%) sectors than the medical (11%) and biological (7%) [29] sectors. Another potential limitation is that news of certain companies posted on the website is more fully described. It is quite difficult to extract the truly relevant information from such news texts.
With a total of 87 NASDAQ stocks and 85 NYSE stocks, the text data includes 408,366 pieces of news from November 11th, 2012 to November 5th, 2017. In addition, every company is related to one stock and there is at least one piece of news of a certain company on a given market day. This news includes both brief and full-text news. The closing prices of each stock were regarded as numerical data, with 1200 market days in total and 1200 data points. As the first step in the analysis, Figure 1 shows the path and procedures of data processing. After discarding news not referring to information about business scopes, there were 403,112 pieces of news text left as the total of text data records analyzed directly in this study using statistical computing techniques. The full texts were all preprocessed further for text similarity calculations.
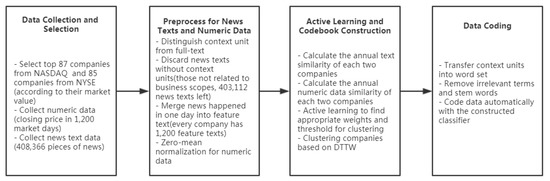
Figure 1.
Overview of data processing. NASDAQ: National Association of Securities Dealers Automated Quotations; NYSE: New York Stock Exchange; DTTW: Dynamic Time-Text Warping.
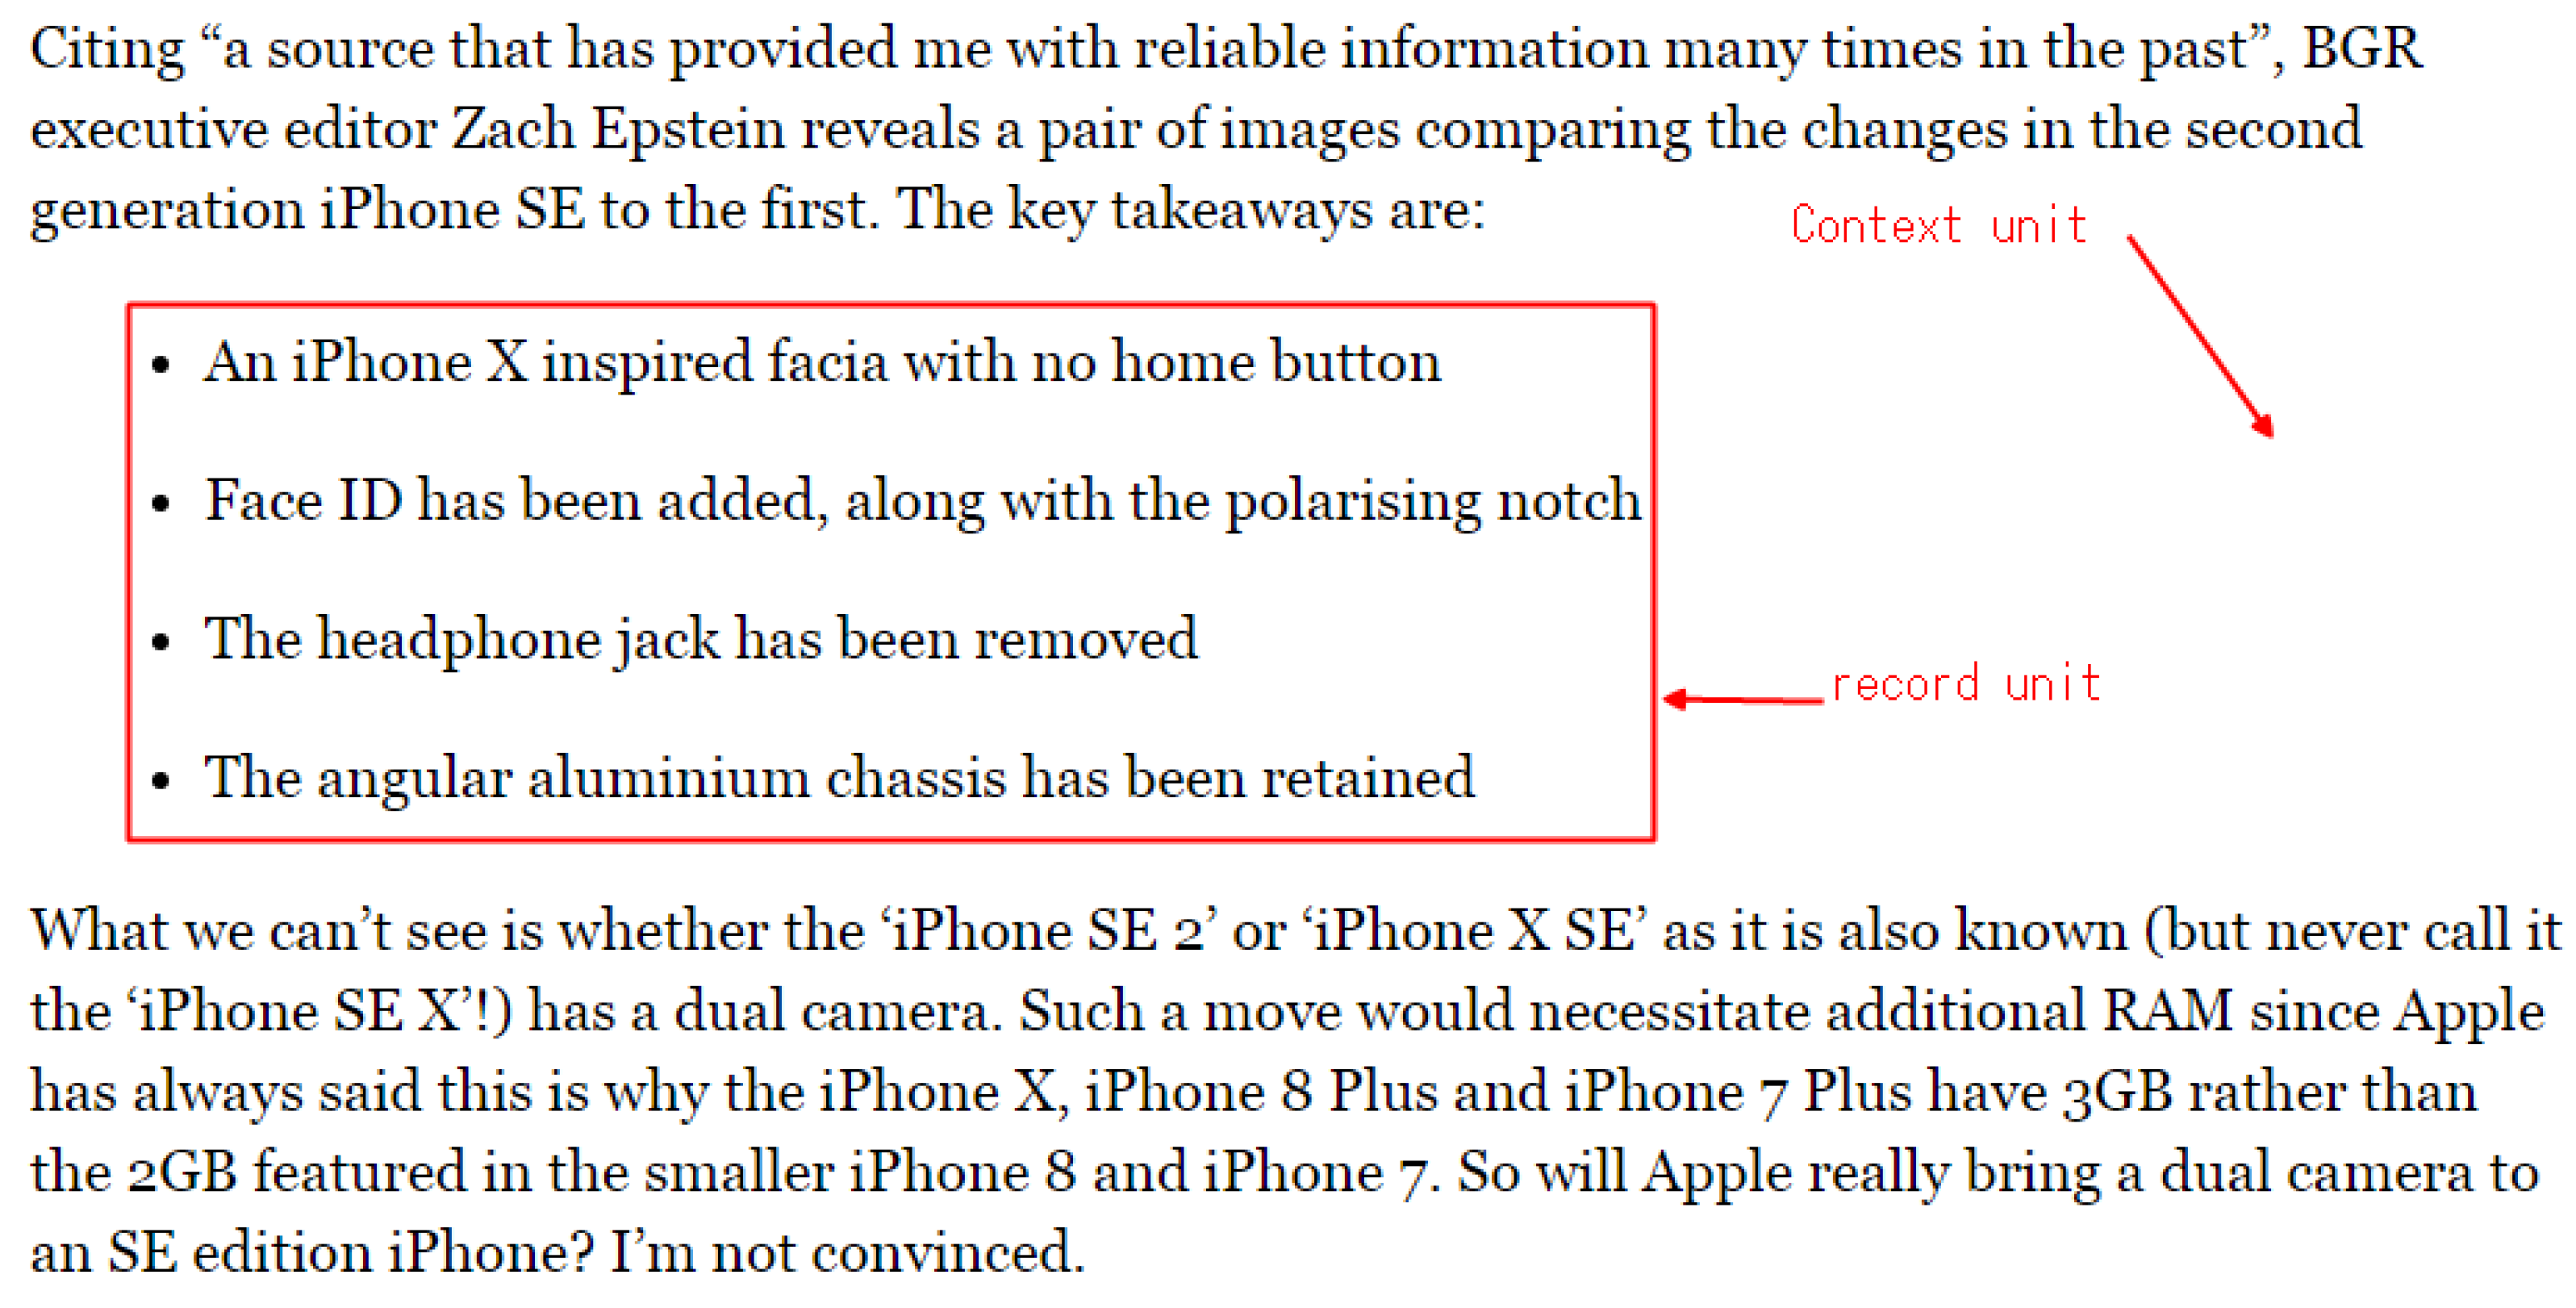
In the preprocessing stage, news texts and numeric data were processed separately. For the text, according to Krippendorf’s research [30], content analysis can be considered in three separate units: the sampling unit, context unit, and recording unit. In this study, the sampling unit has the full-text of all 408,366 pieces of news; the context unit has blocks related to companies’ business scopes; and the recording unit covers segments in context units, each of which is supposed to describe a kind of business scope. The example for context units and recording units is shown in Figure 2.
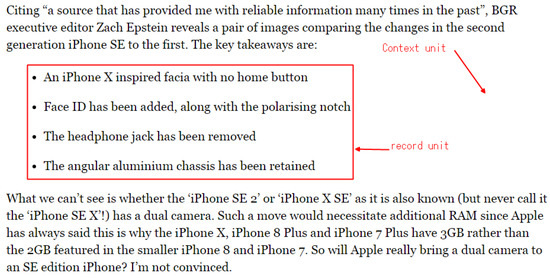
Figure 2.
Example of the context unit and the record unit.
Records of units without mentioning or relating to business scopes were removed, and 403,112 items of news were left. After that, every company in this study had at least one piece of news on a market day; some had more. For the consistency and convenience of text similarity calculation, authors merged record units of news which occurred on the same day of a certain company into one text file, which the authors named the “feature text”. In this way, every company in the 172 companies (87 NASDAQ, 85 NYSE) had one feature text for every market day, 1200 in total.
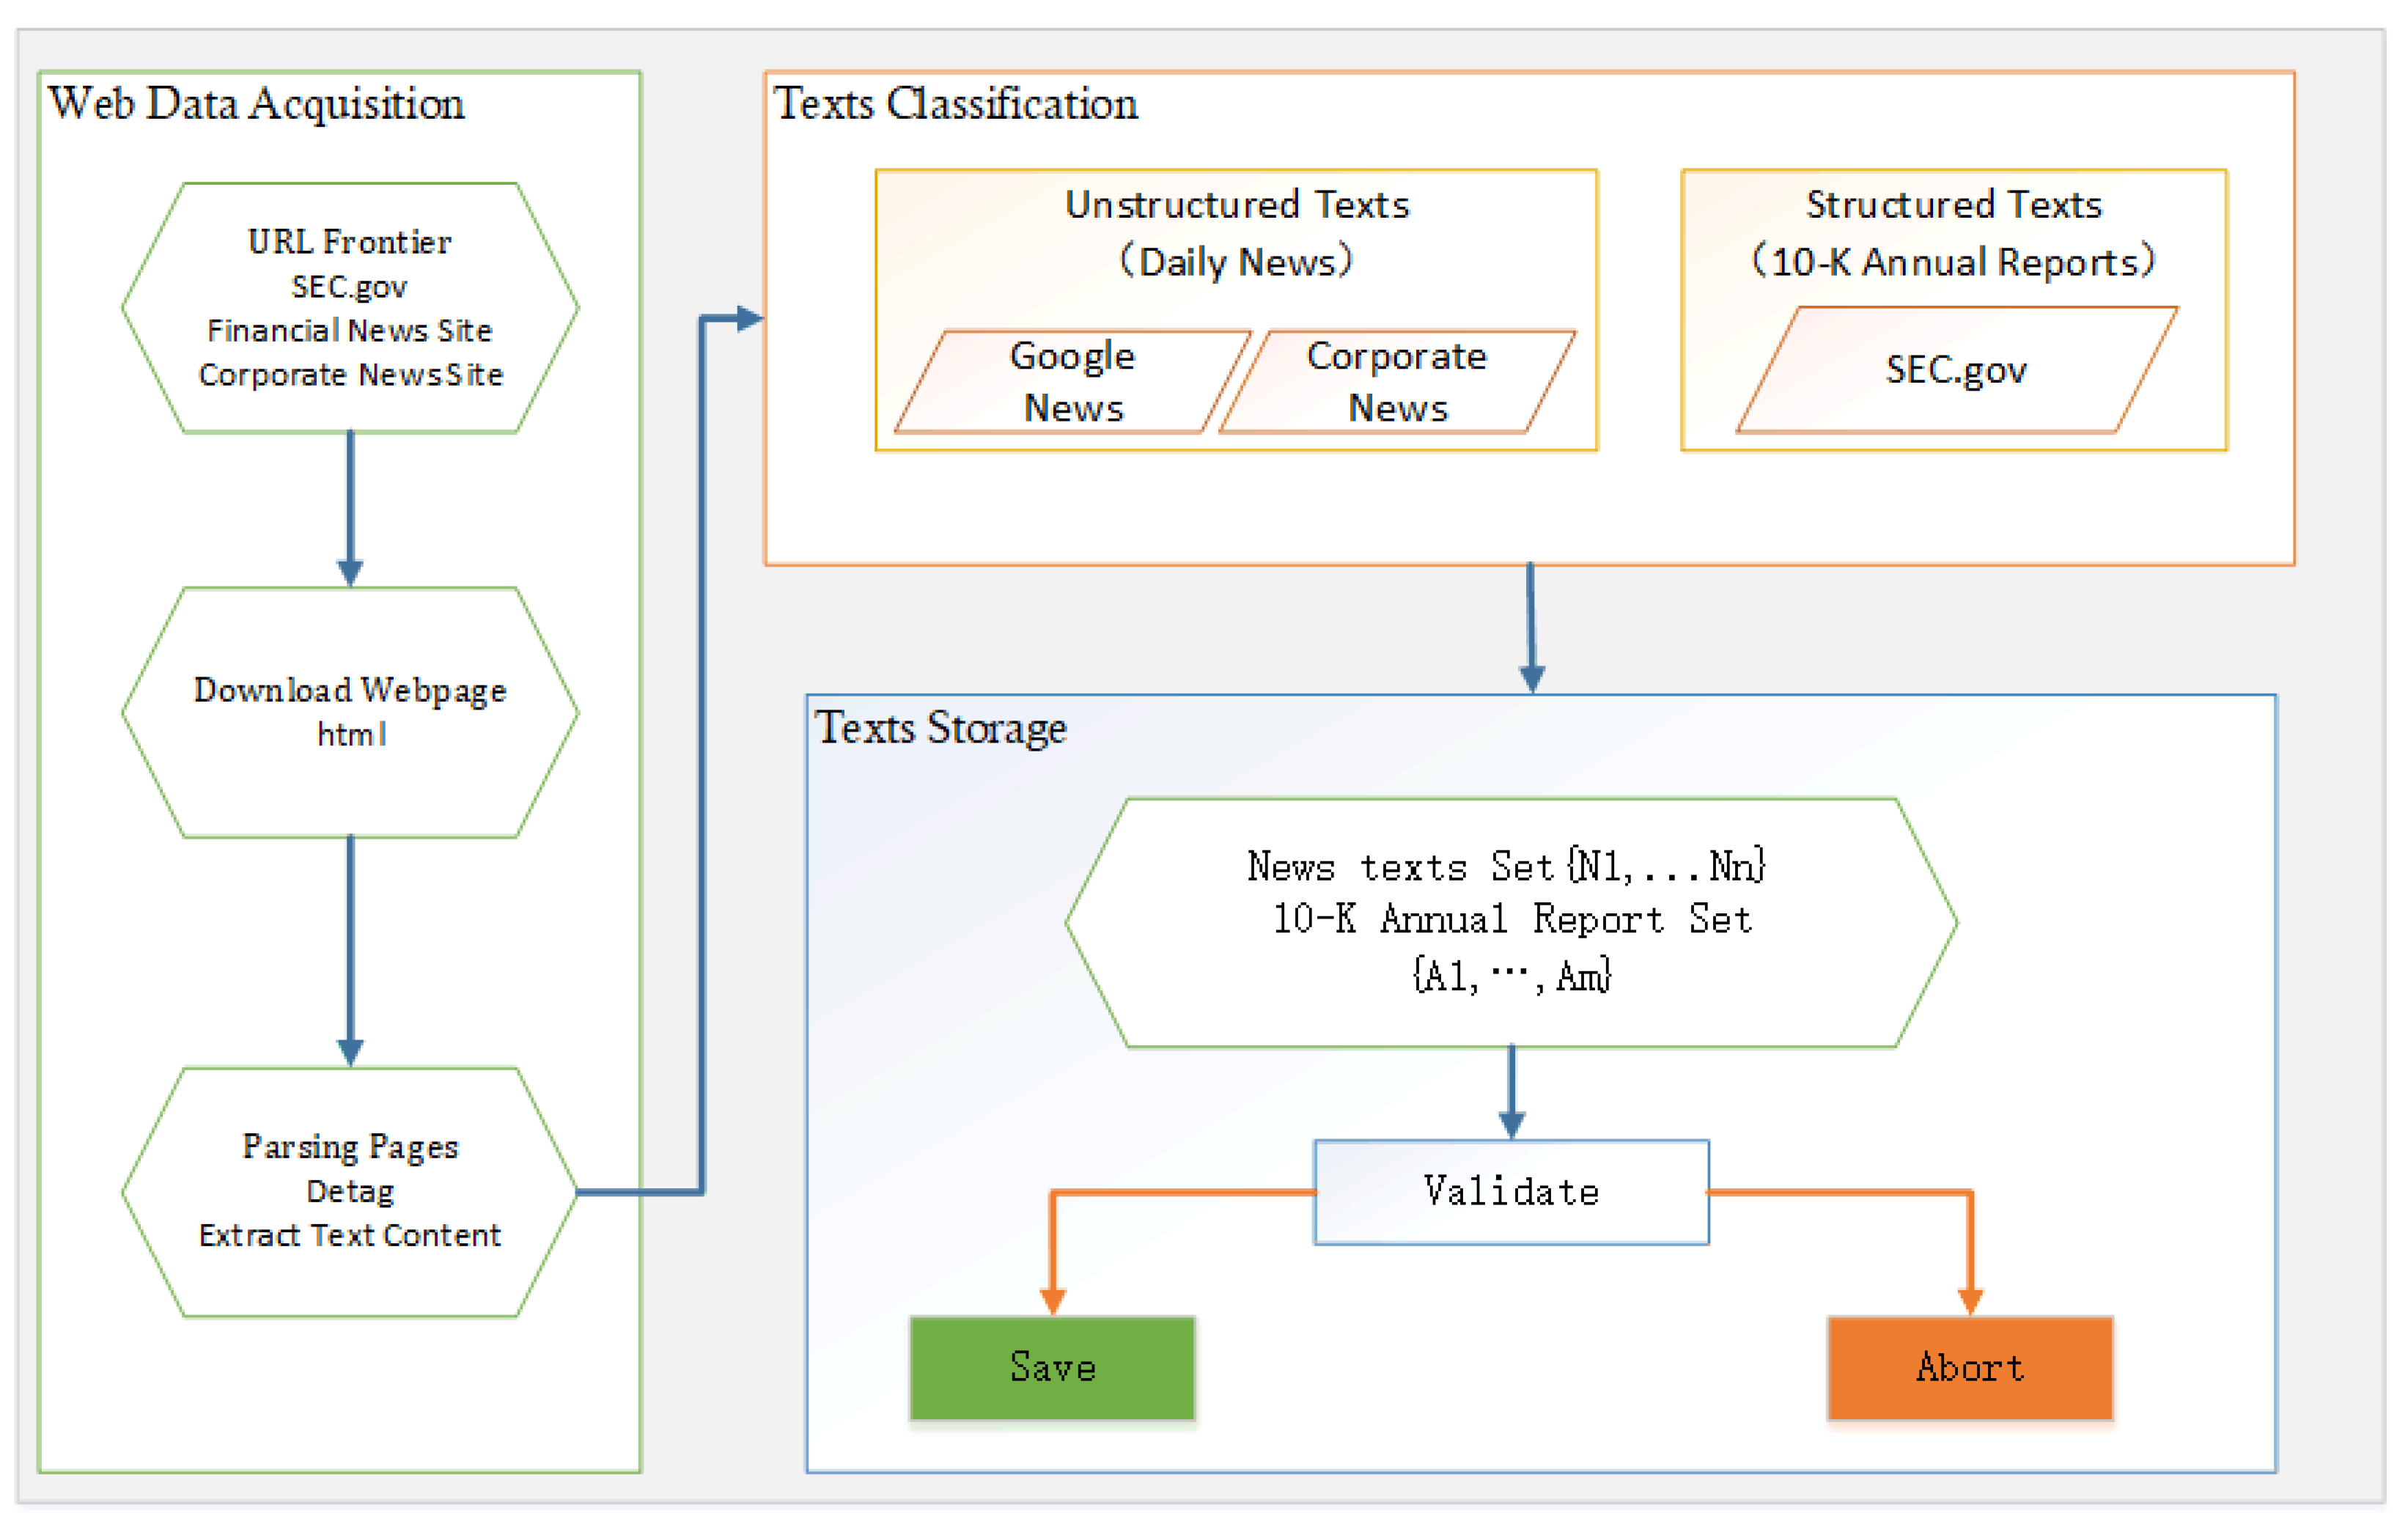
All news was obtained from Yahoo News and Google News, using a web crawler. The structure is shown in Figure 3. The web crawler contains three main parts: the web data acquisition part, the text classification part, and the text storage part. In the webpage data acquisition section, we downloaded the corresponding news page from SEC.gov, a financial news website, and a corporate news website. Then we parsed out text contents from these pages. In the text classification section, we divided the acquired text into structured texts and unstructured texts according to the source, so as to facilitate the subsequent preprocessing. Finally, in the text storage stage, the obtained texts were validated. The empty texts and garbled texts were removed and the valid texts were retained.
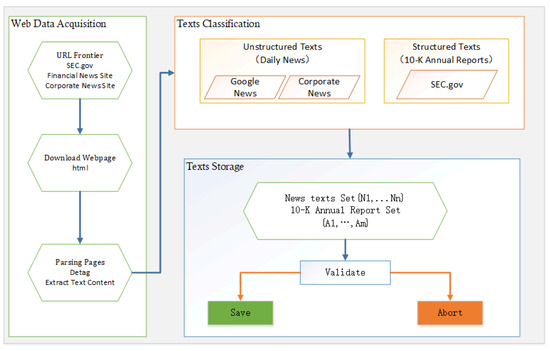
Figure 3.
Web crawler structure.
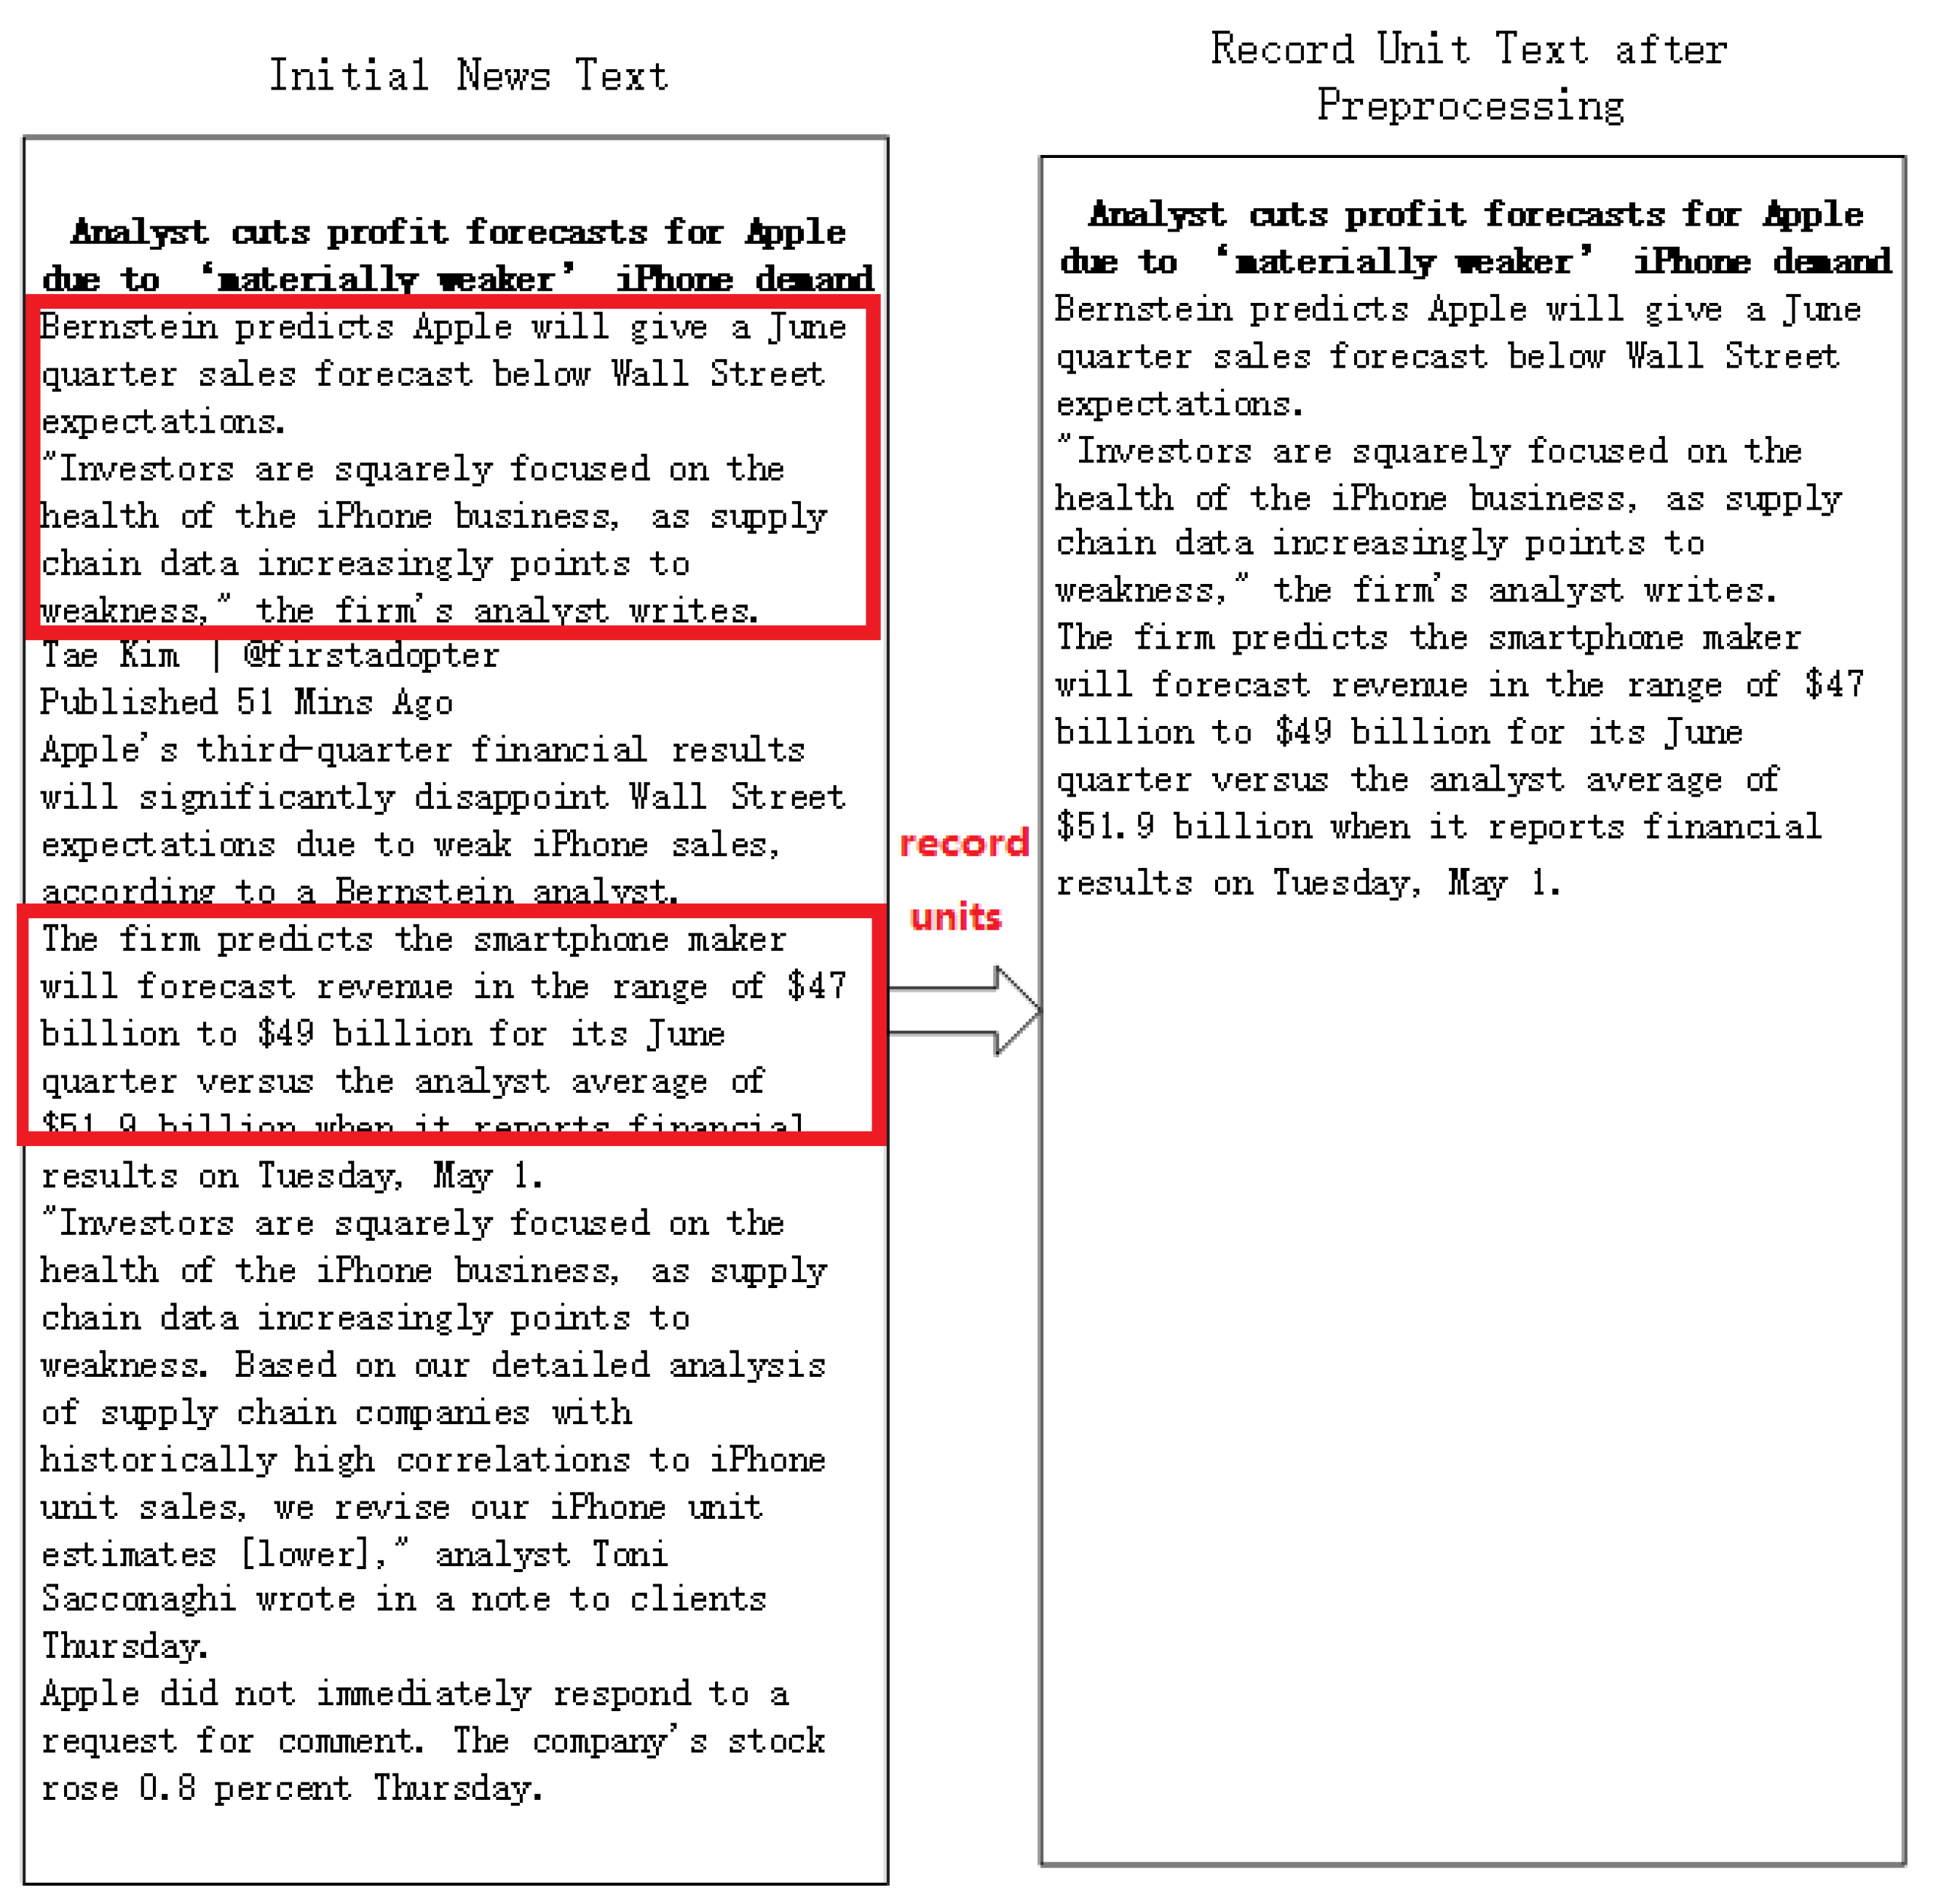
Figure 4 shows an example of initial news text and its record unit text after preprocessing. As is illustrated above, the context units refers to the contents of the body part of the news obtained, as shown in the left part of the Figure 4. Obviously, context units contain not only business-related content, but also a lot of weakly related content or irrelevant content. In the preprocessing phase, the authors remove irrelevant or weakly-related contents from the context units, and only retain textual paragraphs which are highly related to the business scopes. These textual paragraphs are also referred to as the recording units, as shown in the right side of the Figure 4. The size of the text is greatly decreased after preprocessing, without losing the information related to the business scopes in the original news. The time complexity of calculating the similarity of news text is decreased, and so is the required storage space at the same time.
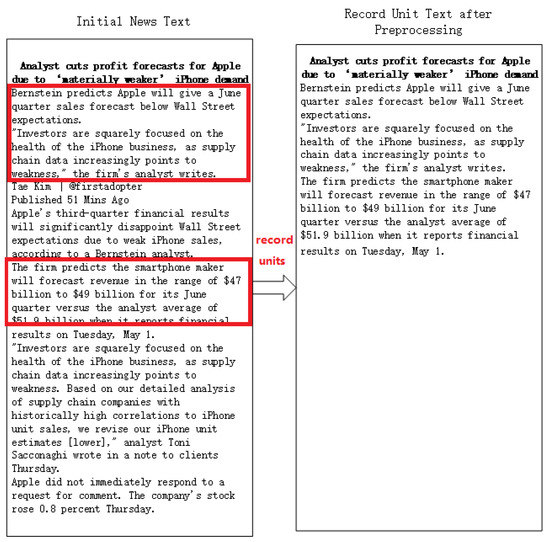
Figure 4.
An example of news text and its record unit text after preprocessing.
For the numerical data, since the stock prices of two different companies may change in quite different ranges, the closing prices of every stock were standardized through zero-mean normalization, as is shown in Equation (1). represents the standardized closing price in day i, represents the initial closing price in day i, represents the average closing price in this year, and represents the standard error in this year.
3.2. Distance Calculation Functions
In this part, the authors aim to learn a binary classifier f that, given two temporal observation sequences of stocks X and Y, determines whether or not X and Y are related stocks that share the same or similar business scopes. Astute readers may consider that it is a subjective task for determining if two stocks are related, which makes the evaluation of the learned model difficult. However, there is indeed a well-justified criteria for this task. In fact, both our evaluation and our labeling scheme are based on this criteria.
The U.S. Federal Securities Laws require public companies to disclose information on an ongoing basis (https://www.sec.gov/). For example, U.S. companies in the stock market must submit financial reports, for example, Form 10-K (i.e., annual reports) and Form 10-Q (i.e., quarterly reports). These reports contain accurate and timely information about the companies which submitted them. Among these reports, 10-K reports are particularly important because 10-K reports contain a large number of texts providing information related to different aspects of the companies (e.g., competitors, industry type, challenges, and lawsuits). As an illustration, IBM’s 10-K report in the year of 2017 mentioned that the company’s principal competitors included Alphabet Inc. (Google), Amazon.com, Inc. (Amazon) Cisco Systems, Inc. (Cisco), and so on (https://www.sec.gov/Archives/edgar/data/51143/000104746917001061/a2230222z10-k.htm). Therefore, a well-justified criteria for telling if two stocks X and Y are related is to see if their financial reports (e.g., 10-K and 10-Q) have overlapped descriptions, for example, the authors can confidently state that X and Y are related stocks if X’s report mentions Y as one of its competitors or vice versa. In this paper, the authors consider two stocks X and Y are related companies if one of the following conditions holds:
- (1)
- Either X or Y mention the other one as a competitor in their 10-K reports.
- (2)
- X and Y are in the same industry according to their 10-K reports.
- (3)
- X and Y are connected by lawsuit, contract, or acquisition according to their 10-K reports.
It is worth mentioning that the authors only consider 10-K reports, the filing date of which reflects the news data the authors collected for these stocks. Bearing the aforementioned criteria in mind, the authors then state the goal of this paper is to learn a classifier f that, given two temporal observations of stocks X and Y, returns 1 if the distance dist{X,Y} of X and Y is greater or equal to some threshold (e.g., ); it returns 0 otherwise (also see definition below).
Fundamental to the success of Equation 2 is the quality of the distance function dist{X,Y}. In this paper, the authors measure the distance between two stocks X and Y based on a distance function, which is called Dynamic Time-Text Warping (DTTW in short) motivated by DTW. The main idea of DTTW is to use a DTW-style distance function that takes into account both the numeric values (zero-nomalized closing prices sequences) and textual data (daily feature texts). Before giving the definition of DTTW, the authors first briefly introduce the DTW distance function for two items of temporal sequence data consisting of real values, and then describe how the authors adapt DTW to incorporate textual information.
Many distance measures have been proposed to compute the distances between two temporal sequences ([31,32,33,34]). Among these dozens of offerings, DTW has been proven to be an effective algorithm to compute the distance between two temporal data sequences, and it outperforms other alternatives in most domains [17,35]. Given two temporal sequences P and Q, both of which contain a sequence of real-valued data points, DTW aligns P and Q using the shortest warping path in a distance matrix, where a warping path W is a sequence of adjacent matrix indices that defines a match between P and Q. Given two temporal sequences, there is a large number of warping paths for them, and the optimal path is the one with lowest global warping cost [36].
To compute the global warping cost for two temporal sequences, one has to use some distance function to measure the local distance between every pair of data points from the two sequences X and Y in consideration. The choice of local distance function depends on the data type used in the sequence. A simple but effective method for computing local distance is Euclidean distance (ED). It is illustrated as below, given two data points and . The Euclidean distance between X and Y is defined as follows:
Although using Euclidean distance is an effective approach for computing the distance of two data points on a hyperplane, it is not an ideal way to compute the distance of two data points that contain non-real value elements. Notice that in our problem setting, the data points of a temporal stock data are composed by heterogeneous data items where each includes both a numeric element and a textual element. A desirable local distance function would be one that combines different local distance functions for each of the two data types. This motivates us to demonstrate DTTW in this paper.
Dynamic Time-Text Warping. DTTW uses the same idea as DTW. The only difference is the choice of local distance function for two data points. In our problem setting, the stock temporal sequence in consideration contains a sequence of data points of complex types. Specifically, in our setting, a temporal sequence of some stock X is a sequence of observations: , where is a binary tuple where represents the stock price of X at time i, and represents the textual information (i.e., corresponding financial news) observed at time i. A building block for computing the global distance for two stock temporal sequences with DTTW is to design a local distance function for a pair of data points of the aforementioned form. In this paper, the authors use the following local distance function in DTTW:
where and are two real-valued weight factors, is the distance function for numeric elements (e.g., Euclidean distance), and is some distance function measuring the distance between two textual data (e.g., distance based on cosine similarity for two bag-of-words feature vectors).
It is not hard to see that is a linear combination of two quantities: and . Two important questions remain to be answered. Firstly, what are the two distance functions and ? Secondly, what are the values for the two corresponding weight factors and ? It turns out the first question is easier and less important than the second one because there has been extensive study on how to design distance functions for different data types. For example, the authors can use Euclidean distance for the numeric elements and use cosine similarity to compute the distance of bag-of-words feature representations of textual documents (see definitions at Equations (4) and (5)). These two functions are widely accepted measures for these two different data types (see definition below).
where given two vectors and
Then, the important question is with respect to how to appropriately combine the two quantities. The authors propose use of active learning to learn the weight factors, from a small number of user labels, such as the resulting distance function used in Equation (2) that achieves high accuracy. The authors next describe our methodology in details.
3.3. Active Learning and Clustering
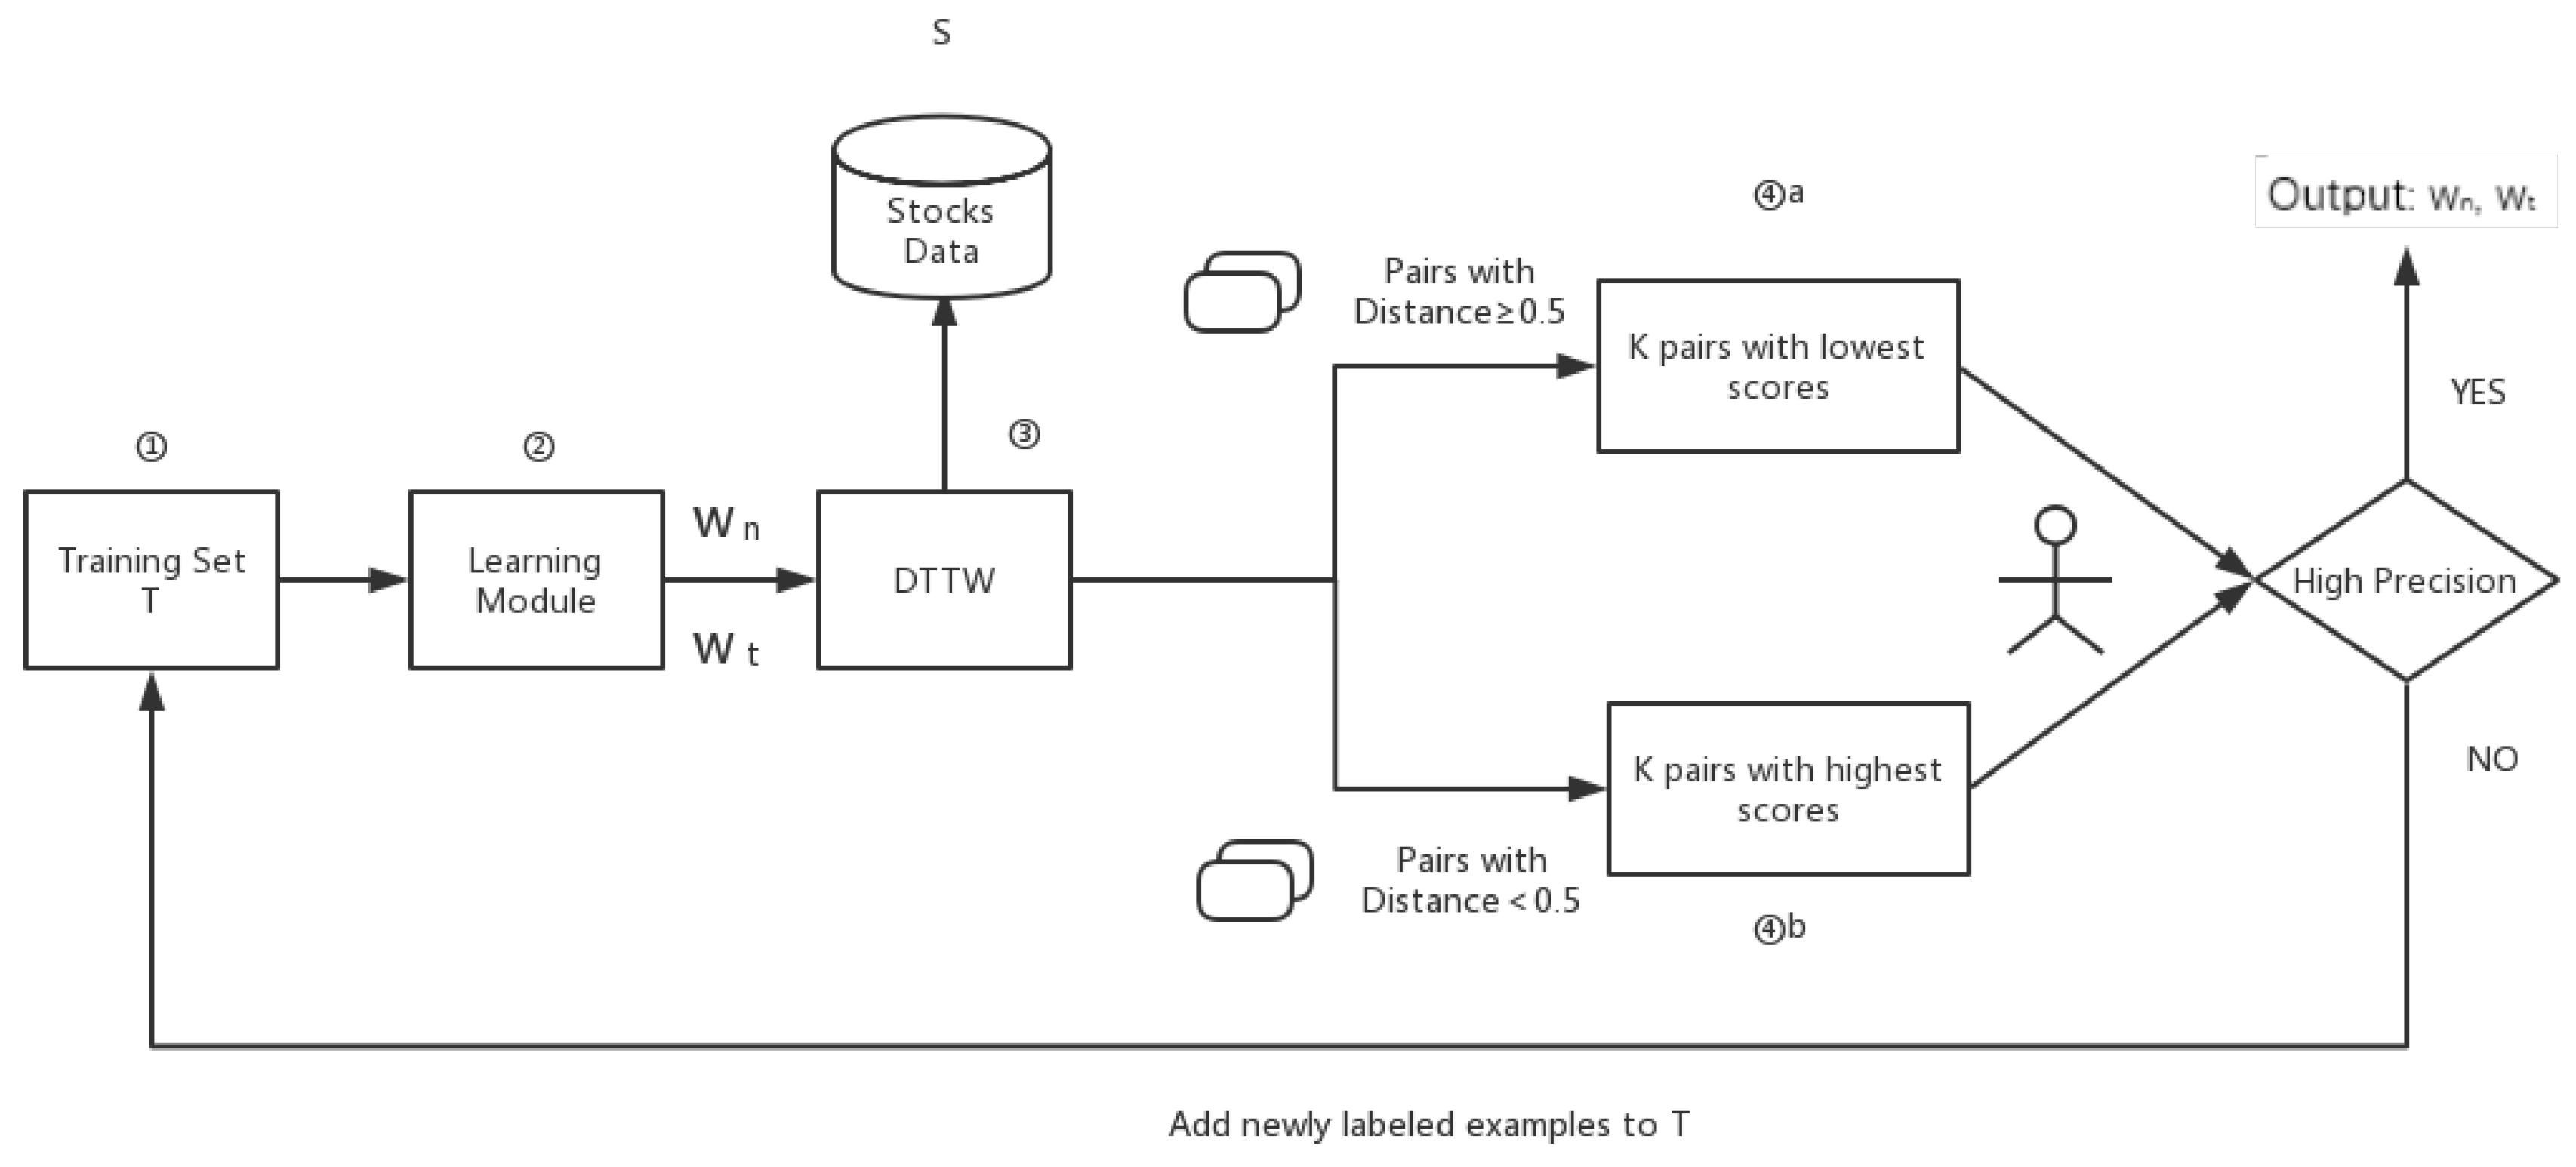
The clustering work was carried out through DTTW. However, in advance, the authors need to define the appropriate value of and in Equation (3). In this paper, authors used an active learning method which needs little human tagging work. The whole procedure is shown in Figure 5:
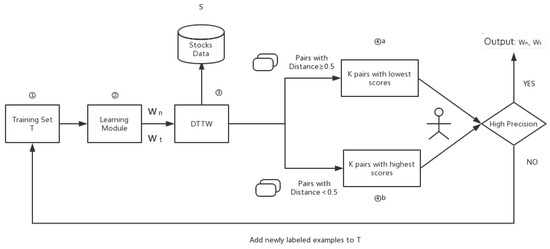
Figure 5.
Overview for the active learning process.
Firstly, the training set T is empty. Each two different companies in stocks data form a “company pair”. The first learning module stage is skipped, and were both set at 0.5. The initial threshold for is 0.5. The values of every company pair can be calculated after applying DTTW on training set. Then, sorting the company pairs according to , the result would be an ordered sequence of companies with .
Next, the top k company pairs with highest scores and the top k company pairs with lowest scores would be sent for human tagging. This progress is carried out by domain experts, with reference to the 10-K report. If companies in company pairs are really sharing same or similar business scopes, the human will be set to 0, else it will be set as 1. Then a precision judgment stage will start, comparing the precision of to the pre-set threshold for precision. Once the authors obtain a result with higher precision than preset ones, the active learning part will be terminated. If not, the authors get company pairs with a human tag, which is then sent to training set T, and stages 1 to 4 in Figure 5 will be repeated. The learning module uses the gradient descent method to fit the weights and . It needs to be stressed that, from turns on, in stage 4 there will be some tagged company pairs (suppose the number is n, ) among selected pairs. The authors would then find the next lower or higher pairs and filter out this pairs, adding them into T. A more systematic algorithm description is shown below in Algorithm 1:
| Algorithm 1 Framework of active learning for weights of numeric similarity and text similarity. |
|
This step will ensure in every turn there will be k newly-tagged company pairs with the highest , and k newly-tagged company pairs with the lowest sent into the training set, accelerating the training progress. According to the experiments, active learning usually took 12 turns to reach convergence, with 120 tagged pairs.
As is shown in Figure 6, we used the three indexes of precision, recall rate, and F1 value to compare the clustering performance of the proposed DTTW algorithm with other existing algorithms. Precision is the proportion of correctly-clustered stocks to all the stocks that have been clustered. Recall rate refers to the proportion of correctly clustered stocks to all stocks that should be clustered. The F1 value is the harmonic mean value of the precision and recall rate [37,38]. Results show that DTTW and FDTW have better performance than other algorithms in clustering performance. DTTW is similar to Fast Dynamic Time Wraping (FDTW) in the recall rate, but both precision and F1 value have a certain increase. In addition, as is shown in Table 1, we compared the time complexity of DTTW to that of other algorithms. Here, n represents the number of stocks, k represents the number of stocks we used in active learning part. Since k is much smaller than n, DTTW also has a better performance in terms of time complexity.
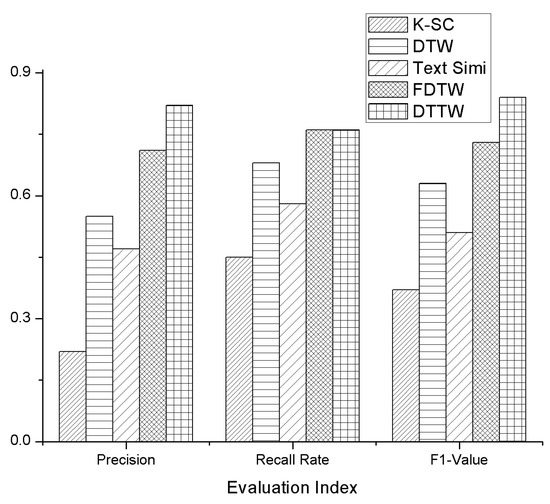
Figure 6.
Comparison of clustering performance.

Table 1.
Comparison of time complexity.
3.4. Data Coding
The data coding procedure idea comes from Yang’s research [39]. After the authors set the appropriate weights and , and cluster the companies through DTTW, the authors get several company clusters (companies in the same cluster with the lowest DTTW distances). For each cluster, there is one “Main Business Scope” and other “Business Scopes”.
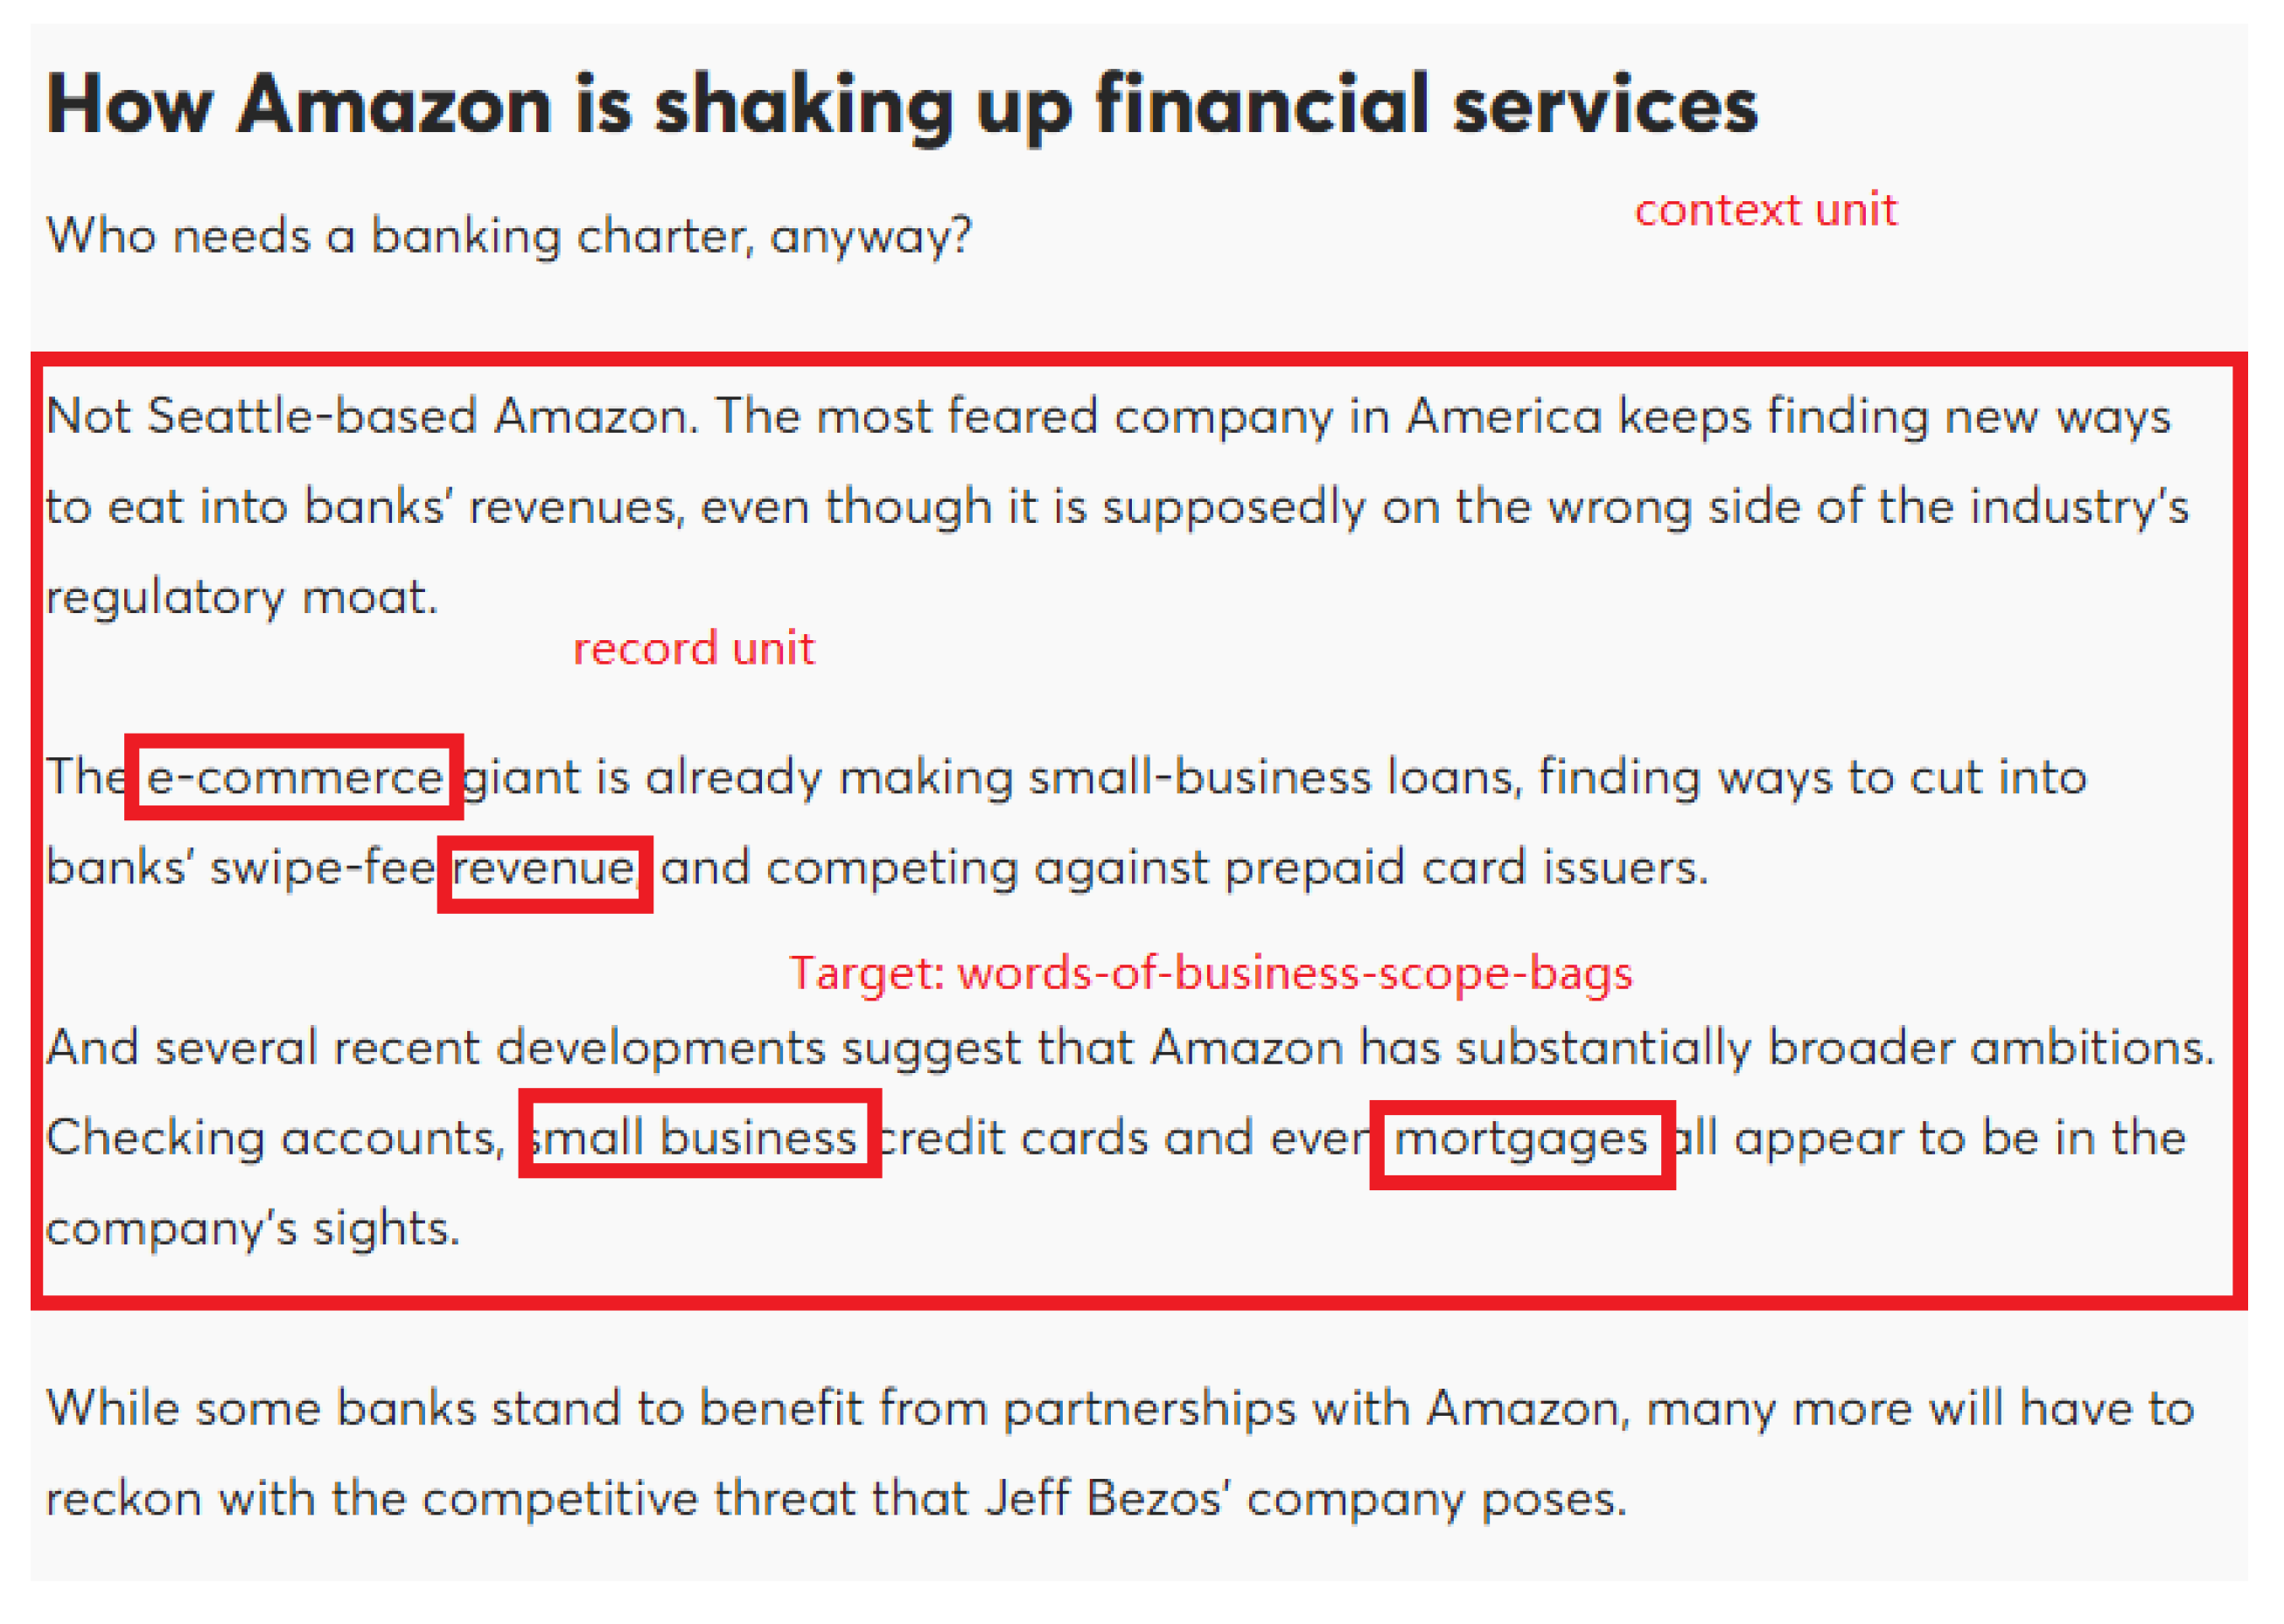
This assignment was carried out according to the words-of-business-scope-bags frequency. As is revealed in Figure 7, among record units, there are several words which indicate the business scopes for certain companies. The authors denoted these words as feature words. These works were carried out with the help of a business scope codebook. According to the International Standard Industrial Classification of All Economic Activities (ISIC), which was established by union nation, the authors created a codebook for main business scopes, as in Table 2. The main business scope is identified through the 10-K reports, while other business scopes are identified through the daily feature texts.
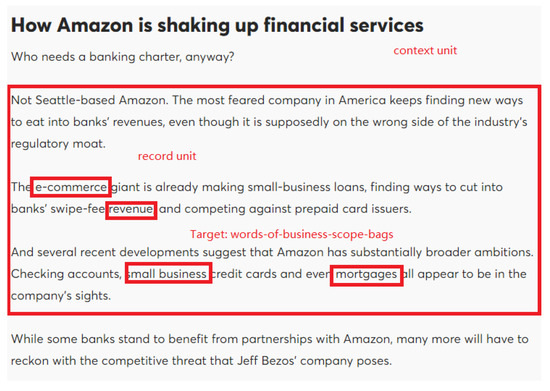
Figure 7.
An example for words-of-business-scope-bags.
Table 2.
Codebook for the main business scopes category (“-” for ISIC classifications not included in our study, “+” for newly defined categories in our study). ISIC: Industrial Classification of All Economic Activities.
Feature words were generated from some basic scope words and their near-synonyms in the Wikipedia corpus. After the DTTW clustering process, the authors performed a word count for each cluster and tagged it according to the mostly frequently occurring feature words. Suppose there is a cluster with “Agriculture” feature words occurring 15,000 times and “Biology & Medical” feature words occurring 1300 times, then this cluster will be tagged as “Agriculture”. The authors performed an analysis for the most common business scopes, as shown in Table 3.
Table 3.
Distribution of 172 target companies, 2012–2017.
Since the 172 selected companies are stocks with the highest market values in their stock market, they could well represent the most common and promising business scopes in the U.S. market. Simply put, once the authors performed classification work with the codebook for the main business scopes, further word count work could help us understand the trends of the top and most promising business scopes from 2012 to 2017.
4. Results
4.1. The Number of Stocks in NASDAQ Is Decreasing while the Number of Stocks in NYSE is Consistently Increasing
The number of stocks in NASDAQ faced a sudden decrease in 2015, from 3370 to 2613. Most of them were finance companies or IT companies, while in 2017 the number of stocks in NASDAQ showed a slight increase, of about 5.2%. Meanwhile, stock number in the NYSE kept growing from 2012 to 2017, about 3.6% per year. Since the companies in the NYSE are mostly of traditional industries, the increase might serve as one indicator of the stability of traditional industries. Meanwhile, the NASDAQ market still maintains more stocks than the NYSE, and finance and IT are still the main streams of the U.S. market. Figure 8 shows the trends of number of stocks in the NYSE and NASDAQ:
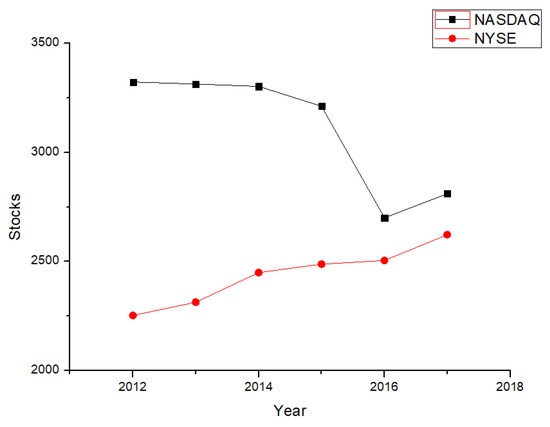
Figure 8.
Stocks in the market, 2012–2017.
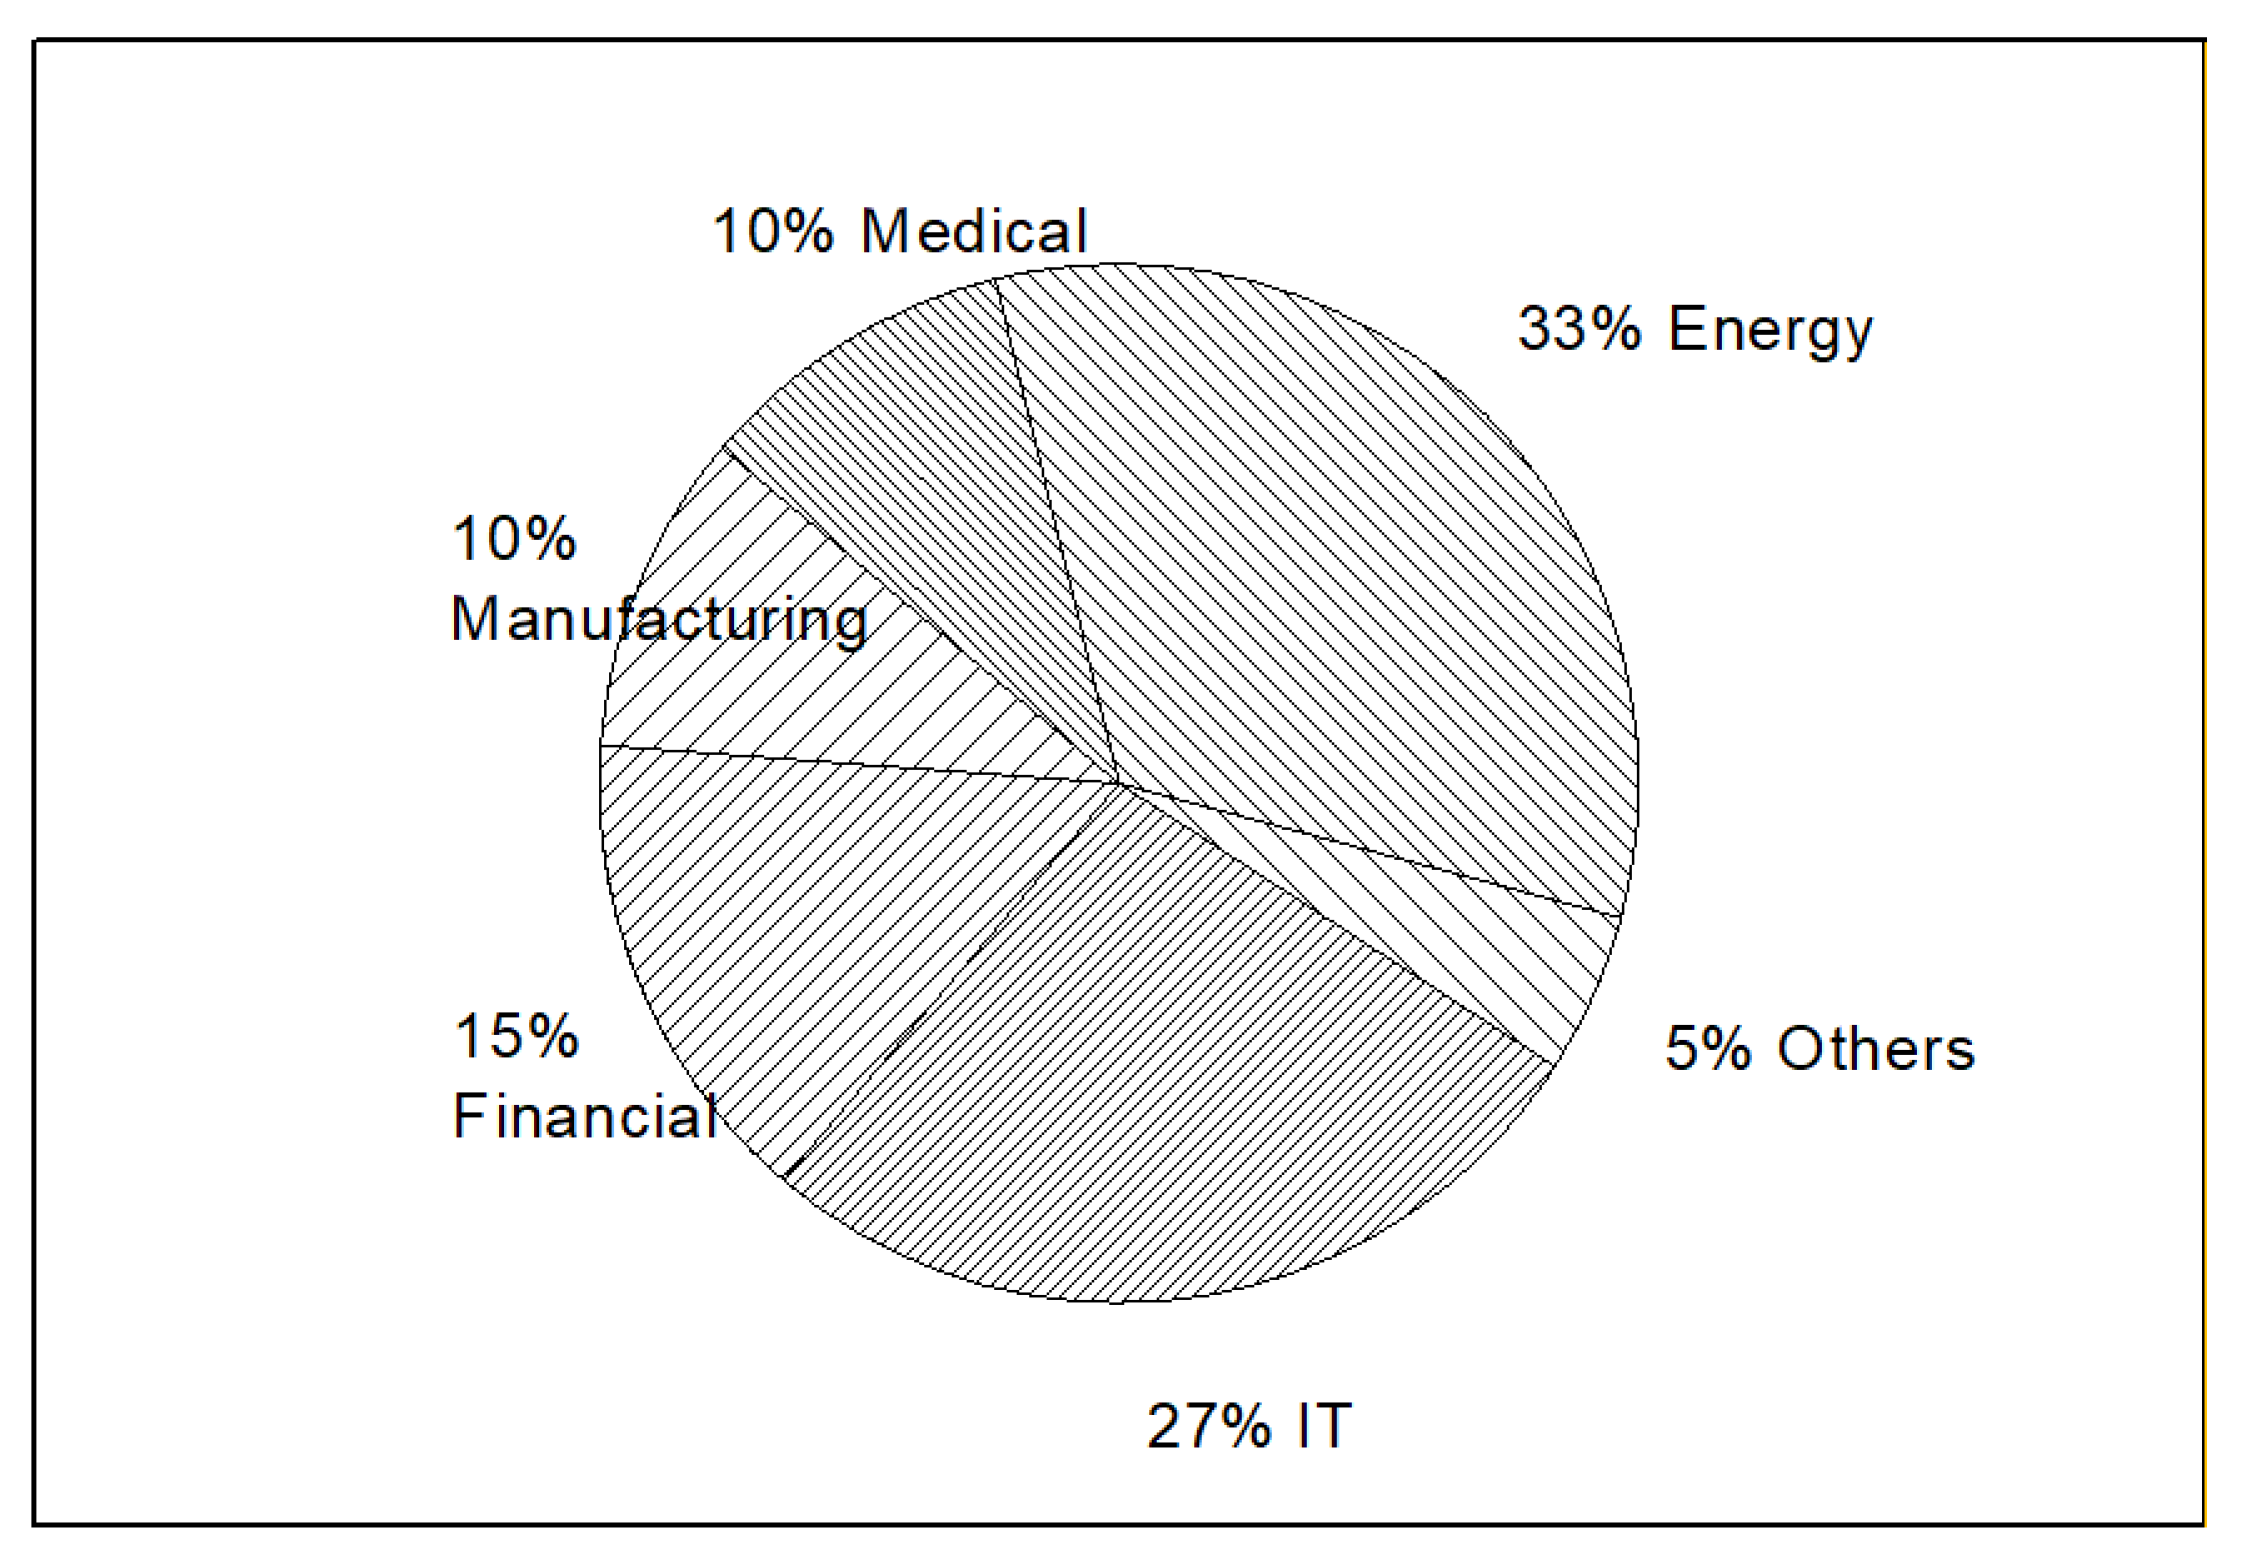
4.2. Most Popular Business Scopes are IT, Energy and Finance
In the last part, the authors have provided an overview for the distributions of 172 companies’ main business scopes. When it comes to the whole market business scopes, there are some slight differences. Among the major types of business scopes, energy, IT, and finance account for 75% overall, indicating that energy industries, as well as the finance and IT industries, are most in demand. For investors, especially in the U.S., they might need to keep their focus mainly on these three areas.
While the manufacturing and medical sectors still separately account for 10% of the total business scopes, this information signifies that some traditional industries are still worth focusing on, while the proportion of these traditional business scopes only account for one-third of the IT and finance industries. This information does not necessarily imply that traditional industries are less popular, but one possible suggestion is that the authors could open more business lines in IT or finance areas for business operation. Figure 9 shows the percentage of business scopes among the 172 target companies.
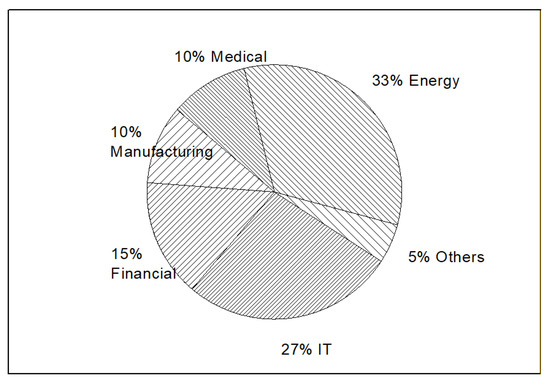
Figure 9.
Distribution of all the business scopes for 172 companies.
4.3. State of Operation for Companies Researched
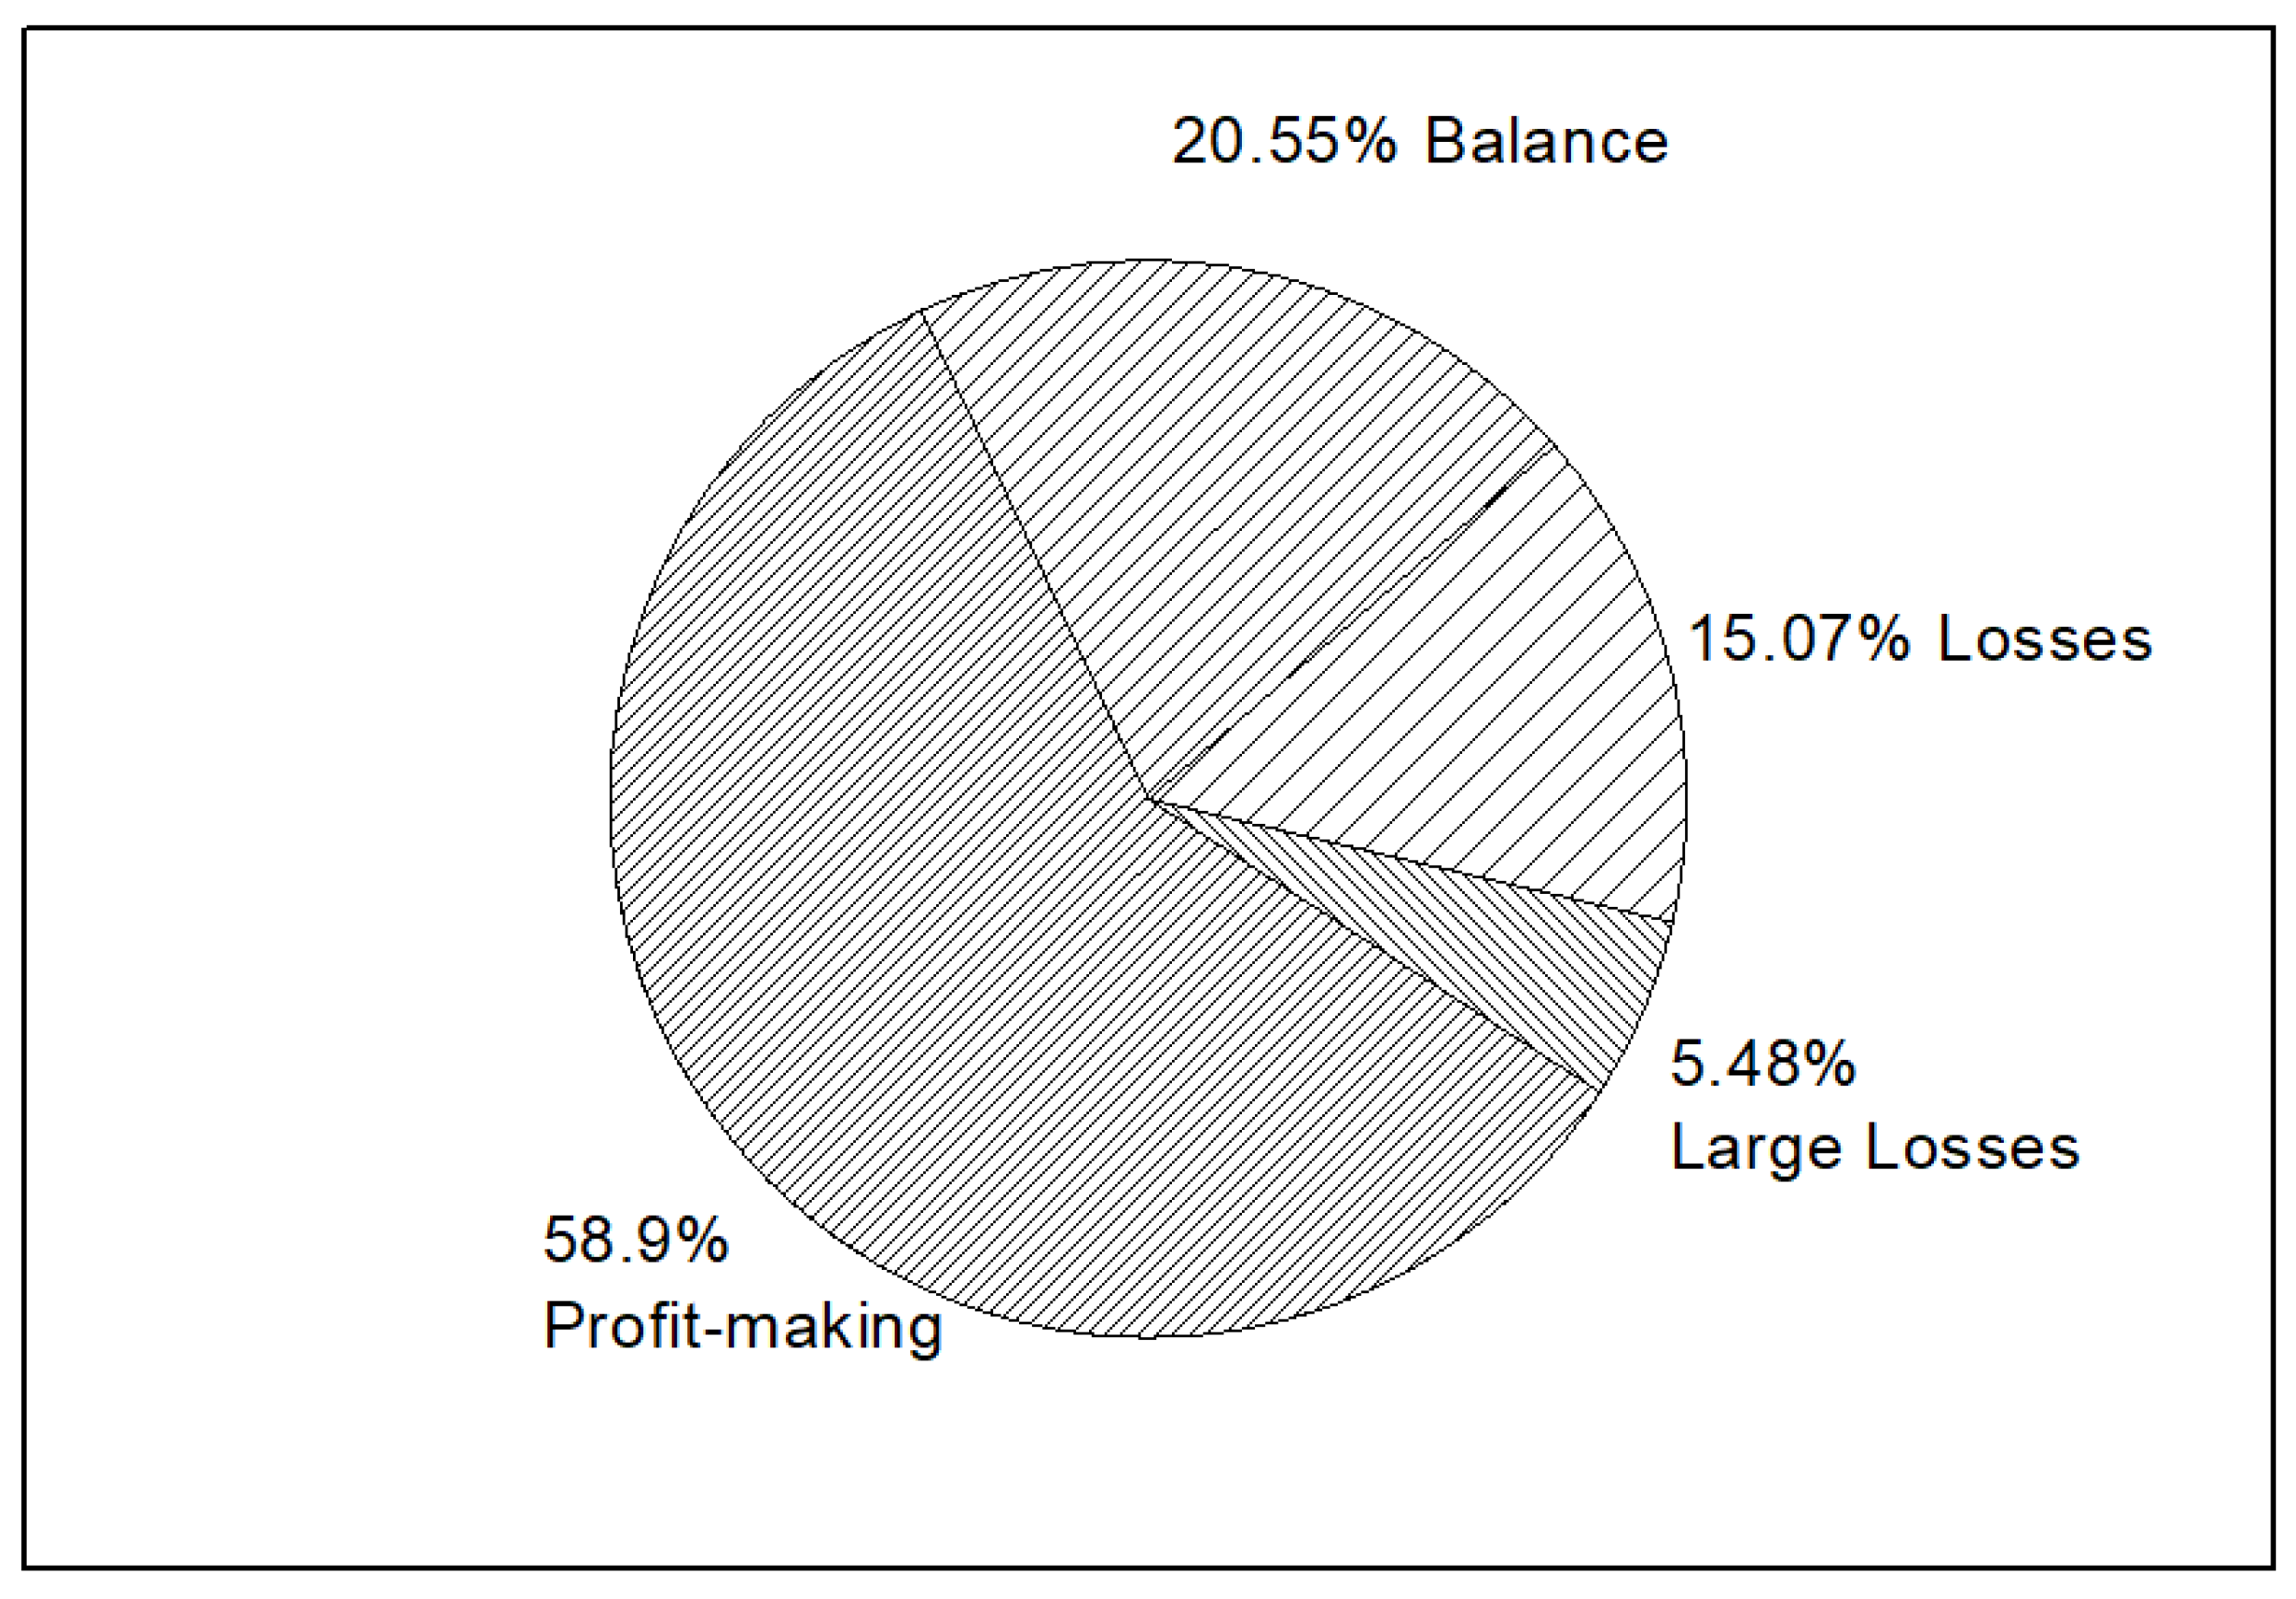
According to the 10-K annual reports of companies researched, the operation states over the past 5 years reveal that 58.9% companies are keeping a profit-making status. About 20.55% companies keep a balance on operation status, that is, most of the companies researched have satisfactory operation. Hence, the popular business scopes among these companies are worthwhile for investors to pay attention to. For entrepreneurs and operators, these popular areas are promising alternatives. Figure 10 shows the specific operation states of the companies researched.
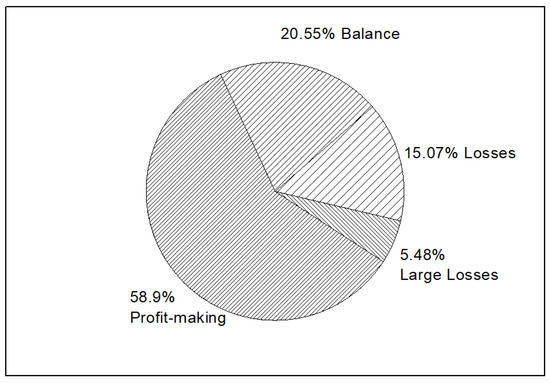
Figure 10.
State of operation for the researched companies.
4.4. Specific Business Scopes of Big Data are the Most Popular
The word counting results show a clearer trend of popular specific business scopes. To obtain the exact proportion of popular business scopes, the authors manually sought out business scopes from words-of-business-scopes appearing more than five times (53,529 business scopes in total). Certain word frequencies are shown in Table 4.
Table 4.
Specific business scopes for researched companies.
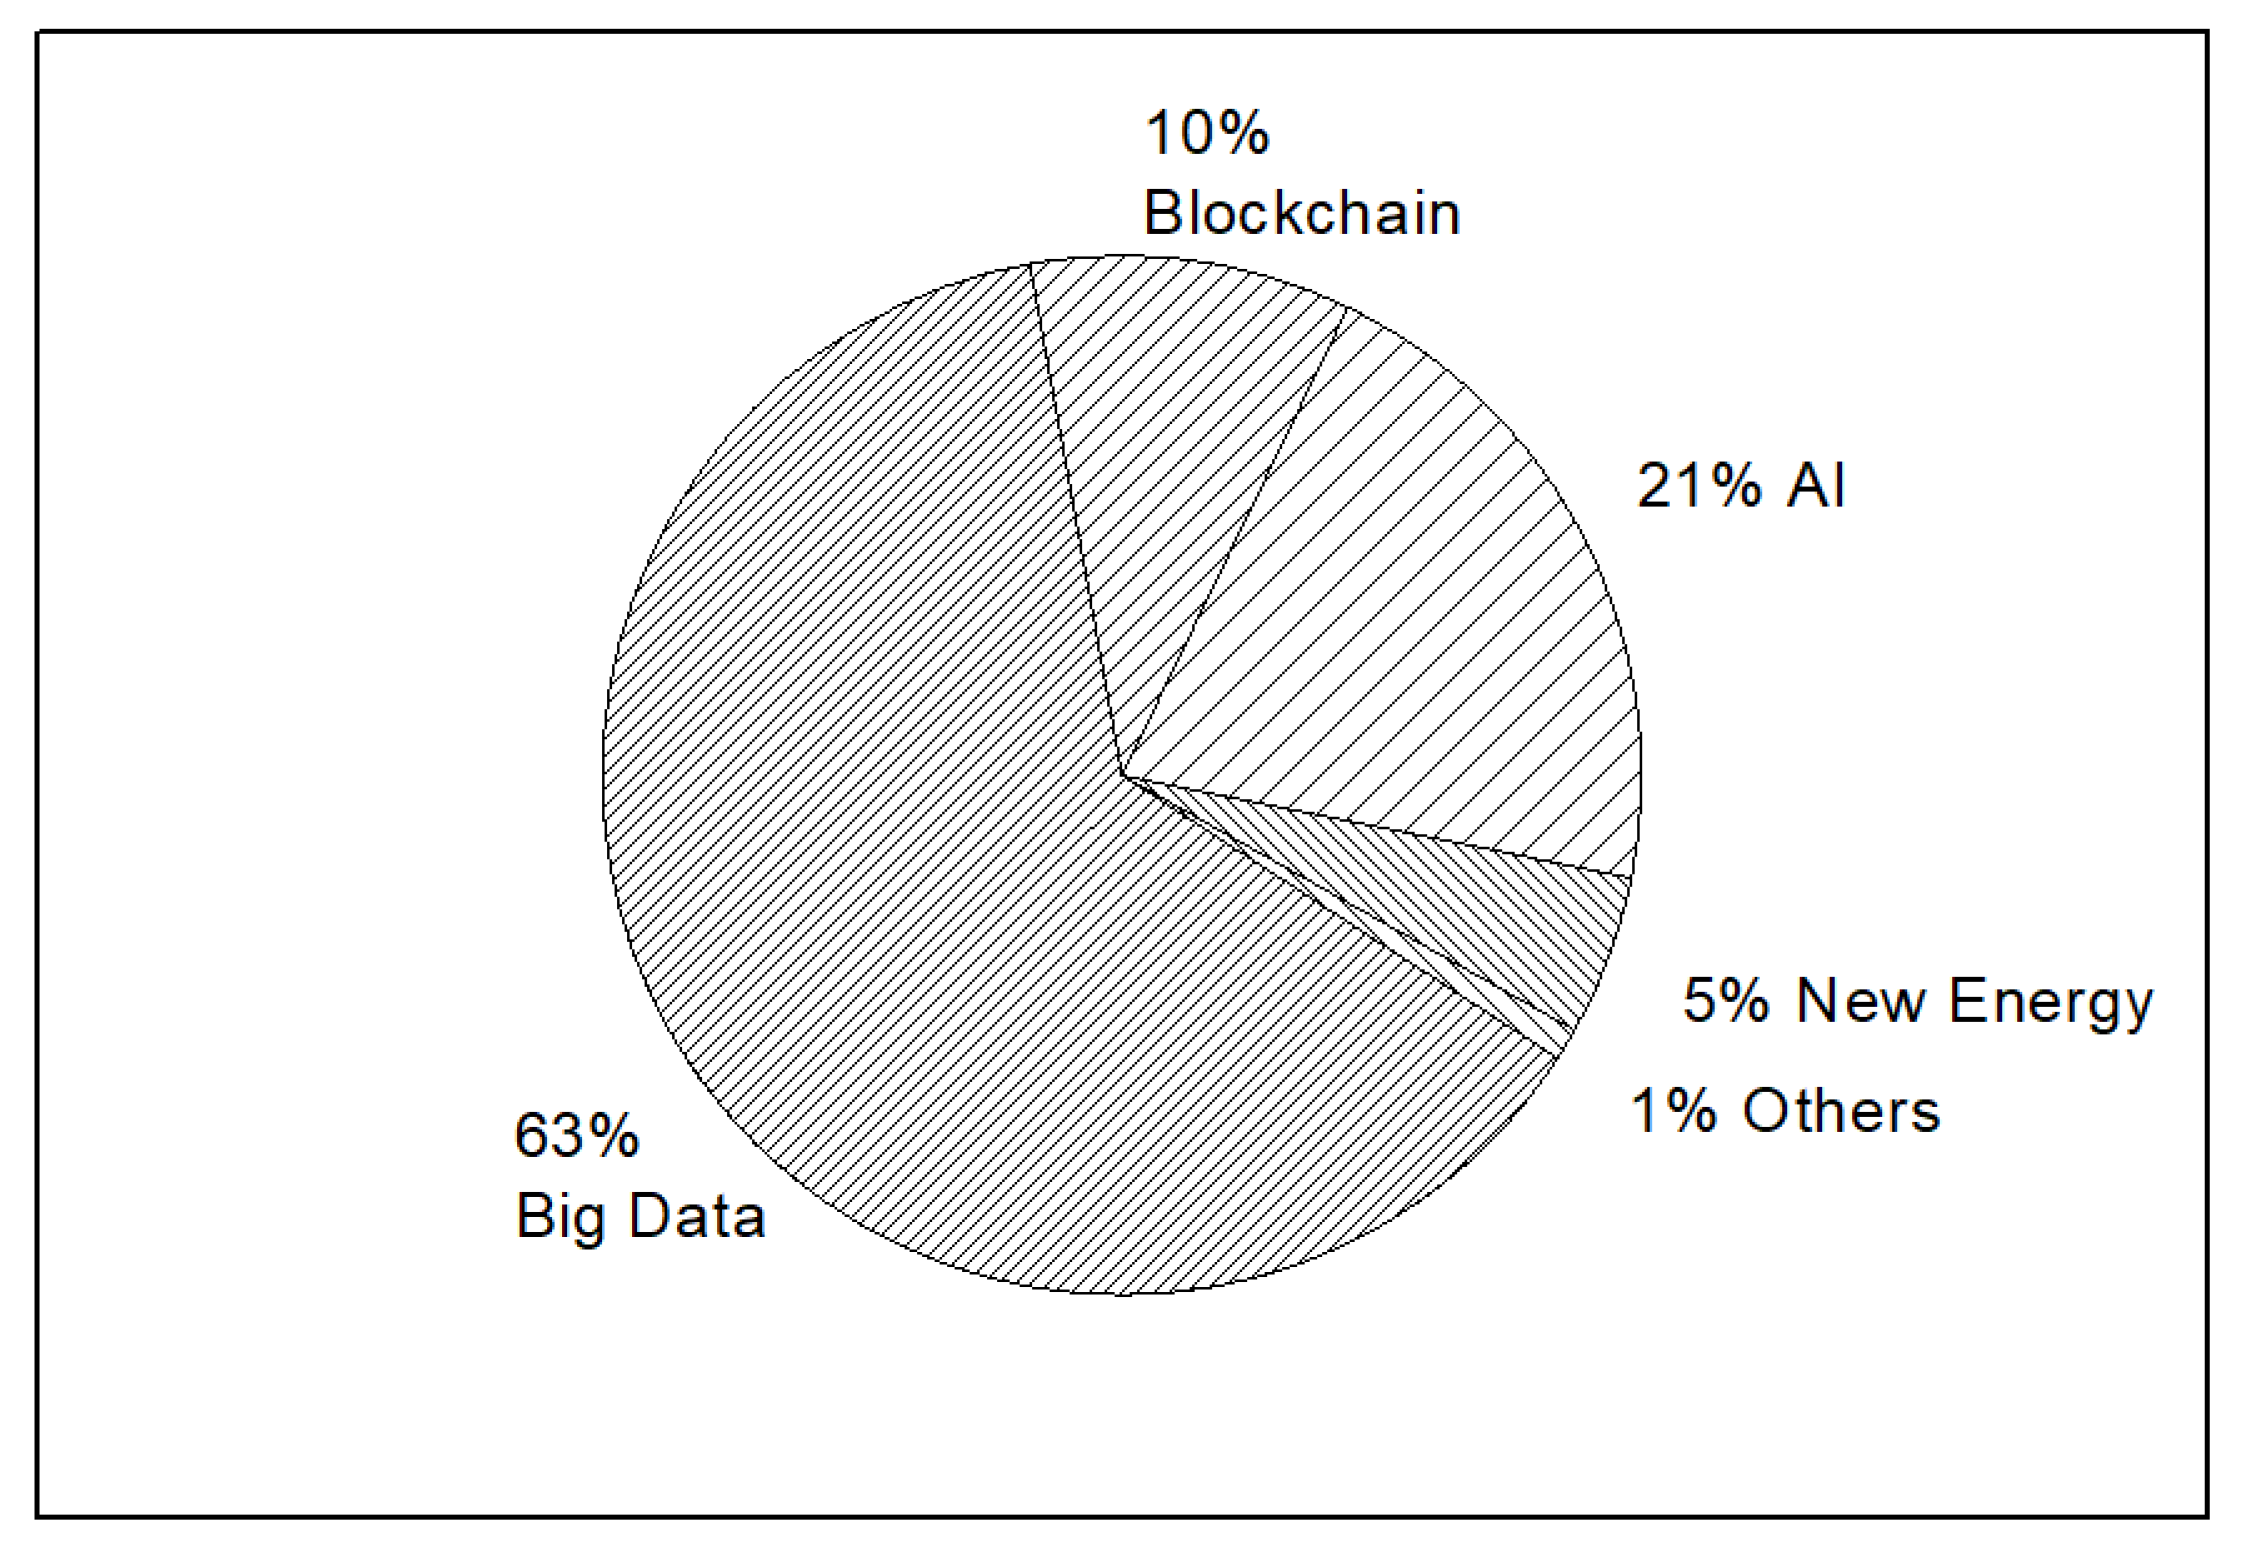
As shown in Figure 11, specific business scopes related to big data account for nearly 63% of all the specific business scopes. Significantly, no matter how traditional business analysis or new business intelligence methods rely on big data support, big data will maintain its popularity in business scopes. While AI accounts for 21% of specific business scopes, this phenomenon may have some relation with the progress of the deep learning area. While the future of AI remains uncertain, is quite a great choice for investors. Among the top business scopes, the authors would like to stress that blockchains, as well as bitcoins, already account for 10%. The decentralization of blockchains is appealing to investors and company operators, although it can be a double-edged sword at times.
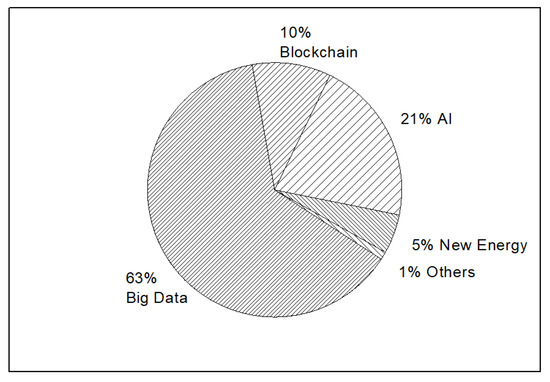
Figure 11.
Distribution of popular specific business scopes.
4.5. Growth of New Concepts in IT
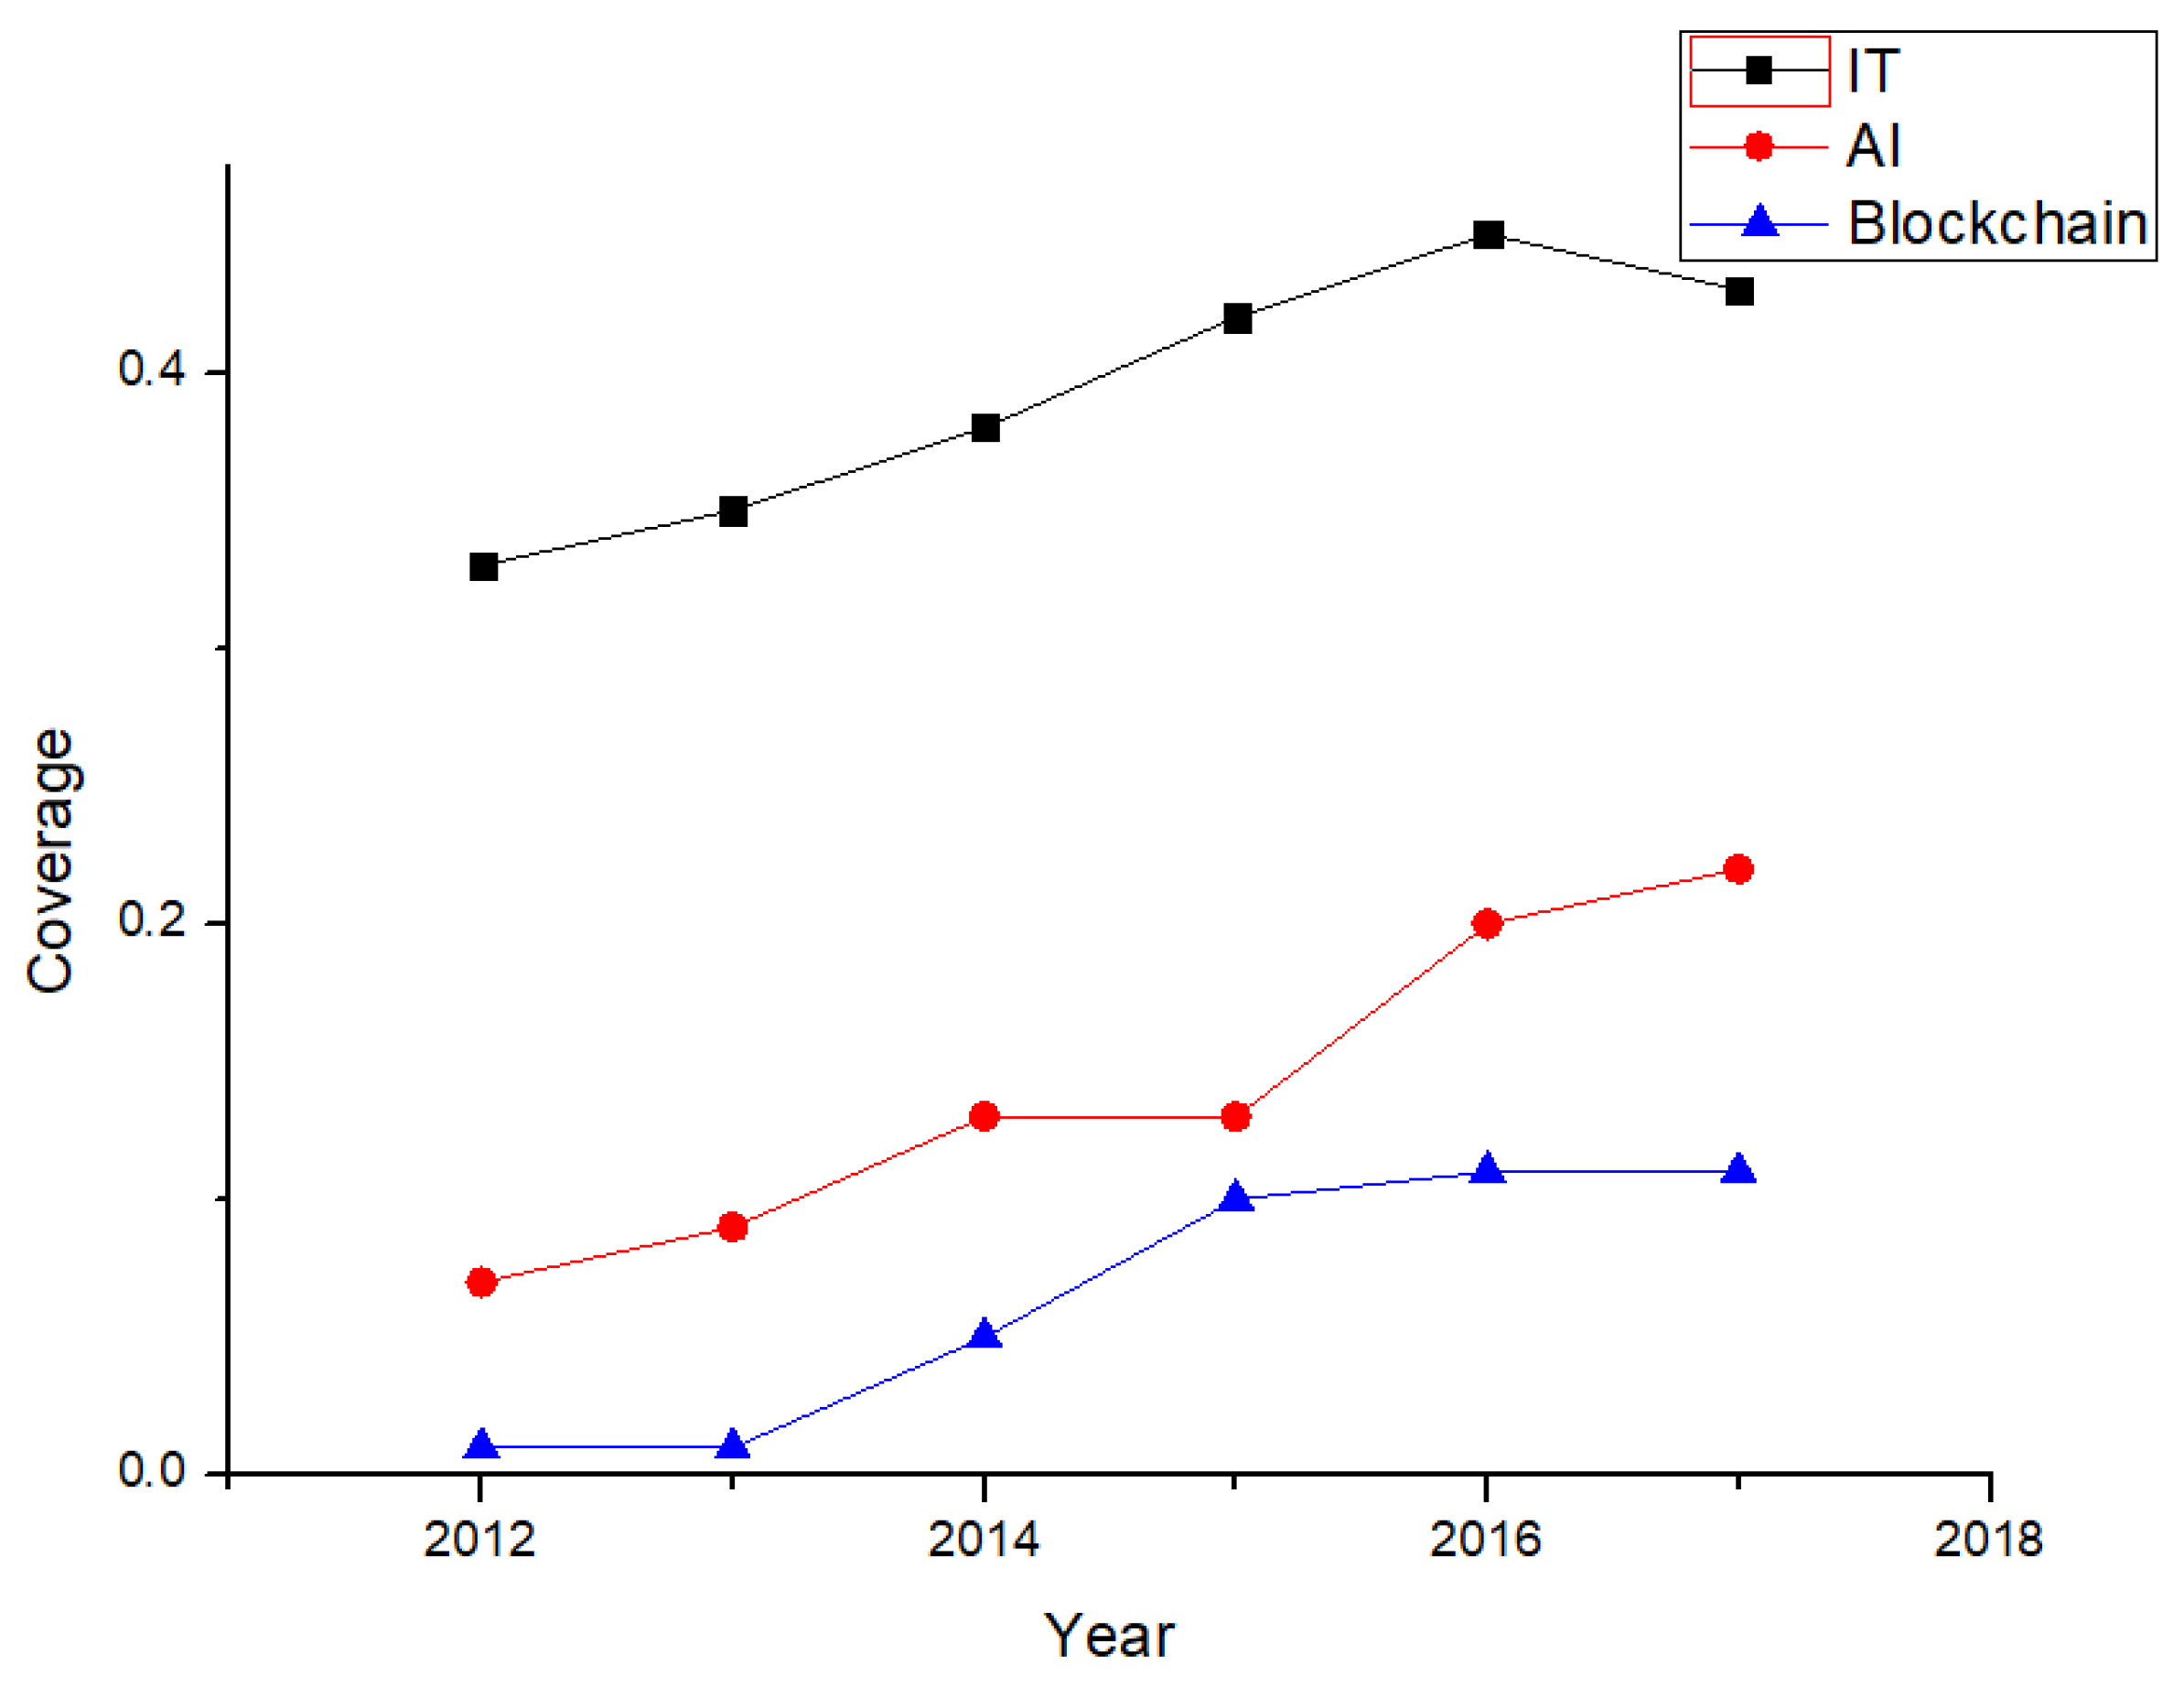
As illustrated above, new IT concepts occupy a significant share of the U.S. market. Further study (Figure 12) of AI and blockchain technology, as two representative new IT concepts, shows that IT covers over 35% of the U.S. market and has consistently increased over the past five years, by about 2% per year. IT has a great influence upon U.S. market. AI, as a new IT concept, has increased from an initial 7% to about 20% coverage. AI applications, due to their high efficiency, have been steadily gaining importance in recent years. The authors would like to remind readers that blockchain technology, as well as bitcoins, showed a sudden and rapid increase in popularity from 2013 and have been stable since 2015. The growing trend of new IT concepts should be focused upon by investors and operators.
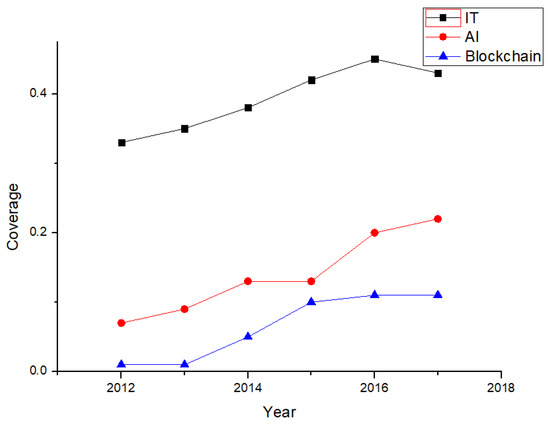
Figure 12.
Coverage of new IT concepts in the U.S. market (2012–2017).
4.6. Time of Companies Involved in New IT Business Scopes Are Diverse
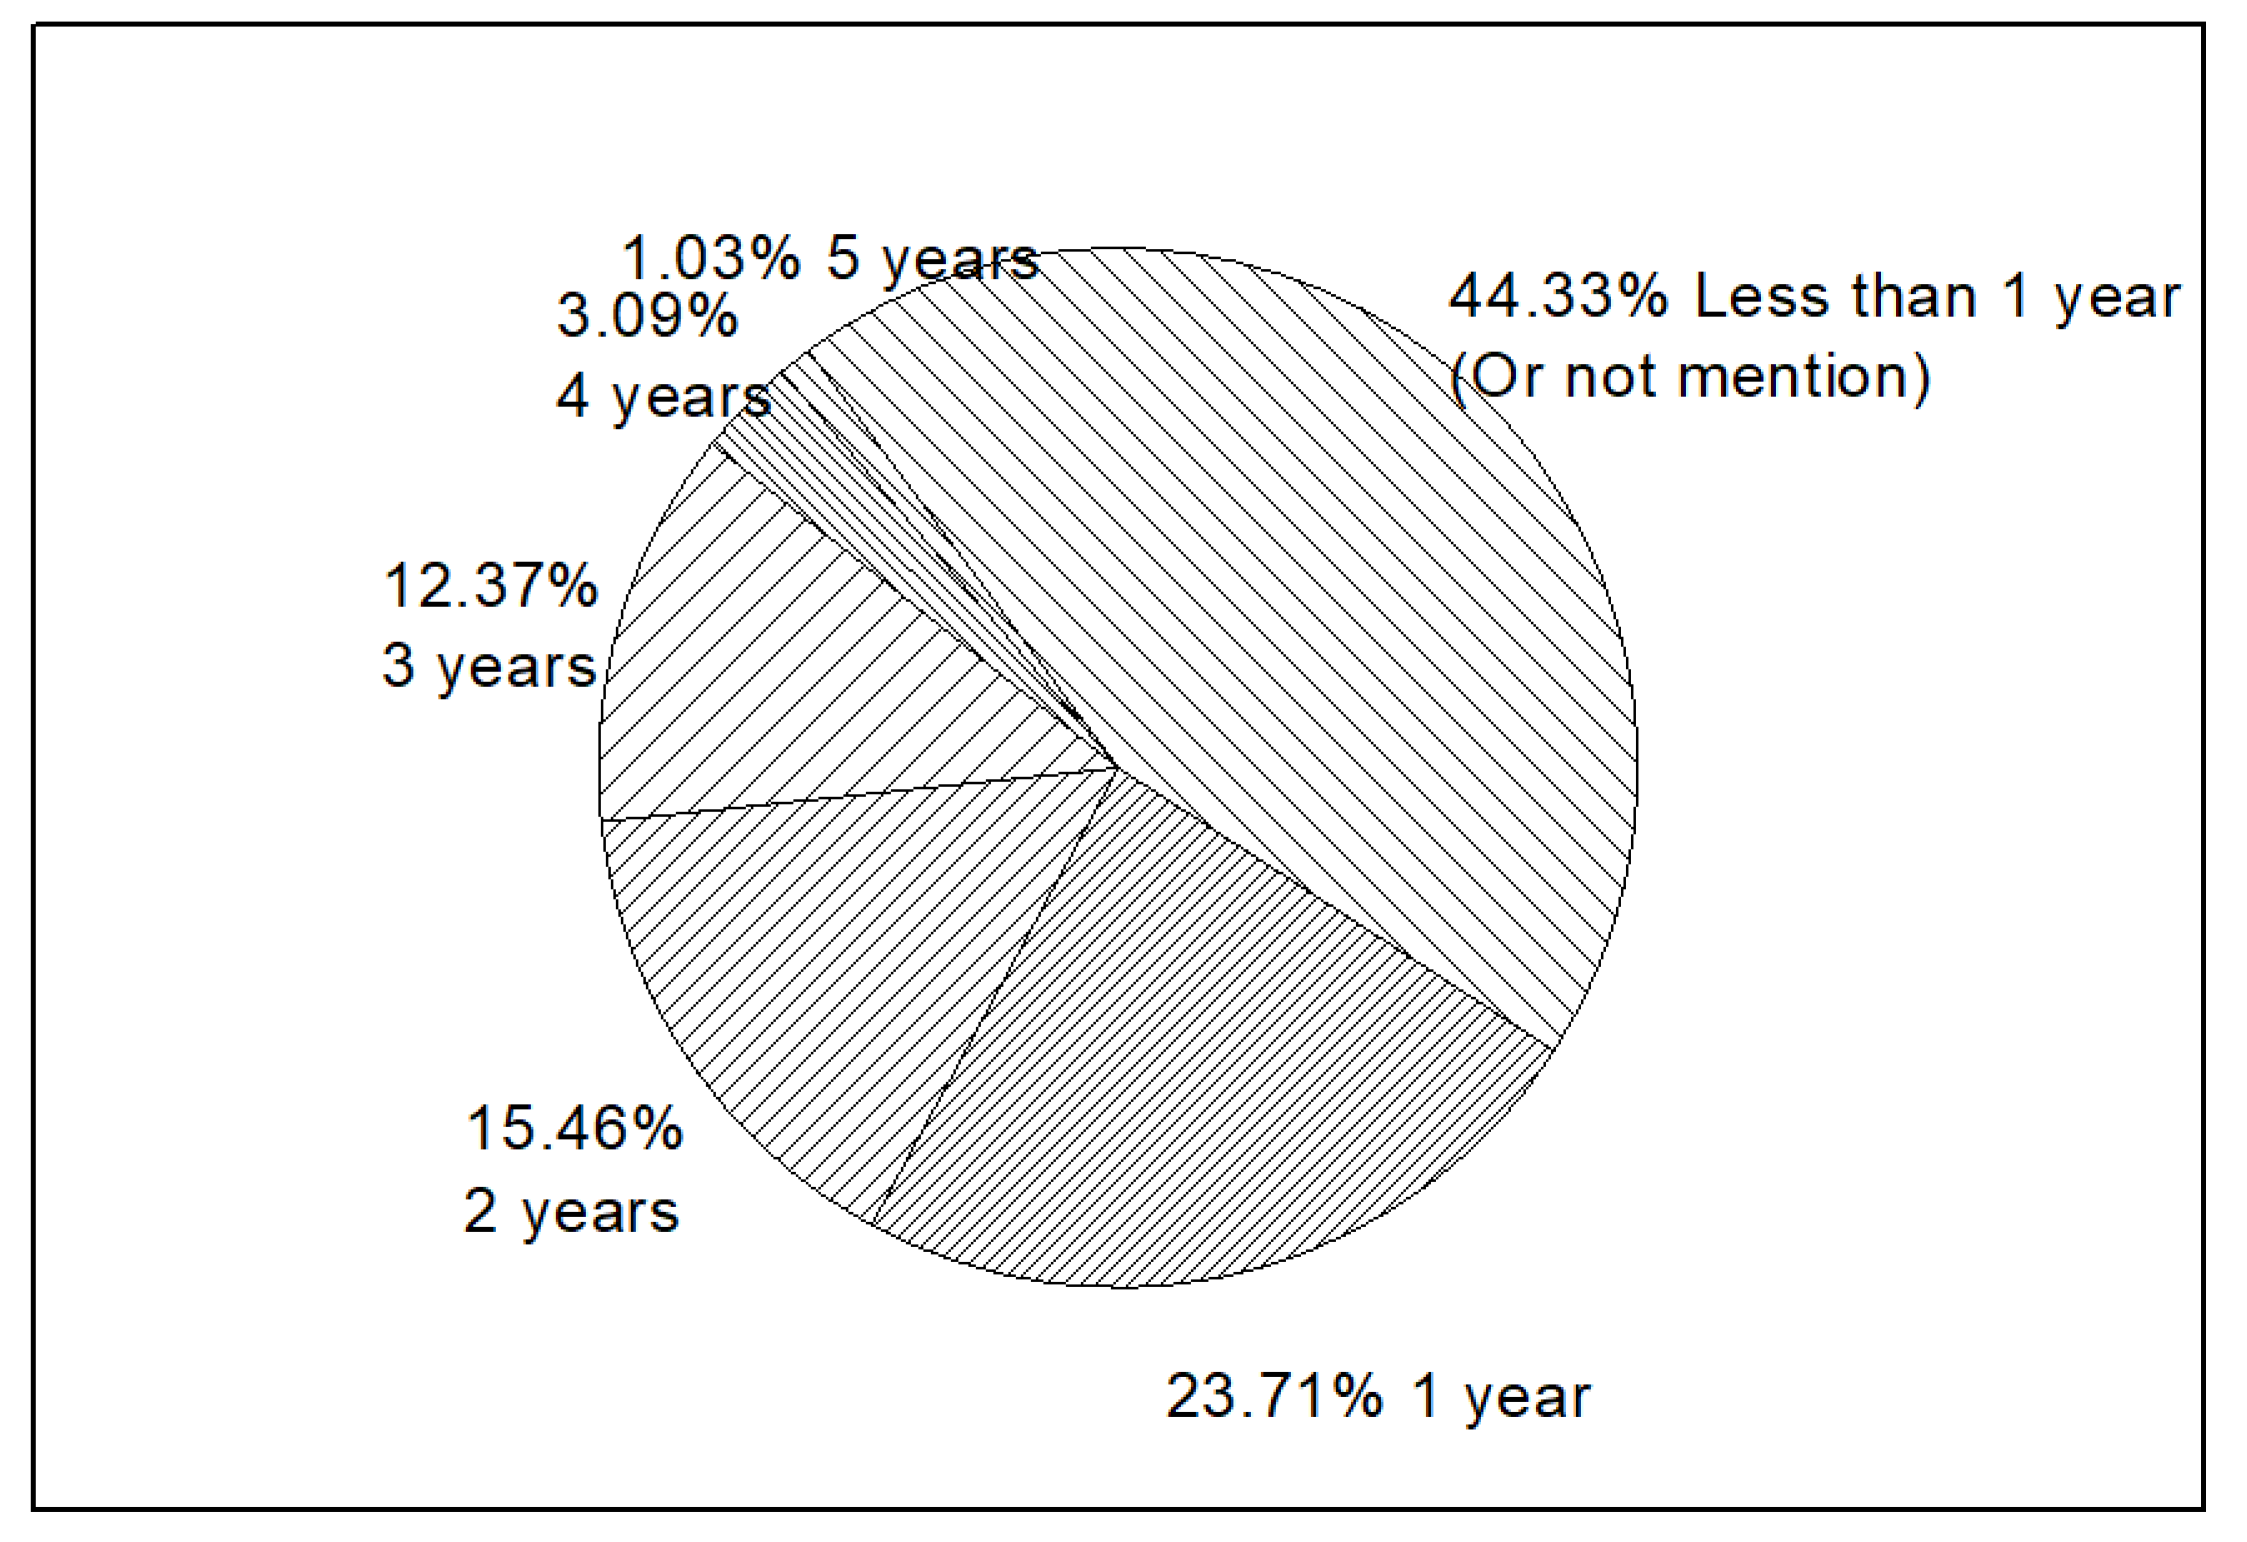
While new concepts of IT are widely distributed in business scopes, the time companies involved in such scopes are widely diverse. As shown in Figure 13, 44.33% companies operated with new IT business scopes for less than 1 year. Companies in the U.S. market seemed to take a cautious strategy in choosing new concepts. Companies with new IT business scopes for 1 year (23.71%), 2 years (15.48%), and 3 years (12.37%) are roughly the same, and also show a gradual increase. Compared to the companies involved for more than 4 years (4.12%), new business scopes in IT area show fairly good prospects.
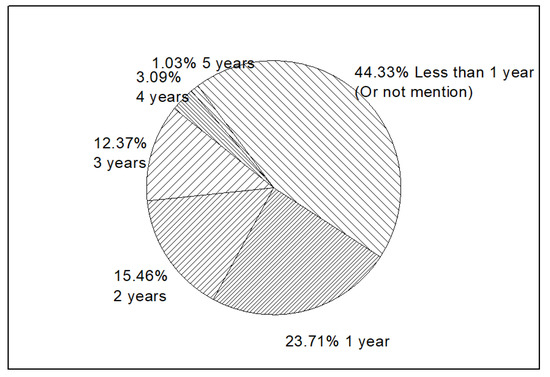
Figure 13.
Years of companies involved with new IT business scopes.
5. Discussion
5.1. What Kind of Businesss Scopes Are Popular in the Present U.S. Market?
Foremost among the findings is the increasing amount of news posted by companies. Although investors and those companies’ operators should investigate other factors to estimate their operational states, such as the number of items of news really related to companies’ operation each year, the remarkable increase in daily news from 2012 to 2017, of around 21% per year on average, could be one indicator of the health of the market.
On one hand, most companies put great focus on big data; that is to say, data-based analysis, and mining or similar work are becoming a necessary part for the daily operations of companies. Another useful piece of information for investors and company operators is the demand distribution of different kinds of business scopes. Energy industries are most popular in the U.S. market, followed by the IT, finance, biology and medical, and manufacturing industries. Because of sample deviation and the difficulty in analyzing business scope words, this result may be more indicative than accurate, although it still represents a good reference.
5.2. What Key Factors or Specific Productions Show Promising Development Trends?
With the rapid development of IT and Internet, computer science, especially with respect to new concepts, has had a huge influence on business operations. AI and blockchain, examples of two new concepts in the IT industries, cover about 31% of the researched companies’ business scopes. Despite potential sample bias, business scopes with new IT concepts, considering their stable growing trends (see Figure 12), are worth trying for a number of companies in America. Since over 67% of companies have been familiar with these new IT concepts for less than (or equal to) 1 year, the potential market for companies to take these scopes is still huge and promising. The authors also determined that new energy, as a more traditional business scope, occupies 5% of the U.S. market. Cautious investors can be involved in the long term and bank the interest. Innovation in resources or energy will still be popular in the U.S. market in the near future. Company operators could follow the trend of IT development by adjusting operations with the help of new IT concepts; there is no need to change the whole framework in operation.
5.3. What Business Scopes are in Alignment with U.S. Market Trends?
As a document covering all basic knowledge for global business, ISIC classifications of business scopes cover most of the scopes identified in this study. However, this study shows that new business scopes, for example in the biology and IT industries, may need to be specified.
Using the special designed business scopes codebook (see Table 2) that corresponds to ISIC’s business scopes and text mining strategies, among 403,112 pieces of news, the 17 specific business scopes that most frequently appear in the news texts can be grouped into these five categories:
- (1)
- Big data, including “Big Data”, “Cloud Service”, “Cloud Computing”, “Social Data” and “Data Security”;
- (2)
- Finance, including “Online Service” and “E-commerce”;
- (3)
- Artificial intelligence, including “Artificial Intelligence”, “Business Intelligence”, “Machine Learning”, and “Virtual Reality”;
- (4)
- Blockchains or bitcoins;
- (5)
- New energy, including “New Energy Car” and “New Energy Exploit”.
6. Conclusions and Further Study
All areas of business scope definition have evolved and continue to evolve over time. The pace of the IT development has provoked a significant revolution in business operations, which is reflected by the change of popular business scopes. This article proposes an active learning method to perform content analysis on a vast array of companies’ stock price numerical series and their daily news. The authors highlight that ISIC’s standard for business scope definition may need refinement. With periodic review and maintenance, the document may evolve with the profession and remain relevant, which is beneficial to those who seek guidance.
More accurate and rich data produces more accurate and comprehensive results. Although the data for this study was retrieved from the NASDAQ and NYSE stock price series, news texts from the Google database, and one of the largest finance and news websites for business research in America, about a quarter of the data has only simple and basic business scope-related descriptions that made construction of a codebook difficult and prevented the implementation of further data mining methods. Thankfully, the DTTW method adjusted the result of text similarity clustering, which improved the precision. The codebook is based on prior work and is updated manually to guarantee its validity. On the other hand, as the method has provided researchers with limited candidates in the human tagging part, it becomes possible to process a large number of companies’ business scopes for comparison and clustering.
As this study used an active learning method to set the weight of text distance and numerical series distance, in addition to a semi-automatic method to construct a codebook based on a former codebook, it would be easy to apply this method to samples from the same source. Researchers may track the changes in popular American business scopes by repeating the survey over time. Another improvement for such a study is to incorporate job advertisements from other data sources as a complementary measure. Business daily news in this research was dated from November 2012 to November 2017. The daily news of companies posted before 2012 could provide a good contrast for analyzing changing trends in business scopes.
The algorithm mentioned in this article can be applied to other situations, such as:
- (1)
- Other scenarios that use both text similarity and time series similarity. For example, if a house price time series and the corresponding real estate-related news of certain areas is obtained, then the DTTW algorithm mentioned in this article can be used to cluster the regions and find out the characteristics of regions that may have similar house price trends (gold price clustering, crude oil futures price clustering, etc.) in a similar way;
- (2)
- Since the texts used in this article are news texts, if short texts such as twitter texts are required for use, on adjusting the short texts similarity calculation algorithm, the DTTW can be used for clustering.
Last but not least, the authors cluster companies with a DTTW method which could adjust the weights of text information and numerical information. Little human tagging work could lead to a satisfactory clustering result. Further work will introduce other sources of information into the DTTW to provide more precise clustering work.
Author Contributions
X.D. directed the research; L.D. and K.Q. reviewed the related literature and confirmed the research topic; L.D. designed and implemented the algorithm, performed the experiment, analyzed the data, and wrote the paper with discussions and contributions from all the authors; L.D. contributed the data source, manually analyzed the business scopes, and edited the paper.
Acknowledgments
All the authors express our heartfelt thanks to the Institutional Open Access Program (IOAP) for its funding granted to University of Canifornia Snta Cruz.
Conflicts of Interest
The authors declare no conflict of interest.
References
- Bhojraj, S.; Lee, C.; Oler, D.K. What’s my line? A comparison of industry classification schemes for capital market research. J. Account. Res. 2003, 41, 745–774. [Google Scholar] [CrossRef]
- Pierce, J.R.; Schott, P.K. A concordance between ten-digit US Harmonized System Codes and SIC/NAICS product classes and industries. J. Econ. Soc. Meas. 2012, 37, 61–96. [Google Scholar]
- Chan, L.K.; Lakonishok, J.; Swaminathan, B. Industry classifications and return comovement. Financ. Anal. J. 2007, 63, 56–70. [Google Scholar] [CrossRef]
- Connor, G.; Sehgal, S. Tests of the Fama and French Model in India; Financial Markets Group, London School of Economics and Political Science: London, UK, 2001. [Google Scholar]
- Arrizabalaga, A. Google Finance Historical Stock Data Downloader; Springer: New York, NY, USA, 2003; p. 452. [Google Scholar]
- Liao, S.H.; Ho, H.H.; Lin, H.W. Mining stock category association and cluster on Taiwan stock market. Expert Syst. Appl. 2008, 35, 19–29. [Google Scholar] [CrossRef]
- Kalczynski, P.J.; Chou, A. Temporal Document Retrieval Model for Business News Archives; Pergamon Press, Inc.: Oxford, UK, 2005; pp. 635–650. [Google Scholar]
- Fu, T.C.; Chung, F.L.; Ng, V.; Luk, R. Pattern Discovery from Stock Time Series Using Self-Organizing Maps. In Workshop Notes of KDD2001 Workshop on Temporal Data Mining; Springer: New York, NY, USA, 2001; pp. 26–29. [Google Scholar]
- Guo, C.; Jia, H.; Zhang, N. Time series clustering based on ICA for stock data analysis. In Proceedings of the IEEE 4th International Conference on Wireless Communications, Networking and Mobile Computing (WiCOM’08), Dalian, China, 12–14 October 2008; pp. 1–4. [Google Scholar]
- Cai, Q.; Zhang, D.; Zheng, W.; Leung, S.C. A new fuzzy time series forecasting model combined with ant colony optimization and auto-regression. Knowl.-Based Syst. 2015, 74, 61–68. [Google Scholar] [CrossRef]
- Agrawal, R.; Faloutsos, C.; Swami, A. Efficient similarity search in sequence databases. In Proceedings of the International Conference on Foundations of Data Organization and Algorithms, Chicago, IL, USA, 13–15 October 1993; Springer: New York, NY, USA, 1993; pp. 69–84. [Google Scholar]
- Wattenberg, M. Visualizing the stock market. In CHI’99 Extended Abstracts on Human Factors in Computing Systems; ACM: New York, NY, USA, 1999; pp. 188–189. [Google Scholar]
- Achananuparp, P.; Hu, X.; Shen, X. The evaluation of sentence similarity measures. In Proceedings of the International Conference on Data Warehousing and Knowledge Discovery, Turin, Italy, 2–5 September 2008; Springer: New York, NY, USA, 2008; pp. 305–316. [Google Scholar]
- Wang, P.; Domeniconi, C. Building semantic kernels for text classification using wikipedia. In Proceedings of the 14th ACM SIGKDD International Conference On Knowledge Discovery and Data Mining, Las Vegas, NV, USA, 24–27 August 2008; ACM: New York, NY, USA, 2008; pp. 713–721. [Google Scholar]
- Bushman, R.M.; Chen, J.V.; Williams, C.D. Informativeness and Timeliness of 10-K Text Similarity for Predicting Tail-Risk Comovement; Elsevier: New York, NY, USA, 2017; pp. 298–315. [Google Scholar]
- Box, G.E.P.; Jenkins, G. Time Series Analysis, Forecasting and Control; Holden-Day, Incorporated: San Francisco, CA, USA, 1990. [Google Scholar]
- Rakthanmanon, T.; Campana, B.; Mueen, A.; Batista, G.; Westover, B.; Zhu, Q.; Zakaria, J.; Keogh, E. Searching and mining trillions of time series subsequences under dynamic time warping. In Proceedings of the ACM SIGKDD International Conference on Knowledge Discovery and Data Mining, Beijing, China, 12–16 August 2012; pp. 262–270. [Google Scholar]
- Brillinger, D.R. Time Series: Data Analysis and Theory; Society for Industrial and Applied Mathematics (SIAM): Philadelphia, PA, USA, 2001; Volume 36. [Google Scholar]
- Liao, T.W. Clustering of time series data—A survey. Pattern Recognit. 2005, 38, 1857–1874. [Google Scholar] [CrossRef]
- Himberg, J.; Hyvärinen, A.; Esposito, F. Validating the independent components of neuroimaging time series via clustering and visualization. Neuroimage 2004, 22, 1214–1222. [Google Scholar] [CrossRef] [PubMed]
- Bessler, W.; Kaen, F.R.; Kurmann, P.; Zimmermann, J. The listing and delisting of German firms on NYSE and NASDAQ: Were there any benefits? J. Int. Financ. Mark. Inst. Money 2012, 22, 1024–1053. [Google Scholar] [CrossRef]
- Spyrou, S. Sentiment changes, stock returns and volatility: Evidence from NYSE, AMEX and NASDAQ stocks. Appl. Financ. Econ. 2012, 22, 1631–1646. [Google Scholar] [CrossRef]
- Carrion, A. Very fast money: High-frequency trading on the NASDAQ. J. Financ. Mark. 2013, 16, 680–711. [Google Scholar] [CrossRef]
- Klock, S. The January Effect: A Test of Market Efficiency; Longwood University: Farmville, VA, USA, 2014. [Google Scholar]
- Hu, Y.; Feng, B.; Zhang, X.; Ngai, E.; Liu, M. Stock trading rule discovery with an evolutionary trend following model. Expert Syst. Appl. 2015, 42, 212–222. [Google Scholar] [CrossRef]
- Kalpakis, K.; Gada, D.; Puttagunta, V. Distance measures for effective clustering of ARIMA time-series. In Proceedings of the IEEE International Conference on Data Mining (ICDM 2001), San Jose, CA, USA, 29 November–2 December 2001; pp. 273–280. [Google Scholar]
- Haldane, A.G. The race to zero. In The Global Macro Economy and Finance; Springer: New York, NY, USA, 2012; pp. 245–270. [Google Scholar]
- Nguyen, D.; Puri, T.N. Information asymmetry and accounting restatement: NYSE-AMEX and NASDAQ evidence. Rev. Quant. Financ. Account. 2014, 43, 211–244. [Google Scholar] [CrossRef]
- Duarte, F.B.; Machado, J.A.T.; Duarte, G.M. Dynamics of the Dow Jones and the NASDAQ stock indexes. Nonlinear Dyn. 2010, 61, 691–705. [Google Scholar] [CrossRef]
- Hayes, A.F.; Krippendorff, K. Answering the Call for a Standard Reliability Measure for Coding Data. Commun. Methods Meas. 2007, 1, 77–89. [Google Scholar] [CrossRef]
- Keogh, E.J.; Pazzani, M.J. An enhanced representation of time series which allows fast and accurate classification, clustering and relevance feedback. In Proceedings of the International Conference on Knowledge Discovery and Data Mining, New York, NY, USA, 27–31 August 1998; pp. 239–243. [Google Scholar]
- Buchin, K.; Buchin, M.; Gudmundsson, J.; Löffler, M.; Luo, J. Detecting Commuting Patterns by Clustering Subtrajectories. In Proceedings of the International Symposium on Algorithms and Computation, Gold Coast, Australia, 15–17 December 2008; pp. 644–655. [Google Scholar]
- Shanker, A.P.; Rajagopalan, A.N. Off-line signature verification using DTW. Pattern Recognit. Lett. 2007, 28, 1407–1414. [Google Scholar] [CrossRef]
- Muda, L.; Begam, M.; Elamvazuthi, I. Voice Recognition Algorithms using Mel Frequency Cepstral Coefficient (MFCC) and Dynamic Time Warping (DTW) Techniques. pp.1083. Ttps 2010, 2. [Google Scholar]
- Ding, H.; Trajcevski, G.; Scheuermann, P.; Wang, X.; Keogh, E. Querying and Mining of Time Series Data: Experimental Comparison of Representations and Distance Measures. Proc. VLDB Endow. 2008, 1, 1542–1552. [Google Scholar] [CrossRef]
- Berndt, D.J.; Clifford, J. Using Dynamic Time Warping to Find Patterns in Time Series. In Proceedings of the 3rd International Conference on Knowledge Discovery and Data Mining (AAAIWS’94), Seattle, WA, USA, 31 July–1 August 1994; AAAI Press: Palo Alto, CA, USA, 1994; pp. 359–370. [Google Scholar]
- Cai, Y.; Fan, W.; Fan, W.; Ji, P.; He, Q. Facets: Fast Comprehensive Mining of Coevolving High-order Time Series. In Proceedings of the ACM SIGKDD International Conference on Knowledge Discovery and Data Mining, Sydney, Australia, 10–13 August 2015; pp. 79–88. [Google Scholar]
- Barajas, K.L.C.; Akella, R. Dynamically Modeling Patient’s Health State from Electronic Medical Records: A Time Series Approach. In Proceedings of the ACM SIGKDD International Conference on Knowledge Discovery and Data Mining, Sydney, Australia, 10–13 August 2015; pp. 69–78. [Google Scholar]
- Yang, Q.; Zhang, X.; Du, X.; Bielefield, A.; Liu, Y. Current Market Demand for Core Competencies of Librarianship—A Text Mining Study of American Library Association’s Advertisements from 2009 through 2014. Appl. Sci. 2016, 6, 48. [Google Scholar] [CrossRef]


© 2018 by the authors. Licensee MDPI, Basel, Switzerland. This article is an open access article distributed under the terms and conditions of the Creative Commons Attribution (CC BY) license (http://creativecommons.org/licenses/by/4.0/).